Embed Size (px)
Citation preview

Audited Financial Statements
For The Year Ended June 30, 2016

FINANCIAL STATEMENTS
June 30, 2016 and 2015
(With Independent Auditors’ Report Thereon)

WHITTIER COLLEGE
Table of Contents
Page
MANAGEMENT’S DISCUSSION AND ANALYSIS i
INDEPENDENT AUDITORS’ REPORT 1
FINANCIAL STATEMENTS
Statements of Financial Position 3
Statements of Activities 4
Statements of Cash Flows 6
Notes to Financial Statements 7

WHITTIER COLLEGE
FINANCIAL REPORT FOR THE YEAR ENDED JUNE 30, 2016
MANAGEMENT’S DISCUSSION AND ANALYSIS
i
MANAGEMENT’S DISCUSSION AND ANALYSIS
The following discussion and analysis provides an overview of the financial position and activities of Whittier College, including
the Whittier Campus and Law School, for the fiscal year ended June 30, 2016 with comparative data for the years ended
June 30, 2015 and 2014. The information has been prepared by management, is unaudited, and should be read in conjunction
with the audited financial statements and accompanying notes, which follow this section.
INTRODUCTION
Whittier College (the College) is a national liberal arts
college in California serving about 1,650 undergraduate
students and 500 graduate students in education and law.
The undergraduate campus and graduate education are
located in Whittier, and the Law School is in Costa Mesa.
Established in 1887 by the Religious Society of Friends
(Quakers) as the Whittier Academy, the College was
chartered by the State of California in 1901. The Law
School was founded in 1966 and became an integral part
of the College in 1975.
Since its founding, the College has remained committed
to its mission of providing a liberal arts education of the
highest quality to a diverse and well-qualified student
body. The Law School extends Whittier’s educational
values to the study of law, which is the professional
discipline most closely related to the liberal arts.
With long-held values of tolerance, service, and
internationalism, the College is among the most diverse
liberal arts colleges in the nation. The enrollment of
students from underrepresented groups is over sixty
percent, and the College takes pride in its designation by
the U.S. Department of Education as a Hispanic-Serving
Institution.
The College is accredited by the Western Association of
Schools and Colleges (WASC). The Law School is
accredited by the American Bar Association (ABA) and is
a member of the Association of American Law Schools.
OVERVIEW OF FINANCIAL STATEMENTS
AND FINANCIAL ANALYSIS
The College’s financial statements include the Statement
of Financial Position, Statement of Activities, Statement
of Cash Flows, and accompanying Notes to Financial
Statements. These financial statements are the
responsibility of management and have been prepared in
conformity with U.S. Generally Accepted Accounting
Principles (GAAP) and in accordance with the
pronouncements of the Financial Accounting Standards
Board (FASB), which establishes standards for reporting
for not-for-profit colleges. The financial statements focus
on the financial position of the College and the changes in
net assets and cash flows. The Notes to Financial
Statements describe the College’s significant financial
policies and provide additional disclosures to the financial
statements.
STATEMENT OF FINANCIAL POSITION
The Statement of Financial Position presents the financial
position of the College as of the end of the fiscal year
(June 30), including assets, liabilities, and net assets.
From the data presented, readers of the Statement of
Financial Position have the information to determine the
assets and net assets available to continue the operations
of the College. Readers may also be able to determine the
amounts owed to vendors, lending institutions, and others.
The College reports its net assets in three categories in
accordance with GAAP:
Unrestricted net assets are expendable funds not subject
to donor restrictions.
Temporarily restricted net assets consist of contributed
funds subject to specific donor-imposed time or
purpose restrictions and earnings on endowment funds
that have not yet been appropriated.
Permanently restricted net assets are subject to donor
restrictions requiring that the funds be maintained in
perpetuity, usually for the purpose of generating
investment income to fund operations.

WHITTIER COLLEGE
FINANCIAL REPORT FOR THE YEAR ENDED JUNE 30, 2016
MANAGEMENT’S DISCUSSION AND ANALYSIS, continued
ii
A comparison of the College’s financial position as of
June 30, 2016, 2015, and 2014 is as follows:
($ in millions) 2016 2015 2014
Assets $308.5 $287.0 $277.1
Liabilities $103.1 $78.2 $72.6
Net assets:
Unrestricted:
Plant equity and other $104.1 $100.9 $90.6
Board-designated
endowment 14.4 17.4 17.6
Temporarily restricted:
Other expendable 6.4 6.2 9.6
Endowment 11.2 15.3 19.5
Permanently restricted:
Revolving student loans
and other 4.3 4.4 4.4
Endowment 65.0 64.6 62.8
Total net assets $205.4 208.8 $204.5
Assets and Liabilities
The College’s assets increased by $21.5 million, or 7.5%
in fiscal 2016. The majority of this increase was in
additions to plant facilities from the construction upgrade
of the College’s largest academic building into a Science
and Learning Center. This increase was partially offset
by net market losses on the College’s investment
portfolio. Approximately 44% of the College’s assets are
short and long-term investments, which are recorded at
fair value and are subject to ongoing market fluctuations.
The College’s liabilities increased by $24.9 million. This
increase was primarily from draws of $20.7 million on a
long-term debt facility to finance the Science and
Learning Center project. Accounts payable and accrued
liabilities increased by $3.0 million from year end
accruals on this project and employee severance contracts.
The College’s liability on swap contracts increased by
$2.5 million due to a decline in U.S. Treasury Bond
interest rates. Other liabilities were generally comparable
between years.
The College has $74.1 million in outstanding variable rate
and fixed rate notes payable which comprise nearly all of
the long-term debt liability. The notes are with First
Republic Bank and are secured by the College’s real
property. The variable and fixed rate notes outstanding at
June 30, 2016 total $47.5 million and $26.6 million,
respectively. The College may borrow up to $40 million
in total on the fixed rate note by October 2016 consistent
with the completion of the Science and Learning Center
project, which will open for the fall semester of 2016
(fiscal 2017). Information on this long-term debt is
disclosed in Note 8 of the Notes to Financial Statements.
The College hedges its interest rate risk and annual debt
service expense on $44.4 million of the variable rate notes
with two swap contracts. The College is subject to
counterparty risk with the swap providers. The blended
annual interest rate paid to the swap counterparties totals
3.26% in exchange for payments received based on 67%
of the one-month London Interbank Offered Rate. The
fair value of the swap contracts is largely based on U.S.
Treasury Bond interest rates, which at June 30, 2016,
were lower than at June 30, 2015.

WHITTIER COLLEGE
FINANCIAL REPORT FOR THE YEAR ENDED JUNE 30, 2016
MANAGEMENT’S DISCUSSION AND ANALYSIS, continued
iii
Net Assets
Plant equity and other expendable net assets increased by
$3.4 million in fiscal 2016 from 2015. This increase was
caused primarily by donor non-operating contributions to
the Science and Learning Center project.
Expendable endowment which consists of Board
designated endowment and temporarily restricted,
cumulative net gains on investments decreased by
$7.1 million in fiscal 2016 from 2015. This decrease was
due to lower market performance of investments, as
compared to fiscal 2015, combined with the impact of
endowment spending.
Permanently restricted net assets increased by
$0.3 million in fiscal 2016 from additions to endowment
in the forms of gifts which were partially offset by
investment market losses and actuarial adjustments.
The ratio of expendable financial resources to operations
as defined by Moody’s measures the strength of net
assets. This ratio, illustrated in the following chart, shows
that the College had enough expendable resources from
various sources to fund operations for a period of
approximately eleven months in fiscal 2016. This ratio
decreased from prior years from lower expendable net
assets caused by market losses on investments and the use
of equity to complete plant facilities projects, combined
with higher operating expenses.
A key ratio measuring expendable financial resources to
long-term debt, as defined by Moody’s, shows, in the
following chart, the College’s ability to retire its entire
debt obligation. This ratio decreased from 2015 due to
lower expendable net assets caused by market losses on
investments and the use of equity to complete plant
facilities projects, combined with higher long-term debt.
Net Assets – Endowment
The College maintains an endowment with net assets
totaling $90.7 million at June 30, 2016. Additions to the
endowment are typically invested in a managed pool of
diversified investment vehicles. A portion of the annual
total return on the investments provides critical support to
operations. The endowment fair values by area of support
are presented in the chart above. Endowment net assets
are classified among permanently restricted, temporarily
restricted, and unrestricted net assets. Permanently
restricted endowment net assets are contributions that the
College must maintain in perpetuity by donor stipulation.
Temporarily restricted endowment net assets include
cumulative total returns on permanent endowment
investments that have not yet been allocated to operations.
Unrestricted endowment net assets include funds
allocated by the Board of Trustees to function like
endowment.

WHITTIER COLLEGE
FINANCIAL REPORT FOR THE YEAR ENDED JUNE 30, 2016
MANAGEMENT’S DISCUSSION AND ANALYSIS, continued
iv
The annual endowment total return used to fund operations
is determined by applying a percentage spending rate to a
historical average carrying value of endowment
investments. The spending rate, which was 5% in fiscal
2016, is set by the Board of Trustees and is designed to
provide a consistent annual income stream yet maintain the
purchasing power of endowment investments against the
impact of inflation. The total return used for operations
consists of actual investment income (yield) and gains to the
extent that the calculated spending amount exceeds income.
The endowment carrying value in fiscal 2016 declined
from fiscal 2015 from lower market returns. Annual
financial support to operations increased in fiscal 2016
from higher historical market values used in the spending
calculation.
STATEMENT OF ACTIVITIES
The Statement of Activities presents the College’s results
of operations and non-operating activities that change net
assets (or equity) for the year. Revenues and expenses are
classified as either operating or non-operating in
accordance with GAAP. A condensed comparison of the
College’s revenues, expenses, and other changes in net
assets for the years ended June 30, 2016, 2015, and 2014
is as follows:
($ in millions) 2016 2015 2014
Operating revenues $76.7 $77.5 $80.1
Operating expenses 76.7 74.8 71.6
Operating income 0.0 2.7 8.5
Non-operating activities (3.4) 1.6 17.0
Beginning net assets 208.8 204.5 179.0
Ending net assets $205.4 $208.8 $204.5
Statement of Activities – Operating Issues
The following table summarizes revenues for the years
ended June 30, 2016, 2015, and 2014.
($ in millions) 2016 2015 2014
Net tuition and fees $54.3 $55.6 $56.7
Gifts, grants, and pledges 7.8 6.2 6.6
Investment income 2.3 2.6 3.0
Auxiliary enterprises 10.6 10.8 11.5
Other 1.7 2.3 2.3
Total revenue $76.7 $77.5 $80.1
For the year ended June 30, 2016, net tuition and fees, and
sales from auxiliary enterprises represent student revenues,
which provided 85% of total revenues. Gifts, grants, and
pledges contributed approximately 10%, with investment
income and other sources contributing approximately 5%.
Net tuition and fee revenues are the result of tuition pricing,
enrollment, and the amount and rate of student aid awarded.
The tuition prices at the Whittier Campus and Law School
are based on costs to provide a high-quality education and
on rates at competitive institutions.
Enrollment at the Whittier Campus has generally remained
stable since 2014. Law School enrollment has declined
since 2014. This decline is consistent with law school
trends nationally and largely reflects the continuing outlook
for industry employment. The following chart displays
comparative enrollment at both campuses:

WHITTIER COLLEGE
FINANCIAL REPORT FOR THE YEAR ENDED JUNE 30, 2016
MANAGEMENT’S DISCUSSION AND ANALYSIS, continued
v
Net tuition revenue at the Whittier Campus in fiscal 2016
declined slightly from fiscal 2015 as shown in the following
chart. An increase in the student aid rate more than offset
an increase in gross tuition revenues.
Net tuition revenue at the Law School has declined each
year since fiscal 2014. The decline in law school
enrollments, nationally, and increased competition for
students drove an increase in the student aid rate, as a
percent of gross tuition, in fiscal 2016 and 2015 over
fiscal 2014 to attract the most qualified students.
Donor contributions and grants are a key revenue source for
the College. Gifts and government grants totaling $7.8
million in fiscal 2016 increased by $1.6 million from
2015. This increase was driven by growth in gifts from
individuals and foundations.
Expenses are reported by program function. Each program
function includes all direct operating costs for the services
provided plus an allocated portion of expenses for plant
facilities operations, depreciation, and debt interest costs.
A comparative table of the College’s expenses by functional
category is as follows:
($ in millions) 2016 2015 2014
Instruction $32.3 30.4 $27.1
Sponsored programs 1.5 1.5 1.3
Academic support 6.5 6.5 6.3
Student services 14.0 14.0 13.4
Institutional support 12.7 12.7 13.7
Auxiliary enterprises 9.7 9.7 9.8
Total expenses $76.7 74.8 $71.6
Total expenses increased by $1.9 million, or 2.5%, in fiscal
2016 from 2015. This increase was driven primarily by
compensation adjustments at the Whittier Campus and one-
time severance expenses incurred for personnel reductions
at the Law School. These increases were mitigated by
slightly lower other operating expenses as compared to
fiscal 2015.
In fiscal 2016, approximately 52 cents of every dollar spent
was spent directly on instruction, research, and academic
support (including libraries and academic computing);
18 cents on student services (including athletics); 17 cents
on institutional support (including administration,
advancement, and business expenses); and 13 cents on
auxiliary enterprises.
Measures of private colleges’ and universities’ operating
results typically focus on the change in unrestricted net
assets from operating activities excluding net assets
released for capital projects. This measure for the College
is summarized as follows:
($ in millions) 2015 2014 2013
Change in unrestricted net assets
from operating activities $0.7 2.7 $9.9
The College’s adjusted net operating revenues in fiscal
2016 decreased by $2.0 million from 2015. Student
revenues at the Whittier Campus in fiscal 2016 were
consistent with 2015 as rate increases in student charges
were offset by slightly lower enrollment and higher
student aid compared with 2015. Law School student

WHITTIER COLLEGE
FINANCIAL REPORT FOR THE YEAR ENDED JUNE 30, 2016
MANAGEMENT’S DISCUSSION AND ANALYSIS, continued
vi
revenues declined from lower enrollment. As described
above, expenses were higher in compensation and
severance costs which were partially offset by lower other
operating expenses.
Statement of Activities – Non-operating Issues
The College had a $3.4 million decrease in net assets
from non-operating activities during fiscal 2016. The
decrease was primarily from market losses on the
endowment investment portfolio and swap contracts
which were only partially offset by non-operating donor
contributions to the Science and Learning Center renewal
project. The College’s market losses on the managed
endowment investment pool were 3.9% for fiscal 2016.
STATEMENT OF CASH FLOWS
The Statement of Cash Flows presents detailed
information about the cash activity of the College during
the fiscal year. The statement is divided into three
sections. The first section derives operating cash flows.
The second section reconciles cash flows from investment
and capital plant activities. The third section derives cash
flows from external financing and permanently restricted
contributions. A condensed version of the three cash flow
sections is provided below:
($ in millions) 2016 2015 2014
Operating $8.3 7.0 $12.1
Investing (35.1) (10.9) (16.3)
Financing 23.0 9.1 4.5
Cash and cash equivalents
Beginning of year 21.6 16.4 16.1
End of year $17.8 21.6 $16.4
Cash flows from operations in fiscal 2016 were generally
consistent with 2015 results. Cash flows used in investing
activities were the result of the timing of investment
purchases. Cash flows from financing activities consist of
contributions for long-term purposes and draws on the
debt facility secured in 2015 to construct the Science and
Learning Center.
ECONOMIC FACTORS EXPECTED TO
AFFECT THE FUTURE
Funds supporting the College’s operations are primarily
from student revenues. Management believes that tuition
pricing at the Whittier Campus and Law School are
favorable as compared to peer institutions.
The Whittier Campus and Law School are located in
southern California, a geographically desirable area. The
College draws approximately 90% of its students from the
western region of the United States. Industry resources
project that the numbers of high school graduates in the
western region of the U.S. will continue to increase over
the intermediate term. The College believes that
undergraduate enrollment will remain stable over the
coming years.
Enrollment at the Law School has declined by 35% in
2016 from its recent peak in fiscal 2013. Law school
enrollments, nationally, have been on a declining trend,
consistent with the employment outlook in the legal
profession. The enrollment outlook at the Law School is
uncertain. The College has taken actions in fiscal 2016 to
downsize the Law School and reduce expenses in
personnel and operations yet maintain the quality of the
program. The College will continue to monitor and adjust
to industry and regulatory trends.
Student revenues provide over 80% of total annual
revenues. This category includes tuition, net of student
aid, housing, meal contracts, and fees. Approximately
17% of net tuition revenues at the Whittier Campus are
funded by state and federal grant aid programs to
students. These programs remain at some degree of risk
for reductions in funding which may impact the
affordability of tuition for certain students. Material
reductions in one or both of these programs may require
the College to increase its rate of student aid.
The College relies on philanthropy to supplement student
and other revenues in the support of operations. Gifts and
grants currently provide approximately 11% of total
revenues. The College has continued to experience
consistent participation from its donors. Future, negative
economic conditions may impact the overall amount of
contributions.
The College’s income from endowment investments is
based on investment carrying values. The College
maintains a diversified portfolio of investments designed
to reduce volatility and provide consistent investment
returns over long-term horizons. Prolonged periods of
reduced valuations may negatively impact the amount of
investment returns for operations.

KPMG LLPSuite 70020 PacificaIrvine, CA 92618-3391
KPMG LLP is a Delaware limited liability partnership, the U.S. member firm of KPMG International Cooperative (“KPMG International”), a Swiss entity.
1
Independent Auditors’ Report
The Board of Trustees
Whittier College:
Report on the Financial Statements
We have audited the accompanying financial statements of Whittier College (the College), as of and for the years ended
June 30, 2016 and 2015, and the related notes to the financial statements, which collectively comprise the College’s
basic financial statements as listed in the table of contents.
Management’s Responsibility for the Financial Statements
Management is responsible for the preparation and fair presentation of these financial statements in accordance with
U.S. generally accepted accounting principles; this includes the design, implementation, and maintenance of internal
control relevant to the preparation and fair presentation of financial statements that are free from material misstatement,
whether due to fraud or error.
Auditors’ Responsibility
Our responsibility is to express an opinion on these financial statements based on our audits. We conducted our audits
in accordance with auditing standards generally accepted in the United States of America and the standards applicable
to financial audits contained in Government Auditing Standards, issued by the Comptroller General of the United States.
Those standards require that we plan and perform the audit to obtain reasonable assurance about whether the financial
statements are free from material misstatement.
An audit involves performing procedures to obtain audit evidence about the amounts and disclosures in the financial
statements. The procedures selected depend on the auditors’ judgment, including the assessment of the risks of material
misstatement of the financial statements, whether due to fraud or error. In making those risk assessments, the auditor
considers internal control relevant to the entity’s preparation and fair presentation of the financial statements in order
to design audit procedures that are appropriate in the circumstances, but not for the purpose of expressing an opinion
on the effectiveness of the entity’s internal control. Accordingly, we express no such opinion. An audit also includes
evaluating the appropriateness of accounting policies used and the reasonableness of significant accounting estimates
made by management, as well as evaluating the overall presentation of the financial statements.
We believe that the audit evidence we have obtained is sufficient and appropriate to provide a basis for our audit opinion.
Opinion
In our opinion, the financial statements referred to above present fairly, in all material respects, the financial position
of Whittier College as of June 30, 2016 and 2015, and the changes in its financial position and its cash flows for the
years then ended in accordance with U.S. generally accepted accounting principles.
Other Matter
Our audit was conducted for the purpose of forming an opinion on the financial statements as a whole. The
accompanying management’s discussion and analysis on pages i-vi and the list of the board of trustees and officers of
the College on page 25 are not a required part of the financial statements. Such information has not been subjected to
the auditing procedures applied in the audit of the financial statements, and accordingly, we do not express an opinion
or provide any assurance on them.

2
Other Reporting Required by Government Auditing Standards
In accordance with Government Auditing Standards, we have also issued our report dated November 14, 2016 on our
consideration of the College’s internal control over financial reporting and on our tests of its compliance with certain
provisions of laws, regulations, contracts, and grant agreements and other matters. The purpose of that report is to
describe the scope of our testing of internal control over financial reporting and compliance and the results of that
testing, and not to provide an opinion on internal control over financial reporting or on compliance. That report is an
integral part of an audit performed in accordance with Government Auditing Standards in considering the College’s
internal control over financial reporting and compliance.
Irvine, California
November 14, 2016
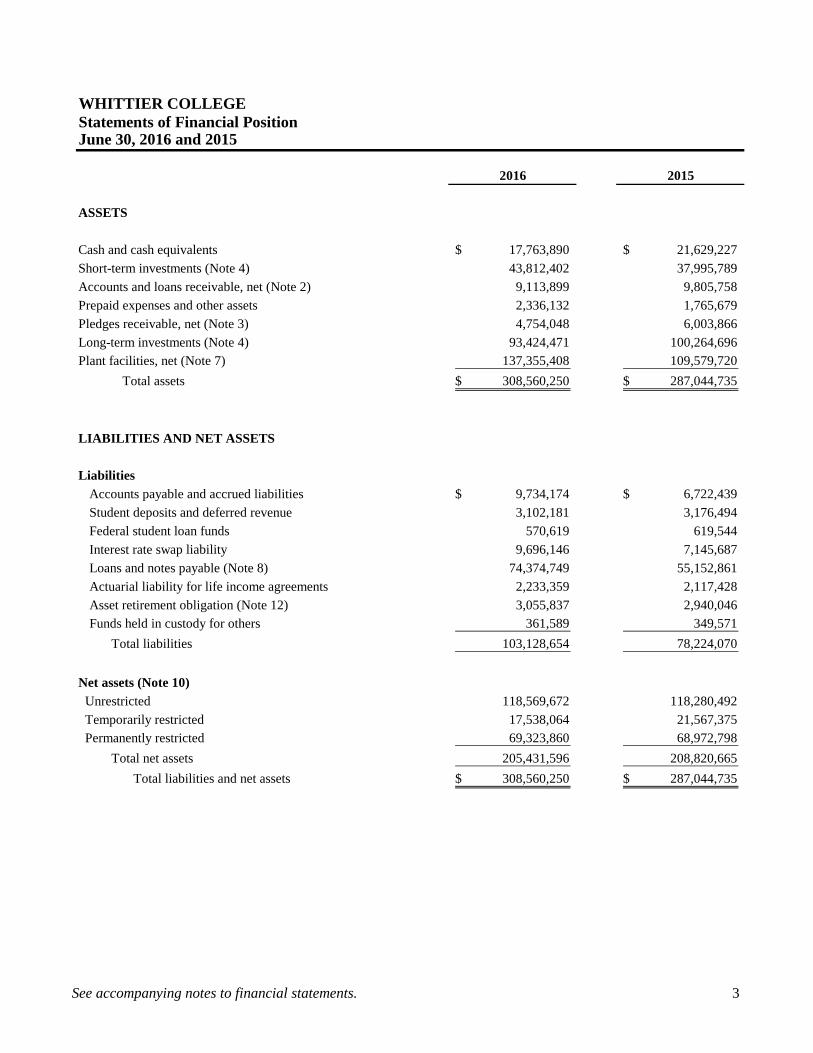
See accompanying notes to financial statements. 3
June 30, 2016 and 2015
2016 2015
ASSETS
Cash and cash equivalents 17,763,890$ 21,629,227$ Short-term investments (Note 4) 43,812,402 37,995,789 Accounts and loans receivable, net (Note 2) 9,113,899 9,805,758 Prepaid expenses and other assets 2,336,132 1,765,679 Pledges receivable, net (Note 3) 4,754,048 6,003,866 Long-term investments (Note 4) 93,424,471 100,264,696 Plant facilities, net (Note 7) 137,355,408 109,579,720
Total assets 308,560,250$ 287,044,735$
LIABILITIES AND NET ASSETS
Liabilities Accounts payable and accrued liabilities 9,734,174$ 6,722,439$ Student deposits and deferred revenue 3,102,181 3,176,494 Federal student loan funds 570,619 619,544 Interest rate swap liability 9,696,146 7,145,687 Loans and notes payable (Note 8) 74,374,749 55,152,861 Actuarial liability for life income agreements 2,233,359 2,117,428 Asset retirement obligation (Note 12) 3,055,837 2,940,046 Funds held in custody for others 361,589 349,571
Total liabilities 103,128,654 78,224,070
Net assets (Note 10) Unrestricted 118,569,672 118,280,492 Temporarily restricted 17,538,064 21,567,375 Permanently restricted 69,323,860 68,972,798
Total net assets 205,431,596 208,820,665 Total liabilities and net assets 308,560,250$ 287,044,735$
WHITTIER COLLEGEStatements of Financial Position

See accompanying notes to financial statements. 4
Year Ended June 30, 2016
Temporarily PermanentlyUnrestricted Restricted Restricted Total
Revenues and other supportStudent tuition and fees $ 92,748,958 —$ —$ $ 92,748,958 Less student aid (38,498,492) — — (38,498,492)
Net student tuition and fees 54,250,466 — — 54,250,466
Private gifts, grants, and pledges 3,123,479 2,607,109 766,277 6,496,865 Government grants 1,304,558 — — 1,304,558 Investment income 1,349,867 995,127 — 2,344,994 Auxiliary enterprises 10,655,093 — — 10,655,093 Other 1,684,079 — — 1,684,079
72,367,542 3,602,236 766,277 76,736,055 Net assets released from restrictions:
Endowment returns designated for spending 3,604,907 (3,604,907) — — Satisfaction of donor restrictions 1,434,900 (1,434,900) — —
Total revenues and other support 77,407,349 (1,437,571) 766,277 76,736,055
ExpensesInstruction 32,321,476 — — 32,321,476 Sponsored programs, projects, and research 1,505,126 — — 1,505,126 Academic support 6,462,786 — — 6,462,786 Student services 13,958,834 — — 13,958,834 Institutional support 12,738,713 — — 12,738,713 Auxiliary enterprises 9,695,997 — — 9,695,997
Total expenses 76,682,932 — — 76,682,932
Increase (decrease) in net assets from operating activities 724,417 (1,437,571) 766,277 53,123
Nonoperating activitiesNet realized and unrealized gains (losses) on investments (2,641,984) (1,688,743) 516,274 (3,814,453)Net change in actuarial liability for life income agreements — (221,054) (37,102) (258,156)Contributions — 3,180,876 — 3,180,876 Unrealized losses on interest rate swap liability (2,550,459) — — (2,550,459)Other 894,387 — (894,387) — Satisfaction of program restrictions 3,862,819 (3,862,819) — —
Decrease in net assets from nonoperating activities (435,237) (2,591,740) (415,215) (3,442,192)
Change in net assets 289,180 (4,029,311) 351,062 (3,389,069)
Net assets Beginning of year 118,280,492 21,567,375 68,972,798 208,820,665
End of year 118,569,672$ 17,538,064$ 69,323,860$ 205,431,596$
WHITTIER COLLEGEStatement of Activities

See accompanying notes to financial statements. 5
Year Ended June 30, 2015
Temporarily PermanentlyUnrestricted Restricted Restricted Total
Revenues and other supportStudent tuition and fees $ 92,872,276 —$ —$ $ 92,872,276 Less student aid (37,237,262) — — (37,237,262)
Net student tuition and fees 55,635,014 — — 55,635,014
Private gifts, grants, and pledges 2,873,551 1,147,218 1,064,134 5,084,903 Government grants 1,097,858 — — 1,097,858 Investment income 1,368,594 1,160,691 82,941 2,612,226 Auxiliary enterprises 10,750,229 — — 10,750,229 Other 2,335,718 — — 2,335,718
74,060,964 2,307,909 1,147,075 77,515,948 Net assets released from restrictions:
Endowment returns designated for spending 3,257,196 (3,257,196) — — Satisfaction of donor restrictions 252,294 (881,580) 629,286 —
Total revenues and other support 77,570,454 (1,830,867) 1,776,361 77,515,948
ExpensesInstruction 30,421,680 — — 30,421,680 Sponsored programs, projects, and research 1,463,189 — — 1,463,189 Academic support 6,469,730 — — 6,469,730 Student services 14,041,280 — — 14,041,280 Institutional support 12,734,206 — — 12,734,206 Auxiliary enterprises 9,719,414 — — 9,719,414
Total expenses 74,849,499 — — 74,849,499
Increase (decrease) in net assets from operating activities 2,720,955 (1,830,867) 1,776,361 2,666,449
Nonoperating activitiesNet realized and unrealized gains (losses) on investments (634,504) (2,229,574) 135,361 (2,728,717)Net change in actuarial liability for life income agreements — (174,385) (137,158) (311,543)Contributions — 5,124,556 — 5,124,556 Unrealized losses on interest rate swap agreement (411,388) — — (411,388)Other 293,019 (293,019) — — Satisfaction of program restrictions 8,166,227 (8,166,227) — —
Increase (decrease) in net assets from nonoperating activities 7,413,354 (5,738,649) (1,797) 1,672,908
Change in net assets 10,134,309 (7,569,516) 1,774,564 4,339,357
Net assets Beginning of year 108,146,183 29,136,891 67,198,234 204,481,308
End of year 118,280,492$ 21,567,375$ 68,972,798$ 208,820,665$
WHITTIER COLLEGEStatement of Activities

See accompanying notes to financial statements. 6
WHITTIER COLLEGEStatements of Cash Flows
2016 2015Cash flows from operating activities
Change in net assets (3,389,069)$ 4,339,357$ Adjustments to reconcile change in net assets to net
cash provided by operating activities:Depreciation expense 5,543,741 5,278,952 Unrealized losses on interest rate swap liability 2,550,459 411,388 Net realized and unrealized loss on investments 3,814,453 2,728,717 Contributions restricted for long-term investments (3,947,153) (6,188,690) Accretion of asset retirement obligation 115,791 41,423 Net change in actuarial liability for life income agreements 258,156 311,543 Changes in operating assets and liabilities:
(Increase) decrease in accounts and loans receivable (239,279) 697,435 Decrease (increase) in pledges receivable 1,249,818 (2,949,381) (Increase) decrease in prepaid expenses and other assets (570,453) 973,203 Increase in accounts payable and accrued liabilities 3,011,735 510,030 (Decrease) increase in student deposits and deferred revenues (74,313) 841,072
Net cash provided by operating activities 8,323,886 6,995,049
Cash flows from investing activitiesPurchase of plant facilities (33,319,429) (12,476,338) Proceeds from student loan collections 1,652,664 1,535,772 Student loans issued (611,629) (714,551) Purchases of investments (22,105,943) (52,127,616) Proceeds from sales of investments 19,205,205 52,925,712
Net cash used in investing activities (35,179,132) (10,857,021)
Cash flows from financing activitiesProceeds from contributions restricted for long-term investments 3,947,153 6,188,690 Proceeds from drawdown on loan 21,365,988 57,140,563 Payment on loans and notes payable (2,144,100) (53,466,300) Payment on cost of debt issuance — (618,429) Payments to beneficiaries on life income agreements (142,225) (232,204) Funds held in custody for others, net 12,018 52,381 Federal student loan funds, net (48,925) 1,525
Net cash provided by financing activities 22,989,909 9,066,226
Net (decrease) increase in cash and cash equivalents (3,865,337) 5,204,254
Cash and cash equivalentsBeginning of year 21,629,227 16,424,973
End of year 17,763,890$ 21,629,227$
Supplemental disclosure of cash flow information:Cash paid during the year for interest, net of amounts capitalized of
$742,082 and $344,684 for 2016 and 2015, respectively 2,595,230$ 2,101,406$
Years Ended June 30, 2016 and 2015

WHITTIER COLLEGE
Notes to Financial Statements
Years Ended June 30, 2016 and 2015
7
Note 1 – Description of Organization and Summary of Significant Accounting Policies
Description of Organization – Whittier College (the College) was founded in 1887 and is an accredited four year, private
coeducational, and nationally recognized liberal arts institution. The College offers undergraduate and selected advanced
degrees in education and law. The College derives most of its revenues from tuition and student fees, earnings from its
endowments, and gifts from individuals, corporations, and foundations. The following accounting policies of the College are in
accordance with U.S. Generally Accepted Accounting Principles (U.S. GAAP) and those generally accepted for colleges and
universities.
Basis of Presentation – The financial statements of the College have been prepared on the accrual basis of accounting.
Financial Statement Presentation – Revenue, gains, and losses are classified as unrestricted, temporarily restricted, and
permanently restricted as follows:
Unrestricted net assets represent expendable funds available for operations, which are not otherwise limited by donor
restrictions.
Temporarily restricted net assets consist of contributed funds subject to specific donor-imposed restrictions, contingent upon
specific performance of a future event or a specific passage of time before the College may spend the funds, and earnings on
endowment funds that have not yet been appropriated.
Permanently restricted net assets are subject to donor restrictions requiring that the assets be maintained in perpetuity. The
investment income generated from these assets is temporarily restricted by law until appropriated by the Board of Trustees in
support of the College’s programs and operations.
Revenue Recognition – Student tuition and fees are recorded as revenue in the period during which the academic services are
rendered. Student tuition and fees received in advance of services to be rendered are recorded as deferred revenue.
Gifts from donors, including pledges receivable (unconditional promises to give), are recognized as revenue in the period
received and are reported as increases in the appropriate category of net assets. Gifts where donor restrictions are met within the
same fiscal year as the gifts are received are included in unrestricted net assets. Gifts of assets other than cash are recorded at
their estimated fair value. Conditional promises to give are not recognized until they become unconditional, that is, when the
conditions on which they depend are substantially met.
Government grant revenue is recorded as the related expenses are incurred and administrative fees are earned.
Investment returns, including investment income and gains and losses, are recorded on a trade-date basis and reported as
increases or decreases in unrestricted and temporarily restricted net assets unless their use is restricted by explicit donor
stipulation or law.
Auxiliary enterprises consist of room and board, bookstore commissions, and conferences fees and are recorded as revenue
when the services are provided.
Cash and Cash Equivalents – The College considers all highly liquid investments with an original maturity of three months or
less when purchased to be cash equivalents, except for those that have been designated by the College as endowments, which
are considered to be long-term investments.
Fair Value Determination of Financial Instruments – The fair value of the College’s financial instruments as of June 30, 2016
and 2015, represents management’s best estimates of the amounts that would be received to sell those assets in an orderly
transaction between market participants at that date. Those fair value measurements maximize the use of observable inputs.
However, in situations where there are little, if any, observable inputs, management’s own judgments about the assumptions of
market participants were used in pricing the asset. Those judgments are developed by management based on the best information
available in the circumstances. Although the College uses its best judgment in determining the fair value of financial
instruments, there are inherent limitations in any methodology.

WHITTIER COLLEGE
Notes to Financial Statements
Years Ended June 30, 2016 and 2015
8
Note 1 – Description of Organization and Summary of Significant Accounting Policies (continued)
Therefore, the values presented herein are not necessarily indicative of the amount the College could realize in a current
transaction. Future confirming events could affect the estimates of fair value and could be material to the financial
statements. These events could also affect the amount realized upon liquidation of the investments.
The College did not elect fair value accounting for any asset or liability that is not currently required to be measured at fair
value.
The College’s fair value hierarchy prioritizes the inputs to valuation techniques used to measure fair value. The hierarchy
gives the highest priority to unadjusted quoted prices in active markets for identical assets (Level I measurements) and the
lowest priority measurements involving significant unobservable inputs (Level III measurements). The three levels of the fair
value hierarchy are as follows:
Level I inputs are quoted prices (unadjusted) in active markets for identical assets that the College has the ability to
access at the measurement date.
Level II inputs are inputs other than quoted prices included within Level I that are observable for the asset, either directly
or indirectly, such as quoted prices for similar assets or liabilities, quoted prices in markets that are not active, or other
observable inputs that can be corroborated by observable market data. Level II includes government and corporate bonds
due to variations in the pricing of such securities from various factors, including current interest rates, spreads, and various
trade activity that impact the quoted prices for such holdings.
Level III inputs are unobservable inputs that are supported by little or no market activity and that are significant to the
fair value of the asset.
The level in the fair value hierarchy within a fair value measurement in its entirety falls on the lowest-level input that is
significant to the fair value measurement in its entirety. The College applies the authoritative guidance contained in Financial
Accounting Standards Board (FASB) Accounting Standards Codification (ASC) 820-10, Fair Value Measurement, for
estimating the fair value of investments in investment funds that have calculated Net Asset Value (NAV) per share.
According to the guidance, in circumstances in which NAV per share of an investment is not determinative of fair value,
a reporting entity is permitted to estimate the fair value of an investment in an investment fund using the NAV per share of
the investment (or its equivalent) without further adjustment, if the NAV per share of the investment is determined in
accordance with FASB ASC 946-10 as of the reporting entity’s measurement date. Accordingly, the College uses the NAV as
reported by the investment managers as a practical expedient, to determine the fair value of investments in investment funds,
which (a) do not have a readily determinable fair value and (b) either have the attributes of an investment fund or prepare their
financial statements consistent with the measurement principles of an investment fund. At June 30, 2016 and 2015, the fair value
of all such investments in investment funds has been determined by using NAV as a practical expedient.
Fair value of the College’s financial instruments is determined using the estimates, methods, and assumption as set forth
below. See note 5 for further information regarding fair value disclosures for investments.
i) Accounts and Loans Receivable, Accounts Payable, and Accrued liabilities
Reported amounts approximated fair value at June 30, 2016 and 2015, because of the terms and relatively short maturities of
these financial instruments.
ii) Pledges Receivable
Pledges receivable are recognized initially at fair value as contributions revenue in the period such promises are made by
donors. Fair value is estimated giving considerations to anticipated future cash receipts (after allowance is made for
uncollectible pledges) and discounting such amounts at a fair value rate commensurate with the duration of the donor’s
payment plan. These inputs to the fair value estimate are considered Level III in the fair value hierarchy. In subsequent
periods, the discount rate is unchanged and the allowance for uncollectible contributions is reassessed and adjusted if
necessary.

WHITTIER COLLEGE
Notes to Financial Statements
Years Ended June 30, 2016 and 2015
9
Note 1 – Description of Organization and Summary of Significant Accounting Policies (continued)
iii) Interest Rate Swap Liability
Fair value is estimated based on pricing models that utilize significant observable inputs, such as relevant interest rates, that
reflect assumptions market participants would use in pricing the instruments. These inputs fall within Level II of the fair
value hierarchy.
iv) Loans and Notes Payable
The valuation techniques and the inputs of loans and notes payable are based on observable interest rates and maturity
schedules that fall within Level II of the hierarchy of fair value inputs. Fair value of loans and note payable approximated the
reported value at June 30, 2016 and 2015.
v) Actuarial Liability for Life Income Agreements
The reported amount of the actuarial liability for life income agreements approximates fair value because these instruments are
recorded at the estimated net present value of future cash flows. The estimated fair value, however, involves unobservable
inputs considered to be Level III in the fair value hierarchy.
Allocation of Investment Returns – The College follows an investment policy for its pooled investments, which anticipates a
greater long-term return through investing for capital appreciation and accepts lower current yields from dividends and
interest. In order to offset the effect of lower current yields for current operations, the Board of Trustees has adopted a
spending policy for pooled endowment investments whereby the amount of investment return available for current operations is
determined by applying a specified percentage of 5.0% to the average market value of pooled investments for the three
preceding calendar years. If the investment income of pooled investments, which includes interest and dividends, and
accumulated realized and unrealized gains and losses, is insufficient to provide the full amount of investment return
authorized for spending, no amounts are allocated to current operations. Only such investment gains, which, when added to
ordinary investment income, amount to the approved spending for the year, are included in operating activities. Any
additional investment gains over and above the approved spending amounts are shown as nonoperating activities.
Plant Facilities – Property, plant, and equipment are stated at cost or estimated fair value at the date of the gift. Depreciation
is computed on a straight-line basis over the estimated useful lives of the assets (25 to 40 years for buildings and improvements
and 5 to 7 years for equipment and library books). Expenditures for repairs and maintenance not extending the life of
the assets are charged to operations when incurred. Upon sale or disposal of equipment, the cost and accumulated depreciation
are removed from the respective accounts, and any gain or loss is included in the statement of activities.
Asset Retirement Obligation – The College accrues for costs related to legal obligations to perform certain activities in
connection with the retirement, disposal, or abandonment of assets. The obligation to perform the asset retirement activity is
not conditional even though the timing or method may be conditional. The College identified future asbestos abatement
activities as a conditional asset retirement obligation. Asbestos abatement activities were estimated based upon historical
removal costs per square foot applied to assets identified requiring asbestos abatement. The College recorded the estimate as a
liability and as an increase to the recorded historical cost of the asset. The capitalized portion is depreciated over the
remaining useful life of the asset. The present value of the asset retirement obligation totaled $3,055,837 and $2,940,046
utilizing rates of 1 . 0 0 % and 1.74% as of June 30, 2016 and 2015, respectively. The costs will continue to be accreted to
expense until such point that the remediation activities are required.
Interest Rate Swap Agreement – The College uses an interest rate risk-management strategy that incorporates the use of
derivative instruments intended to minimize significant fluctuations in interest expense that are caused by interest rate
volatility. Interest rate swaps involve the exchange of fixed and variable rate interest payments between two parties, based on
a common notional principal amount and maturity date. All derivative instruments are recognized in the statement of financial
position at their fair values and changes in fair value are recognized in the statements of activities.
Federal Student Loan Funds – Funds provided by the U.S. government under the Federal Perkins Student Loan program are
loaned to qualified students and may be reloaned after collection. These funds are ultimately refundable to the U.S.
government.

WHITTIER COLLEGE
Notes to Financial Statements
Years Ended June 30, 2016 and 2015
10
Note 1 – Description of Organization and Summary of Significant Accounting Policies (continued)
Fund-Raising Expense – The accompanying statements of activities include fund-raising expenses of $2,523,794 and
$2,521,793, for the years ended June 30, 2016 and 2015, respectively, as a component of institutional support.
Actuarial Liability for Life Income Agreements – The actuarial liability for life income agreements includes gift annuities,
unitrusts, pooled income funds, and life estates that are based on the present value of future payments, discounted at a rate that
is commensurate with the risks involved ranging from 4.5% to 6.0% for the years ended June 30, 2016 and June 30, 2015
and the 2012 Group Annuity Tables.
Funds Held in Custody for Others – Funds held in custody for others total $361,589 and $349,571 at June 30, 2016 and
2015, respectively. These amounts represent money’s held for organizations and social clubs on campus.
Functional Allocation of Expenses – The cost of providing programs and other activities has been summarized on a
functional basis in the statements of activities. Accordingly, certain costs have been allocated among the programs and
supporting services benefited.
Concentration of Credit Risk – Financial instruments that potentially subject the College to concentrations of credit risk
consist principally of cash deposits at financial institutions, student receivables, and investments in marketable securities. At
times, balances in the College’s cash and investment accounts exceed the insurance limits of the Federal Deposit Insurance
Corporation (FDIC) or Securities Investors Protection Corporation (SPIC). Concentration of credit risk with respect to
receivables is limited due to the number of students from which amounts are due and the low dollar amount of individual
balances.
Impairment of Long-Lived Assets and Long-Lived Assets to Be Disposed of – Long-lived assets are reviewed for
impairment whenever events or changes in circumstances indicate that the carrying amount of an asset may not be
recoverable. If such assets are considered to be impaired, the impairment to be recognized is measured by the amount by
which the carrying amount of the assets exceeds the fair value of the assets. Assets to be disposed of are reported at the lower of
the carrying amount or fair value less costs to sell. During 2016 and 2015, there were no events or changes in
circumstances indicating that the carrying amount of long-lived assets may not be recoverable.
Use of Estimates – The preparation of financial statements in conformity with U.S. generally accepted accounting principles
(GAAP) requires management to make estimates and assumptions that affect the reported amounts of assets and liabilities
and the disclosure of contingent assets and liabilities at the date of the financial statements. Estimates also affect the
reported amount of the revenue and expenses during the reporting period. Actual results could differ from those estimates.
Income Taxes – The College is exempt from taxation under Section 501(c)(3) of the Internal Revenue Code and Section 23701d
of the California Revenue and Taxation Code and is generally not subject to federal and state income taxes. However, the
College is subject to income taxes on any income that is derived from a trade or business regularly carried on, and not in
furtherance of the purposes for which it was granted exemption. No income tax provision has been recorded as the net income,
if any, from any unrelated trade or business, in the opinion of management, is not material to the basic financial statements
taken as a whole.
Accounting for Uncertainty in Income Taxes – The preparation of financial statements in conformity with GAAP
prescribes for all entities, including tax-exempt organizations, minimum thresholds for financial statement recognition of
a position taken in filing tax returns (including whether an entity is taxable in a particular jurisdiction) and requires certain
expanded tax disclosures. Management believes that no such uncertainty in income taxes exist requiring accrual or disclosure for
the College at June 30, 2016 and 2015, respectively. The College files income tax returns in the U.S. federal and the State
of California. With few exceptions, the College is no longer subject to U.S. federal and state income tax examinations by tax
authorities for the years before 2011.

WHITTIER COLLEGE
Notes to Financial Statements
Years Ended June 30, 2016 and 2015
11
Note 2 – Accounts and Loans Receivable
As of June 30, accounts and loans receivable are as follows:
2016 2015
Student accounts receivable $ 274,355 $ 442,326
Federal Perkins loans 4,614,757 4,982,012
Other student loans 6,980,348 7,589,218
Other receivables 615,976 632,085
12,485,436 13,645,641
Allowance for doubtful loans receivable (2,920,458) (3,700,684)
Allowance for doubtful other receivable (451,079) (139,199)
$ 9,113,899 $ 9,805,758
The College makes uncollateralized loans to students based on financial need. Student loans are funded through federal
government loan programs or institutional resources. At June 30, 2016 and 2015, student loans represented 3.76% and
4.38% of total assets, respectively. The College is obligated to collect loans made under the Federal Perkins Student Loan
program and these loans are payable, including interest at 5%, over approximately 11 years following College attendance.
Other student loans are interest free and repayments commence 6 months after leaving the college. Interest rate of 10% is
applied to institutional loans if that balance becomes delinquent. Both federal and institutional loans carry deferment of
repayment based on certain criteria such as full-time student, military, and disability. The event of death cancels both loan types.
As of June 30, student loans receivable are as follows:
2016 2015
Federal Perkins loans $ 4,614,757 $ 4,982,012
Other student loans 6,980,348 7,589,218
11,595,105 12,571,230
Less allowance for doubtful accounts:
Beginning of year (3,700,684) (3,071,974)
Decrease (increase) 780,226 (628,710)
End of year (2,920,458) (3,700,684)
Student loans receivable, net $ 8,674,647 $ 8,870,546
At June 30, 2016 and 2015, the following amounts were past due under student loan programs:
2016 2015
<240 days past due $ 678,933 $ 640,047
>240 days to 2 years past due 329,217 346,034
>2 to 5 years past due 658,377 690,667
>5 years past due 1,287,083 1,184,199
Total past due $ 2,953,610 $ 2,860,947
WHITTIER COLLEGE
Notes to Financial Statements
Years Ended June 30, 2016 and 2015
12
Note 2 – Accounts and Loans Receivable (continued)
Allowances for doubtful accounts are established based on prior collection experience and current economic factors, which in
management’s judgment could influence the ability of loan recipients to repay the amounts per the loan terms. Institutional
loans are written off only when they are deemed to be permanently uncollectible. Amounts due under the Perkins loan
program are guaranteed by the government, and therefore, no reserves are placed on any past due balances as delinquent
accounts can be assigned back to the government. The College may participate in the income tax return offset program
allowed by the government as part of the collection efforts.
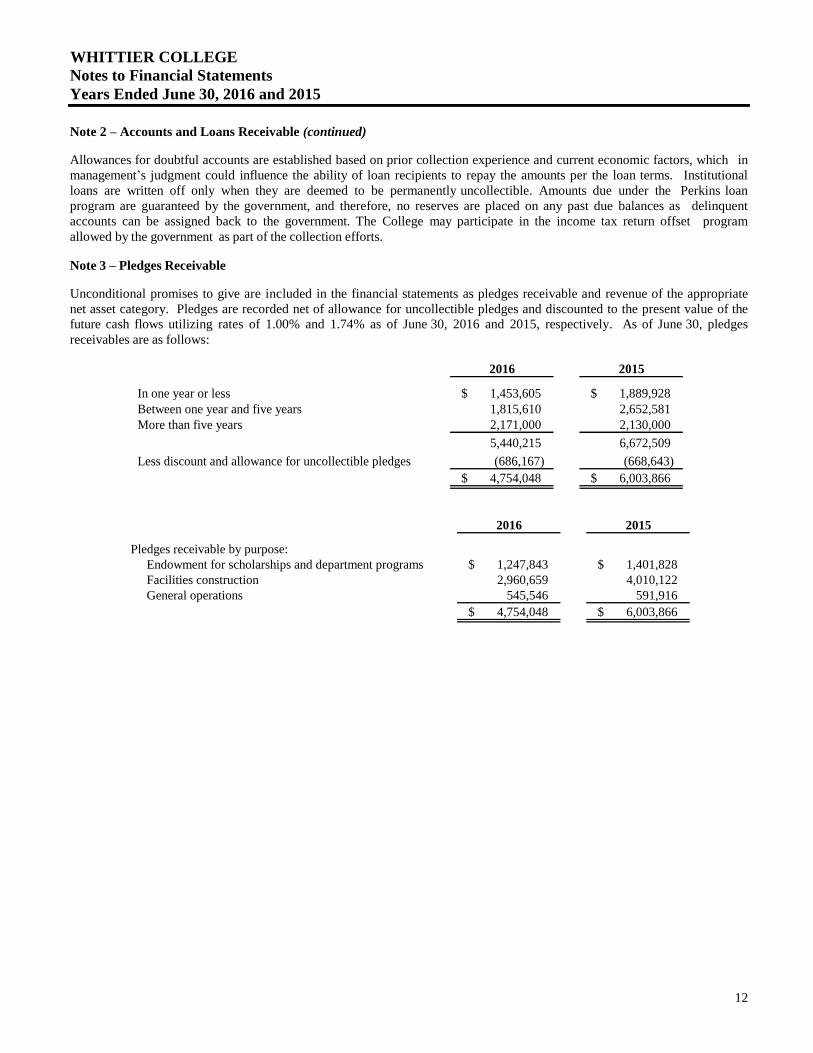
Note 3 – Pledges Receivable
Unconditional promises to give are included in the financial statements as pledges receivable and revenue of the appropriate
net asset category. Pledges are recorded net of allowance for uncollectible pledges and discounted to the present value of the
future cash flows utilizing rates of 1.00% and 1.74% as of June 30, 2016 and 2015, respectively. As of June 30, pledges
receivables are as follows:
2016 2015
In one year or less $ 1,453,605 $ 1,889,928
Between one year and five years 1,815,610 2,652,581
More than five years 2,171,000 2,130,000
5,440,215 6,672,509
Less discount and allowance for uncollectible pledges (686,167) (668,643)
$ 4,754,048 $ 6,003,866
2016 2015
Pledges receivable by purpose:
Endowment for scholarships and department programs $ 1,247,843 $ 1,401,828
Facilities construction 2,960,659 4,010,122
General operations 545,546 591,916
$ 4,754,048 $ 6,003,866

WHITTIER COLLEGE
Notes to Financial Statements
Years Ended June 30, 2016 and 2015
13
Note 4 – Investments
The following summarizes the College’s investments by investment categories at June 30:
2016 2015
Money market funds $ 1,145,994 $ 1,657,344
Certificate of deposits 6,000,000 —
Intermediate bond funds 38,739,768 37,995,789
Mutual funds:
International-developed stocks 13,582,872 15,640,136
Emerging markets 2,663,486 5,347,076
U.S. Large cap 6,825,051 6,821,326
U.S. Mid cap 6,944,137 7,036,000
U.S. Small cap 3,205,659 3,267,287
Fixed income 16,755,888 16,245,746
Other 2,613,240 4,948,391
Total mutual funds 52,590,333 59,305,962
Equities:
U.S. Large cap 4,401,680 5,254,219
U.S. Mid cap 1,358,653 1,387,557
U.S. Small cap 1,804,264 1,147,302
Emerging markets 1,363,925 1,629,761
International-developed stocks 158,596 118,630
Total equities 9,087,118 9,537,469

WHITTIER COLLEGE
Notes to Financial Statements
Years Ended June 30, 2016 and 2015
14
Note 4 – Investments (continued)
2016 2015
Alternative investments:
Limited partnerships $ 2,310,803 $ 2,805,539
Venture capital 321,120 453,805
Hedge funds:
Absolute return 302,797 327,312
Cash 677,111 632,617
Credit 597,205 1,654,794
Venture/Growth equity 681,733 —
Buyout 783,324 —
Fixed income 681,426 567,136
Private Debt 697,193 869,422
Global trading 260,320 520,522
Hedging strategies 138,612 149,835
Long/short equities 10,180,023 11,026,579
Market neutral equity 1,248,006 738,054
Energy/Natural Resources 690,373 947,600
Relative value 1,715,051 955,585
Real Estate 490,571 574,403
Other 39,171 —
Total hedge funds 19,182,916 18,963,859
Total alternative investments 21,814,839 22,223,203
Real estate 2,121,603 1,735,715
Other 49,686 48,817
Beneficial interests in charitable remainder trusts 1,995,000 1,995,000
Unitrust investments:
Cash and cash equivalents 153,080 92,527
Equities 1,070,411 1,207,047
Fixed income 341,629 356,108
Mutual funds 1,616,720 1,794,780
Other 510,692 310,724
Total unitrust investments 3,692,532 3,761,186
Total investments $ 137,236,873 $ 138,260,485

WHITTIER COLLEGE
Notes to Financial Statements
Years Ended June 30, 2016 and 2015
15
Note 5 – Fair Value of Financial Instruments
The following methods and assumptions were used to estimate fair value for each class of financial instrument measured at fair
value:
Money Market Funds – Money market funds are short-term investments of the College and consist of actively traded,
observable inputs and are classified as Level I.
Certificate of Deposits – Certificate of deposits are short-term investments of the College that are virtually risk-free and are
classified as Level I.
Mutual Funds – Mutual funds consist of several distinct funds with varying portfolio compositions and objectives. These
investments are traded on an active exchange, are priced using unadjusted market quotes for identical assets, and are classified
as Level I.
Domestic Equities – Investments in domestic equities are measured at fair value using quoted market prices. They are classified
as Level I as they are traded in an active market for which closing stock prices are readily available. This category includes large,
mid, and small cap funds located in the domestic United States.
International Equities – Investments in international equities are measured at fair value using quoted market prices. They are
classified as Level I as they are traded in an active market, for which closing stock prices are readily available. This category
includes large and small cap funds located outside the domestic United States.
Bond Funds – Bond funds comprise intermediate bond funds. These securities are classified as Level II based on multiple
sources of information, which may include market data and/or quoted market prices from either markets that are not active or
are for similar assets in active markets.
Beneficial Interests in Charitable Remainder Trusts – The College’s beneficial interests in charitable remainder trusts
administered by a third party are classified as Level III as the fair values are based on a combination of Level II inputs and
significant unobservable inputs.
Alternative Investments – Investments in limited partnerships, hedge funds, and venture capital, for which there is no readily
determinable fair value are classified as Level III when such investments are subject to gate or redemption restrictions, and the
valuation is based on net asset value. In cases where the investee has provided its investors with a net asset value per share that
has been calculated in accordance with Accounting Standards Update (ASU) 2009-12, Fair Value Measurements and
Disclosures, the College has estimated its fair value using the net asset value provided by the investee as of December 31,
adjusted for cash receipts, cash disbursements, significant known changes in market values of publicly held securities contained
in the portfolio, and security distributions through June 30.
While the College believes its valuation methods are appropriate and consistent with other market participants, the use of
different methodologies or assumptions to determine the fair value of certain financial instruments could result in a different
estimate of fair value at the reporting date.

WHITTIER COLLEGE
Notes to Financial Statements
Years Ended June 30, 2016 and 2015
16
Note 5 – Fair Value of Financial Instruments (continued)
The following table summarizes the College’s investments and liabilities that are measured at fair value on a recurring basis
at June 30, 2016:
Quoted prices
in active Significant
markets for other Significant
identical observable unobservable
assets inputs inputs
Level I Level II Level III 2016
Investments:
Money market funds $ 1,145,994 $ — $ — $ 1,145,994
Intermediate bond funds — 38,739,768 — 38,739,768
Certificate of deposits investments — 6,000,000 — 6,000,000
Mutual funds:
Emerging markets 2,663,486 — — 2,663,486
International developed stocks 13,582,872 — — 13,582,872
U.S. Large cap 6,825,051 — — 6,825,051
U.S. Mid cap 6,944,137 — — 6,944,137
U.S. Small cap 3,205,659 — — 3,205,659
Fixed income 16,755,888 — — 16,755,888
Other 2,613,240 — — 2,613,240
Equities:
U.S. Large cap 4,401,680 — — 4,401,680
U.S. Mid cap 1,358,653 — — 1,358,653
U.S. Small cap 1,804,264 — — 1,804,264
Emerging markets 1,363,925 — — 1,363,925
International-developed stocks 158,596 — — 158,596
Alternative investments:
Limited partnerships — — 2,310,803 2,310,803
Hedge funds — — 19,182,916 19,182,916
Venture capital — — 321,120 321,120
Real estate — — 2,121,603 2,121,603
Beneficial interests in charitable remainder trusts — — 1,995,000 1,995,000
Other — — 49,686 49,686
Unitrust investments:
Cash and cash equivalents 153,080 — — 153,080
Equities 1,070,411 — — 1,070,411
Fixed income — 341,629 — 341,629
Mutual funds 1,616,720 — — 1,616,720
Other — — 510,692 510,692
Total investments $ 65,663,656 $ 45,081,397 $ 26,491,820 $ 137,236,873
Liabilities:
Interest rate swap liability $ — $ (9,696,146) $ — $ (9,696,146)
Total liabilities $ — $ (9,696,146) $ — $ (9,696,146)
WHITTIER COLLEGE
Notes to Financial Statements
Years Ended June 30, 2016 and 2015
17
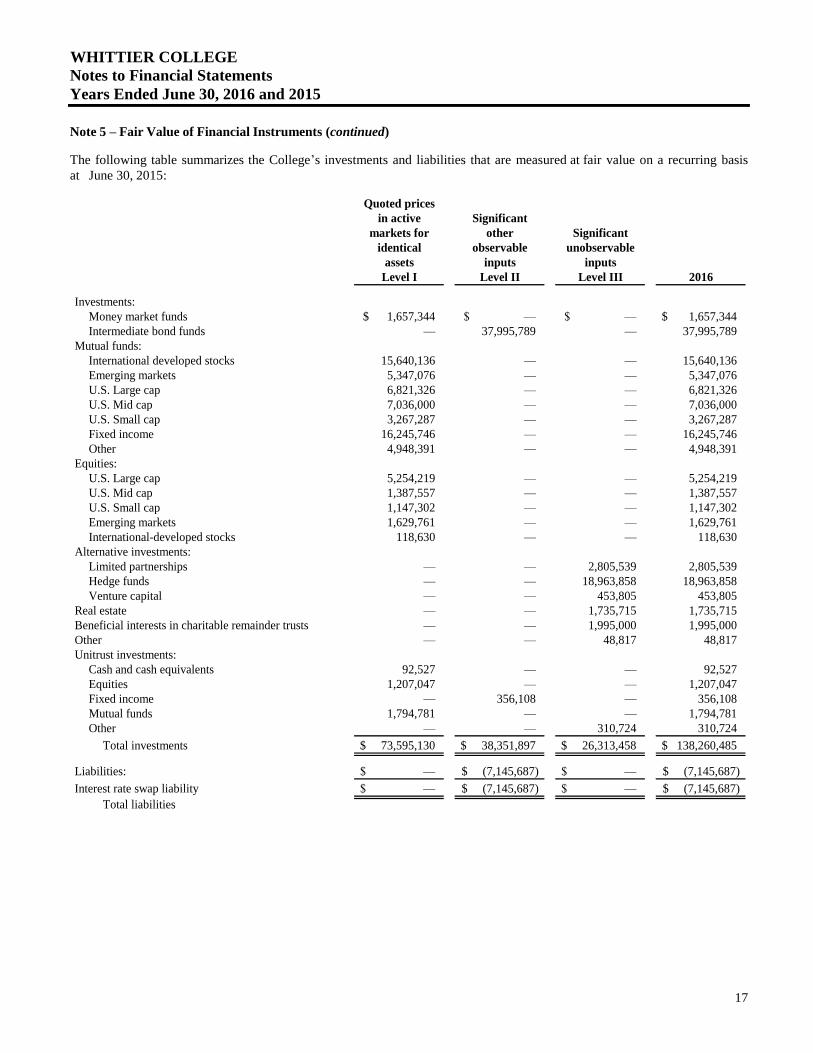
Note 5 – Fair Value of Financial Instruments (continued)
The following table summarizes the College’s investments and liabilities that are measured at fair value on a recurring basis
at June 30, 2015:
Quoted prices
in active Significant
markets for other Significant
identical observable unobservable
assets inputs inputs
Level I Level II Level III 2016
Investments:
Money market funds $ 1,657,344 $ — $ — $ 1,657,344
Intermediate bond funds — 37,995,789 — 37,995,789
Mutual funds:
International developed stocks 15,640,136 — — 15,640,136
Emerging markets 5,347,076 — — 5,347,076
U.S. Large cap 6,821,326 — — 6,821,326
U.S. Mid cap 7,036,000 — — 7,036,000
U.S. Small cap 3,267,287 — — 3,267,287
Fixed income 16,245,746 — — 16,245,746
Other 4,948,391 — — 4,948,391
Equities:
U.S. Large cap 5,254,219 — — 5,254,219
U.S. Mid cap 1,387,557 — — 1,387,557
U.S. Small cap 1,147,302 — — 1,147,302
Emerging markets 1,629,761 — — 1,629,761
International-developed stocks 118,630 — — 118,630
Alternative investments:
Limited partnerships — — 2,805,539 2,805,539
Hedge funds — — 18,963,858 18,963,858
Venture capital — — 453,805 453,805
Real estate — — 1,735,715 1,735,715
Beneficial interests in charitable remainder trusts — — 1,995,000 1,995,000
Other — — 48,817 48,817
Unitrust investments:
Cash and cash equivalents 92,527 — — 92,527
Equities 1,207,047 — — 1,207,047
Fixed income — 356,108 — 356,108
Mutual funds 1,794,781 — — 1,794,781
Other — — 310,724 310,724
Total investments $ 73,595,130 $ 38,351,897 $ 26,313,458 $ 138,260,485
Liabilities: $ — $ (7,145,687) $ — $ (7,145,687)
Interest rate swap liability $ — $ (7,145,687) $ — $ (7,145,687)
Total liabilities

WHITTIER COLLEGE
Notes to Financial Statements
Years Ended June 30, 2016 and 2015
18
Note 5 – Fair Value of Financial Instruments (continued)
The following is a reconciliation of investments in which significant unobservable inputs (Level III) were used in determining
fair value:
2016
Hedge funds, Beneficial
Limited venture interests in Unitrust and
partnerships capital Real estate trusts others Total
Beginning balance $2,805,539 $19,417,663 $ 1,735,715 $ 1,995,000 $ 359,541 $ 26,313,458
Realized losses on
investments (281,438) (44,068) — — — (325,506)
Change in unrealized gains
(losses) on investments (185,845) (488,302) 385,888 — 8,789 (279,470)
Purchases — 990,000 — — 192,048 1,182,048
Distributions (27,453) (371,257) — — — (398,710)
Ending balance $ 2,310,803 $19,504,036 $ 2,121,603 $ 1,995,000 $ 560,378 $ 26,491,820
2015
Hedge funds, Beneficial
Limited venture interests in Unitrust and
partnerships capital Real estate trusts others Total
Beginning balance $ 16,919 $24,581,912 $2,273,472 $2,068,148 $408,695 $29,349,146
Withdrawals — (12,659,259) — — — (12,659,259)
Realized gains (losses) on
investments (59,302) 2,527,059 — — — 2,467,757
Change in unrealized losses on
investments (132,619) (2,341,723) (537,757) (69,048) (48,817) (3,129,964)
Purchases 3,000,000 7,770,000 — — — 10,770,000
Distributions (19,459) (460,326) — (4,100) (337) (484,222)
Ending balance $2,805,539 $19,417,663 $1,735,715 $1,995,000 $359,541 $26,313,458

WHITTIER COLLEGE
Notes to Financial Statements
Years Ended June 30, 2016 and 2015
19
Note 5 – Fair Value of Financial Instruments (continued)
Level III investments consist primarily of hedge funds, limited partnerships, real estate, beneficial interests in charitable
remainder trusts, other investments, and portions of unitrust investments, and are classified as Level III as these investments are
not openly traded in active markets. As such, the College is unable to obtain independent valuations from market sources.
Therefore, these investments are typically valued utilizing net asset values and/or percentage of ownership calculations based on
those net asset values, and represented 19.30% and 18.90% of total investments of June 30, 2016 and 2015, respectively. Total
gains and losses included in income attributable to the change in unrealized gains or losses relating to assets and liabilities
held at June 30, 2016 and 2015 were $(279,470) and $(3,188,152), respectively. The College holds $2,310,803 and $2,805,539
limited partnerships at June 30, 2016 and 2015, respectively. These limited partnerships do not allow for periodic
redemptions, but rather distributions are received through the liquidation of the underlying assets of the partnership. At
June 30, 2016, these partnerships had estimated that there were no definite termination dates. The College also holds
$19,504,036 and $19,417,664 in hedge funds and venture capital at June 30, 2016 and 2015, respectively. The redemption
schedule from these funds requires a 60-day to 100-day notice. In addition, the College also holds $1,995,000 in
beneficial interest in funds that are managed by others at June 30, 2016 and 2015. These funds can only be redeemed at donor’s
request. The College has full discretion on $2,121,603 and $1,735,715 of real estate owned by the College, and $49,686 and
$48,817 of other funds managed internally at June 30, 2016 and 2015, respectively. At June 30, 2016, the College made no
additional hedge fund investments.
Although best judgment was used in estimating the fair value of investments, there are inherent limitations in any estimation
technique. The College’s accounting policy is to recognize transfers between levels of the fair value hierarchy on the date of the
event or change in circumstances that caused the transfer. There were no significant transfer transactions in Level III for the
years ended June 30, 2016 and 2015.
Note 6 – Endowment
The College’s endowment consists of approximately 260 individual funds established for a variety of purposes. The
endowment includes both donor-restricted endowment funds and funds designated by the governing board to function as
endowments. Net assets associated with endowment funds are classified and reported based on the existence or absence of
donor-imposed restrictions.
Interpretation of Relevant Law
The College adopted guidance under U.S. GAAP on classifying net assets associated with donor-restricted endowment funds
that are subject to an enacted version of the Uniform Prudent Management of Institutional Funds Act (UPMIFA). A key
component of the guidance is a requirement to classify the portion of a donor-restricted endowment fund that is not classified as
permanently restricted net assets as temporarily restricted net assets until appropriated for expenditure.
The College has interpreted UPMIFA as requiring the preservation of the fair value of the original gift as of the date of the
donor-restricted endowment funds absent explicit donor stipulations to the contrary. As a result of this interpretation, the College
classifies as permanently restricted net assets (a) the original value of gifts donated to the permanent endowment, (b) the
original value of subsequent gifts to the permanent endowment, and (c) accumulations to the permanent endowment made
in accordance with the direction of the applicable donor-gift instrument at the time the accumulation is added to the fund.
The remaining portion of the donor-restricted endowment fund that is not classified in permanently restricted net assets is
classified as temporary restricted assets until those amounts are appropriated for expenditure by the College in a manner
consistent with the standards of prudence prescribed by UPMIFA. In accordance with UPMIFA, the College considers the
following factors in making a determination to appropriate or accumulate donor-restricted endowment funds:
1. The duration and preservation of the fund
2. The purposes of the College and the donor-restricted endowment fund
3. General economic conditions
4. The possible effect of inflation or deflation
5. The expected total return from income and the appreciation of investments
6. Other resources of the organization

WHITTIER COLLEGE
Notes to Financial Statements
Years Ended June 30, 2016 and 2015
20
Note 6 – Endowment (continued)
7. The investment policies of the College
Return Objectives and Risk Parameters
The College’s Board of Trustees has adopted an investment and spending policy for endowment assets that attempts to provide
a predictable stream of funding sources to programs supported by its endowment while seeking to maintain the purchasing
power of the endowment assets to create generational equity. Endowment assets include those assets of donor-restricted
funds that the College must hold in perpetuity or for a donor-specified period(s) as well as board-designated funds. Under this
policy, as approved by the Board of Trustees, the endowment assets are invested in a manner that is intended to produce results
that exceed the price and yield results of the investment market while assuming a moderate level of investment risk. The
College expects its endowment funds, over time, to provide a better than the average rate of return of approximately 5%, which
is the current College spending rate. Actual returns in any given year may vary from this amount.
Strategies Employed for Achieving Objectives
To satisfy this long-term rate-of-return objectives, the College relies on a total return strategy in which investment returns
are achieved through both capital appreciation (realized and unrealized) and current yield (interest and dividends). The
College’s investments include a diversified and strategic portfolio consisting of equities, fixed income, and alternative assets.
Targeted asset allocation ranges are reviewed periodically for potential adjustment of asset mix while evaluating the relative
risk of each component. The College’s spending policy is determined by applying a specified percentage to the average
market value of the endowment pooled investments for the three preceding calendar years. This percentage was 5% for the
years ended June 30, 2016 and 2015.
Endowment net asset composition by type of funds as of June 30, 2016
Temporarily PermanentlyUnrestricted Restricted Restricted Total
Donor-restricted endowments $ (3,139,367) $ 11,179,757 $ 65,026,180 $ 73,066,570
Board-designated endowments 17,589,142 — — 17,589,142
Total $ 14,449,775 $ 11,179,757 $ 65,026,180 $ 90,655,712
The changes in endowment fund net assets for the year ended June 30, 2016 are as follows:
Temporarily PermanentlyUnrestricted Restricted Restricted Total
Endowment net assets, beginning of year $ 17,375,446 $ 15,295,588 $ 64,613,265 $ 97,284,299
Investment return:
Investment income 87,378 976,708 — 1,064,086
Net appreciation
(realized and unrealized) (2,375,786) (1,618,080) (248,081) (4,241,947)
Total investment return (2,288,408) (641,372) (248,081) (3,177,861)
New gifts 1,150 — 660,996 662,146
Appropriation for
endowment spending (638,413) (3,604,907) — (4,243,320)
Other revenue — 130,448 — 130,448
Total gifts and other changes (637,263) (3,474,459) 660,996 (3,450,726)
Endowment net assets, end of the year $ 14,449,775 $ 11,179,757 $ 65,026,180 $ 90,655,712

WHITTIER COLLEGE
Notes to Financial Statements
Years Ended June 30, 2016 and 2015
21
Note 6 – Endowment (continued)
Endowment net asset composition by type of funds as of June 30, 2015
Temporarily PermanentlyUnrestricted Restricted Restricted Total
Donor-restricted endowments $ (944,265) $ 15,295,588 $ 64,613,265 $ 78,964,588
Board-designated endowments 18,319,711 — — 18,319,711
Total $ 17,375,446 $ 15,295,588 $ 64,613,265 $ 97,284,299
The changes in endowment fund net assets for the year ended June 30, 2015 are as follows:
Temporarily PermanentlyUnrestricted Restricted Restricted Total
Endowment net assets, beginning of year $ 17,554,091 $ 19,461,127 $ 62,813,892 $ 99,829,110
Investment return:
Investment income 203,064 1,145,809 — 1,348,873
Net appreciation
(realized and unrealized) (94,915) (1,874,097) (413) (1,969,425)
Total investment return 108,149 (728,288) (413) (620,552)
New gifts 2,000 — 1,799,786 1,801,786
Appropriation for
endowment spending (579,765) (3,257,196) — (3,836,961)
Other changes 290,971 (290,971) — —
Other revenue — 110,916 — 110,916
Total gifts and other changes (286,794) (3,437,251) 1,799,786 (1,924,259)
Endowment net assets, end of the year $ 17,375,446 $ 15,295,588 $ 64,613,265 $ 97,284,299
From time to time, the fair value of assets associated with individual donor-restricted endowments may fall below the level that
the donor or UPMIFA requires the College to retain as a fund of perpetual duration. Deficiencies of this nature were
$3,139,367 and $944,265 as of June 30, 2016 and 2015, respectively. These deficiencies resulted from unfavorable market
fluctuations that occurred shortly after the investment of permanently restricted contributions and continued appropriation
for programs that were deemed prudent by the governing board.
Note 7 – Plant Facilities
Plant facilities consist of the following at June 30:
2016 2015
Land $ 6,704,442 $ 6,704,442
Buildings and improvements 148,974,066 147,077,984
Equipment and library books 32,482,396 29,275,207
Construction in progress 38,700,330 10,511,036
226,861,234 193,568,669
Less accumulated depreciation (89,505,826) (83,988,949)
$ 137,355,408 $ 109,579,720
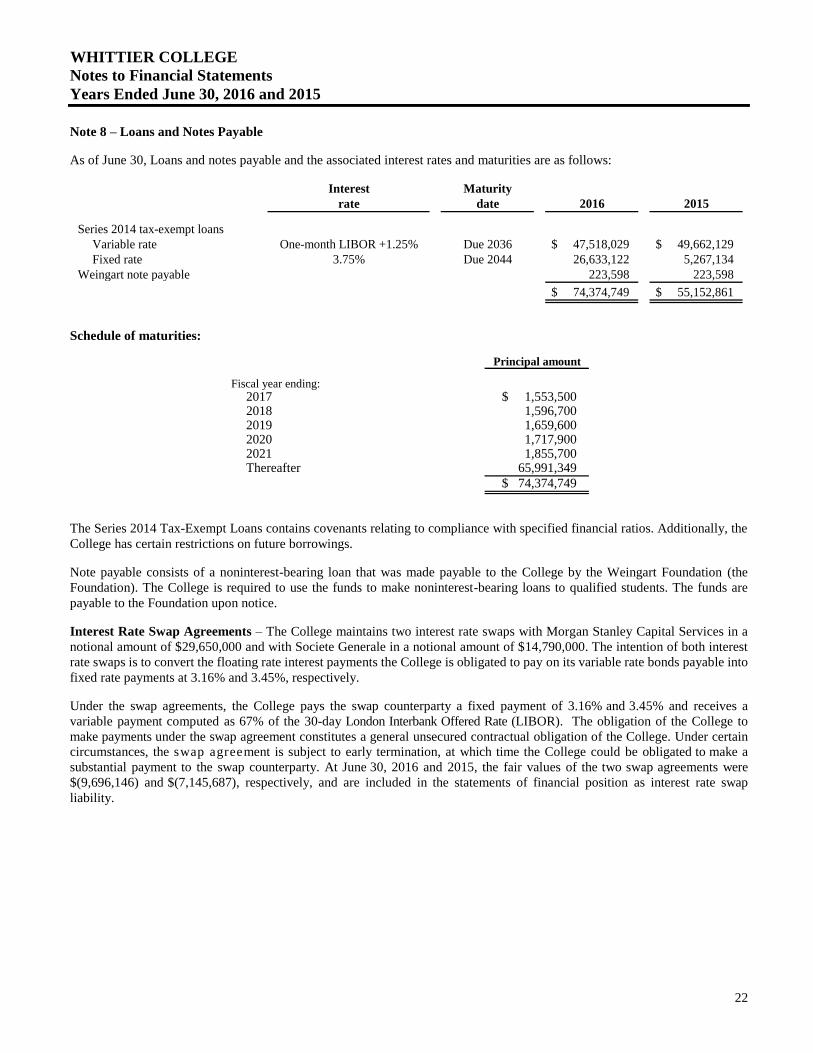
WHITTIER COLLEGE
Notes to Financial Statements
Years Ended June 30, 2016 and 2015
22
Note 8 – Loans and Notes Payable
As of June 30, Loans and notes payable and the associated interest rates and maturities are as follows:
Interest Maturity
rate date 2016 2015
Series 2014 tax-exempt loans
Variable rate One-month LIBOR +1.25% Due 2036 $ 47,518,029 $ 49,662,129
Fixed rate 3.75% Due 2044 26,633,122 5,267,134
Weingart note payable 223,598 223,598
$ 74,374,749 $ 55,152,861
Schedule of maturities:
Principal amount
Fiscal year ending:2017 $ 1,553,500 2018 1,596,700 2019 1,659,600 2020 1,717,900 2021 1,855,700 Thereafter 65,991,349
$ 74,374,749
The Series 2014 Tax-Exempt Loans contains covenants relating to compliance with specified financial ratios. Additionally, the
College has certain restrictions on future borrowings.
Note payable consists of a noninterest-bearing loan that was made payable to the College by the Weingart Foundation (the
Foundation). The College is required to use the funds to make noninterest-bearing loans to qualified students. The funds are
payable to the Foundation upon notice.
Interest Rate Swap Agreements – The College maintains two interest rate swaps with Morgan Stanley Capital Services in a
notional amount of $29,650,000 and with Societe Generale in a notional amount of $14,790,000. The intention of both interest
rate swaps is to convert the floating rate interest payments the College is obligated to pay on its variable rate bonds payable into
fixed rate payments at 3.16% and 3.45%, respectively.
Under the swap agreements, the College pays the swap counterparty a fixed payment of 3.16% and 3.45% and receives a
variable payment computed as 67% of the 30-day London Interbank Offered Rate (LIBOR). The obligation of the College to
make payments under the swap agreement constitutes a general unsecured contractual obligation of the College. Under certain
circumstances, the swap agreement is subject to early termination, at which time the College could be obligated to make a
substantial payment to the swap counterparty. At June 30, 2016 and 2015, the fair values of the two swap agreements were
$(9,696,146) and $(7,145,687), respectively, and are included in the statements of financial position as interest rate swap
liability.
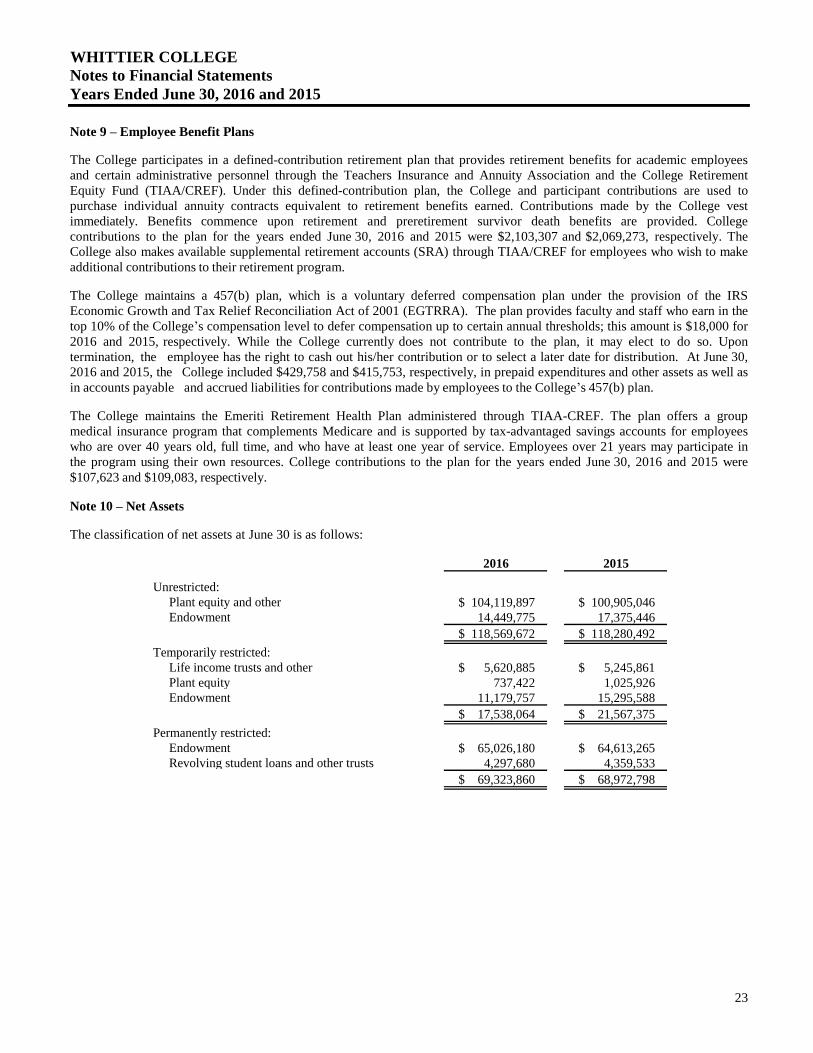
WHITTIER COLLEGE
Notes to Financial Statements
Years Ended June 30, 2016 and 2015
23
Note 9 – Employee Benefit Plans
The College participates in a defined-contribution retirement plan that provides retirement benefits for academic employees
and certain administrative personnel through the Teachers Insurance and Annuity Association and the College Retirement
Equity Fund (TIAA/CREF). Under this defined-contribution plan, the College and participant contributions are used to
purchase individual annuity contracts equivalent to retirement benefits earned. Contributions made by the College vest
immediately. Benefits commence upon retirement and preretirement survivor death benefits are provided. College
contributions to the plan for the years ended June 30, 2016 and 2015 were $2,103,307 and $2,069,273, respectively. The
College also makes available supplemental retirement accounts (SRA) through TIAA/CREF for employees who wish to make
additional contributions to their retirement program.
The College maintains a 457(b) plan, which is a voluntary deferred compensation plan under the provision of the IRS
Economic Growth and Tax Relief Reconciliation Act of 2001 (EGTRRA). The plan provides faculty and staff who earn in the
top 10% of the College’s compensation level to defer compensation up to certain annual thresholds; this amount is $18,000 for
2016 and 2015, respectively. While the College currently does not contribute to the plan, it may elect to do so. Upon
termination, the employee has the right to cash out his/her contribution or to select a later date for distribution. At June 30,
2016 and 2015, the College included $429,758 and $415,753, respectively, in prepaid expenditures and other assets as well as
in accounts payable and accrued liabilities for contributions made by employees to the College’s 457(b) plan.
The College maintains the Emeriti Retirement Health Plan administered through TIAA-CREF. The plan offers a group
medical insurance program that complements Medicare and is supported by tax-advantaged savings accounts for employees
who are over 40 years old, full time, and who have at least one year of service. Employees over 21 years may participate in
the program using their own resources. College contributions to the plan for the years ended June 30, 2016 and 2015 were
$107,623 and $109,083, respectively.
Note 10 – Net Assets
The classification of net assets at June 30 is as follows:
2016 2015
Unrestricted:
Plant equity and other $ 104,119,897 $ 100,905,046
Endowment 14,449,775 17,375,446
$ 118,569,672 $ 118,280,492
Temporarily restricted:
Life income trusts and other $ 5,620,885 $ 5,245,861
Plant equity 737,422 1,025,926
Endowment 11,179,757 15,295,588
$ 17,538,064 $ 21,567,375
Permanently restricted:
Endowment $ 65,026,180 $ 64,613,265
Revolving student loans and other trusts 4,297,680 4,359,533
$ 69,323,860 $ 68,972,798

WHITTIER COLLEGE
Notes to Financial Statements
Years Ended June 30, 2016 and 2015
24
Note 11 – Operating Leases
At June 30, 2016, the College was obligated under various office equipment operating lease agreements with remaining terms
ranging from one month to three years. The lease payments for the years ended June 30, 2016 and 2015, were $147,958 and
$136,745, respectively. The following is a summary of future minimum rental payments for operating leases that have initial
or remaining noncancelable terms in excess of one year as of June 30, 2016:
Year ending June 30:
2017 $ 77,098
2018 60,319
2019 9,232
$ 146,649
Note 12 – Asset Retirement Obligation
The College has recorded an asset retirement obligation related to property and equipment, primarily for disposal of
regulated materials upon eventual retirement of the assets.
The following schedule summarizes asset retirement obligation activities for the years ended June 30:
2016 2015
Accretion expense $ 115,791 $ 41,423
115,791 41,423
Beginning balance 2,940,046 2,898,623
Ending balance $ 3,055,837 $ 2,940,046
Note 13 – Commitments and Contingencies
In the normal course of operations, the College is named as a defendant in lawsuits and is subject to periodic examinations by
regulatory agencies. After consultation with legal counsel, management is of the opinion that liabilities, if any, arising from
such litigation and examinations would not have a material effect on the College’s financial position.
Certain federal grants, including financial aid that the College administers and for which it receives reimbursement, are
subject to audit and final acceptance by federal granting agencies. Current and prior year costs of such grants are subject to
adjustment upon audit. The amount of expenditures that may be disallowed by the grantor, if any, cannot be determined at this
time, although the College does not expect such amounts, if any, will have a significant impact on the financial position of
the College.
Note 14 – Subsequent Events
Subsequent events have been evaluated through November 14, 2016, the date the financial statements were available to be
issued.

25
WHITTIER COLLEGE BOARD OF TRUSTEES
AND OFFICERS OF THE COLLEGE
OFFICERS OF THE BOARD
Alan H. Lund ‘71, Chairman
Vincent J. Daigneault ‘85, Treasurer
Kate K. Wiley, Secretary
MEMBERS OF THE BOARD
Albert Anderson ‘66
Fred D. Anderson ‘66
Barry M. Blechman P’14
James M. Brown ‘71
Christopher G. Caldwell P’13
Janet Cauffman
Peter E. Feinberg ‘82
Raymond “Buck” Ferguson ‘67
Gerard P. Foster ‘87 P’08
Jennifer L. Fuller ‘82
Richard I. Gilchrist ‘68 P’06, ‘07
Barbara (Ondrasik) Groce ‘57
Carey (Baker) Halio ‘95
Helen N. Hartung P’13
Yukiyasu Hayashi
Kathleen L. Kane ‘71
Elizabeth Y. Kay-Im ‘89
Edwin Y. Keh ‘79 P’11, ‘14
Maggie Koong L.H.D. ‘14
Christopher T. Martin ‘94
James E. Mitchell ‘62
James R. Parks
Janet L. Roberts ‘64
Richard S. Ruben
Marvin Suomi
Steven Weston ‘83
Nancy Woodward P’13
Richard Zapata P’13
Robert Zemsky ‘62
COLLEGE ALUMNI TRUSTEE
Misty M. Sanford ‘00
TRUSTEES EMERITI
Richard H. Deihl ‘49, D.B.A. ‘84
Alfred J. Gobar ‘53, M.A. ‘55, L.H.D. ‘05
Willard V. Harris, Jr. ‘55 L.H.D. ‘02
Donald J. Herrema ‘74
Caroline (Patterson) Ireland ‘43
Sharon W. McLaughlin
R. Chandler Meyers, LL.D. ‘88
Anthony R. Pierno ‘54, L.H.D. ‘00
Ruth B. Shannon, L.H.D. ‘92
Elden L. Smith ‘62
Donald E. Wood, L.H.D. ‘98
OFFICERS OF THE COLLEGE
Sharon D. Herzberger
President
Robert J. Coleman
Special Assistant to the President
and Executive Director of Athletics
Steve Delgado
Vice President for Advancement
James Dunkelman
Vice President for Finance and Administration
Judith Daar
Interim Dean, Whittier Law School
Darrin Good
Vice President for Academic Affairs
and Dean of Faculty
Joel Pérez
Vice President and Dean of Students
Kieron J. Miller
Vice President for Enrollment

13406 Philadelphia Street
P.O. Box 634 Whittier,
California 90608