Embed Size (px)
Citation preview
1
Auditing Standard No. 2 versus Auditing Standard No. 5:
Implications for integrated audits and financial reporting quality#
Andrew A. Acito
a
Chris E. Hogana*
Andrew J. Imdiekea
May, 2014
aEli Broad College of Business, Michigan State University, United States
* Corresponding author. Tel.:1-517-353-8647
Email addresses: [email protected] (A. Acito), [email protected] (C. Hogan),
[email protected] (A. Imdieke)
#We thank Colleen Boland, Ranjani Krishnan, Miles Romney and Dan Wangerin, as well as
participants at the University of Illinois Young Scholars Research Symposium and workshop
participants at Michigan State University, University of Alabama, and University of Kansas for their
helpful comments and suggestions.

2
Auditing Standard No. 2 versus Auditing Standard No. 5:
Implications for integrated audits and financial reporting quality
Abstract
The adoption of PCAOB Auditing Standard No. 5 (AS5) introduced a more flexible
implementation of internal control testing intended to reduce burdensome requirements
established under PCAOB Auditing Standard No. 2 (AS2). The risk-based approach of AS5,
however, has elicited concern that the new standard reduces testing at the expense of quality and
rigor. Using two methods to control for the underlying existence of material weaknesses, we
find that auditors are less likely to identify material weaknesses in the AS5 period and document
several changes in material weakness identification determinants between the AS5 and AS2
periods. Further, we find financial statement misstatements are related to predictable, but
unidentified material weaknesses in the AS5 period, but not in the AS2 period. Overall, our
results suggest that under AS5, auditors may not be focusing their risk-based control testing on
certain risky areas, thus contributing in some cases to lower rates of material weakness
identification and lower financial reporting quality.
JEL classification: K22, M42, M48
Keywords: PCAOB Auditing Standard No. 2 and No. 5; internal control; integrated audit;
Sarbanes-Oxley Act; financial reporting quality.
Data Availability: Data are publicly-available from sources identified in the paper.

1
Auditing Standard No. 2 versus Auditing Standard No. 5:
Implications for integrated audits and financial reporting quality
1. Introduction
The Sarbanes-Oxley Act of 2002’s Section 404 (SOX 404) establishes the requirement for
management to report on the effectiveness of internal control over financial reporting (ICFR) and
for auditors to attest to that assessment. This study investigates whether there are differences in
the likelihood of disclosing material weaknesses in internal controls, and in financial reporting
quality, between integrated audits conducted under Auditing Standard No. 2 (AS2) and Auditing
Standard No. 5 (AS5), two standards of the Public Company Accounting Oversight Board
(PCAOB) that establish the requirements for an audit of management’s assessment of ICFR.
When the PCAOB implemented AS2, applicable to accelerated filers for fiscal years ending after
November 15, 2004, the standard met heavy criticism for being costly and an example of
regulatory overreaction (SEC, 2005). The PCAOB acknowledged this criticism, stating that AS2
provides “higher quality and enhanced transparency,” but that the “benefits have come from
significant costs” (PCAOB, 2006). The PCAOB responded by replacing AS2 with AS5,
effective for fiscal years ending after November 15, 2007 (PCAOB, 2007). AS5 adopts a ‘‘top-
down, risk-based’’ approach in internal control audits, which proponents claim maintains the
benefits of an audit of ICFR, but reduces costs by focusing on the most important issues and
simplifying audit procedures (PCAOB, 2007). Whether the rigor of integrated audits and
financial reporting quality has changed with the adoption of the new standard, however, is an
empirical question.
The effectiveness of management’s assessment process and AS5 integrated audits have been
questioned due to the declining overall frequency of material weakness disclosures and the

2
increase in the frequency with which firms identify weaknesses concurrently with financial
statement adjustments (Whitehouse, 2010). In addition, PCAOB inspections have identified
numerous issues with audits of ICFR under AS5 (PCAOB, 2013). The frequency of adverse
internal control opinions (indicating at least one material weakness exists as of the end of the
year) has declined over the last several years, from an initial rate of 16.9% in 2004 to a rate of
2.4% in 2009 (Audit Analytics, 2010b). This decrease could be the result of companies
strengthening their internal controls over time (i.e., a decrease in the existence of material
weaknesses)1, the result of companies detecting material weaknesses earlier in the year and being
able to remediate and test controls prior to year-end, or due to a reduced rate of detection and/or
reporting of material weaknesses.
Some evidence on whether management and auditors detect and disclose material
weaknesses on a timely basis is provided by Rice and Weber (2012), who examine whether
restating firms provide an early warning of poor financial reporting quality through material
weakness disclosures. They document that only about 32% of restating firms disclosed the
existence of a related material weakness during the misstated time period, suggesting a majority
of the restating firms either did not detect the material weakness or did not classify and disclose
the control deficiency as a material weakness. In addition, Rice and Weber (2012) find that the
proportion of firms identifying a material weakness in the misstated period decreased between
2004 and 2008.
If there is a widespread decline in auditors identifying existing material weaknesses in
internal control, there are implications for overall financial reporting quality. Prior research links
the existence of material weaknesses to accruals quality (Doyle, Ge, and McVay, 2007a;
1 When considering only companies that are undergoing ICFR audits for the first time, the rate of adverse
internal control opinions decreases from 16.9% in 2004 to 5.8% in 2009 (Audit Analytics, 2010b).
3
Ashbaugh-Skaife, Collins, Kinney, and LaFond, 2008) and to financial statement restatements
Doyle, Ge, and McVay, 2007a). The PCAOB also notes in their summary of findings related to
the inspections of integrated audits that deficiencies in audits of internal controls over financial
reporting frequently led to the auditors failing to gather sufficient evidence to support their
overall opinion on the financial statements (PCAOB, 2013). Thus, if AS5 is a “weaker”
standard, or is not being properly implemented, undetected material weaknesses will degrade
financial reporting quality.
Using accelerated filers over the time period 2004-2011 as our sample, we first examine
changes in the likelihood, and changes in the determinants, of material weakness identification
between the AS2 period and the AS5 period. We model the determinants of material weakness
identification using variables established in prior research that are associated with the existence
of material weaknesses as well as incentives to detect and disclose these weaknesses (Ashbaugh-
Skaife, Collins, and Kinney, 2007; Doyle, Ge, and McVay, 2007a). In addition, we include a
measure of experience with integrated audits to control for a decrease in the likelihood of
existence of a material weakness as companies strengthen internal controls over time. We find
an overall decrease in the likelihood of material weakness identification in the AS5 period
relative to the AS2 period, and that this decrease is associated with firm characteristics. For
example, firms in high litigation risk industries are less likely to identify a material weakness in
the AS5 period, while firms with recent auditor resignations are more likely to identify a material
weakness. In addition, the inverse association between firm size and material weakness
identification observed in the AS2 period lessens in the AS5 period. These findings suggest the
risk-based approach may alter the likelihood of identifying a material weakness for at least some
firms.
4
As an alternative method of determining whether firms are less likely to identify existing
material weaknesses under AS5, we build on Rice and Weber’s (2012) approach of examining
firms that acknowledge a material weakness related to a financial restatement either during the
misstated period or subsequently as part of the misstatement revelation. Because a material
weakness clearly existed for these firms, a lack of material weakness disclosure prior to a
misstatement revelation indicates the firms were unable to effectively identify their internal
control deficiencies. Using this method, we find firms are less likely to identify existing material
weaknesses in a timely manner under AS5 after controlling for incentives to detect and disclose
material weaknesses identified in Rice and Weber (2012).
To the extent material weaknesses exist and are not being detected, or not being properly
evaluated as to severity, financial reporting quality may suffer. To examine financial reporting
quality, we use the material weakness determinants models discussed above to develop material
weakness likelihood predictions for each firm-year. We then examine the likelihood of financial
statement misstatements for firm-years that are predicted to have a material weakness but do not
disclose one (potential undisclosed material weaknesses) relative to a control sample of firm-
years that are not predicted to have a material weakness and do not disclose one. We find that
firm-years with potential undisclosed material weaknesses in the AS5 period are significantly
more likely to be misstated, but find no such evidence in the AS2 period. Further testing
suggests the lower financial reporting quality for firms with predicted material weaknesses is at
least in part due to evidence of past restatements being underweighted in auditors’ risk
assessments.
Overall, our results suggest that the risk-based approach of AS5 has resulted in a significant
shift in the association of certain firm characteristics with the likelihood of material weakness
5
identification. The risk-based approach has resulted in “predictable” material weaknesses
remaining undetected or undisclosed, and these unidentified material weaknesses are associated
with financial statement misstatements.
Our study contributes to the literature by providing evidence as to whether identification of
material weaknesses has changed between the AS2 period and AS5 period and whether the
observed changes are associated with changes in financial reporting quality. This evidence
provides information relevant to assessing whether AS5 has maintained the benefits of auditing
ICFR, as regulators claimed it would (PCAOB, 2007), and whether the lower frequency of
material weakness disclosures under AS5 is because fewer material weaknesses exist or because
more material weaknesses are going undetected. Our results provide evidence that AS2 was not
necessarily an overreaction to a political crisis as claimed by regulators (SEC, 2005) and
academics (Doogar, Sivadasan, and Solomon, 2010). Rather, the adoption of a more relaxed
standard in AS5 may have reduced some improvements in internal control generated by AS2.
2. Regulatory and conceptual background and hypotheses
2.1 Regulatory background
Regulatory requirements related to maintaining internal controls and the disclosure of
internal control deficiencies have evolved over time. Under the books and records provision of
the Foreign Corrupt Practices Act of 1977, management of publicly-traded companies is required
to devise and maintain a system of internal controls. However, management was only required
to publicly disclose an internal control deficiency upon a change in auditor (SEC, 1988). Under
SOX Section 302, the CEO and CFO are required to certify that they are responsible for
designing and maintaining a system of internal controls, and provide a conclusion on a quarterly

6
basis regarding the effectiveness of internal controls. If a material weakness (hereafter MW) is
identified, then it is required to be disclosed (SOX, 2002); however, Section 302 does not have
specific procedural requirements or an audit requirement related to the evaluation of a firm’s
internal control. 2
The formal requirement for management to assess the design and operating effectiveness of
internal controls over financial reporting (ICFR) was established under SOX Section 404, and
Section 404 reaffirms the requirement for management to disclose MWs of which they are
aware. Management’s “awareness” of a MW, however, requires the identification of an existing
control deficiency as well as the appropriate classification of its severity. The categorization of a
control deficiency as a MW versus a significant deficiency is subjective as it depends on
assessing both the likelihood (more than a reasonable possibility) and the significance
(materiality) of a misstatement (Bedard and Graham, 2011). SOX Section 404 also requires the
external auditors to attest to the assessment of ICFR made by management as part of the audit
engagement, thus both management and the external auditor have responsibility under this
regulation. The external audit is applicable only for accelerated filers, however, as non-
accelerated filers have been permanently exempted from Section 404(b) through the Dodd-Frank
Wall Street Reform and Consumer Protection Act of 2010 (Dodd-Frank, 2010).
2.1.1 AS2 versus AS5
AS2, the PCAOB’s first noteworthy regulation, and arguably its most controversial, provided
guidance to auditors in conducting their Section 404(b) audits of internal controls over financial
reporting. AS2 was a detailed regulation that left little flexibility regarding the scope and extent
of testing of internal controls over financial reporting. Auditors and preparers expressed concern
2A material weakness is a deficiency, or combination of deficiencies which result in a reasonable possibility that
a company’s controls will fail to prevent or detect a material misstatement of an account balance or disclosure
(PCAOB, 2007).

7
over the increased compliance requirements from SOX 404 and AS2 combined with shortened
reporting deadlines. As a result, SOX 404 and AS2 were met with heavy criticism for the cost of
implementation, especially in smaller or low risk accelerated filers who were subject to the same
rigor as larger, high risk accelerated filers. In fact, in one survey of corporate executives, 80%
stated that the costs of Sarbanes-Oxley outweighed the benefits (O’Sullivan, 2006).
The PCAOB agreed to revisit the standard related to audits of ICFR, and as a result, replaced
AS2 with AS5 effective for audits of accelerated filers with fiscal years ending on or after
November 15, 2007. AS5 was summarized by Christopher Cox, the SEC Chairman at the time,
to be different than AS2 in four major ways: (1) AS5 is shorter and less prescriptive, (2) AS5 is
more flexible in its implementation to allow the audit to be tailored toward the size and
complexity of the audited firm, (3) AS5 directs the auditors towards a top-down, risk based
approach, focusing auditors on the areas of highest risk and eliminating unnecessary procedures,
and (4) AS5 includes a principles-based approach regarding the extent to which the auditor can
use the work of others (Cox 2007).
The introduction of AS5’s risk-based approach was not met with unanimous support,
however. Certain PCAOB board members and comment letter-writers questioned whether AS5
would reduce work at the expense of quality, and whether AS5 would be perceived as a
“relaxation” of AS2, and thus an abandoning of the objectives set forth in AS2 (Johnson, 2007).
Research has documented a decline in audit fees with the implementation of AS5 consistent with
a reduction in audit effort; however, this does not necessarily indicate a lower quality audit of
internal controls or lower financial reporting quality. Doogar, Sivadasan, and Solomon (2010),
for example, examine how the top-down, risk-based approach of AS5 affects the relation
between audit risk and audit fees. They find that in the AS5 period, audit fees are more closely

8
linked to auditee fraud risk, which they suggest is consistent with AS5 improving the alignment
of auditing effort and client risk as intended. Krishnan, Krishnan, and Song (2011), also find
lower fees for lower risk clients. While these studies examine the possible efficiency benefits of
AS5, they do not investigate the potential disadvantage that auditors may be less likely to
identify deficiencies under a risk-based approach if their risk assessment is inadequate or not
properly implemented.
The PCAOB monitored audit firm implementation of AS5 and issued Staff Audit Practice
Alert No. 11 to report on common issues in performing integrated audits under the new standard
(PCAOB, 2013). They identified deficiencies in internal control audits including failures to
identify and/or sufficiently test controls designed to address the risk of material misstatement,
management review controls, and controls over system-generated data, as well as failures to
sufficiently evaluate identified control deficiencies, and failures to update control testing
between an interim date and year-end. The PCAOB notes that one potential “root cause” for the
identified deficiencies is a failure to properly implement the top-down, risk-based approach.
AS5 increased the amount of judgment in the auditor’s testing of ICFR by requiring that
auditors select which controls to test based on the risks of material misstatement, as opposed to
consistently testing all controls. In addition, significant judgment continues to be required under
AS5 in evaluating the severity of each control deficiency to determine whether the deficiencies,
individually or collectively, constitute a significant deficiency or a MW (PCAOB, 2007; SEC,
2007).3 To the extent auditors are not properly implementing the risk-based approach, as the
PCAOB has criticized, existing control deficiencies may not be detected. Even for detected
deficiencies, auditors may not be considering the appropriate risks in determining the
3 A significant deficiency is defined by the SEC as a deficiency, or a combination of deficiencies in internal
control over financial reporting that is less severe than a material weakness yet important enough to merit attention
by those responsible for oversight of a registrant’s financial reporting (SEC 2007).

9
classification of the control deficiency. Further, the importance of properly evaluating
misstatement risk associated with control deficiencies increases as testing is reduced because the
control testing is less likely to uncover instances where actual misstatements occur.
Consistent with concerns that AS5 was a relaxation of auditing standards, the rate of MW
disclosures has declined from an initial rate of 16.9% in 2004 under AS2 to a rate of 2.4% in
2009 under AS5 (Audit Analytics, 2010b). Such concerns are exacerbated by the fact that more
than half of the companies that restate their financial statements originally indicated their ICFR
were effective during the misstated period (Rice and Weber, 2012). Brian Croteau, Deputy
Chief Accountant at the SEC, noted in a speech “…I continue to question whether all material
weaknesses are being properly identified. It is surprisingly rare to see management identify a
material weakness in the absence of a material misstatement. This could be either because the
deficiencies are not being identified in the first instance or otherwise because the severity of
deficiencies is not being evaluated appropriately” (Croteau, 2013).
On the other hand, it is possible that AS5 has actually increased the likelihood that auditors
identify and properly classify control deficiencies if they are appropriately focused on the areas
with a greater risk of material misstatement. The declining trend in material weakness
disclosures could be the result of a decline in the existence of MWs as companies strengthen
their ICFR over time rather than due to a failure by management and auditors to identify or
properly classify existing MWs. A declining rate in the underlying existence of material
weaknesses is consistent with the declining trend in the number of restatements between 2006
and 2009 (Audit Analytics, 2010a). Further, the view that AS5 could increase material weakness
detection is consistent with SEC statements that AS5 would eliminate unnecessary audit work
and increase focus on important areas (SEC, 2007).

10
2.2 Impact on financial reporting quality
To the extent management and auditors are failing to identify or properly classify control
deficiencies, financial reporting quality may decline. Prior research has documented significant
financial reporting benefits attributable to SOX 404 including substantially improved control
environments (Miller and Rittenburg, 2005), higher quality accruals (Ashbaugh-Skaife et al.,
2008; Cohen, Dey and Lys, 2008; Doyle, Ge, and McVay 2007a), lower information risk and
lower cost of equity (Ashbaugh-Skaife, Collins, Kinney, and LaFond, 2009), provision of new
information to the public debt market (Dhaliwal, Hogan, Trezevant, and Wilkins, 2011), and
improved investors’ assessments of reporting credibility for firms admitting to accounting errors
through restatements (Hirschey, Smith, and Wilson, 2012). Two recent surveys indicate that a
majority of corporate insiders who have had experience with SOX believe that the internal
control over financial reporting structure in their organizations and the overall quality of the
information environment have improved since compliance with SOX 404 became a requirement
(Alexander, Baugess, Bernile, Lee, and Marietta-Westberg, 2013; Cohn, 2012). It is possible
that these benefits will continue under AS5, or it is possible the benefits will diminish if control
testing is less rigorous. Interestingly, Alexander et al. (2013) find that firms perceive the net
benefit of Section 404 to be higher following the implementation of AS5, but this is likely due to
the decrease in costs.
Consistent with the concerns related to financial reporting quality, the PCAOB notes the
following in regards to their inspection findings when they analyze the combined results of ICFR
audit deficiencies and financial statement audit deficiencies (PCAOB, 2013):
“Deficiencies in audits of internal control also can affect the audit of the financial
statements. In integrated audits, auditors often rely on controls to reduce their substantive
testing of financial statement accounts and disclosures. Thus, deficiencies in testing and
evaluating internal control can lead to inadequate testing of accounts and disclosures in

11
the financial statement audit. The general inspection report notes that, in 39 of the 46
engagements (85 percent) in which the inspection staff found that the firm did not have
sufficient appropriate evidence to support the firm's internal control opinion, representing
13 percent of the 309 integrated audit engagements that were inspected, inspection staff
found that the firm also failed to obtain sufficient appropriate evidence to support its
opinion on the financial statements.”
Thus, it appears the PCAOB is concerned about financial reporting quality as a result of
deficiencies identified in the audits of internal controls.
In an early study, Wang and Zhou (2012) provide preliminary evidence that financial
reporting quality, as measured by absolute value of abnormal accruals, remained the same under
AS5. However, their sample is limited to only one year before and after the implementation of
AS5 and to only firms that have data in both years. These sample restrictions suggest that the
measures of financial reporting quality in the AS5 sample period could be confounded by the
carry-over effects from the AS2 period and may not hold as we move further from the AS2
period.
2.3 Hypotheses development
The trends in MW disclosures discussed above suggest a decline in the identification of MWs
in the AS5 period relative to the AS2 period. However, it is not clear whether the downward
trend is due to a decline in the existence of MWs or in the detection/classification and disclosure.
It is possible that the decline in MW identification is simply due to firms improving their internal
controls as they gain experience under SOX 404. If auditors are adept at implementing the risk-
based approach of AS5, then the likelihood of disclosing a MW in the AS5 period, after
controlling for the likelihood of MW existence, will remain the same as in the AS2 period or
possibly even increase as more resources can be directed to the areas of greatest concern. If
auditors are less adept at implementing the risk-based approach, however, then the likelihood of
12
disclosing an existing MW will be lower compared to the AS2 period. Our first hypothesis
related to the likelihood of disclosing existing MWs is stated in the null form.
H1. There is no change in the likelihood of disclosing existing MWs between the AS2 and AS5
periods.
More important than whether there has been a change in the likelihood of disclosing existing
material weaknesses is whether unidentified MWs are related to firms’ financial reporting
quality. Consistent with the arguments above, the relation between unidentified MWs and
financial reporting quality could become stronger, weaker, or remain the same under AS5.
Examining financial reporting quality provides a more direct test of the effects of adopting the
AS5 standard from a financial statement user’s perspective and provides additional evidence on
whether changes in the MW disclosure rates are related to an underlying change in the existence
or in the detection and disclosure of MWs. Our second hypothesis related to financial reporting
quality is also stated in the null form.
H2. There is no change in the relation between unidentified MWs and financial statement
misstatements from AS2 to AS5.
3. Research Design
3.1 Determinants of material weakness existence, detection, and disclosure
Prior research examining determinants of weaknesses in internal control are linked by several
common themes and similar variables. We draw on the variables used in prior studies, primarily
Ashbaugh-Skaife et al. (2007) and Doyle et al. (2007b) to estimate a model of MW disclosure.
We include proxies for both the likelihood of MW existence as well as for the likelihood of a
MW to be detected and disclosed. Our logistic regression estimating the model is as follows.
MWFirm = β0 + β1LnSize + β2LnAge + β3#404Reports + β4Segments + β5Foreign_Trans

13
+ β6MandA + β7Restructure + β8Inventory + β9RGrowth + β10PropLoss
+ β11ShumRank + β12Auditor_Resign + β13Auditor + β14Restate
+ β15Inst_Con + β16Litigation + ε (1)
We first estimate the model for our entire sample and include an indicator variable for
observations in the AS5 period in order to test H1, and then we estimate our model
separately for the AS2 period and AS5 period, and test for differences in coefficients
across the periods. The dependent variable, MWFirm, equals one for firms disclosing a
material weakness in ICFR, and zero otherwise. Explanatory variables are discussed
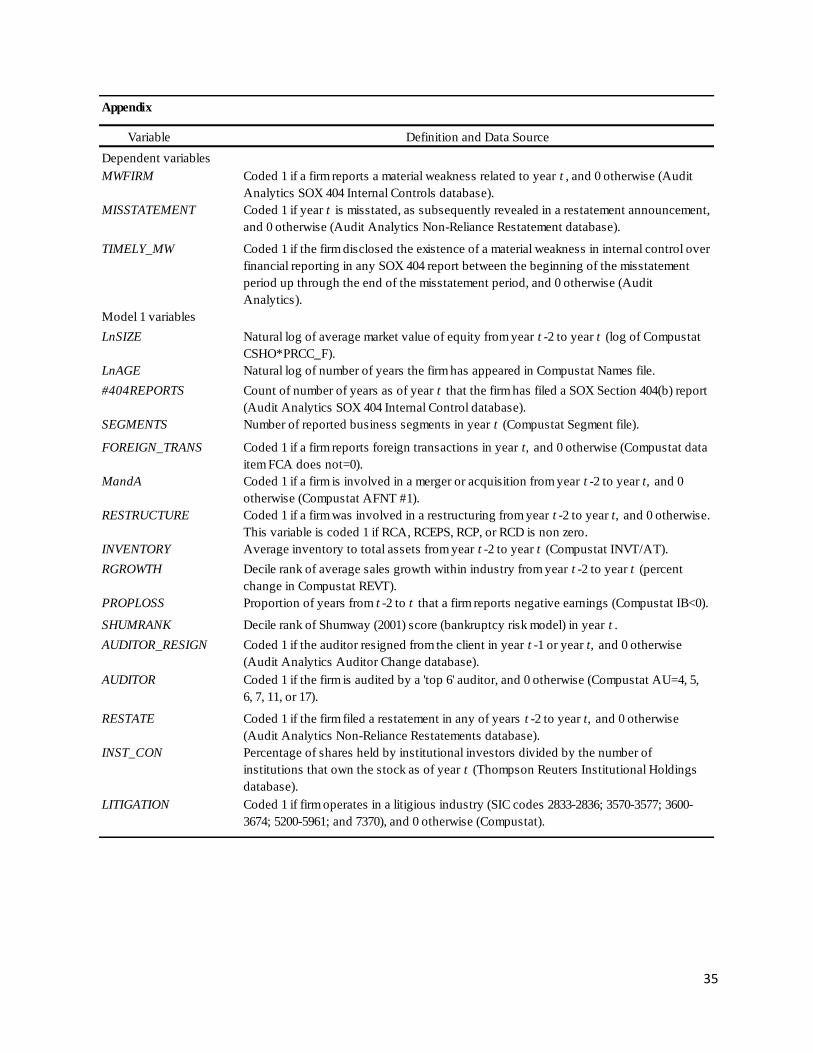
below and complete definitions for all variables are available in the Appendix.
We include in our model variables that prior studies have used to proxy for the risk of MW
existence. These variables include measures of firm complexity and stability. Prior research has
found that larger and older firms are less likely to have control deficiencies (Ashbaugh-Skaife et
al., 2007; Doyle et al., 2007b), perhaps because these firms have more resources to invest in
internal control and have had more time to develop a strong control system. We use natural logs
of firm size, as measured by market value of equity (LnSize), and firm age (LnAge) to proxy for
firms’ investment in and development of internal controls. Additionally, we attempt to capture
the likelihood of existence of a MW based on how often a firm has been subject to integrated
audits. Longer exposure to AS2 and/or AS5 results in more opportunities to detect and
remediate any deficiencies in internal control. Therefore, we posit that existence and disclosure
of MWs will be decreasing in the number of years a firm undergoes ICFR audits under SOX 404
(#404Reports).4
4 In selecting our sample we only consider auditor reports (indicated as type “A” in Audit Analytics). We
acknowledge that some firms may have filed management reports (as indicated by being type “M” in Audit
Analytics) prior to filing auditor reports and have therefore likely identified and remediated material weaknesses;
however, we are interested in observations where the firm is subject to an integrated audit.

14
The need for internal controls is unique to each firm’s particular operating environment and
the likelihood of deficiencies in internal control has been shown to increase in the complexity of
operations (Ashbaugh-Skaife et al., 2007; Doyle et al., 2007b). We examine complexity by
considering the scope of a firm’s operations, recent changes in reporting entity, accounting
measurement risk, and extent of firm’s resources invested in internal controls (Ashbaugh-Skaife
et al., 2007). The scope of a firm’s operations is measured by the number of reported business
segments (Segments) and the existence of foreign transactions (Foreign_Trans). A recent
change in reporting entity is measured by an indicator of whether the firm has been involved in
either a merger or acquisition (MandA) or a restructuring (Restructure) from year t-2 to year t.
Accounting measurement risk is likely to increase when firms have difficult-to-measure items
such as inventory or when their investment in internal controls is not able to keep pace with
growth. Thus, we use the average of inventory, scaled by total assets (Inventory) and the decile
rank of within-industry average sales growth (RGrowth) from year t-2 to year t to proxy for
accounting measurement risk. We also use proxies for constraints on internal control investment
including profitability, as measured by the proportion of the previous three years a firm has
experienced a loss (PropLoss) and the decile rank of a measure of financial distress (ShumRank)
(Ashbaugh-Skaife et al., 2007; Doyle et al., 2007b). Finally, recent auditor turnover can be a
signal that the auditor either believes an internal control system is weak or considers the risks of
auditing the client to outweigh the benefit from the revenues. Thus, we include an indicator of
whether an auditor has resigned between year t-1 and year t (Auditor_Resign).
Also consistent with prior research, we consider variables that motivate MW detection and
disclosure. These variables include proxies for auditor size, regulatory oversight in financial
reporting due to prior restatements, monitoring by institutional investors, and industry litigation
15
risk (Ashbaugh-Skaife et al., 2007). We use an indicator variable for companies using one of the
six largest audit firms (Auditor) because large audit firms have been shown to face a greater
reputation (DeAngelo, 1981) and litigation risk (Dye, 1993) and thus, have stronger incentives to
detect and disclose existing MWs.5 A firm that has had a financial statement restatement in
recent years is more likely to be subject to regulatory monitoring, thus auditors’ incentives to
detect and disclose subsequent MWs should be higher in firms following restatements. We
measure restatement history (Restate) as an indicator of whether a firm has filed a restatement
per the Audit Analytics Non-reliance Restatements database between year t-2 and year t
(Ashbaugh-Skaife et al., 2007). Ashbaugh-Skaife et al. (2007) find that the propensity to
disclose a MW is increasing in the concentration of institutional ownership of the firm’s stock.
Thus, we use institutional ownership (Inst_Con) measured as the percentage of shares held by
institutional investors divided by the number of institutions that own the stock as of year t.
Finally, managers of firms in litigious industries have a greater incentive to detect and disclose
MWs to reduce the risk of lawsuit which we proxy for, based on litigious industries (Litigation)
as identified by Ashbaugh-Skaife et al. (2007) and Francis et al. (1994).6
3.2 An alternative approach to controlling for existence of a material weakness
As an alternative approach to controlling for the existence of a MW using the number of
Section 404(b) reports, we estimate a model focusing on firm-year observations where a MW is
known to exist and then examine the likelihood of detection and disclosure. This approach is
similar to the one used in Rice and Weber (2012). We focus on the subsample of restatements
where the company discloses a “related” MW either during the misstated period or subsequently.
5 We base this classification on the largest six audit firms as of 2003. These audit firms include PWC, Deloitte
& Touche, Ernst & Young, KPMG, Grant Thornton and BDO Seidman. We also review univariate differences and
estimate our logistic regressions using the Big 4 audit firms and find no significant difference in our results. 6 Firms operating in litigious industries are identified by SIC codes 2833-2836; 3570-3577; 3600-3674; 5200-
5961; and 7370.
16
Rice and Weber (2012) note that not all restatements are associated with a material weakness in
internal controls, and thus a restatement is not necessarily evidence that a MW exists or existed.
In cases where the restatement is associated with a MW, the company will either disclose a
related MW during the misstated period, or disclose after the fact that a MW existed. We are
interested in the likelihood that a MW is disclosed in a timely manner (during the misstated
period), and thus our model, based on Rice and Weber (2012), includes variables that proxy for
the incentives to detect and disclose a MW.
TimelyMW = γ0 + γ1PrevRestate + γ2LnSize + γ3Loss + γ4XFin + γ5Big4
+ γ6Audit_Fees + γ7NonAudit_Fees + γ 8AuditorChange + γ9MgtChange
+ γ10AS5 + ε (2)
We estimate this regression for misstated firm-years with related MWs. Using Audit
Analytics material weakness and restatement codes, we consider a MW to be related to the
restatement if at least one of the MW reason codes matches at least one of the restatement codes
(e.g. both mention revenue recognition). If the related MW was disclosed during the misstated
period, then TimelyMW is coded 1. Otherwise, if the related MW was disclosed at the time of the
restatement announcement or subsequently, we consider this to be a “late” disclosure of a related
MW, and TimelyMW=0.
The control variables are briefly discussed here and defined in more detail in the Appendix.
We include measures of firm size and profitability to control for a firm’s ability to invest in
internal control testing which in turn will increase the likelihood of timely detection of MWs.
However, as noted by Rice and Weber (2012), large firms and poorly performing firms may have
a disincentive to disclose existing MWs due to greater capital market pressures. Similarly, firms
in need of capital may have a disincentive to disclose existing MWs, and thus we include XFin to

17
capture the net change in financing activities. We expect a higher quality audit, and greater audit
effort to increase the likelihood of a timely MW disclosure, and include Big4 and Audit_Fees as
proxies for quality and effort. In addition, we include NonAudit_Fees; however, we do not make
a prediction on this variable as higher non-audit fees may signal greater investment in internal
controls or may signal a lack of auditor independence that would decrease the likelihood of
timely disclosure. Similar to Rice and Weber (2012), we expect recent auditor turnover and
recent management turnover to increase the likelihood of disclosure of existing MWs. Finally,
our variable of interest in this model is AS5, which is set equal to 1 if the end of the misstatement
period occurs on or after November 15, 2007. A negative (positive) coefficient on AS5 will
indicate that auditors are less (more) likely to detect or disclose a related MW on a timely basis
during the AS5 period.
3.3 Unidentified material weaknesses and financial reporting quality
We investigate how unidentified material weaknesses relate to financial reporting quality by
examining whether firm-years that are predicted to have a MW, but do not disclose one, are more
likely to be misstated. Specifically, we estimate the following logistic regression separately for
the AS2 and AS5 periods using firm-years where no material weaknesses were disclosed:
Misstatement = α0 + α1Predict_MW + α2LnSize + α3LnAge + α4#404Reports + α5RGrowth
+ α6PropLoss + α7ShumRank + α8MandA + α9Restructure + α10Lev
+ α11Litigation + α12Auditor + α13Auditor_Resign + ε (3)
Variables in Model (3) are discussed below and defined in the Appendix. The dependent
variable Misstatement captures whether the financial statements for the firm-year were
subsequently restated. The variable of interest in the model, Predict_MW, captures whether a

18
MW is expected for the firm-year based on the estimations of Model (1).7 We control for firm-
specific characteristics, such as firm size, complexity, profitability, and capital market pressures,
which prior literature find to be related to financial statement misstatements (e.g., Richardson et
al., 2003; Carcello and Nagy, 2004; Scholz, 2008; Czerney et al., 2013).
Prior research shows that firm size is positively associated with the likelihood of
misstatements during our sample period, and thus we include the natural log of the average
market value of equity (LnSize) as our measure of firm size (Scholz, 2008). We also include the
natural log of firm age (LnAge) because older firms are more likely to have a greater investment
in their internal controls. We include the number of Section 404(b) reports a company has filed
(#404Reports) as a measure of experience with integrated audits, and expect that companies
strengthen their internal controls with exposure to integrated audits, reducing the likelihood of
misstatement.
We control for profitability and other financial reporting pressures as managers of firms with
lower profitability and financial reporting pressures have stronger incentives to use aggressive
accounting (Scholz, 2008; Palmrose and Scholz, 2004; Richardson et al., 2003). We include
PropLoss to capture lower profitability and ShumRank to capture firms more at risk of going
bankrupt. We also include an indicator variable for merger and acquisition activity (MandA),
consistent with Palmrose and Scholz (2004), and a measure of financial leverage (Lev),
consistent with Richardson et al. (2003), to capture pressures associated with acquisition activity
and higher leverage. Managers of firms in litigious industries may have an incentive to avoid
misstatements, and thus, we include an indicator for firms in industries with a greater likelihood
of litigation (Litigation). We also include RGrowth to capture firms with extreme sales growth.
7 Note that we use Model 1 to develop firm-year MW predictions as Model 2 is limited to only the subsample of
observations with restatements and related MW disclosures. Model 1 allows us to develop a prediction for each
firm-year observation.

19
Misstatements have been found to be more likely for firms audited by a BigN auditor (Czerney
et al., 2013) and have also been found to be more likely in earlier years of audit firm tenure
(Carcello and Nagy, 2004; Czerney et al., 2013) as well as after a recent auditor resignation
(Boland et al., 2013). Thus, we include indicators for Auditor and Auditor_Resign to capture the
stability of the auditor-client relationship.
4. Sample Selection and descriptive statistics
4.1 Sample selection
As detailed in Table 1, Panel A, our sample of firms initially includes all accelerated filer
firm-year observations from the start of the AS2 period (fiscal year-ends ending after November
15, 2004) through 2011 with an auditor’s opinion on internal control as obtained from Audit
Analytics’ SOX 404 Internal Control Database, yielding 32,999 firm-year observations. We
merge this sample with Compustat to obtain financial information for our proxies of MW
determinants. Data requirements for these determinants reduce our overall sample of firm-year
observations to 17,223, of which 6,537 are from the AS2 period and 10,686 are from the AS5
period. In the AS2 period there are 923 MW disclosure observations (14.1% of the AS2
observations) and in the AS5 period there are 553 MW observations (5.2% of the AS5
observations).
4.2 Descriptive and univariate analyses
We present sample properties in Table 2. Table 2, Panel A presents descriptive statistics and
results for univariate tests comparing MW firm-year observations to non-MW firm-year (control)
observations. Consistent with prior research our proxies for MW existence indicate that MWs
are associated with smaller, younger firms that are more likely to show signs of financial
distress. Additionally, MW firm-years are more likely to be subject to an auditor resignation or

20
a restatement of financial statements and are less likely to occur for firms operating in litigious
industries. In contrast to Ashbaugh-Skaife et al. (2007), however, we find that MW firms are
less likely to employ one of the six largest auditors, have lower institutional ownership
concentration, and have fewer operating segments. Also, contrary to Doyle et al. (2007b) we do
not find significance on variables representing complexity, such as foreign transactions, mergers
and acquisition activity, and growth, although MW firm-years are more likely to report
restructuring activity and have a significantly higher mean value of average inventory to total
assets. These differences may result from our longer sample period, which captures
determinants of MWs under both AS2 and AS5. It may also indicate that firms with higher
detection and disclosure rates of MWs in the earlier years have remediated their MWs and, thus
now have a lower MW disclosure rate. As expected, MW observations are decreasing in the
number of years that the firm has been filing a 404(b) report.
Panel B of Table 2 shows the distribution of MWs classified as entity-level (ELCWeak)
versus those that relate to process-level, or account specific deficiencies (ProcessWeak). We
classify a MW as entity-level versus process based on the Audit Analytics codes.8 The
percentage of MWs classified as entity-level by year varies from 37.1% to 46.4% in the AS2
period and from 39.7% to 50.6% in the AS5 period, with an average of about 42% across all
years. There is no clear trend over time, however, suggesting the distribution of entity-level
versus process is similar across the AS2 and AS5 periods.
8 We classify a MW as entity-level if at least one of the weaknesses disclosed is in the following categories: (1)
non-routine transaction control issues (code 77); (2) journal entry control issues (code 76); (3) foreign, related party,
affiliated or subsidiary issues (code 38); (4) an ineffective, non‐existent or understaffed audit committee (code 11);
(5) senior management competency, tone, or reliability issues (code 13); (6) an insufficient or non‐existent internal
audit function (code 18); or (7) ethical or compliance issues (code 21). If none of these codes are present, we
classify the MW as a process-level weakness (Donelson et al., 2014).

21
5. Results of multivariate analyses
5.1 Determinants of material weakness existence and disclosure
We first estimate logistic regression equation (1) for our full sample of firm-years in order to
test H1, and then we separately estimate the model for the AS2 and AS5 time periods and test for
differences in coefficients to better understand differences in the determinants of MW
disclosures across the two standards.9 The results of estimating equation (1) for all firm-years
and including an AS5 indicator, presented in Table 3 Column 1 and 2, show that the sign and
magnitude of determinants of MWs are mostly consistent with prior research (Ashbaugh-Skaife
et al., 2007; Doyle et al., 2007b). Overall, observations with MWs tend to be more complex
(Segments, Foreign_Trans, MandA, Restructure, and Inventory), smaller, have a higher risk of
bankruptcy, and are more likely to have had a recent restatement or auditor resignation. In
addition, MW firms are less likely to use a top six audit firm, have lower institutional ownership,
and are less likely to be in a high litigation industry. We also find a significant and negative
coefficient on #404Reports suggesting the likelihood of disclosing a material weakness declines
over time as companies gain more experience with SOX 404 reporting and integrated audits. In
other words, even though the costs of AS2 in initial years have been documented to be high, it
appears that controls improve with exposure to the standards, consistent with the survey findings
of Alexander et al. (2013).
The coefficient on the AS5 indicator variable is negative and significant at p < 0.01,
suggesting a lower likelihood of MW disclosure in the AS5 period relative to the AS2 period,
even after controlling for the decrease in the existence of MWs due to longer exposure to ICFR
9 The area under the receiver operating characteristic curves for these regressions range from 0.73 to 0.79. Per
Hosmer and Lemeshow (2013, 177) ROC curve values between 0.7 and 0.79 suggest acceptable discrimination,
between 0.8 and 0.89 suggest excellent discrimination, and > 0.9 suggest outstanding discrimination.

22
audits (#404Reports). Thus, we reject the null hypothesis (H1) of no difference in likelihood
across the two periods. However, we note that the pooled model assumes the MW determinants
are constant across periods which may not be true given the changes in the standard related to
ICFR audits. Therefore, we estimate the MW determinants model separately for the AS2 and
AS5 periods, allowing the coefficients to vary, in order to better understand differences in the
determinants across the two periods.
Results of estimating model (1) in the AS2 (AS5) period are presented in Column 2 (3) of
Table 3 and are largely consistent with the pooled results in Column 1, although not all of the
same variable coefficients are significant. We focus on the results of the chi-square tests
comparing the coefficients across the AS2 and AS5 period to shed light on what is driving the
decrease in disclosure of MWs.10
In Column 4 of Table 3, we find significant differences across
periods for the coefficients on LnSize, #404Reports, and Litigation. The coefficients on LnSize
are negative and significant in both periods, but significantly more negative in the AS2 period
relative to the AS5 period. This indicates a slight reversal of the inverse relationship between
size and the likelihood of MWs observed in the AS2 period. One possible explanation is that the
disparity in control quality between smaller and larger firms is decreasing in the AS5 period.
Alternatively, auditors may be putting forth less effort to detect MWs in smaller client firms as a
result of the “scalability” aspect of AS5. While the standard is designed to make integrated
audits scalable for smaller firms, it is possible that a significant reduction in internal control
testing results in a lower MW detection rate.
In terms of litigation risk, being in a more litigious industry was not a significant determinant
of MW disclosures in the AS2 period. However, the negative coefficient on Litigation in the
AS5 period and the significant difference across periods indicates that the likelihood of a MW
10
This test is performed using Stata’s SUEST command.

23
disclosure is significantly lower in the AS5 period, relative to the AS2 period, for firms in these
industries. The negative coefficient could reflect either a decrease in the rate of MW existence in
these industries, or could reflect a reluctance to disclose a MW in these industries as a MW
disclosure increases the likelihood of litigation in the event of a financial statement restatement
(Hogan, Lambert, and Schmidt, 2013).
The significant difference in the negative coefficients on #404Reports is also interesting.
The effect of #404Reports on the propensity to disclose a MW is significantly less negative in
the AS5 period, relative to the AS2 period, consistent with firms previously subjected to AS2
already improving their controls under the more rigorous AS2 regime. The likelihood of a MW,
however, does not continue to go down with more integrated audits perhaps because at some
point the benefits have been fully achieved or because of the rate of improvement slows under
the AS5 standard. We also note that the intercept in the AS5 period is significantly lower than in
the AS2 period, suggesting a lower likelihood of MW disclosure in the AS5 period, even after
controlling for differences in the determinants of MW disclosure across the two periods.
5.2 The likelihood of timely disclosure of existing material weaknesses
The sample selection process for the observations used in estimating Model 2, our analysis of
timely versus late MW disclosure of existing MWs, is detailed in Table 4 Panel A. Out of the
900 unique restatement filings (1,476 misstatement firm-years) included in our primary sample,
359 of these (39.9%) are associated with a related material weakness in internal controls (i.e., a
MW related to the reason for the restatement was announced either during the misstated period
or subsequently). Of the 359 restatement observations, 151 (42.1%) of the MWs were disclosed
on a timely basis, i.e., during the misstated period, and the remaining 208 (57.9%) were
disclosed concurrent with or subsequent to the restatement announcement. Panel B of Table 4

24
presents the percentage of timely MW disclosures by year, and Panel C presents descriptive
statistics for the timely versus late disclosure observations.
The results of estimating the likelihood of a timely versus late disclosure of an existing MW
(Model 2) are presented in Table 5. We find results largely consistent with Rice and Weber
(2012), except the coefficients on LnSize and MgtChange are insignificant in our model. We find
that a prior restatement increases the likelihood of disclosing an existing MW on the timely
basis, as does greater audit investment (Audit_Fees). Less profitable firms and firms with a
recent auditor change are more likely to disclose an existing MW on the timely basis whereas
firms in need of financing and firms with a Big 4 auditor are less likely to disclose an existing
MW. The ratio of non-audit fees to the square root of total assets (Nonaudit_Fees) is negatively
associated with the likelihood of timely disclosure.
The coefficient on our variable of interest in this model, AS5, is negative and significant
suggesting a lower likelihood of disclosing an existing MW on a timely basis in the AS5 period
relative to the AS2 period. Overall, the results presented in Tables 3 and 5 suggest the likelihood
of MW detection/classification and disclosure is significantly lower in the AS5 period relative to
the AS2 period, using two different approaches of controlling for the existence of a MW.
5.3 Unidentified material weaknesses and financial reporting quality
The findings discussed above suggest a decrease in the likelihood of disclosing an existing
MW in the AS5 period relative to the AS2 period. The findings also suggest that this decrease is
due in part to changes in the association of certain firm characteristics with MW disclosures,
after controlling for the existence of a MW. These results raise concerns about whether there are
undetected and/or undisclosed MWs in the AS5 period as a result of changes in the integrated
audit approach, which has implications for financial reporting quality. In this section, we use the
25
MW determinants model (Model 1) results discussed above to develop predictions about which
companies are more likely to have undisclosed MWs. We then examine financial reporting
quality for these firms relative to firms that we predict do not have a MW (and do not disclose
one) both in the AS2 and AS5 periods.
To assess the predictive ability of the MW determinants models, and to generate predictions
about which firm-years are more likely to have undisclosed MWs (either because they were not
detected or not disclosed), we use coefficients from Model 1 estimated separately in the AS2 and
AS5 time periods to calculate a probability score for each firm-year observation.11
To convert
the probabilities into a 2x2 classification table, we need to have a “probability cutoff value” that
determines whether firms are likely to have a MW or not, and compare that to the actual
reporting of MWs. We determine the cutoff value for the AS2 period using the AS2
observations and probabilities, and the cutoff value for the AS5 period using the AS5
observations and probabilities. Companies with a probability greater than (lower than) the cutoff
value are classified as likely (not likely) to have a MW. Because we do not have any prior
expectations on the relative costs of Type I and Type II errors in this setting, we use the cutoff
value that maximizes both the sensitivity and the specificity of the model.12
The classification tables for the AS2 and AS5 periods are shown in Table 6. For the AS2
period, based on the probability cutoff value of 14.3%, the sensitivity (percent of correctly
predicted events) is 65.2% and specificity (percent of correctly predicted non-events) is 68.2%.
11
We retain variables in our MW prediction model that prior research has associated with MW detection and
disclosure. While these variables may have reflected incentives to detect and disclose MWs prior to SOX
(Ashbaugh-Skaife et al. 2007), they could also be considered to be incentives to remediate MWs in the post-SOX
period. 12
We follow Hosmer and Lemeshow (2013) and develop contingency tables based on the receiver operating
characteristic (ROC) curves. Per Hosmer and Lemeshow (2013) the ROC curve plots the probability of detecting
true signals (sensitivity) and false signals (1-specificity). For our tests, sensitivity represents the proportion of MW
firm-years that are accurately predicted while specificity represents the proportion of non-MW firm-years that are
accurately predicted. The cutoff probability value is the value that maximizes both sensitivity and specificity of the
model.
26
For the AS5 period, the probability cutoff value is not surprisingly lower (4.4%), which results in
a sensitivity of 76.1% and a specificity of 66.4%. In both periods, the determinants model
correctly classifies more than 65% of the MW observations.
We next examine financial reporting quality for firms in both periods that are predicted to
have a MW based on the determinants model, but do not report one. These observations
represent firm-years more likely to have undetected or undisclosed MWs which, if undetected,
could have resulted in undetected misstatements as well. To assess the relation between these
observations and financial reporting quality, we use financial statement misstatements
subsequently revealed through a restatement as evidence of poor financial reporting quality that
originally went undetected. We estimate a logistic regression of the likelihood of a financial
statement misstatement (Model 3) separately in the AS2 and AS5 time period and include an
indicator for the firm-years that are predicted to have a MW (but do not disclose one) based on
the classifications discussed above (Predict_MW=1).
The rates of misstatements across the two groups are reported in Table 7, Panel A, and the
associated regression results are reported in Panel B. Our variable of interest, Predict_MW, is
coded as 1 for firm-years that are predicted to have a MW but do not disclose one, and 0 for
firm-years that are not predicted to have a MW and do not disclose one. As shown in Panel A,
significantly higher percentages of Predict_MW=1 firm-years, 10.0% in the AS2 period and
6.3% in the AS5 period, are misstated compared to 8.1% and 4.7% control group (where MWs
are not predicted and not disclosed) firm-years.
Panel B of Table 7 presents the results of estimating Model 3 separately for the AS2 and AS5
time periods, including our variable of interest, Predict_MW. We first present the results of
estimating Model 3 without including a control for recent (within the prior two years)
27
restatement announcements (Columns 1 and 3), and then present the results when we include a
PrevRestate2 indicator variable (Columns 2 and 4), to highlight changes in inferences when we
consider the association between prior period restatements and current period misstatements.
The control group in this regression is all firm-years in the AS2 (AS5) period that were not
predicted to disclose a MW and did not disclose one, and thus the regression does not include
any firm-years where a MW was disclosed. The insignificant coefficient on Predict_MW in the
AS2 period (-0.047, p = 0.75) suggests that firm-years predicted to have a MW, but do not
disclose one (potential undisclosed MWs), are not significantly associated with misstatements in
those firm-years. In comparison, the results in Panel B Column 3 that are estimated during the
AS5 time period and without including PrevRestate2, suggest that firm-years that are more likely
to have a MW but do not disclose one are more likely to be misstated (Predict_MW = 0.295, p =
0.02).
When we include PrevRestate2 in the models, the coefficients on Predict_MW and
PrevRestate2 in the AS2 period are insignificant. In the AS5 period, the coefficient on
PrevRestate2 is positive and significant while the coefficient on Predict_MW becomes
insignificant. These findings indicate that recent restatements (announced in the prior two years)
are a significant predictor of misstatements in the current period, and the composite measure of
predicted MWs is no longer significantly associated with current period misstatements. This
result suggests that auditors underweight prior restatements as a risk factor in the AS5 period.
Recall the Table 5 results show that recent restatements increase the likelihood of a timely MW
disclosure for restatements with a related MW; however, the Table 7 results suggest that overall,
auditors still seem to be underweighting the information contained in a recent restatement and
issuing unqualified internal control opinions to these firms prematurely.

28
In terms of the control variables, we find that the likelihood of misstatements is positively
associated with restructuring activities and high litigation risk industries, but inversely associated
with the number of 404 reports in the AS2 period. The latter finding suggests that greater
experience with Section 404 results in a lower likelihood of misstatements. In the AS5 period,
the number of 404 reports is no longer significant, suggesting diminishing returns beyond a
certain number of years. In the AS5 period, misstatements are positively associated with
leverage, and inversely associated with the proportion of loss years and recent auditor
resignations. Note that, consistent with prior research, the restatement models do not have good
predictive ability in that the ROC curve scores are low (approximately 59%); however, the
Hosmer and Lemeshow (2000) goodness of fit test suggests the models are well specified (χ2 =
7.54 (6.98), p=0.48 (0.54) in the AS2 (AS5) periods).
Taken together, our results suggest that the firm characteristics associated with the disclosure
of a MW have changed in the AS5 period relative to the AS2 period, and that auditors may not
be identifying (or are identifying but not disclosing) MWs in the AS5 period that are associated
with a higher likelihood of a misstatement. This suggests auditors may be making more Type II
errors in the AS5 period. Specifically, auditors seem to be underweighting the positive
association between prior period restatements and the likelihood of current period misstatements.
Table 7, however, shows that firm-years with predicted MWs under AS5 are significantly more
likely to have misstatements, whereas firm-years with predicted MWs under AS2 are
not. Improvements in risk assessment, especially related to assessing risk following
restatements, may be able to reduce the likelihood of missed predictable MWs.
5.4 Sensitivity analyses
29
In this section, we explore the sensitivity of our results that link predicted, but undisclosed,
MWs to financial misstatements by considering alternative research designs. A key challenge in
this study is developing a proxy for MWs that exist, but are not detected and/or disclosed. In our
main analysis, we do this by modeling MW likelihood separately in the AS2 and AS5 periods
using determinants identified in prior research. Firms that are estimated to have a relatively high
probability of having a material weakness within a period, but do not disclose one, are included
in the Predict_MW=1 group (i.e., are assumed to have a higher likelihood of having an
unobserved material weakness in that period). An alternative design is to assume that the
determinants of MW existence have not changed between the AS2 period and the AS5 period
and that any difference between the periods is due to differences in MW detection and
disclosure. To implement this approach, we estimate a model of MW likelihood in the AS2
period and apply the parameter estimates from this model to firms in AS5 period to identify
potential undisclosed MWs.
In untabulated results, we find that the sensitivity for the AS2 classification model applied in
the AS5 period is only 34.4% compared to 76.1% for the classification model estimated within
the AS5 period. This result indicates that the AS2 classification model is less accurate at
identifying MWs in the AS5 period than the AS5-based model, likely due to changes in the
determinants of MWs between the periods. When we use AS2-predicted MWs in the
misstatement regression (untabulated), we find the coefficient on Predict_MW is insignificant,
which is unsurprising given that they are less likely to represent actual undisclosed MWs.
We also explore the sensitivity of our results to alternative cutoffs for classifying firms by
their likelihood of having MWs. We classify firms as more likely to have MWs
(Predict_MW=1) if they are in the top quintile of estimated MW likelihood, rather than using the
30
cutoff that maximizes sensitivity and specificity. The untabulated classification table shows a
reduction in the sensitivity of the classifications relative to our main analysis in both periods, but
higher specificity indicating the top quintile cutoff does a better job classifying non-MW
observations. This is not surprising given that the top quintile cutoff predicts fewer MWs
overall. If we estimate the likelihood of a misstatement model for the subset of firms that do not
disclose a MW (untabulated), we find results similar to those presented in Table 5 for our
variables of interest in the AS5 period. However, in the AS2 period, the coefficient on
Predict_MW becomes negative and significant while the coefficient on PrevRestate in the AS2
period becomes significantly positive. Overall, our inferences remain the same that auditors
appear to underweight the information contained in prior restatements as it relates to the
likelihood of current period misstatements in the AS5 period.
6. Conclusion
In this study, we investigate changes in the likelihood and determinants of MW disclosure
from the AS2 period to the AS5 period, and the implications for financial reporting quality. Our
results show that MWs are less likely to be identified in the AS5 period after controlling for the
existence of MW using two different methods. Further, we document several changes in MW
disclosure determinants. We find that the decrease in the likelihood of MW disclosures in the
AS5 period is in part associated with certain firm characteristics including size, litigation risk,
and the extent of previous exposure to ICFR audits. Thus, even though the costs of AS2 in initial
years have been documented to be high, it appears that controls improve with exposure to
integrated audits, though the rate of improvement may be slowing under AS5. We also find
some evidence that financial reporting quality decreased under AS5 in that financial statement

31
misstatements are related to predictable, but unidentified MWs in the AS5 period, but not in the
AS2 period.
Our results have implications for practitioners and regulators, as well as for literature
examining the effectiveness of the AS5 standard. Though certain determinants of MW
disclosure may be receiving increased attention in the AS5 period, auditors, managers, and
financial statement users should realize that it is possible that auditors may not be focusing their
risk-based control testing on certain other risky areas, thus contributing in some cases to lower
rates of MW identification. It is important to realize, however, that auditors may be able to
improve their risk assessment of internal control issues because financial misstatements are
related to MWs that are predictable based on firm attributes. Studies exploring whether AS5
leads to efficiencies relative to AS2 should consider the evidence that determinants of MW
disclosure and financial reporting quality may not have remained the same in the years following
the implementation of AS5.

32
References
Alexander, C.R., Bauguess, S.W., Bernile, G., Lee, Y-H.A., Marietta-Westberg, J., 2013. Economic
effects of SOX Section 404 compliance: a corporate insider perspective. Journal of Accounting
and Economics 56, 267-290.
Ashbaugh-Skaife, H., Collins, D., Kinney, W., 2007. The discovery and reporting of
internal control deficiencies prior to SOX-mandated audits. Journal of Accounting and
Economics 44, 166-192.
Ashbaugh-Skaife H., Collins, D., Kinney, W., LaFond, R., 2008. The effect of SOX internal control
deficiencies and their remediation on accrual quality. The Accounting Review 83 (1), 217–250.
Ashbaugh-Skaife, H., D. W. Collins, W. R. Kinney, Jr., R. LaFond., 2009. The effect of SOX internal
control deficiencies on firm risk and cost of equity. Journal of Accounting Research 47 (1), 1–43.
Audit Analytics. 2010a. 2009 Financial restatements: a nine year comparison. (February).
Audit Analytics. 2010b. SOX 404 dashboard year 6 update. (October).
Bedard, J.C. and L. Graham. 2011. Detection and severity classifications of Sarbanes-Oxley Section 404
internal control deficiencies. The Accounting Review 86 (3), 825-855.
Boland, C., Bronson, S., Hogan, C., 2013. Accelerated filing deadlines, internal controls, and
financial statement quality: the case of originating misstatements. Working Paper. Michigan
State University, The University of Kansas.
Carcello, J., Nagy, A.L., 2004. Audit firm tenure and fraudulent financial reporting. Auditing: A
Journal of Practice and Theory 23 (2),55-69.
Cohen, D., Dey, A., Lys, T., 2008. Real and accrual-based earnings management in the pre-and
post-Sarbanes Oxley periods, The Accounting Review (83), 757-787.
Cohn, M., 2012. Internal controls improved since Sarbanes-Oxley. Accountingtoday.com. June 5,
2012. Available at: http://www.accountingtoday.com/news/Internal-Controls-Improved-
Sarbanes-Oxley-62863-1.html
Cox, C., 2007. Remarks to the annual meeting of the association of audit committee members.
Web site, http://www.sec.gov/news/speech/2007/spch060107cc.htm.
Czerney, K., Schmidt, J., Thompson, A., 2013. Does auditor explanatory language in unqualified audit
reports reflect financial misstatement risk? Working Paper. University of Illinois-Urbana
Champaign, University of Texas at Austin
DeAngelo, L., 1981. Auditor size and accrual quality. Journal of Accounting and Economics 3, 183–200.
Croteau, B.T., 2013. Remarks before the 2013 AICPA national conference on current SEC and PCAOB
developments – audit policy and current auditing and internal control matters. (December 9),
SEC.
Dhaliwal, D., Hogan, C., Trezevant, R., Wilkins, M., 2011. Internal control disclosures, monitoring, and
the cost of debt. The Accounting Review 86 (4), 1131-1156.
Dodd-Frank Wall Street reform and Consumer Protection Act. (2010) Public Law No. 111-203.
Washington D.C. Government printing office. Available at:
http://www.gpo.gov/fdsys/pkg/PLAW-111publ203/html/PLAW-111publ203.htm
Donelson, D., Ege, M., McInnish, J.M. 2014. Internal control weaknesses and financial reporting fraud.
Working Paper. University of Texas at Austin, University of Florida.
Doogar, R., Sivadasan, P. M., Solomon, P. I., 2010. The regulation of public company auditing:
evidence from the transition to AS5. Journal of Accounting Research 48, 795–814.
Doyle, J., Ge, W., McVay, S., 2007a. Accrual quality and internal control over financial reporting.
The Accounting Review 82 (5), 1141-1170.
Doyle, J., Ge, W., McVay, S.,,2007b. Determinants of weaknesses in internal control over
financial reporting. Journal of Accounting and Economics 44, 193-223.
Dye, R., 1993. Auditing standards, legal liabilities, and auditor wealth. Journal of Political Economy 101,
887–914.

33
Francis, J., Philbrick, D., Schipper, K., 1994. Shareholder litigation and corporate disclosures.
Journal of Accounting Research 32, 137-164.
Hirschey, M., Smith, K., Wilson.,W., 2012. Financial reporting credibility after SOX:
evidence from earnings restatements. Working Paper. University of Kansas, Utah Valley
University, and Southern Methodist University.
Hogan, C., Lambert, T., Schmidt,J., 2013. Do management internal control certifications increase
the likelihood of restatement-related litigation? (April 24, 2013). Available at SSRN:
http://ssrn.com/abstract=2169553 or http://dx.doi.org/10.2139/ssrn.2169553
Hosmer, D., Lemeshow, S., 2013. Applied logistic regression. New York: Wiley.
Johnson, C. 2005. Public companies complain to SEC about audit costs. Washington Post (April 9),
E01.
Johnson, S., 2007. AS5: more flexible, less effective? CFO.com, February 23, 2007.
Available at :http://www.cfo.com/article.cfm/8756854/1/c_2984368
Krishnan, J., Krishnan, J., Song, H., 2011. The effect of Auditing Standard No. 5 on audit fees.
Auditing: A Journal of Practice and Theory 30 (4), 1–27.
Miller, P., Rittenburg, L., 2005. Sarbanes-Oxley Section 404 work: looking at the benefits.
The Institute of Internal Auditors Research Foundation. Available at:
www.theiia.org/download.cfm?file=343
O’Sullivan, K., 2006. The case for clarity. CFO (September 1), 64–69. Available at:
http://www.cfo.com/article.cfm/7851741/c_7873404.
Palmrose, Z.-V., Scholz, S., 2004. The circumstances and legal consequences of non-GAAP reporting:
Evidence from restatements. Contemporary Accounting Research 21, 139-180.
Public Company Accounting Oversight Board (PCAOB), 2004. Auditing Standard No. 2: An
Audit of Internal Control Over Financial Reporting Performed in Conjunction With an Audit of
Financial Statements. Available at:
http://www.pcaobus.org/Rules/Rules_of_the_Board/Auditing_Standard_2.pdf.
Public Company Accounting Oversight Board (PCAOB), 2006. An Audit of Internal Control Over
Financial Reporting That Is Integrated with an Audit of Financial Statements and Related Other
Proposals. Auditing Standard No. 5. Available at:
http://pcaobus.org/Rules/Rulemaking/Pages/Docket021.aspx
Public Company Accounting Oversight Board (PCAOB), 2007. Auditing Standard No. 5: An Audit of
Internal Control Over Financial Reporting That Is Integrated with An Audit of Financial
Statements. Available
athttp://www.pcaobus.org/Rules/Rules_of_the_Board/Auditing_Standard_5.pdf.
Public Company Accounting Oversight Board (PCAOB), 2013. Considerations for Audits of Internal
Control over Financial Reporting. October 24, Washington, D,C.
Rice, S., Weber, D., 2012. How dffective is internal control reporting under SOX 404?
determinants of the (non-)disclosure of existing material weaknesses. Journal of Accounting
Research. 50 (3), 811-843
Richardson, S., Tuna, I., Wu, M., 2003. Predicting earnings management: the case of earnings
restatements. Unpublished Working Paper, University of Pennsylvania and Hong Kong
University of Science and Technology.
Sarbanes Oxley Act (SOX), 2002. Public Law No. 107-204. Washington, D.C. Available at:
http://www.sec.gov/about/laws/soa2002.pdf
Scholz, S., 2008. The changing nature and consequences of public company financial restatements: 1997-
2006. The Department of the Treasury.
Securities and Exchange Commission (SEC), 1988. Disclosure amendments to Regulation S-K, form 8-
K and schedule 14A regarding changes in accountants and potential opinion shopping
situations, financial reporting release No. 31 (April), SEC docket 1140–1147. Washington,
DC.
Securities and Exchange Commission (SEC), 2005. Roundtable discussion on implementation of

34
internal control reporting provisions. April 13. Available at:
http://www.sec.gov/spotlight/soxcomp/soxcomp-trans.txt.
Securities and Exchange Commission (SEC), 2007. SEC approves PCAOB Auditing Standard No. 5
regarding audits of internal control over financial reporting; adopts definition of ‘‘significant
deficiency.” Washington, D.C., July 25. Available at:
http://www.sec.gov/news/press/2007/2007-144.htm
Shumway, T., 2001. Forecasting bankruptcy more accurately: a simple hazard model. The Journal of
Business 74, 101-124.
Wang, D., Zhou J., 2012. The Impact of PCAOB Auditing Standard No. 5 on audit fees and audit
quality. Accounting Horizons 26 (3), 493-511.
Whitehouse, T., 2010. SEC curious about drop in material weaknesses: SEC staff wondering if
material weakness decline means better controls or weaker auditing processes. Compliance
Week, February 1.
35
Appendix
Variable Definition and Data Source
Dependent variables
MWFIRM Coded 1 if a firm reports a material weakness related to year t , and 0 otherwise (Audit
Analytics SOX 404 Internal Controls database).
MISSTATEMENT Coded 1 if year t is misstated, as subsequently revealed in a restatement announcement,
and 0 otherwise (Audit Analytics Non-Reliance Restatement database).
TIMELY_MW Coded 1 if the firm disclosed the existence of a material weakness in internal control over
financial reporting in any SOX 404 report between the beginning of the misstatement
period up through the end of the misstatement period, and 0 otherwise (Audit
Analytics).
Model 1 variables
LnSIZE Natural log of average market value of equity from year t -2 to year t (log of Compustat
CSHO*PRCC_F).
LnAGE Natural log of number of years the firm has appeared in Compustat Names file.
#404REPORTS Count of number of years as of year t that the firm has filed a SOX Section 404(b) report
(Audit Analytics SOX 404 Internal Control database).
SEGMENTS Number of reported business segments in year t (Compustat Segment file).
FOREIGN_TRANS Coded 1 if a firm reports foreign transactions in year t, and 0 otherwise (Compustat data
item FCA does not=0).
MandA Coded 1 if a firm is involved in a merger or acquisition from year t -2 to year t, and 0
otherwise (Compustat AFNT #1).
RESTRUCTURE Coded 1 if a firm was involved in a restructuring from year t -2 to year t, and 0 otherwise.
This variable is coded 1 if RCA, RCEPS, RCP, or RCD is non zero.
INVENTORY Average inventory to total assets from year t -2 to year t (Compustat INVT/AT).
RGROWTH Decile rank of average sales growth within industry from year t -2 to year t (percent
change in Compustat REVT).
PROPLOSS Proportion of years from t -2 to t that a firm reports negative earnings (Compustat IB<0).
SHUMRANK Decile rank of Shumway (2001) score (bankruptcy risk model) in year t .
AUDITOR_RESIGN Coded 1 if the auditor resigned from the client in year t -1 or year t, and 0 otherwise
(Audit Analytics Auditor Change database).
AUDITOR Coded 1 if the firm is audited by a 'top 6' auditor, and 0 otherwise (Compustat AU=4, 5,
6, 7, 11, or 17).
RESTATE Coded 1 if the firm filed a restatement in any of years t -2 to year t, and 0 otherwise
(Audit Analytics Non-Reliance Restatements database).
INST_CON Percentage of shares held by institutional investors divided by the number of
institutions that own the stock as of year t (Thompson Reuters Institutional Holdings
database).
LITIGATION Coded 1 if firm operates in a litigious industry (SIC codes 2833-2836; 3570-3577; 3600-
3674; 5200-5961; and 7370), and 0 otherwise (Compustat).

36
Appendix (continued)
Variable Definition and Data Source
Model 2 additional variables
PREVRESTATE Coded 1 if the firm filed a restatement in either year t-2 or year t-1 from the end of the
misstatement period, and 0 otherwise (Audit Analytics Non-Reliance Restatements
database).
SIZE Natural log of the total market value of common equity at the end of the misstatement
period (Compustat CSHO x PRCC_F)
LOSS Coded 1 of the firm reports a loss in the final year of the misstatement period, and 0
otherwise (Compustat IB<0).
XFIN Sum of cash received from the sale of stock and issuance of long-term debt, minus cash
used in repurchase of stock, payment of dividends, and reduction of debt (Compustat;
SSTK+DLTIS-PRSTKC-DV-DLTR+DLCCH), measured over the first fiscal year after the
misstatement period and scaled by average total assets (Compustat AT).
BIG4 Coded 1 if the firm is audited by a Big 4 auditor, and 0 otherwise (Compustat AU=4, 5, 6,
or 7).
AUDIT_FEES Audit fees (Audit Analytics Audit Fees database), scaled by the square root of total
assets, for the final year of the misstatement period
NONAUDIT_FEES Total non-audit fees paid to the outside audit firm (Audit Analytics Audit Fees
database), scaled by the square root of total assets, for the final year of the
misstatement period.
AUDITOR_CHANGE Coded 1 if the firm experienced an auditor change within the two-year window prior to
the end of the misstatement period, and 0 otherwise (Audit Analytics Auditor Changes
database).
MGMT_CHANGE Coded 1 if the firm experienced a CEO or CFO change within the two-year window prior
to the end of the misstatement period, and 0 otherwise (Audit Analytics Director and
Officer Changes database).
AS5 Coded 1 if the end of the misstatement period occurs on or after November 15, 2007, and
0 otherwise.
Model 3 additional variables
PREDICT_MW Coded 1 if observation is an incorrectly predicted material weakness. These are
observations for which a MW was predicted based on a ROC curve classification, but a
MWdid not occur. Coded 0 if it is an observation where no MW was predicted and no
MW was disclosed.
PREVRESTATE2 Coded 1 if the firm filed a restatement in either year t -2 or year t-1, and 0 otherwise
(Audit Analytics Non-Reliance Restatements database).
LEV Firm leverage in year t measured as long-term debt (Compustat DLTT+DLC) divided by
total assets (Compustat AT).
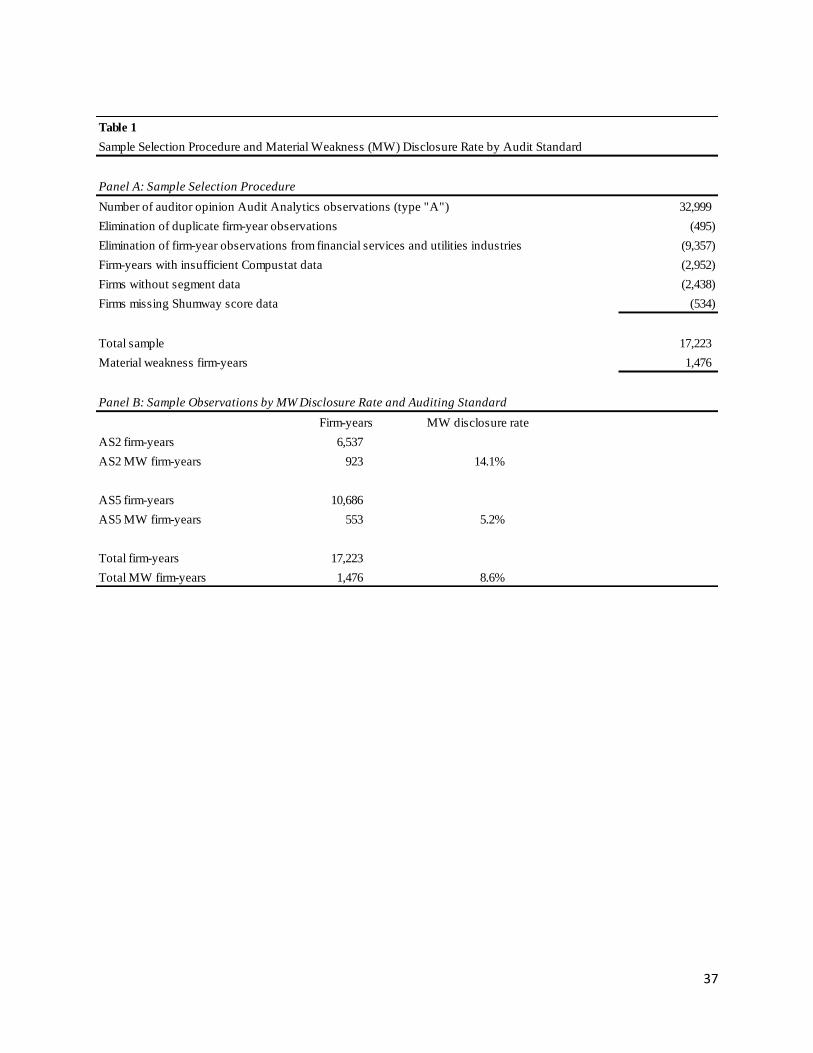
37
Table 1
Sample Selection Procedure and Material Weakness (MW) Disclosure Rate by Audit Standard
Panel A: Sample Selection Procedure
Number of auditor opinion Audit Analytics observations (type "A") 32,999
Elimination of duplicate firm-year observations (495)
Elimination of firm-year observations from financial services and utilities industries (9,357)
Firm-years with insufficient Compustat data (2,952)
Firms without segment data (2,438)
Firms missing Shumway score data (534)
Total sample 17,223
Material weakness firm-years 1,476
Panel B: Sample Observations by MW Disclosure Rate and Auditing Standard
AS2 firm-years 6,537
AS2 MW firm-years 923 14.1%
AS5 firm-years 10,686
AS5 MW firm-years 553 5.2%
Total firm-years 17,223
Total MW firm-years 1,476 8.6%
Firm-years MW disclosure rate
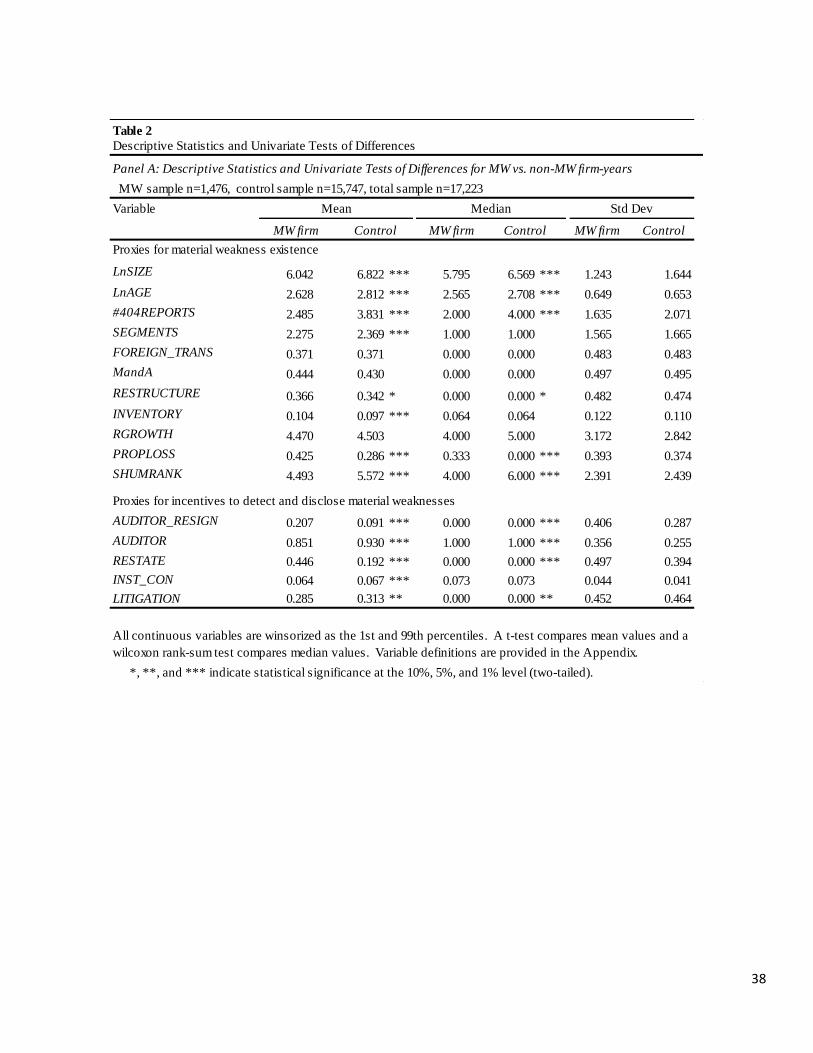
38
Table 2
Panel A: Descriptive Statistics and Univariate Tests of Differences for MW vs. non-MW firm-years
MW sample n=1,476, control sample n=15,747, total sample n=17,223
Variable
Proxies for material weakness existence
LnSIZE 6.042 6.822 *** 5.795 6.569 *** 1.243 1.644
LnAGE 2.628 2.812 *** 2.565 2.708 *** 0.649 0.653
#404REPORTS 2.485 3.831 *** 2.000 4.000 *** 1.635 2.071
SEGMENTS 2.275 2.369 *** 1.000 1.000 1.565 1.665
FOREIGN_TRANS 0.371 0.371 0.000 0.000 0.483 0.483
MandA 0.444 0.430 0.000 0.000 0.497 0.495
RESTRUCTURE 0.366 0.342 * 0.000 0.000 * 0.482 0.474
INVENTORY 0.104 0.097 *** 0.064 0.064 0.122 0.110
RGROWTH 4.470 4.503 4.000 5.000 3.172 2.842
PROPLOSS 0.425 0.286 *** 0.333 0.000 *** 0.393 0.374
SHUMRANK 4.493 5.572 *** 4.000 6.000 *** 2.391 2.439
Proxies for incentives to detect and disclose material weaknesses
AUDITOR_RESIGN 0.207 0.091 *** 0.000 0.000 *** 0.406 0.287
AUDITOR 0.851 0.930 *** 1.000 1.000 *** 0.356 0.255
RESTATE 0.446 0.192 *** 0.000 0.000 *** 0.497 0.394
INST_CON 0.064 0.067 *** 0.073 0.073 0.044 0.041
LITIGATION 0.285 0.313 ** 0.000 0.000 ** 0.452 0.464
*, **, and *** indicate statistical significance at the 10%, 5%, and 1% level (two-tailed).
Descriptive Statistics and Univariate Tests of Differences
Control
All continuous variables are winsorized as the 1st and 99th percentiles. A t-test compares mean values and a
wilcoxon rank-sum test compares median values. Variable definitions are provided in the Appendix.
Control Control
MedianMean Std Dev
MW firm MW firm MW firm

39
Table 2 (continued)
Panel B: MW Observations by Entity-Level, Process-Level, and Total (ELCWEAK & PROCESSWEAK)
SOX year 1 (11/15/04-11/14/05) AS2 year 1 150 37.1% 254 62.9% 404
SOX year 2 (11/15/05-11/14/06) 126 44.1% 160 55.9% 286
SOX year 3 (11/15/06-11/14/07) 108 46.4% 125 53.6% 233
SOX year 4 (11/15/07-11/14/08) AS5 year 1 81 39.7% 123 60.3% 204
SOX year 5 (11/15/08-11/14/09) 52 45.6% 62 54.4% 114
SOX year 6 (11/15/09-11/14/10) 36 41.4% 51 58.6% 87
SOX year 7 (11/15/10-11/14/11) 42 50.6% 41 49.4% 83
SOX year 8 (11/15/11-12/31/11) partial year 30 46.2% 35 53.8% 65
Total All Years 625 42.3% 851 57.7% 1,476
Descriptive Statistics and Univariate Tests of Differences
Entity-Level Process-Level Total MWs
ELCWEAK=1 if at least one material weakness in the following categories: (1) non-routine transaction control
issues (code 77); (2) journal entry control issues (code 76); (3) foreign, related party, affiliated or subsidiary issues
(code 38); (4) an ineffective, non‐existent or understaffed audit committee (code 11); (5) senior management
competency, tone, or reliability issues (code 13); (6) an insufficient or non ‐existent internal audit function (code
18); (7) ethical or compliance issues with or (8) accounting personnel resources, PROCESSWEAK=1 if a material
weakness exists, but none of the reasons identified by ELCWEAK=1 are present.
Count
% of total
MW's Count
% of total
MW's Count

40
Table 3
Logit Model Estimating the Key Determinants of Material Weakness Disclosure across AS2 and AS5 Time Periods
AS5 period
Independent variables
INTERCEPT 0.624 ** 1.005 *** -0.152 5.20 **
LnSIZE -0.236 *** 0.79 -0.278 *** 0.76 -0.176 *** 0.84 3.35 *
LnAGE -0.088 0.92 -0.038 0.96 -0.180 * 0.84 1.54
#404REPORTS -0.300 *** 0.74 -0.454 *** 0.64 -0.231 *** 0.79 15.08 ***
SEGMENTS 0.056 ** 1.06 0.060 ** 1.06 0.043 1.04 0.15
FOREIGN_TRANS 0.213 *** 1.24 0.274 *** 1.32 0.172 1.19 0.57
MandA 0.135 * 1.14 0.120 1.13 0.172 1.19 0.15
RESTRUCTURE 0.248 *** 1.28 0.264 *** 1.30 0.221 * 1.25 0.09
INVENTORY 0.812 ** 2.25 0.625 1.87 1.059 ** 2.88 0.52
RGROWTH 0.010 1.01 0.007 1.01 0.018 1.02 0.24
PROPLOSS 0.021 1.02 -0.087 0.92 0.125 1.13 0.77
SHUMRANK -0.115 *** 0.89 -0.128 *** 0.88 -0.108 *** 0.90 0.29
AUDITOR_RESIGN 0.527 *** 1.69 0.437 *** 1.55 0.718 *** 2.05 2.70
AUDITOR -0.256 ** 0.78 -0.149 0.86 -0.428 *** 0.65 1.83
RESTATE 0.992 *** 2.70 0.952 *** 2.59 1.094 *** 2.99 1.20
INST_CON -1.594 * 0.20 -1.366 0.26 -1.559 0.21 0.01
LITIGATION -0.252 *** 0.78 -0.100 0.91 -0.455 *** 0.63 5.16 **
AS5PERIOD -0.400 *** 0.67
Likelihood ratio χ2 1,498.5 562.9 571.9
Model significance <0.0001 <0.0001 <0.0001
Max re-scaled R-square 18.8% 14.8% 15.6%
MWFIRM=1 observations 1,476 923 553
Total observations 17,223 6,537 10,686
Area under ROC curve 78.5% 73.3% 77.8%
*, **, and *** indicate statistical significance at the 10%, 5%, and 1% level (two-tailed).
3 4 5 6 7
Odds
ratio
Odds
ratio
The models are estimated using logistic regression with standard errors adjusted for clustering on each company. All
continuous variables are winsorized as the 1st and 99th percentiles. Variable definitions are provided in the Appendix.
Dependent variable = MWFIRM
Coefficient Coefficient Coefficient
Chi-Square test of
differences
Pooled sample
11/15/2004-12/31/2011
AS2 period
11/15/2004-11/14/2007
Odds
ratio
11/15/2007-12/31/2011
1 2

41
Table 4
Sample Selection Procedure for Test of Timely Matches of Misstatements to Material Weaknesses
Panel A: Sample Selection Procedure
Total unique announcements from initial sample of misstated firm-years 900
Elimination of restatement filings with no corresponding material weakness reported (368)
Elimination of restatement filings with a corresponding, but non matching material weakness (151)
Elimination of observations with missing information to construct variables in primary model (22)
Total matched restatements 359
Firms that report a related material weakness during the misstatement period (timely) 151
208
Total matched restatements 359
Panel B: Sample Observations by TIMELYMW
SOX year 1 (11/15/04-11/14/05) AS2 year 1 36 80 45.0%
SOX year 2 (11/15/05-11/14/06) 51 93 54.8%
SOX year 3 (11/15/06-11/14/07) 22 50 44.0%
SOX year 4 (11/15/07-11/14/08) AS5 year 1 10 27 37.0%
SOX year 5 (11/15/08-11/14/09) 13 33 39.4%
SOX year 6 (11/15/09-11/14/10) 3 26 11.5%
SOX year 7 (11/15/10-11/14/11) 9 31 29.0%
SOX year 8 (11/15/11-12/31/11) partial year 7 19 36.8%
Total All Years 151 359 42.1%
% TimelyTIMELYMW=1 Total matches
Firms that report controls are effective during the misstatement period, but subsequently
disclose a related material weakness (late)

42
Panel C: Descriptive Statistics and Univariate Tests of Differences for timely vs. late MW's
TIMELYMW sample n=153, control sample n=206, total sample n=359
Variable TIMELYMW=1
PREVRESTATE 0.323 0.468 0.000 0.199 ***
SIZE 6.173 1.360 6.079 6.216
LOSS 0.404 0.491 0.000 0.335
XFIN 0.047 0.253 0.000 0.066 *BIG4 0.813 0.390 1.000 0.850 **AUDIT_FEES 70.610 72.854 50.432 51.892 ***NONAUDIT_FEES 9.734 13.596 5.098 10.008
AUDITOR_CHANGE 0.153 0.361 0.000 0.102 ***MGMT_CHANGE 0.398 0.474 0.000 0.296 **AS5 0.379 0.486 0.000 0.447 ***
*, **, and *** indicate statistical significance at the 10%, 5%, and 1% level (two-tailed).
Full Sample
Mean Mean
Table 4 (continued)
All continuous variables are winsorized as the 1st and 99th percentiles. A t-test compares mean
values.
9.366
0.222
0.399
0.288
Mean
0.497
0.021
0.765
95.811
Std. Dev Median
TIMELYMW=0
0.490
6.116
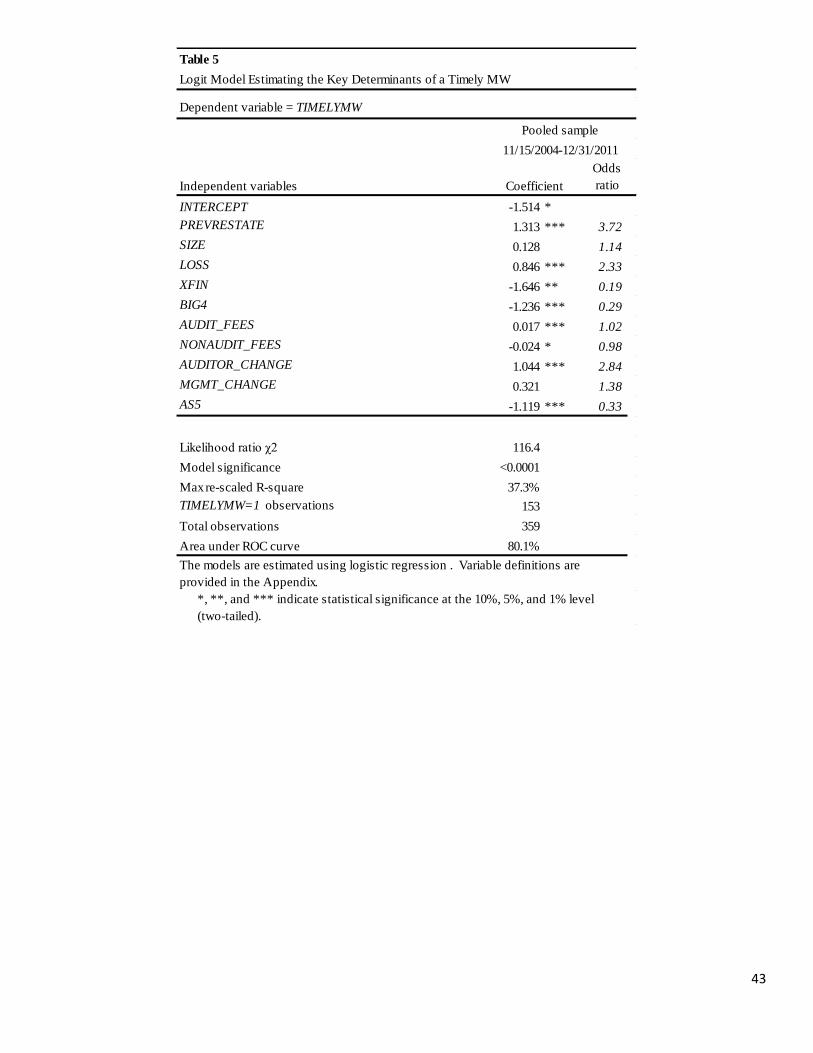
43
Table 5
Dependent variable = TIMELYMW
Independent variables
INTERCEPT -1.514 *
PREVRESTATE 1.313 *** 3.72
SIZE 0.128 1.14
LOSS 0.846 *** 2.33
XFIN -1.646 ** 0.19
BIG4 -1.236 *** 0.29
AUDIT_FEES 0.017 *** 1.02
NONAUDIT_FEES -0.024 * 0.98
AUDITOR_CHANGE 1.044 *** 2.84
MGMT_CHANGE 0.321 1.38
AS5 -1.119 *** 0.33
Likelihood ratio χ2 116.4
Model significance <0.0001
Max re-scaled R-square 37.3%
TIMELYMW=1 observations 153
Total observations 359
Area under ROC curve 80.1%
*, **, and *** indicate statistical significance at the 10%, 5%, and 1% level
(two-tailed).
Logit Model Estimating the Key Determinants of a Timely MW
The models are estimated using logistic regression . Variable definitions are
provided in the Appendix.
Coefficient
Odds
ratio
Pooled sample
11/15/2004-12/31/2011
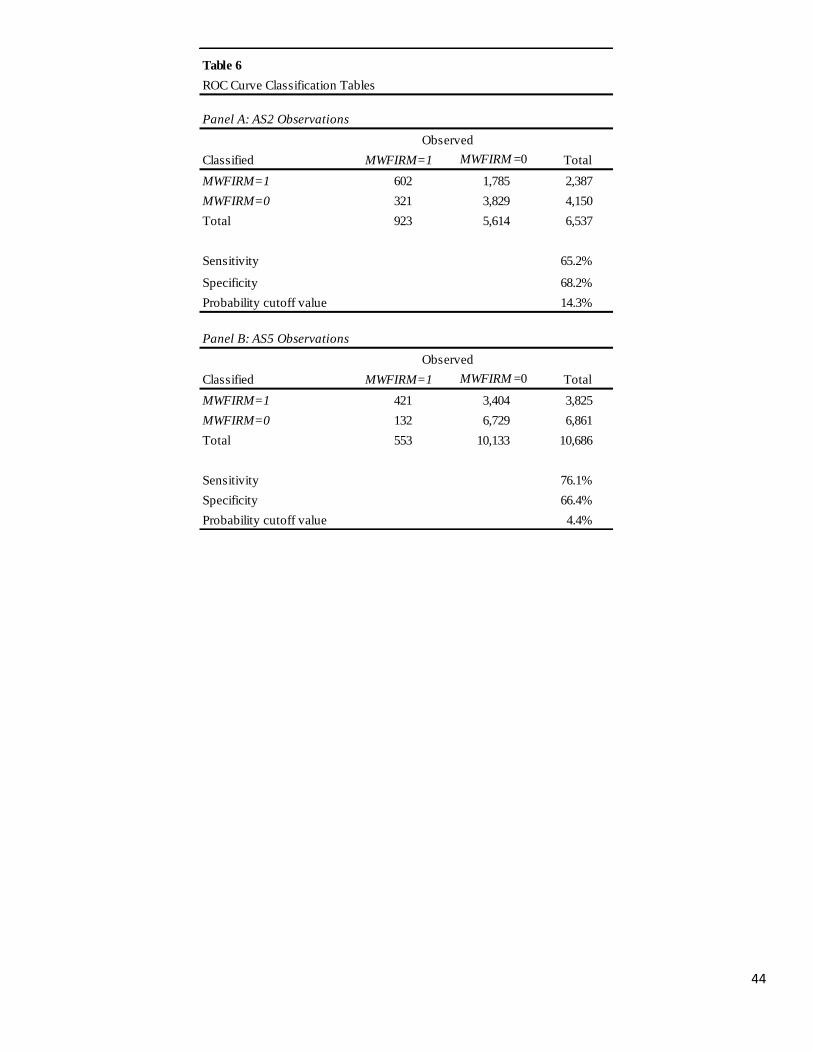
44
Classified
MWFIRM=1 602 1,785 2,387
MWFIRM=0 321 3,829 4,150
Total 923 5,614 6,537
Sensitivity 65.2%
Specificity 68.2%
Probability cutoff value 14.3%
Classified
MWFIRM=1 421 3,404 3,825
MWFIRM=0 132 6,729 6,861
Total 553 10,133 10,686
Sensitivity 76.1%
Specificity 66.4%
Probability cutoff value 4.4%
Panel A: AS2 Observations
Panel B: AS5 Observations
MWFIRM=1 MWFIRM =0
Table 6
ROC Curve Classification Tables
MWFIRM=1 MWFIRM =0
Total
Total
Observed
Observed

45
Table 7
Frequency and Estimates of Misstatement for Non-Material Weakness Firm-Years
Panel A: Frequency of Misstatements for Non-Material Weakness Firm-Years
Classified
PREDICT_MW=1
PREDICT_MW=0
Difference
Panel B: Logistic Regression Model Estimating the Determinants of
Misstatements for Firm-Years without Material Weaknesses
Independent variables
INTERCEPT -1.129 ** -1.038 -2.472 *** -2.164 ***
PREDICT_MW -0.047 -0.132 0.295 * 0.020
LnSIZE -0.055 -0.062 -0.068 -0.077 *
LnAGE -0.060 -0.057 -0.026 -0.042
#404REPORTS -0.280 *** -0.304 *** 0.033 0.012
RGROWTH -0.025 -0.024 -0.008 -0.005
PROPLOSS -0.119 -0.122 -0.372 * -0.353 *
SHUMRANK -0.018 -0.022 -0.045 -0.054 *
MandA 0.045 0.052 0.073 0.090
RESTRUCTURE 0.276 ** 0.288 ** 0.104 0.118
LEV 0.257 0.244 0.762 *** 0.731 ***
LITIGATION 0.310 ** 0.308 ** 0.097 0.049
AUDITOR -0.169 -0.159 -0.024 -0.069
AUDITOR_RESIGN -0.174 -0.169 -0.350 * -0.316
PREVRESTATE2 0.209 0.502 ***
Likelihood ratio χ2 46.3 48.3 43.8 57.6
Model significance <.0001 <.0001 <.0001 <.0001
Max re-scaled R-square 1.8% 1.9% 1.3% 1.5%
MISSTATEMENT=1 observations 490 490 531 531
Total observations 5,614 5,614 10,133 10,133
Area under ROC curve 59.3% 59.4% 58.7% 60.1%
*, **, and *** indicate statistical significance at the 10%, 5%, and 1% level (two-tailed).
MISSTATEMENT Frequency
Dependent variable=MISSTATEMENT
10.0%
8.1%
1.9%***
AS2 period AS5 period
11/15/2007-12/31/2011
6.3%
4.7%
1.5%***
11/15/2004-11/14/2007
AS2 period
11/15/2004-11/14/2007
AS5 period
11/15/2007-12/31/2011
The models are estimated using logistic regression with standard errors adjusted for clustering on each company. All
continuous variables are winsorized as the 1st and 99th percentiles. Variable definitions are provided in the Appendix.
1 2 3 4