Embed Size (px)
Citation preview
NeuroImage 70 (2013) 258–267
Contents lists available at SciVerse ScienceDirect
NeuroImage
j ourna l homepage: www.e lsev ie r .com/ locate /yn img
Auditory modulation of visual stimulus encoding in human retinotopic cortex
Benjamin de Haas ⁎, D. Samuel Schwarzkopf, Maren Urner, Geraint ReesUCL Institute of Cognitive Neuroscience, 17 Queen Square, London WC1N 3BG, UKWellcome Trust Centre for Neuroimaging, University College London, 12 Queen Square, London WC1N 3AR, UK
⁎ Corresponding author at: Institute of Cognitive NeLondon, Alexandra House, 17 Queen Square, London W
E-mail address: [email protected] (B. de H
1053-8119/$ – see front matter © 2013 Elsevier Inc. Allhttp://dx.doi.org/10.1016/j.neuroimage.2012.12.061
a b s t r a c t
a r t i c l e i n f oArticle history:Accepted 23 December 2012Available online 5 January 2013
Keywords:MultisensoryAudio-visualV2DecodingMVPAfMRI
Sounds canmodulate visual perception aswell as neural activity in retinotopic cortex.Most studies in this con-text investigated how sounds change neural amplitude and oscillatory phase reset in visual cortex. However,recent studies in macaque monkeys show that congruence of audio-visual stimuli also modulates the amountof stimulus information carried by spiking activity of primary auditory and visual neurons. Here, we used nat-uralistic video stimuli and recorded the spatial patterns of functional MRI signals in human retinotopic cortexto test whether the discriminability of such patterns varied with the presence and congruence of co-occurringsounds. We found that incongruent sounds significantly impaired stimulus decoding from area V2 and therewas a similar trend for V3. This effect was associated with reduced inter-trial reliability of patterns (i.e. higherlevels of noise), but was not accompanied by any detectable modulation of overall signal amplitude. Weconclude that sounds modulate naturalistic stimulus encoding in early human retinotopic cortex withoutaffecting overall signal amplitude. Subthreshold modulation, oscillatory phase reset and dynamic attentionalmodulation are candidate neural and cognitive mechanisms mediating these effects.
© 2013 Elsevier Inc. All rights reserved.
Introduction
Perception of the environment requires integration of sensoryinformation across the senses, but how our brains combine informa-tion from different sensory streams is still poorly understood. Theearliest stages of cortical sensory processing were long thought to beunimodal and multisensory processing to be restricted to dedicatedconvergence areas (Mesulam, 1998). However, the past decade hasseen new anatomical and functional evidence for multisensory inter-actions even at the level of primary sensory areas (see Driver andNoesselt, 2008; Klemen and Chambers, 2012 for an overview).
Tracer studies provide anatomical evidence for multisensory inter-actions at early stages of cortical processing (here referred to as ‘earlymultisensory interactions’ for convenience, not necessarily implyingtemporal precedence). There are direct feedback connections fromprimary auditory and multisensory areas to V1 and V2 in macaque(Clavagnier et al., 2004; Falchier et al., 2002; Rockland and Ojima,2003) and similar connections in rodents (Allman et al., 2008;Budinger et al., 2006). Although some bimodal neurons can be foundeven in primary sensory areas (i.e. neurons that can be driven by eithervisual or auditory input, e.g. Fishman and Michael, 1973), the effect ofdirect cross-modal connections seems to be modulatory, rather thandriving. Recent evidence from cats and rodents points to subthresholdmodulation of ‘unimodal’ visual neurons (that cannot be driven by
uroscience, University CollegeC1N 3AR, UK.aas).
rights reserved.
auditory input alone) as the dominant form of multisensory interactionin early visual cortex (Allman and Meredith, 2007; Allman et al., 2008,2009; Iurilli et al., 2012). Early multisensory interactions also result inphase resetting of ongoing oscillations, thereby modulating andaligning the periodic excitability of affected neurons (e.g. Lakatos etal., 2007, 2009, cf. Schroeder et al., 2008).
In humans, cross-modal interactions modulate the amplitude orcan drive neural signals in early visual cortex, as indexed by BloodOxygenation Level Dependent (BOLD) fMRI (e.g. Macaluso et al.,2000; Martuzzi et al., 2007; Meienbrock et al., 2007; Noesselt et al.,2007; Watkins et al., 2006), event-related potentials (ERPs) (e.g.Cappe et al., 2010; Molholm et al., 2002) and transcranial magneticstimulation (TMS) excitability (e.g.Romei et al., 2009). Cross-modalphase reset of ongoing oscillations in visual cortex is found in humanmagnetoencephalography (MEG; Luo et al., 2010) and electroencepha-lography (EEG; consistent with phase-locked periodic modulations ofperceptual performance Naue et al., 2011; Romei et al., 2012; Thorneet al., 2011).
When monkeys are presented with naturalistic sound stimuli,accompanying visual stimulation reduces the mean firing rate of pri-mary auditory cortex neurons (Dahl et al., 2010; Kayser et al., 2010).Moreover, inter-trial variability of spike trains is greatly reduced,thus enhancing mutual information between stimuli and spiking pat-terns. This effect is significantly stronger when the auditory and thevisual input are congruent (Kayser et al., 2010). Visual neurons inSTS show a similar behaviour for naturalistic visual stimuli (Dahlet al., 2010). Their response amplitude is somewhat reduced for bi-modal audio-visual stimulation and the stimulus information carried
259B. de Haas et al. / NeuroImage 70 (2013) 258–267
by spike patterns is affected by multisensory context: incongruentsounds significantly worsen stimulus decoding based on spike trains.
Here we sought to test whether multisensory modulation of stim-ulus encoding extended to humans and early retinotopic visual corti-ces. We presented participants with naturalistic audiovisual stimuli infour different conditions: audio only (A), visual only (V), audiovisualcongruent (AV congruent) and audio-visual incongruent (AV incon-gruent). We then used multivoxel pattern analysis (MVPA) to decodestimulus identities based on spatial patterns of BOLD signals evokedin V1-3 (as identified by retinotopic mapping, Sereno et al., 1995).Separate multivariate classifiers were trained and tested for each ofthe four conditions and for each ROI. This allowed us to comparedecoding accuracies between conditions, thus obtaining an index ofpattern discriminability for each condition.
Materials and methods
Participants
15 participants from the University College London (UCL) partici-pant pool took part (mean age, 26 years, SD, 4 years; 7 females; 1 lefthanded). All participants had normal or corrected to normal visionand reported no hearing problems. Written informed consent wasobtained from each participant and the study was approved by theUCL ethics committee. Participants were paid 10 GBP per hour fortaking part in the experiment, which lasted up to 2.5 h.
Stimuli
Four video clips were used as audio-visual stimuli, each lasting 3 s.Two clips showed natural scenes containing animals (a croaking frogand a crowing rooster). These two clips were downloaded fromhttp://www.youtube.com and edited. The two remaining clips showedthe clothed torso of the first author while turning a key in a lock orripping a paper apart. All clips were similar with regard to luminanceand loudness andwere projected onto a screen at the endof the scannerbore. Participants viewed the clips via a mirror mounted at the headcoil of the scanner at a viewing distance of ~72 cm. Video clips werepresented at a resolution of 640×360 pixels and subtended ~18 by10° visual angle when viewed by participants in the scanner. Duringthe experiment participants were asked to fixate a white dot projectedon top of the videos at the centre of the screen (radius ~0.1° visualangle). In each trial the dot turned blue once, twice or three times andparticipants were asked to count and indicate the number of colourchanges via a button box in a 2 s inter stimulus interval.
Audio tracks accompanying the video clips were presented via MRIcompatible in-ear headphones (http://www.etymotic.com). Loudnesswas adjusted individually before the start of the experiment, aimingfor a level that was comfortable for participants but still enabledthem to easily tell apart sound clips in the presence of scanner noise.
All stimuli were programmed and presented inMATLAB (Mathworks,Ltd.) using the Cogent Graphics (http://www.vislab.ucl.ac.uk/cogent.php)and Psychophysics Toolbox 3 extensions (Brainard, 1997; Pelli, 1997;http://psychtoolbox.org).
Procedure
Each participant completed 17–24 runs of scanning in the mainexperiment, each run lasting just under 2 min. During the runs partic-ipants were presented with audio and/or visual clips and completedan incidental, superimposed fixation task (cf. above). During eachrun each of the 4 stimuli was presented once for each experimentalcondition (i.e. four times), amounting to 16 stimulus trials per run(cf. Fig. 1). Participants were either presented with videos only (V),sounds only (A), matching videos and sounds (AV congruent condi-tion) or mismatching videos and sounds (AV incongruent condition).
For audio-visually incongruent trials the sound files were swappedbetween fixed pairs of videos (rooster crowing and paper ripping;frog croaking and keys turning). Each 3 s clip was followed by a 2 sinter-stimulus interval during which participants were asked to indi-cate via a button box how many times the fixation dot changed itscolour. In addition to the 16 stimulus trials there were 4 blank trialsin each run that served as a baseline measure. During these trials par-ticipants completed the fixation task in the absence of audio-visualclips. The order of the 20 trials was randomised for each run, as wasthe number of fixation dot colour changes in each trial (1–3).
Retinotopic mapping
To delineate the borders of visual areas V1-3 on an individualbasis, each participant underwent an additional fMRI run viewingstimuli for phase encoded retinotopic mapping (Sereno et al., 1995).Stimuli for this run consisted of a wedge rotating clock-wise and anexpanding ring. Both stimuli moved in discrete steps, synchronisedwith the acquisition of fMRI volumes, but with different frequencies(wedge: 12 cycles, 20 steps per cycle; ring: 20 cycles, 12 steps percycle). They were centred around a fixation dot of ~0.25° diameterand spanned up to 8° of eccentricity. It is generally difficult to distin-guish retinotopic maps inside the foveal confluence because the bor-ders between regions are difficult to resolve at conventional voxelsizes. Moreover, the presence of a stable fixation dot precludes anysystematic variation in the BOLD signal related to the mapping stim-ulus. Note that the size of the fixation dot for our mapping stimuli wasslightly larger than the size of the fixation dot for our audiovisualstimuli (~0.25 vs. ~0.2° diameter). We are therefore confident thatour region of interest analyses did not include the foveal representa-tions. Ring and wedge were presented on a grey background andserved as apertures revealing a dynamic high contrast stimulus. Par-ticipants were asked to fixate at all times and count brief colourchanges of the fixation dot from blue to purple. These colour changeevents lasted 200 ms and could occur at every non-consecutive200 ms window of the run with a probability of 5%.
Image acquisition and pre-processing
All functional and structural scans were obtained with a Tim Trio3T scanner (Siemens Medical Systems, Erlangen, Germany), using a12-channel head coil. Functional images for the main experimentwere acquired with a gradient echo planar imaging (EPI) sequence(3 mm isotropic resolution, matrix size 64×64, 40 transverse slicesper volume, acquired in ascending order (whole head coverage); sliceacquisition time 68 ms, TE 30 ms, TR 2.72 s). We obtained 42 volumesper run of the main experiment (including three dummy volumes atthe beginning of each run and two at the end), resulting in a run dura-tion of 114.24 s. Functional images for retinotopic mapping were ac-quired in one run of 247 volumes with an EPI sequence (includingfive dummy volumes at the beginning and two at the end of the run;2.3 mm isotropic resolution, matrix size 96×96, 36 transverse slicesper volume, acquired in interleaved order (centred on the occipitalcortex); slice acquisition time 85 ms, TE 36 ms, TR 3.06 s per volume).In between the main experiment and the retinotopic mapping runwe acquired fieldmaps to correct for geometric distortions in the func-tional images caused by heterogeneities in the B0 magnetic field(double-echo FLASH sequence with a short TE of 10 ms and a long se-quence of 12.46 ms, 3×3×2 mm, 1 mm gap). Finally, we acquired aT1-weighted structural image of each participant using an MDEFT se-quence (Deichmann et al., 2004; 1 mm isotropic resolution, matrixsize 256×240, 176 sagittal slices, TE 2.48 ms, TR 7.92 ms, TI 910 ms).
All image files were converted to NIfTI format and pre-processedusing SPM 8 (http://www.fil.ion.ucl.ac.uk/spm/software/spm8/). Thedummy volumes for each run were discarded to allow for the T1 sig-nal to reach steady state. The remaining functional images of the

.
. .
.
.
.
.
.
…doodledoo …croaaak
- …doodledoo
X
? ? ? ?
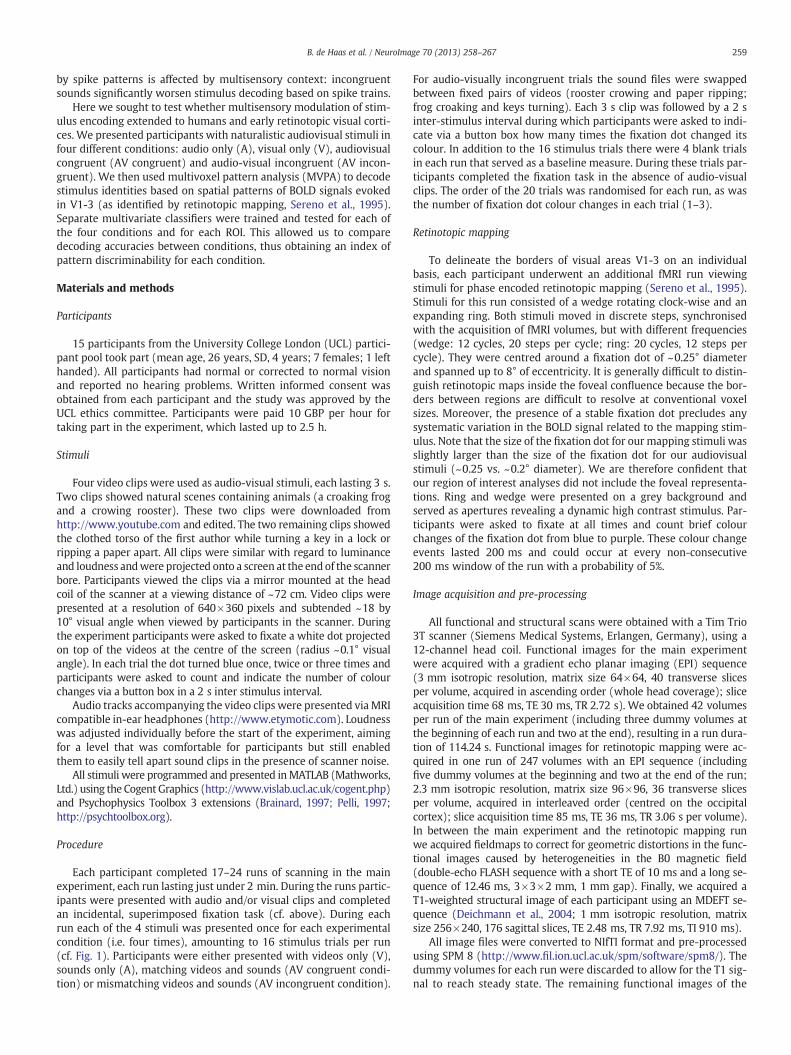
4 Video Clips 4 Conditions
One 4-way Classifier per Condition
Compare Decoding Accuracies between Conditions
a)
c)
b)
Fig. 1. Design.
a) Four audiovisual clips used as stimuli, each lasting 3 s. Participants counted colour changes of the fixation dot in each trial.b) Each of the clips was presented multiple times in four conditions (illustrated here for one example clip): audiovisual congruent (AV congruent) in green, audiovisual incon-
gruent (AV incongruent) in red, visual only (V) in light grey and audio only (A) in dark grey.c) Separate multivariate classifiers were trained to decode which of the four stimuli was presented for each condition.
260 B. de Haas et al. / NeuroImage 70 (2013) 258–267
main experiment and the retinotopic mapping session were in-dependently mean bias corrected, realigned and unwarped (usingvoxel displacement maps generated from the fieldmaps). Finally thefunctional images were co-registered with the respective anatomicalMDEFT scan for each participant and smoothed with a 5 mm Gaussiankernel.
Data analysis
Multivariate pattern analysisWe specified separate general linear models for each run and each
participant. Each general linearmodel contained regressors for each ofthe 16 trial types plus one regressor for the blank trials (boxcar regres-sors convolved with a canonical hemodynamic response function).Additional regressors of no interest were modelled for response inter-vals and for the sixmotion parameters estimated during re-alignment.The general linear models for each run and each participant wereestimated and contrast images for each of the 16 trials (per run andcondition) calculated. This resulted in separate contrast images andt-maps for each trial type of the experiment for each participant.
These t-maps were masked with the retinotopic regions of interest(see below) and the resulting patterns were vectorised. For thedecoding and correlation analyses the resulting patterns were meancorrected across stimuli within each condition. Note that this did notaffect classification performance — the distribution of patterns in fea-ture space was preserved, but now centred on zero. This allowed us toensure that any common intercept of patterns across stimuli wasdisregarded for the similarity and reliability correlation analyses (seebelow). Beta maps for univariate analyses were not mean corrected.The aim of the decoding analysis was to decode stimulus identity fromactivation patterns in visual areas (i.e. which of the four videos waspresented in a given trial) and to compare the accuracies of decodersacross conditions (i.e. did stimulus decoding accuracy vary dependingon audiovisual condition, cf. Fig. 1). Stimulus decoding was performedusing custom code using the linear support vector machine (lSVM)implemented in the Bioinformatics toolbox for MATLAB (versionR2010b, http://www.mathworks.com). Data from each condition wereused for training and testing of separate classifiers to get condition-specific decoding accuracies. For each condition a four-way classifierwas built, to decode which of the four stimuli was presented from a
261B. de Haas et al. / NeuroImage 70 (2013) 258–267
given activation pattern. The four-way classifier consisted of six lSVMsto test all possible pair-wise comparisons between the four stimuli. Itthen assigned one of the stimulus labels based on a one-against-onevoting procedure (Hsu and Lin, 2002). The four-way classifier wastrained and tested for accuracy in a jackknife procedure. In each itera-tion, the (condition-specific) data from all runs but one served as train-ing data and the (condition-specific) data from the remaining run wasused to test the prediction accuracy of the lSVM. Accuracieswere storedand averaged across iterations at the end of this procedure, and thewhole procedure was applied to each retinotopic ROI (V1-3) indepen-dently, yielding a four-way classification accuracy for each conditionand ROI. Statistical analysis of the resulting accuracies was done inMATLAB and PASW 18.0 (SPSS inc./IBM). Accuracies were comparedagainst chance level by subtracting .25 and using one sample t-tests. Ac-curacies were compared between conditions using ANOVAs and pairedt-tests.
Potential differences in decoding accuracy between conditionscould stem from two different sources. They could be due to changesin pattern reliability across trials, changes in pattern similarity be-tween patterns evoked by different stimuli or both. We employedadditional analyses to differentiate between those options. Changesin pattern reliability were tested by averaging the patterns for agiven stimulus across trials separately from odd and even runs andcomputing the Pearson correlation coefficient for the two resultingmean patterns (in a ROI-and condition-specificmanner). The resultingcorrelation coefficients were Fisher z-transformed, averaged for eachcondition and then compared across conditions using ANOVAs andpaired t-tests. Changes in pattern similarity were tested by averagingthe patterns for a given stimulus across all trials and computing corre-lations between these mean patterns for different stimuli (again, in aROI- and condition-specific manner). The resulting Pearson correla-tion coefficients were compared as described above.
Searchlight analysisTo test whether and where stimulus information was modulated
by audiovisual context outside retinotopic cortices, we set up an addi-tional, exploratory searchlight analysis (Kriegeskorte et al., 2006). Forthis analysis, activation patterns were derived from the same (trial-specific) t-maps that were used for the ROI analysis described above.The searchlight consisted of a sphere with a radius of 4 voxels thatwas centred on each grey matter voxel of each participant's brain inturn. During each iteration, the searchlight was used as a mask andthe patterns of activation within this mask were read out for eachtrial. Then the same 4-way classification procedure used for the ROIanalysis was applied to those patterns (cf. above). The resulting (con-dition specific) classification accuracies were projected back onto theseed voxel. Repeating this procedure for every grey matter voxel, wethus derived four accuracy maps for each participant (one per condi-tion). To test for significant accuracy differences between conditionswe subtracted the respective accuracy maps from each other. Specifi-cally, we contrasted the audiovisual congruent condition with themuted condition and with the incongruent condition and the mutedcondition with the audio-visual incongruent condition. The resultingaccuracy contrast maps were normalised to MNI space (http://www.loni.ucla.edu/ICBM/) and tested for whole brain family-wise error(FWE) corrected significance at cluster level in SPM 8 (cluster formingthreshold pb .001 uncorrected). Significant clusters were identifiedanatomically using the Juelich Histological Atlas implemented in theSPM Anatomy Toolbox (v. 1.8, http://www.fz-juelich.de/inm/inm-1/DE/Forschung/_docs/SPMAnatomyToolbox/SPMAnatomyToolbox_node.html).
Univariate analysisTo test whether audio-visual context had any influence on the
overall signal amplitude in our ROIs we employed an additional uni-variate analysis. For this analysis we averaged the condition specific
beta weights of voxels within our ROIs across stimuli and trials foreach participant. We then compared the mean beta values betweenconditions for each ROI using ANOVAs and paired t-tests.
We additionally tested whether a different approach to univariateanalyses would have yielded any differences between conditions. Totest this, we concatenated all runs of a given participant in one designmatrix in SPM8. This allowed us to build contrasts between condi-tions on the first level, utilising all trials of the respective conditions.These first level contrasts were then normalised to MNI space andtested for whole brain FWE corrected significance at cluster level inSPM8 (cluster forming threshold pb .001 uncorrected).
Retinotopic mappingRetinotopic ROIs were identified using standard phase-encoded
retinotopic mapping procedures (Sereno et al., 1995). We extractedand normalised the time series for each voxel and applied a fastFourier transformation to it. Visually responsive voxels were identi-fied by peaks in their power spectra that corresponded to our stimulusfrequencies. The preferred polar angle and eccentricity of each voxelwas then identified as the phase lag of the signal at the correspondingstimulus frequency (wedge and ring, respectively). The phase lags foreach voxel were stored in a ‘polar’ and an ‘eccentricity’ volume andthen projected onto the reconstructed, inflated cortical surface (sur-face based analysis was performed using FreeSurfer: http://surfer.nmr.mgh.harvard.edu). The resulting maps allowed us to identify meridianpolar angle reversals and thus to delineate the borders of visual areasV1-3 on the cortical surface. These labels were then exported as three-dimensional masks into NIfTI space and served as ROIs.
Results
Behavioural data
Participants performed well on the fixation task for all four stimu-lus categories and the baseline category. Performance did not differsignificantly between conditions (note that the task was independentof stimulus category; 95±1%, 96±1%, 96±1%, 97±1%, and 97±1%correct for the AV congruent, AV incongruent, V, A and baseline cate-gory, respectively (mean±standard error of the mean); F(2.49, 34.85)=1.59, p=.22, n.s., Greenhouse–Geisser corrected for non-sphericity).
Multivariate fMRI results
Multivariate ROI resultsVisual stimulus identities could be decoded significantly above
chance level (0.25) from V1-3 (ROIs were combined across hemi-spheres; all pb10−5, cf. Fig. 2a)). When no visual stimulus waspresented (A condition) decoding performance was at chance level(all p>.4). To test whether the presence and congruence of co-occurring sounds had an influence on visual stimulus encoding wecompared decoding accuracy in the three conditions containing visualstimuli (AV congruent, AV incongruent, V) for V1-3. Decoding perfor-mance did not differ significantly between conditions in V1 (F(2,28)=0.46, p=.64, n.s.). However, the presence and congruence of soundshad a significant effect on decoding performance in area V2 (F(2,28)=7.17, p=.003) and there was a non-significant trend for such an effectin area V3 (F(2,28)=2.12, p=.14, n.s.). Post-hoc t-tests revealed thatstimulus decoding from activity patterns in area V2 was significantlyworse in the AV incongruent condition compared to both, decoding inthe AV congruent (t(14)=3.29, p=.005) and V (t(14)=3.46, p=.004)conditions. Pattern decoding from area V3 was significantly worse forthe AV incongruent condition compared to the V condition (t(14)=2.15, p=.049).
To further investigate the effect of sounds on stimulus decodingfrom activation patterns in V1-3 we compared the reliability andsimilarity of stimulus-evoked patterns (cf. Materials and methods

262 B. de Haas et al. / NeuroImage 70 (2013) 258–267
for details). There was no detectable influence of sounds on patternsimilarity in V1-3 (V1: F(2,28)=0.762, p=.476, n.s., V2: F(2,28)=1.069, p=.357, n.s., V3: F(2,28)=1.815, p=.181, n.s.; cf. Fig. 2d).However, pattern reliability was significantly affected by the presenceof sounds in V2 and V3 (V1: F(2,28)=2.013, p=.152, n.s., V2: F(1.4,28,Greenhouse–Geisser corrected)=6.647, p=.011, V3: F(2,28)=5.133p=.013; cf. Fig. 2c) Post-hoc paired t-tests revealed that pattern reliabil-ity in V2was significantly reduced in the AV incongruent condition, com-pared to both the AV congruent condition (t(14)=−2.376, p=.032) andthe V condition (t(14)=−5.406, pb .0001). Pattern reliability in V3 wassignificantly reduced in the AV incongruent condition, compared to theV condition (t(14)=−3.004, p=.010).
For completeness, we computed a complete representation of allpossible stimulus pattern correlations (16 by 16); please see the Sup-plementary results and Fig. S1.
a)
c)
** **
*
* *** **
Fig. 2. Results for regions of interest (ROIs). Results for areas V1-3 are shown as bar plots. Bin red, visual only in light grey and audio only in dark grey. Error bars indicate the standar
a) Classification accuracies for 4-way classification using linear support vector machinesStars indicate significantly different decoding accuracies between conditions involvingspective ANOVAs; *pb .05, **pb .01).
b) Mean signal amplitudes estimated by the GLM. Note that amplitudes were not significinterest. Note that beta maps used for this analysis were not mean corrected (see Mat
c) Pattern reliability as indicated by means of Fischer z-transformed correlation coefficimethods for details). Stars indicate significantly different pattern reliabilities between cfor details of respective ANOVAs; *pb .05, **pb .01, ***pb .001).
d) Pattern similarity as indicated by means of Fischer z-transformed correlation coefficienthat pattern similarities were not significantly different between conditions involvingbecause they were mean corrected across stimuli within each condition (see Materials
Our study was limited to investigating multisensory modulation ofpattern discriminability in early visual cortices. It would have been in-teresting to compare this to similar modulations in early auditory cor-tex. However, auditory pattern decoding from BOLD signals typicallyhas much lower accuracies than visual pattern decoding and appearsto require high spatial resolutionMRI sequences (e.g. Formisano et al.,2008; Staeren et al., 2009). Nevertheless, for completeness we alsoextracted patterns of BOLD signals from bilateral anterior transversaltemporal gyri (Destrieux et al., 2010) and tried to classify them. Stim-ulus decoding was generally unsuccessful for this data and did not im-prove evenwhen using a more lenient anatomical criterion (includingthe whole of the superior temporal gyrus and plane). We concludethat an investigation of primary auditory cortex similar to our visualcortex analysis would rely on high-resolution scans and adequatefunctional localizers, ideally tonotopic-mapping.
b)
d)
AV congruent
AV incongruent
Visual Only
Audio Only
ar colours indicate conditions: audiovisual congruent in green, audiovisual incongruentd error of the mean adjusted for repeated measurements (Morey, 2008).
(see Materials and methods for details). The dashed line indicates chance level (.25).visual stimulation (as indicated by paired t-tests, see Results section for details of re-
antly different between conditions involving visual stimulation in any of the regions oferials and methods for details).ents between patterns for a given stimulus in odd and even runs (see Materials andonditions involving visual stimulation (as indicated by paired t-tests, see Results section
ts between patterns for different stimuli (see Materials and methods for details). Notevisual stimulation in any of the regions of interest. Patterns are negatively correlatedand methods for details).

263B. de Haas et al. / NeuroImage 70 (2013) 258–267
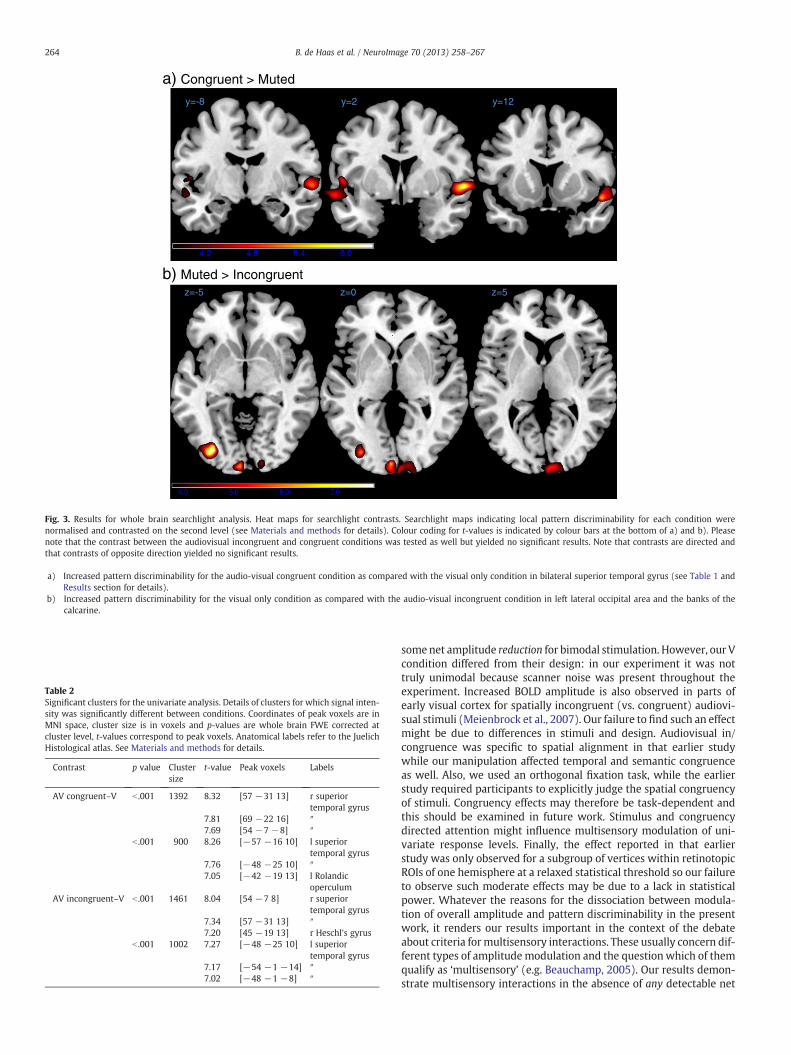
Searchlight resultsWe tested three contrasts: AV congruent–AV incongruent, AV
congruent–V and V–AV incongruent (see Materials and methods fordetails.).
The AV congruent–AV incongruent contrast yielded no significantclusters at the corrected threshold. The AV congruent–V contrast re-vealed two significant clusters in the bilateral superior temporal gyri(FWE corrected pb .05). Both clusters included early auditory cortexand part of the superior temporal gyrus (including TE 1.0, 1.2 and 3)and the right cluster extended in anterior direction to the temporalpole (cf. Table 1 and Fig. 3a)). The V–AV incongruent contrast yieldedtwo significant clusters in visual cortex (FWE corrected pb .05). Thefirst cluster spanned part of the bilateral calcarine gyrus near the oc-cipital pole, including parts of Brodmann area 17 and 18. The secondcluster was located in the left lateral inferior occipital gyrus and coin-cided with the location reported for areas LO1/2 (Larsson and Heeger,2006). See Table 1 and Fig. 3b).
Univariate fMRI analysis
To testwhere in the brain auditory contextmodulated the amplitudeof the signal evoked by our stimuli (as opposed to information carried),we employed a univariate whole brain analysis. We tested the samethree contrasts tested in the searchlight analysis: AV congruent–AV in-congruent, AV congruent–V and V–AV incongruent (see Materials andmethods for details).
The AV congruent–AV incongruent contrast yielded no significantresults. The AV congruent–V contrast yielded two significant clustersin the bilateral superior temporal gyri (FWE corrected pb .05). Bothclusters included early auditory cortex (including TE 1.0, 1.1, 1.2 and3) and the right cluster extended in anterior direction to the temporalpole (cf. Table 2 and Fig. 4a), note the similarity to the correspondingsearchlight contrast). The V–AV incongruent contrast yielded twosimilar clusters of significantly greater activation for the AV incongru-ent condition (i.e. the one including auditory stimulation). These clus-ters again spanned almost the whole of bilateral superior temporalgyri, including early auditory cortex (cf. Table 2 and Fig 4b).
For a more direct comparison between univariate contrasts andthe multivariate analysis we also tested for univariate effects in theretinotopically defined ROIs of each participant. For this contrast weaveraged the voxel responses (betas) for each participant and condi-tion across the whole of the respective ROI (cf. Fig. 2b)). Responseamplitudes did not differ significantly between the three conditionsinvolving visual stimuli in all three ROIs (V1: F(2,28)=0.01, p=.99,n.s.; V2: F(2,28)=0.25, p=.78, n.s.; V3: F(2,28)=1.12, p=.34).
Table 1Significant searchlight clusters. Details of clusters where decoding accuracy was sig-nificantly different between conditions. Coordinates of peak voxels are in MNI space,cluster size is in voxels and p-values are whole brain FWE corrected at cluster level,t-values correspond to peak voxels. Anatomical labels refer to the Juelich Histologicalatlas. See Materials and methods for details.
Contrast p value Clustersize
t-value Peak voxel Label
AV congruent–V b .001 861 6.33 [62 −2 0] r superiortemporal gyrus
[50 16 −12] r temporal pole[62 20 −12] (Not assigned)
.006 408 5.40 [−56 −2 8] l superiortemporal gyrus
[−52 4 2] l Rolandicoperculum
[−60 6 −10] (Not assigned)V–AV incongruent b .001 699 6.93 [−32−82−4] l inferior
occipital gyrusb .022 303 7.75 [−4 −94 −2] l calcarine bank
Discussion
We presented participants with naturalistic, dynamic audiovisualstimuli while they performed an incidental fixation task. Replicatingprevious studies (e.g. Nishimoto et al., 2011), we could decode stim-ulus identity from spatial patterns of BOLD signals in retinotopic cor-tices well above chance. More specifically, we could decode stimulusidentity significantly better than chance from BOLD patterns in V1-3(separately) for all conditions containing visual stimuli (AV congruent,AV incongruent and V), but not for the audio only (A) condition.
There were no detectable differences in mean amplitudes of BOLDsignals evoked in V1-3 for the AV congruent, AV incongruent and Vconditions. However, andmost importantly, decoding accuracy variedsignificantly with the presence and congruence of sounds in V2 andsomewhat in V3. Decoding accuracy for patterns in V2 was worse forthe AV incongruent condition compared to both, the V and AV con-gruent condition. Decoding accuracy in V3 was worse for the AV in-congruent compared to the V condition. Worsening of local decodingaccuracies for the AV incongruent (compared to V) conditionwas con-firmed and extended to area LO (and possibly V1) by searchlightanalyses.
Significantly worse decoding for the AV incongruent condition inV2 (compared to the AV congruent and V conditions) was associatedwith reduced inter-trial reliability of patterns for a given stimulus inthis condition (again, in comparison to the AV congruent and V condi-tions). In V3 reduced decoding accuracy for the AV incongruent condi-tion relative to the V condition went along with reduced inter-trialreliability for the same comparison. In contrast to the reliability ofintra-stimulus patterns, no significant modulation of inter-stimuluspattern similarity could be found.
Modulation of pattern discriminability
Our results demonstrate modulation of stimulus evoked patterndiscriminability as a consequence of multisensory interactions inhuman early retinotopic cortex. They are in accordwith and extend re-cent findings in macaque primary auditory cortex (Kayser et al., 2010)and superior temporal sulcus (Dahl et al., 2010). Notably, we observedthesemodulations in early visual cortex using high-contrast visual stim-uli that covered only central parts of the visual field (b10° eccentricity).Our data suggest that this effect reflected modulations of inter-trialreliability of neural activation patterns for a given stimulus, i.e. theaverage multivariate mean for a given stimulus was not shifted, butthe trial-by-trial scatter around this mean depended on multisensorycontext. This is also in line with the findings of Kayser et al. (2010)and Dahl et al. (2010).
Note that we could not discriminate BOLD signal patterns in visualcortex evoked by purely auditory stimuli. This contrasts with the find-ings that auditory motion direction can be decoded from lateral oc-cipital cortex (Alink et al., 2012) and visual stimulus identity can bedecoded from early auditory cortex (Hsieh et al., 2012; Meyer et al.,2010). A possible explanation for this difference is that such effectsrely on top-down attention or even cross-modally evoked imagery(Hsieh et al., 2012; Meyer et al., 2010). It is possible that this kindof effect was prohibited or attenuated by our fixation task. Alterna-tively, it is possible that only certain types of auditory signal such asthose associated with motion can be decoded from visual cortex.
Interestingly modulations of BOLD pattern discriminability in vi-sual cortices were not accompanied by overall amplitudemodulationsin our experiment. This differs from the results of previous fMRI stud-ies that found increased univariate signals in early sensory areas foraudiovisual concurrent compared to purely visual stimulation (e.g.Martuzzi et al., 2007; Noesselt et al., 2007; Watkins et al., 2006). Thisdifference might reflect the fact that these earlier studies used tran-sient, periliminal or low contrast stimuli while here we used natural-istic stimuli. Also, Kayser et al. (2010) and Dahl et al. (2010) found
y=-8 y=2 y=12
z=-5 z=0 z=5
a) Congruent > Muted
b) Muted > Incongruent
Fig. 3. Results for whole brain searchlight analysis. Heat maps for searchlight contrasts. Searchlight maps indicating local pattern discriminability for each condition werenormalised and contrasted on the second level (see Materials and methods for details). Colour coding for t-values is indicated by colour bars at the bottom of a) and b). Pleasenote that the contrast between the audiovisual incongruent and congruent conditions was tested as well but yielded no significant results. Note that contrasts are directed andthat contrasts of opposite direction yielded no significant results.
a) Increased pattern discriminability for the audio-visual congruent condition as compared with the visual only condition in bilateral superior temporal gyrus (see Table 1 andResults section for details).
b) Increased pattern discriminability for the visual only condition as compared with the audio-visual incongruent condition in left lateral occipital area and the banks of thecalcarine.
Table 2Significant clusters for the univariate analysis. Details of clusters for which signal inten-sity was significantly different between conditions. Coordinates of peak voxels are inMNI space, cluster size is in voxels and p-values are whole brain FWE corrected atcluster level, t-values correspond to peak voxels. Anatomical labels refer to the JuelichHistological atlas. See Materials and methods for details.
Contrast p value Clustersize
t-value Peak voxels Labels
AV congruent–V b .001 1392 8.32 [57 −31 13] r superiortemporal gyrus
7.81 [69 −22 16] ″
7.69 [54 −7 −8] ″
b .001 900 8.26 [−57 −16 10] l superiortemporal gyrus
7.76 [−48 −25 10] ″
7.05 [−42 −19 13] l Rolandicoperculum
AV incongruent–V b .001 1461 8.04 [54 −7 8] r superiortemporal gyrus
7.34 [57 −31 13] ″
7.20 [45 −19 13] r Heschl's gyrusb .001 1002 7.27 [−48 −25 10] l superior
temporal gyrus7.17 [−54 −1 −14] ″
7.02 [−48 −1 −8] ″
264 B. de Haas et al. / NeuroImage 70 (2013) 258–267
somenet amplitude reduction for bimodal stimulation. However, our Vcondition differed from their design: in our experiment it was nottruly unimodal because scanner noise was present throughout theexperiment. Increased BOLD amplitude is also observed in parts ofearly visual cortex for spatially incongruent (vs. congruent) audiovi-sual stimuli (Meienbrock et al., 2007). Our failure to find such an effectmight be due to differences in stimuli and design. Audiovisual in/congruence was specific to spatial alignment in that earlier studywhile our manipulation affected temporal and semantic congruenceas well. Also, we used an orthogonal fixation task, while the earlierstudy required participants to explicitly judge the spatial congruencyof stimuli. Congruency effects may therefore be task-dependent andthis should be examined in future work. Stimulus and congruencydirected attention might influence multisensory modulation of uni-variate response levels. Finally, the effect reported in that earlierstudy was only observed for a subgroup of vertices within retinotopicROIs of one hemisphere at a relaxed statistical threshold so our failureto observe such moderate effects may be due to a lack in statisticalpower. Whatever the reasons for the dissociation between modula-tion of overall amplitude and pattern discriminability in the presentwork, it renders our results important in the context of the debateabout criteria for multisensory interactions. These usually concern dif-ferent types of amplitudemodulation and the question which of themqualify as ‘multisensory’ (e.g. Beauchamp, 2005). Our results demon-strate multisensory interactions in the absence of any detectable net

a) Congruent > Muted
b) Incongruent > Muted
z=0 z=10 z=20
z=0 z=10 z=20
Fig. 4. Results for whole brain univariate analysis. Heat maps indicating differences in signal amplitude between conditions. Colour coding for t-values is indicated by the colour barat the bottom. See Results section and Table 2 for details. Note that contrasts are directed and that contrasts of opposite direction yielded no significant results.
a) Increased signal amplitude for the audio-visual congruent condition as compared with the visual only condition in bilateral superior temporal gyri.b) Increased signal amplitude for the audio-visual incongruent condition as compared with the visual only condition in bilateral superior temporal gyri.
265B. de Haas et al. / NeuroImage 70 (2013) 258–267
amplitude modulation. Furthermore, one might argue that, in thecontext of naturalistic stimuli, modulation of pattern discriminabilitymay be themost relevant effect of multisensory interactions. Recently,it has been argued that the role of primary sensory cortices in audio-visual integration might be limited to low level stimulus featuresand transient stimuli (Giani et al., 2012; Werner and Noppeney,2010). The basis for this argument is the observed insensitivity ofthe (univariate) BOLD signal amplitude in primary auditory cortex tohigher order stimulus congruence (Werner and Noppeney, 2010)and the absence of cross-modulation frequencies for audio-visualsteady-state responses in MEG (Giani et al., 2012; note that the lattermethod does not allow the presentation of audio-visual congruentstimuli). Our results suggest the null results in these studies could re-flect an insensitivity of the analysismethods used to detectmodulationsof the encoded stimulus information (like pattern discriminability orpattern reliability). This underscores the need for further research toclarify the exact role of primary sensory cortices in audiovisual stimulusintegration.
Potential mechanisms modulating audiovisual pattern discriminability
How do sounds affect the reliability of early visual cortex signals?Most likely this effect rests on subthreshold modulation of visualneurons, rather than on classical bimodal neurons. Bimodal neuronsin early visual cortex seem to be restricted to the far periphery of vi-sual space (which we did not stimulate here) whereas subthreshold
modulation also affects more central representations (Allman andMeredith, 2007). Furthermore, multisensory modulation of spiketrain discriminability is found for subthreshold modulation of visualneurons (Dahl et al., 2010). One could speculate that this subthresholdmodulation in turn could be mediated via phase alignment of ongoingoscillations (e.g. Lakatos et al., 2007; Naue et al., 2011; Romei et al.,2012). Some results from a recent MEG study are of particular interest(Luo et al., 2010), showing that accuracy of decoding video stimulifrom phase patterns of occipital channels depends on audiovisual con-gruency. Furthermore, in that MEG study the trial-by-trial phasecoherence (i.e. reliability) for a given video stimulus was affected byaudiovisual congruency as well. It has been proposed that temporalprofiles of neural activity in different primary sensory areas canwork as oscillatory attractors on each other, effectively yielding an on-going modulation of excitability (Lakatos et al., 2009; Schroeder et al.,2008). This could serve to minimise temporal uncertainty (Friston,2009) and would be very similar to what was proposed as an earlytheory of ‘dynamic attention’ (Jones, 1976; Large and Jones, 1999).Note, that for our design such effects would likely be stimulus driven,rather than top-down controlled— participants were engaged in a fix-ation task and had no incentive to concentrate on the dynamic stimuliin the background.
If temporal fine-tuning is indeed a mechanism behind our finding,it is interesting thatMVPAwas sensitive enough to pick it up despite thecoarse temporal resolution of fMRI and the fact that decoding rests onspatial patterns of activation. The studies by Kayser et al. (2010) and

266 B. de Haas et al. / NeuroImage 70 (2013) 258–267
Dahl et al. (2010) investigated modulation of single unit firing ratevariability. This could translate to BOLD pattern variability, if the vari-ance of the net population amplitude in a voxel would be modulatedin effect — or at least the variance of modulatory pre-synaptic activitycontributing to the BOLD-signal (Cardoso et al., 2012; Friston, 2012).
Null results with regard to enhanced pattern discriminability and V1
Our data did not show significant modulation of pattern discrimi-nability in V1. For V2 and V3 they only showed reduced pattern dis-criminability in the AV incongruent condition, but no enhancementfor the AV congruent condition. Null-results need to be interpretedcautiously for several reasons. In our case, there are additional,design-specific reasons to be cautious: Multisensory interactions aregenerally more likely for peripheral (e.g. Allman and Meredith,2007) and degraded (e.g. Ernst and Banks, 2002; Fetsch et al., 2012)stimuli. However, our visual stimuli were naturalistic and had highcontrast, while the sounds we used were degraded due to scannernoise. Thus our design was suboptimal for evoking maximum cross-modal interaction effects and potentially biased towards detrimentaleffects on visual processing rather than enhancement. That said, onemight expect audio-visual effects to be stronger in V2 than V1 ifthey rest on direct crosstalk with auditory cortex, because these con-nections seem to be much sparser in V1 than in V2 (Rockland andOjima, 2003). Furthermore, Kayser et al. (2010) found enhancementof information representation in macaque A1 for AV congruent aswell as for AV incongruent stimuli. However, Dahl et al. (2010)found only significant information degradation for visual neurons inthe AV incongruent condition, but no significant enhancement forthe AV congruent condition. In sum, it might be possible that the sig-nal to noise ratio (SNR) of early visual responses is close to ceiling fornaturalistic stimuli, and thus early auditory responses are more likelyto gain from multisensory interactions. Future studies should para-metrically vary the SNR of visual stimuli (or possibly both modalities)to shed further light on this question.
Possible sources of multisensory interactions
Our data provide information about the effects of multisensoryinteractions in V1-3, but not about their source(s). The multisensoryeffects we observed could be mediated by feedback connectionsfrom multisensory cortices, by feed-forward connections from thesuperior colliculus and/or by direct connections between primarysensory areas (cf. Driver and Noesselt, 2008; Klemen and Chambers,2012) for an overview). In humans, analyses of functional connectiv-ity could provide hints regarding these possibilities (e.g. psycho-physiological interactions (PPI) Friston et al., 1997). Unfortunately,however, the optimal design requirements for MVPA are very dif-ferent from those for connectivity analyses (e.g. fast event relateddesigns to acquire many pattern examples for MVPA vs. longer taskblocks for PPI). Future studies could try to combine both analysistechniques by applying both kinds of designs in one sample. Thiswould allow testing for correlations between the individual strengthof modulation with regard to information representation and withregard to connectivity.
Conclusions
Multisensory interactions affect human visual cortex processingfrom its earliest stages. For naturalistic stimuli, these interactionscan be restricted to reliability modulations of fine-grained patternsand thus go undetected by common univariate analyses. This callsinto question the exclusivity of criteria for multisensory interactionsinvolving net amplitude modulation. The purpose of pattern discrim-inability modulations is likely to enhance encoding reliability (esp. forweak stimuli), but further research is needed.
Supplementary data to this article can be found online at http://dx.doi.org/10.1016/j.neuroimage.2012.12.061.
Acknowledgments
This work was funded by theWellcome Trust. TheWellcome TrustCentre for Neuroimaging is supported by core funding from theWellcome Trust 091593/Z/10/Z. We thank Martin Hebart for helpfulcomments and support staff for help with scanning. Jon Driver pro-vided valuable input to the design of this study.
References
Alink, A., Euler, F., Kriegeskorte, N., Singer, W., Kohler, A., 2012. Auditory motion direc-tion encoding in auditory cortex and high-level visual cortex. Hum. Brain Mapp.33, 969–978.
Allman, B.L., Meredith, M.A., 2007.Multisensory processing in “unimodal” neurons: cross-modal subthreshold auditory effects in cat extrastriate visual cortex. J. Neurophysiol.98, 545–549.
Allman, B.L., Bittencourt-Navarrete, R.E., Keniston, L.P., Medina, A.E., Wang, M.Y.,Meredith, M.A., 2008. Do cross-modal projections always result in multisensory in-tegration? Cereb. Cortex 18, 2066–2076.
Allman, B.L., Keniston, Æ.L.P., Meredith, M.A., 2009. Not just for bimodal neuronsanymore: the contribution of unimodal neurons to cortical multisensory process-ing. Brain Topogr. 157–167.
Beauchamp, M.S., 2005. Statistical criteria in FMRI studies of multisensory integration.Neuroinformatics 3, 93–113.
Brainard, D.H., 1997. The psychophysics toolbox. Spat. Vis. 10, 433–436.Budinger, E., Heil, P., Hess, A., Scheich, H., 2006. Multisensory processing via early cor-
tical stages: connections of the primary auditory cortical field with other sensorysystems. Neuroscience 143, 1065–1083.
Cappe, C., Thut, G., Romei, V., Murray, M.M., 2010. Auditory-visual multisensory inter-actions in humans: timing, topography, directionality, and sources. J. Neurosci. 30,12572–12580.
Cardoso, M.M.B., Sirotin, Y.B., Lima, B., Glushenkova, E., Das, A., 2012. The neuroimagingsignal is a linear sum of neurally distinct stimulus- and task-related components.Nat. Neurosci. 15, 1298–1306.
Clavagnier, S., Falchier, A., Kennedy, H., 2004. Long-distance feedback projections toarea V1: implications for multisensory integration, spatial awareness, and visualconsciousness. Cogn. Affect. Behav. Neurosci. 4, 117–126.
Dahl, C.D., Logothetis, N.K., Kayser, C., 2010. Modulation of visual responses in the su-perior temporal sulcus by audio-visual congruency. Front. Integr. Neurosci. 4, 10.
Deichmann, R., Schwarzbauer, C., Turner, R., 2004. Optimisation of the 3D MDEFTsequence for anatomical brain imaging: technical implications at 1.5 and 3 T.Neuroimage 21, 757–767.
Destrieux, C., Fischl, B., Dale, A., Halgren, E., 2010. Automatic parcellation of human cor-tical gyri and sulci using standard anatomical nomenclature. Neuroimage 53, 1–15.
Driver, J., Noesselt, T., 2008. Multisensory interplay reveals crossmodal influences on“sensory-specific” brain regions, neural responses, and judgments. Neuron 57, 11–23.
Ernst, M.O., Banks, M.S., 2002. Humans integrate visual and haptic information in a sta-tistically optimal fashion. Nature 415, 429–433.
Falchier, A., Clavagnier, S., Barone, P., Kennedy, H., 2002. Anatomical evidence of mul-timodal integration in primate striate cortex. J. Neurosci. 22, 5749–5759.
Fetsch, C.R., Pouget, A., DeAngelis, G.C., Angelaki, D.E., 2012. Neural correlates of reliability-based cue weighting during multisensory integration. Nat. Neurosci. 15, 146–154.
Fishman, M.C., Michael, P., 1973. Integration of auditory information in the cat's visualcortex. Vision Res. 13, 1415–1419.
Formisano, E., De Martino, F., Bonte, M., Goebel, R., 2008. “Who” is saying “what”?Brain-based decoding of human voice and speech. Science 970–973.
Friston, K., 2009. The free-energy principle: a rough guide to the brain? Trends Cogn.Sci. 13, 293–301.
Friston, K.J., 2012. What does functional MRI measure? Two complementary perspec-tives. Trends Cogn. Sci. 16, 491–492.
Friston, K.J., Buechel, C., Fink, G.R., Morris, J., Rolls, E., Dolan, R.J., 1997. Psychophysio-logical and modulatory interactions in neuroimaging. Neuroimage 6, 218–229.
Giani, A.S., Ortiz, E., Belardinelli, P., Kleiner, M., Preissl, H., Noppeney, U., 2012. Steady-state responses in MEG demonstrate information integration within but not acrossthe auditory and visual senses. Neuroimage 60, 1478–1489.
Hsieh, P.-J., Colas, J.T., Kanwisher, N., 2012. Spatial pattern of BOLD fMRI activation re-veals cross-modal information in auditory cortex. J. Neurophysiol. 107, 3428–3432.
Hsu, C.-W., Lin, C.-J., 2002. A comparison of methods for multiclass support vector ma-chines. EEE Trans. Neural Netw. 13, 415–425.
Iurilli, G., Ghezzi, D., Olcese, U., Lassi, G., Nazzaro, C., Tonini, R., Tucci, V., Benfenati, F.,Medini, P., 2012. Sound-driven synaptic inhibition in primary visual cortex. Neuron73, 814–828.
Jones, M.R., 1976. Time, our lost dimension: toward a new theory of perception, atten-tion, and memory. Psychol. Rev. 83 (5), 323–355 (Retrieved from http://www.ncbi.Psychological review 83, 323–55).
Kayser, C., Logothetis, N.K., Panzeri, S., 2010. Visual enhancement of the informationrepresentation in auditory cortex. Curr. Biol. 20, 19–24.
Klemen, J., Chambers, C.D., 2012. Current perspectives and methods in studying neuralmechanisms of multisensory interactions. Neurosci. Biobehav. Rev. 36, 111–133.

267B. de Haas et al. / NeuroImage 70 (2013) 258–267
Kriegeskorte, N., Goebel, R., Bandettini, P., 2006. Information-based functional brainmapping. Proc. Natl. Acad. Sci. U. S. A. 103, 3863–3868.
Lakatos, P., Chen, C.-M., O'Connell, M.N., Mills, A., Schroeder, C.E., 2007. Neuronal oscilla-tions and multisensory interaction in primary auditory cortex. Neuron 53, 279–292.
Lakatos, P., O'Connell, M.N., Barczak, A., Mills, A., Javitt, D.C., Schroeder, C.E., 2009. Theleading sense: supramodal control of neurophysiological context by attention. Neu-ron 64, 419–430.
Large, E., Jones, M., 1999. The dynamics of attending: how people track time-varyingevents. Psychol. Rev. 106, 119–159.
Larsson, J., Heeger, D.J., 2006. Two retinotopic visual areas in human lateral occipitalcortex. J. Neurosci. 26, 13128–13142.
Luo, H., Liu, Z., Poeppel, D., 2010. Auditory cortex tracks both auditory and visual stimulusdynamics using low-frequency neuronal phase modulation. PLoS Biol. 8, e1000445.
Macaluso, E., Frith, C.D., Driver, J., 2000. Modulation of human visual cortex bycrossmodal spatial attention. Science 289, 1206–1208.
Martuzzi, R., Murray, M.M., Michel, C.M., Thiran, J.-P., Maeder, P.P., Clarke, S., Meuli,R.A., 2007. Multisensory interactions within human primary cortices revealed byBOLD dynamics. Cereb. Cortex 17, 1672–1679.
Meienbrock, A., Naumer, M.J., Doehrmann, O., Singer, W., Muckli, L., 2007. Retinotopiceffects during spatial audio-visual integration. Neuropsychologia 45, 531–539.
Mesulam, M.M., 1998. From sensation to cognition. Brain 121 (Pt 6), 1013–1052.Meyer, K., Kaplan, J.T., Essex, R., Webber, C., Damasio, H., Damasio, A., 2010. Predicting vi-
sual stimuli on the basis of activity in auditory cortices. Nat. Neurosci. 13, 667–668.Molholm, S., Ritter, W., Murray, M.M., Javitt, D.C., Schroeder, C.E., Foxe, J.J., 2002. Mul-
tisensory auditory-visual interactions during early sensory processing in humans:a high-density electrical mapping study. Brain Res. Cogn. Brain Res. 14, 115–128.
Morey, R.D., 2008. Confidence intervals from normalized data: a correction to Cousineau(2005). Tutor. Quant. Methods Psychol. 4, 61–64.
Naue, N., Rach, S., Strüber, D., Huster, R.J., Zaehle, T., Körner, U., Herrmann, C.S., 2011.Auditory event-related response in visual cortex modulates subsequent visual re-sponses in humans. J. Neurosci. 31, 7729–7736.
Nishimoto, S., Vu, A.T., Naselaris, T., Benjamini, Y., Yu, B., Gallant, J.L., 2011. Reconstructingvisual experiences from brain activity evoked by natural movies. Curr. Biol. 21,1641–1646.
Noesselt, T., Rieger, J.W., Schoenfeld, M.A., Kanowski, M., Hinrichs, H., Heinze, H.-J.,Driver, J., 2007. Audiovisual temporal correspondence modulates human multi-sensory superior temporal sulcus plus primary sensory cortices. J. Neurosci. 27,11431–11441.
Pelli, D.G., 1997. The VideoToolbox software for visual psychophysics: transformingnumbers into movies. Spat. Vis. 10, 437–442.
Rockland, K.S., Ojima, H., 2003. Multisensory convergence in calcarine visual areas inmacaque monkey. Int. J. Psychophysiol. 50, 19–26.
Romei, V., Murray, M.M., Cappe, C., Thut, G., 2009. Preperceptual and stimulus-selectiveenhancement of low-level human visual cortex excitability by sounds. Curr. Biol.19, 1799–1805.
Romei, V., Gross, J., Thut, G., 2012. Sounds reset rhythms of visual cortex and corre-sponding human visual perception. Curr. Biol. 22, 807–813.
Schroeder, C.E., Lakatos, P., Kajikawa, Y., Partan, S., Puce, A., 2008. Neuronal oscillationsand visual amplification of speech. Trends Cogn. Sci. 12, 106–113.
Sereno, M.I., Dale, A.M., Reppas, J.B., Kwong, K.K., Belliveau, J.W., Brady, T.J., Rosen, B.R.,Tootell, R.B., 1995. Borders of multiple visual areas in humans revealed by func-tional magnetic resonance imaging. Science 268, 889–893.
Staeren, N., Renvall, H., De Martino, F., Goebel, R., Formisano, E., 2009. Sound categoriesare represented as distributed patterns in the human auditory cortex. Curr. Biol.19, 498–502.
Thorne, J.D., De Vos, M., Viola, F.C., Debener, S., 2011. Cross-modal phase reset predictsauditory task performance in humans. J. Neurosci. 31, 3853–3861.
Watkins, S., Shams, L., Tanaka, S., Haynes, J.D., Rees, G., 2006. Sound alters activity inhuman V1 in association with illusory visual perception. Neuroimage 31, 1247–1256.
Werner, S., Noppeney, U., 2010. Distinct functional contributions of primary sensoryand association areas to audiovisual integration in object categorization. J. Neurosci.30, 2662–2675.