Embed Size (px)
DESCRIPTION
Sound Models
Citation preview

Auditory Perceptionand
Sound Models
Cecilia R. AragonIEOR 170
UC BerkeleySpring 2006

Acknowledgments
• “How the Ear Functions,”http://www.archive.org/details/HowtheEa1940
• Brian Bailey, http://www-faculty.cs.uiuc.edu/~bpbailey/teaching/2006-Spring/cs414/index.html
• Dan Russell, http://www.kettering.edu/~drussell/demos.html
Spring 2006 IEOR 170 2
• Dan Russell, http://www.kettering.edu/~drussell/demos.html• James Hillenbrand,
http://homepages.wmich.edu/~hillenbr/AuditoryPerception.ppt• Lawrence Rosenblum, http://www.faculty.ucr.edu/~rosenblu/lab-
index.html (McGurk effect)• Andrew Green,
http://www.uwm.edu/~ag/teach_pdf/lecturenotes/perception/
Outline
• How the Ear Functions• Physical Dimensions of Sound• Perceptual Dimensions of Sound• Sound Intensity and the Decibel Scale
Spring 2006 IEOR 170 3
• Sound Intensity and the Decibel Scale• Pitch Perception• Loudness Perception• Timbre Perception• Digitization of Sound

How the Ear Functions
http://www.archive.org/details/HowtheEa1940
Spring 2006 IEOR 170 4

Physical Dimensions of Sound
Spring 2006 IEOR 170 5

Waves
• Periodic disturbances that travel through a
medium (e.g. air or water)
• Transport energy
Spring 2006 IEOR 170 6
• “What is a Wave?” Dan Russell,http://www.kettering.edu/~drussell/Demos/waves-intro/waves-intro.html

Sound
• A longitudinal, mechanical wave
– caused by a vibrating source
• Pack molecules at different densities
Spring 2006 IEOR 170 7
– cause small changes in pressure
• Model pressure differences as sine waves

Sound Waves
• Pure Tones - simple waves• Harmonics - complex waves consisting of
combinations of pure tones (Fourier analysis) -the quality of tone or its timbre (i.e. the
Spring 2006 IEOR 170 8
the quality of tone or its timbre (i.e. thedifference between a given note on a trumpetand the same note on a violin) is given by theharmonics
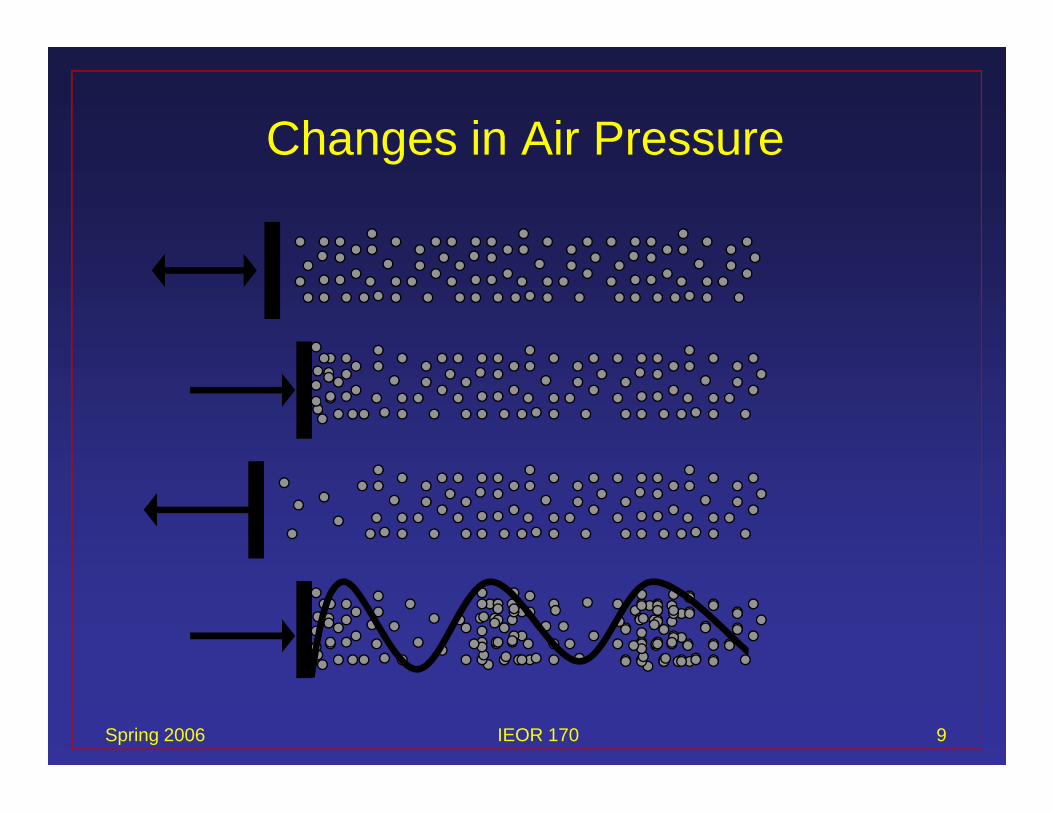
Changes in Air Pressure
Spring 2006 IEOR 170 9

Process of Hearing (Transduction)
Spring 2006 IEOR 170 10

Frequency (temporal) Theory
• Periodic stimulation of membrane matchesfrequency of sound– one electrical impulse at every peak– maps time differences of pulses to pitch
Spring 2006 IEOR 170 11
• Firing rate of neurons far below frequencies thata person can hear– Volley theory: groups of neurons fire in well-
coordinated sequence

Place Theory
• Waves move down basilar membrane– stimulation increases, peaks, and quickly tapers– location of peak depends on frequency of the sound, lower
frequencies being further away
Spring 2006 IEOR 170 12

Physical Dimensions of Sound
• Amplitude– height of a cycle– relates to loudness
• Wavelength (w)– distance between peaks
Spring 2006 IEOR 170 13
• Frequency ( λ )– cycles per second– relates to pitch– λ w = velocity
• Most sounds mix manyfrequencies & amplitudes Sound is repetitive changes
in air pressure over time

Perceptual Dimensions of Sound
Spring 2006 IEOR 170 14

Auditory Perception
Auditory perception is a branch of psychophysics.
Psychophysics studies relationships between perception andphysical properties of stimuli.
Physical dimensions: Aspects of a physical stimulus that canbe measured with an instrument (e.g., a light meter, a soundlevel meter, a spectrum analyzer, a fundamental frequency
Spring 2006 IEOR 170 15
level meter, a spectrum analyzer, a fundamental frequencymeter, etc.)
Perceptual dimensions: These are the mental experiencesthat occur inside the mind of the observer. These experiencesare actively created by the sensory system and brain based onan analysis of the physical properties of the stimulus. Perceptualdimensions can be measured, but not with a meter. Measuringperceptual dimensions requires an observer (e.g., a listener).

Visual Psychophysics:Physical Properties
Perceptual Dimensions of Light
Hue WavelengthBrightness LuminanceShape Contour/Contrast
Auditory Psychophysics:
Spring 2006 IEOR 170 16
Auditory Psychophysics:Physical Properties
Perceptual Dimensions of Sound
Pitch Fundamental FrequencyLoudness IntensityTimbre (sound quality) Spectrum Envelope/Amp Env

The Three Main Perceptual Attributes ofSound
•Pitch (not fundamental frequency)
•Loudness (not intensity)
•Timbre (not spectrum envelope or amplitude envelope)
Spring 2006 IEOR 170 17
The terms pitch, loudness, and timbre refer not to the physicalcharacteristics of sound, but to the mental experiences thatoccur in the minds of listeners.

Perceptual Dimensions
• Pitch– higher frequencies perceived as higher pitch– humans hear sounds in 20 Hz to 20,000 Hz range
Spring 2006 IEOR 170 18
• Loudness– higher amplitude results in louder sounds– measured in decibels (db), 0 db represents hearing
threshold

Perceptual Dimensions (cont.)
• Timbre– complex patterns added to the lowest, or
fundamental, frequency of a sound,referred to as spectrum envelope
– spectrum envelopes enable us todistinguish musical instruments
Spring 2006 IEOR 170 19
distinguish musical instruments
• Multiples of fundamental frequency givemusic
• Multiples of unrelated frequencies givenoise

Sound Intensity and the Decibel Scale
Spring 2006 IEOR 170 20

Sound Intensity
• Intensity (I) of a wave is the rate at which sound energyflows through a unit area (A) perpendicular to thedirection of travel
AP
tE
AI
1
Spring 2006 IEOR 170 21
P measured in watts (W), A measured in m2
• Threshold of hearing I0 is at 10-12 W/m2
• Threshold of pain is at 1 W/m2

Decibel Scale
• Describes intensity relative to threshold ofhearing based on multiples of 10
log10I
dB
Spring 2006 IEOR 170 22
0log10
II
dB

Decibels of Everyday Sounds
10Rustling leaves
45Ambient office noise
30Whisper
DecibelsSound
Spring 2006 IEOR 170 23
80Auto traffic
120Concert
180Spacecraft launch
140Jet motor
60Conversation

Interpretation of Decibel Scale
• 0 dB = threshold of hearing (TOH)• 10 dB = 10 times more intense than TOH• 20 dB = 100 times more intense than TOH• 30 dB = 1000 times more intense than TOH
• An increase in 10 dB means that the intensity of the
Spring 2006 IEOR 170 24
• An increase in 10 dB means that the intensity of thesound increases by a factor of 10
• If a sound is 10x times more intense than another, then ithas a sound level that is 10*x more decibels than theless intense sound

Loudness from Multiple Sources
• Use energy combination equation
)10...1010log(10 10101021 NLLL
L
Spring 2006 IEOR 170 25
where L1, L2, …, Ln are in dB

Exercises
• Show that the threshold of hearing is at 0 dB• Show that the threshold of pain is at 120 dB
• Suppose an electric fan produces an intensity of 40 dB. Howmany times more intense is the sound of a conversation if itproduces an intensity of 60 dB?
Spring 2006 IEOR 170 26
produces an intensity of 60 dB?
• One guitar produces 45 dB while another produces 50 dB. Whatis the dB reading when both are played?
• If you double the physical intensity of a sound, how many moredecibels is the resulting sound?

Pitch Perception
Spring 2006 IEOR 170 27

Pitch and Fundamental FrequencyAll else being equal, the higher the F0, the higher the perceived pitch.
Spring 2006 IEOR 170 28
Lower F0, lower pitch Higher F0, higher pitch

The ear is more sensitive to F0 differences in the lowfrequencies than the higher frequencies. This means that:
300 vs. 350 3000 vs. 3050
That is, the difference in perceived pitch (not F ) between
Pitch Perception
Spring 2006 IEOR 170 29
That is, the difference in perceived pitch (not F0) between300 and 350 Hz is NOT the same as the difference in pitchbetween 3000 and 3050 Hz, even though the physicaldifferences in F0 are the same.
300-350: 3000-3050:

Music Perception
•Tone height: A soundquality whereby a sound isheard to be of higher orlower pitch; monotonicallyrelated to frequency
•Tone chroma: A sound
Spring 2006 IEOR 170 30
•Tone chroma: A soundquality shared by tonesthat have the same octaveinterval
•Musical helix: Can helpvisualize musical pitch

Harmonic Frequencies
• Strings or pipes (trombone,flute organ) all haveresonant frequencies.
• They may vibrate at thatfrequency or some multipleof it
1f
2f1 octave
Spring 2006 IEOR 170 31
of it• All instruments and voices
carry some harmonics anddampen others
Length of string or pipe
3f
4f2 octaves
8f3 octaves

Loudness Perception
Spring 2006 IEOR 170 32

Loudness and IntensityAll else being equal, the higher the intensity, the greater the loudness.
Spring 2006 IEOR 170 33
Higher intensity, higher loudness Lower intensity, lower loudness

The relationship between intensity and loudnessDoubling intensity does not double loudness. In order to double loudness,intensity must be increased by a factor of 10, or by 10 dB [10 x log10 (10)= 10 x 1 = 10 dB]. This is called the 10 dB rule.
Two signals differing by 10 dB:
Note that the more intense sound is NOT 10 times louder even though itis 10 times more intense.
(500 Hz sinusoids)
Spring 2006 IEOR 170 34
is 10 times more intense.
The 10 dB rule means that a 70 dB signal is twice as loud as a 60 dBsignal, four times as loud as a 50 dB signal, eight times as loud as a 40dB signal, etc.
A 30 dB hearing loss is considered mild -- just outside the range ofnormal hearing. Based on the 10 dB rule, how much is loudness affectedby a 30 dB hearing loss?(Answer: 1/8th. But note that this does not mean that someone with a 30 dB loss will have 8 times more difficulty withspeech understanding than someone with normal hearing.)

Loudness is strongly affected by the frequency ofthe signal. If intensity is held constant, a mid-frequency signal (in the range from ~1000-4000Hz) will be louder than lower or higherfrequency signals.
Loudness Perception
Spring 2006 IEOR 170 35
frequency signals.
125 Hz, 3000 Hz, 8000 Hz
The 3000 Hz signal should appear louder than the125 or the 8000 signal, despite the fact that theirintensities are equal.

Loudness and Pitch
• More sensitive to loudness at mid frequenciesthan at other frequencies– intermediate frequencies at [500hz, 5000hz]
Spring 2006 IEOR 170 36
• Perceived loudness of a sound changes basedon the frequency of that sound– basilar membrane reacts more to intermediate
frequencies than other frequencies

Audibility Thresholds
Spring 2006 IEOR 170 37

Fletcher-Munson Contours
Spring 2006 IEOR 170 38
Each contour represents an equal perceived sound
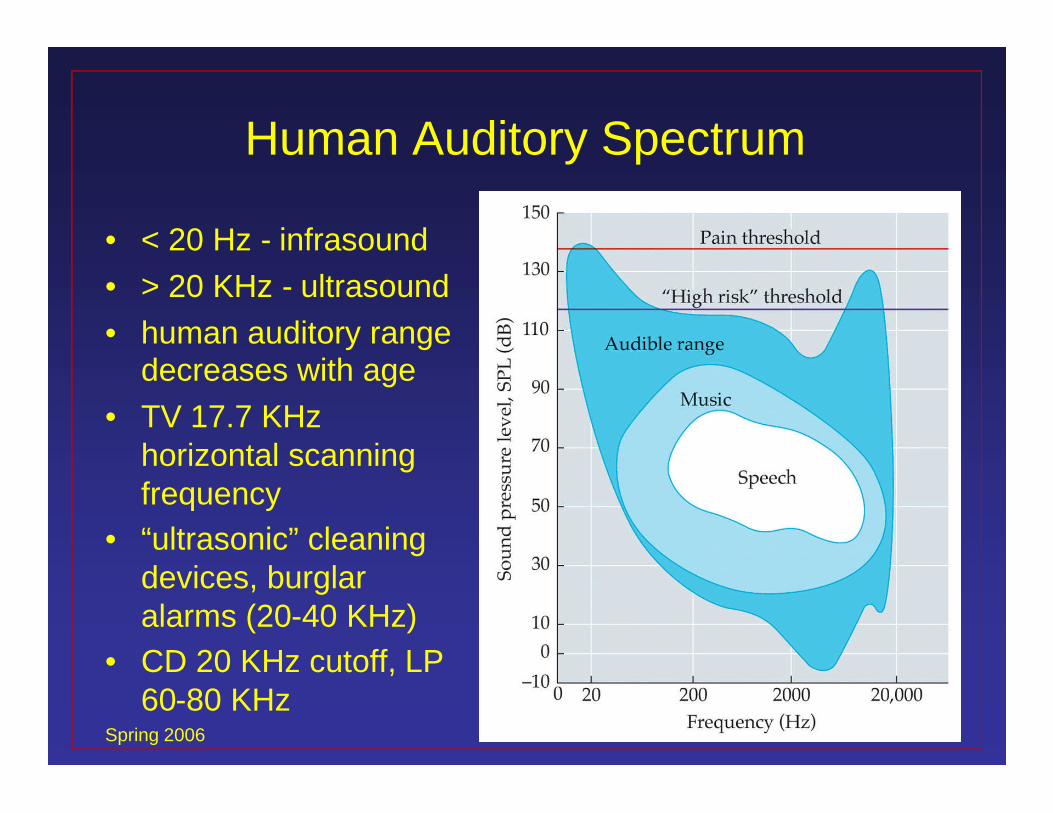
Human Auditory Spectrum
• < 20 Hz - infrasound• > 20 KHz - ultrasound• human auditory range
decreases with age• TV 17.7 KHz
Spring 2006 IEOR 170 39
• TV 17.7 KHzhorizontal scanningfrequency
• “ultrasonic” cleaningdevices, burglaralarms (20-40 KHz)
• CD 20 KHz cutoff, LP60-80 KHz
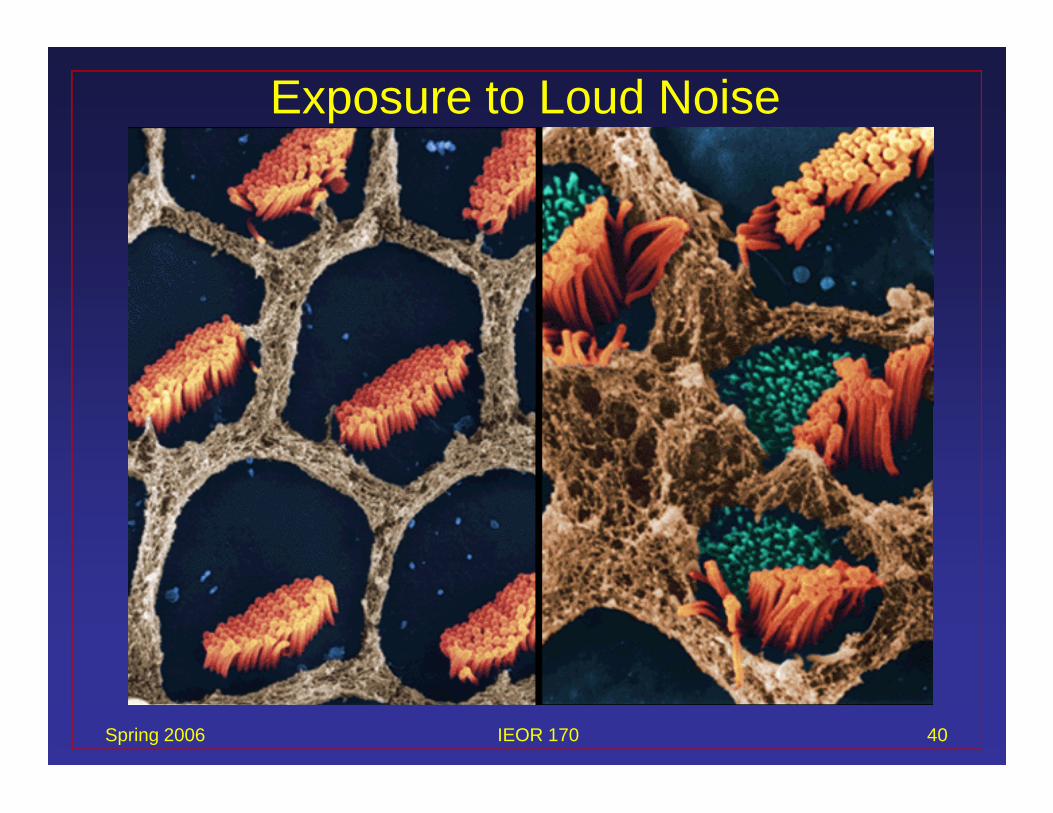
Exposure to Loud Noise
Spring 2006 IEOR 170 40

Timbre Perception
Spring 2006 IEOR 170 41

TimbreTimbre, also known as sound quality or tone color, is oddly defined interms of what it is not:
When two sounds are heard that match for pitch, loudness, and duration,and a difference can still be heard between the two sounds, thatdifference is called timbre.
For example: a clarinet, a saxophone, and a piano all play a middle C atthe same loudness and same duration. Each of these instruments has a
timbre tone color
Spring 2006 IEOR 170 42
unique sound quality. This difference is called timbre, tone color, orsimply sound quality.
There are also many examples of timbre difference in speech. Forexample, two vowels (e.g., /å/ and /i/) spoken at the same loudness andsame pitch differ from one another in timbre.
There are two physical correlates of timbre:spectrum envelopeamplitude envelope

Timbre and Spectrum Envelope
Spring 2006 IEOR 170 43
Timbre differences between one musical instrument and another arepartly related to differences in spectrum envelope -- differences in therelative amplitudes of the individual harmonics. In the examples above,we would expect all of these sounds to have the same pitch because theharmonic spacing is the same in all cases. The timbre differences thatyou would hear are controlled in part by the differences in the shape ofthe spectrum envelope.

Six Synthesized Sounds Differing in Spectrum Envelope
Spring 2006 IEOR 170 44
Note the similarities in pitch (due to constant F0/harmonic spacing) and thedifferences in timbre or sound quality.

Vowels Also Differ in Spectrum Envelope
Spring 2006 IEOR 170 45
Shown here are the smoothed envelopes only (i.e., the harmonic fine structure is notshown) of 10 American-English vowels.* Note that each vowel has a unique shape to itsspectrum envelope. Perceptually, these sounds differ from one another in timbre.Purely as a matter of convention, the term timbre is seldom used by phoneticians, althoughit applies just as well here as it does in musical acoustics. In phonetics, timbre differencesamong vowels are typically referred to as differences in vowel quality or vowel color.*From Hillenbrand, J.M, Houde, R.A., Clark, M.J., and Nearey, T.M. Vowel recognition from harmonic spectra. Acoustical Society of America, Berlin, March,1999.

Aperiodic sounds can also differ in spectrum envelope, and the perceptualdifferences are properly described as timbre differences.
Spring 2006 IEOR 170 46

Amplitude Envelope• Timbre also affected by amplitude envelope
• sometimes called the amplitude contour or energy contour of thesound wave
• the way sounds are turned on and turned off
Spring 2006 IEOR 170 47
Leading edge = attack Trailing edge = decay
The attack especially has a large effect on timbre.

Music examples(timbre differences related to amplitude envelope)
Plucked vs. bowed stringed instruments
The damping pedal on a piano
The difference in sound quality between a hammered string (e.g.,a piano) and a string that is plucked by a quill (e.g., aharpsichord).
Spring 2006 IEOR 170 48
The timbre differences that distinguish one musical instrument fromanother appear to be more closely related to differences in amplitudeenvelope -- and especially the attack -- than to the shape of thespectrum envelope (although both play a role). For example, when theamplitude contour of an oboe tone is imposed on a violin tone, theresulting tone sounds more like an oboe than a violin.*
*White, G.D. The Audio Dictionary, 1987, Seattle: University of Washington Press.

Same melody, same spectrum envelope (if sustained), differentamplitude envelopes (i.e., different attack and decay characteristics).
Note differences in timbre or sound quality as the amplitude envelope
varies.
Spring 2006 IEOR 170 49

Timbre differences related to amplitude envelope also play a role inspeech. Note the differences in the shape of the attack for /b/ vs./w/ and /S/ vs. /tS/.
abrupt attack
abrupt attack
more gradual attack
Spring 2006 IEOR 170 50
abrupt attack
more gradual attack

Hearing Lips and Seeing Voices(The McGurk Effect)
http://www.faculty.ucr.edu/~rosenblu/lab-index.html
Spring 2006 IEOR 170 51

Digitization of Sound
Spring 2006 IEOR 170 52
[Steinmetz and Nahrstedt]

Digitization
Microphones, video cameras produce analog signals(continuous-valued voltages)
Spring 2006 IEOR 170 53
To get audio or video into a computer, we must digitize it(convert it into a stream of numbers)
So, we have to understand discrete sampling (both timeand voltage)

Discrete Sampling
• Sampling -- divide the horizontal axis (the timedimension) into discrete pieces. Uniform sampling isubiquitous.
• Quantization -- divide the vertical axis (signal strength)into pieces. Sometimes, a non-linear function is applied.
Spring 2006 IEOR 170 54
into pieces. Sometimes, a non-linear function is applied.8 bit quantization divides
the vertical axis into 256levels. 16 bit gives you65536 levels.

Sampling (in time)
• Measure amplitude at regular intervals
• How many times should we sample?
Spring 2006 IEOR 170 55

Nyquist Theorem• Suppose we are sampling a sine wave. How often do we need to
sample it to figure out its frequency?
Spring 2006 IEOR 170 56
If we sample at 1 time per cycle, we can think it's a constant.

Nyquist Rate
If we sample at 1.5 times per cycle, we can think it's alower frequency sine wave.
Spring 2006 IEOR 170 57
Nyquist rate -- "For lossless digitization, the samplingrate should be at least twice the maximum frequencyresponse."

Digital Audio
• Standard music CD:– Sampling Rate: 44.1 kHz– 16-bit samples
Spring 2006 IEOR 170 58
– 16-bit samples– 2-channel stereo– Data transfer rate = 21644,100 = 1.4 Mbits/s– 1 hour of music = 1.43,600 = 635 MB