Embed Size (px)
Citation preview
PHILADELPHIA DEPARTMENT OF COMMERCE ANNUAL REPORT ON JOBS AND ECONOMIC DEVELOPMENT 2014


INTRODUCTION
EMPLOYMENT TRENDS
PHILADELPHIA WORKS PROGRAMMING TO SUPPORT JOB GROWTH
ECONOMIC DEVELOPMENT PROGRAMMING LED BY THE CITY OF PHILADELPHIA
1
2
3
4
5 CONCLUSION AND RECOMMENDATIONS
APPENDIX
TABLE OF CONTENTS
Photo Credit: B. Krist

2 IN
TRO
DU
CTIO
N
Photo Credit:M. Edlow

In 2011, Philadelphia City Council passed Resolution No. 110063 forming the Jobs Commission1. The Jobs Commission was established to create and retain private sector jobs for city residents. To that end, the tasks of the commission were to:
Determine a consistent and comprehensive strategy for City government, public, quasi-public and non-profit agencies to marshal resources in order to create and preserve private-sector jobs for Philadelphians;
Identify all entities that play a significant role, either directly or indirectly, in influencing the growth of the local private sector economy and evaluate the effectiveness of those entities;
Articulate the key factors that contribute to or impede the growth and retention of private sector jobs for Philadelphians;
Identify successful job creation policies and initiatives used in other jurisdictions;
Develop a set of principles to guide future decision-making with respect to job creation initiatives;
Develop specific recommendations for reform.
The committee was chaired by Robert C. Nelson, a retired President and CEO of Philadelphia OIC, Inc. from September 2012 to January 2013. The Jobs Commission conducted monthly meetings, convened several sub-committees, held two public hearings, and worked with Econsult Solutions, Inc., a Philadelphia-based economic consulting firm, to assemble secondary data, survey responses, best practices research, and policy recommendations. The first of fifteen recommendations outlined in the Jobs Commission final report instructed the Department of Commerce to publish an annual report assessing the impact of the City’s economic development strategy on job creation and retention. The second recommendation broadened the report to include a section on workforce activities through the efforts of Philadelphia Works and the impact that these efforts are having on job creation and retention.
This is the first annual report produced in response to the Commission’s recommendation. The report covers employment information from 2007 to 2014, providing an overview of the economic development programs that the City runs to support small businesses and entrepreneurs throughout Philadelphia.
1 The resolution can be found at http://www.phila.gov/citycouncil.
It highlights the progress and impact that the City and its partner agencies have been making within commercial corridors throughout Philadelphia. The Department of Commerce focuses on fostering a local economy that will lead to job creation, by increasing the number of businesses in the city, reducing vacancies on neighborhood commercial corridors, increasing access to contracts for minority and women owned businesses, and ensuring businesses have access to capital. For many of its programs, it is infeasible for the City to measure exactly how many jobs are created, or a number of jobs created would not be an appropriate metric for program success. In these cases, the City has measured other impact milestones that are widely known to lead to job creation and economic revitalization.
3 IN
TRO
DU
CTIO
N

4 EM
PLO
YMEN
T TREN
DS
Photo Credit: G. Widman

EMPLOYMENT
Based on seven years of data from the Bureau of Labor Statistics (BLS) starting in 2007, Philadelphia’s economic trends have seen significant improvement since the beginning of the U.S. Great Recession that began in December 2007. Similar to many cities across the United States, Philadelphia experienced severe job losses during the recent recession. The employment decline in Philadelphia was not as drastic as was seen across the nation and Philadelphia regained the lost jobs earlier than the majority of other U.S. cities. However, the impact of the job loss has been devastating for many Philadelphia and local area residents.
Between 2007 and 2009, Philadelphia lost nearly 10,000 jobs. Since then, the city’s economy has been steadily rebounding. In 2012, Philadelphia’s employment returned to pre-recession levels, reaching 531,245 jobs in the private sector.
Despite jobs returning to pre-recession levels, the unemployment rate of adults in Philadelphia remains higher than that of the nation as a whole2. For many decades, the city’s labor force participation rate stayed below Pennsylvania and national rates. Unlike much of the nation, where the labor force participation declined during the recession, the labor force participation in Philadelphia remained high during the recession. In other words, Philadelphians did not drop out of the labor force; they continued to work or seek work.
During the recession, the unemployment rate increased steadily from 6.0% in December 2007 to a peak of 11.9% in July 2012 and again in January 2013. Since then, it has been steadily declining, registering 6.3% in December 2014. There were 17,400 fewer unemployed adults in Philadelphia in 2014 than in 2013 and the unemployment rate decreased from 10.4% to 8%.
Private Employment in Philadelphia
540,000
550,000
530,000
520,000
510,000
500,0002007 2008 2009 2010 2011 2012 2013
1%
-1%
-3%
-5%
-7%
20082007 2009 2010 2011 2012 2013
Philadelphia PA U.S.
Philadelphia PA U.S.
12%
10%
8%
6%
4%
2%
0%2007 2008 2009 2010 2011 2012 2013 2014
Philadelphia PA U.S.
12%
10%
8%
6%
4%
2%
0%2007 2008 2009 2010 2011 2012 2013 2014
2 The labor force includes all persons classified as employed or unemployed. The unemployment rate represents the number unemployed as a percent of the labor force.
5 EM
PLO
YMEN
T TREN
DS
Employment by Industry During the Great Recession Over the last two decades, Philadelphia’s employment growth has been concentrated in education and medical industries. Employers in these sectors are place-based, which helps solidify a strong employment base for the city. In fact, employment in the healthcare sector grew slowly throughout the economic recession and the subsequent recovery period. During the recession, the construction and manufacturing industry sectors lost the largest share of jobs. More Philadelphians were employed in 2014 than in 2007 and the city has begun to recover jobs lost in construction and manufacturing. In 2013, employment in the business and financial services industry was below 2007 levels, although the sector had added jobs since 2012. Trade (both domestic and international), transportation, and utilities sectors, as well as leisure and hospitality, gained jobs since 2007 and continued to grow robustly from 2012 to 2013. Employment in education and health services has shown overall growth since 2007, despite a decline from 2012 to 2013. Fostering diverse economic growth is a priority for the region, as it both provides a wider range of occupations for residents and helps mitigate the effect of a specific industry’s response to business cycles and policy changes. For that reason and because manufacturing jobs provide family sustaining wages, the City is committed to supporting and sustaining local manufacturing businesses.
Source: Philadelphia Works’ analysis of the Quarterly Census of Employment & Wages, BLS
FIGURE 1: Total Private Employment
FIGURE 2: Change in Total Private Unemployment
Source: Philadelphia Works’ analysis of the Quarterly Census of Employment & Wages, BLS
FIGURE 3: Unemployment Rate
FIGURE 4: Change in Labor Force Indexed to 2007
Source: Philadelphia Works’ analysis of the Local Area Unemployment Statistics, BLS
Source: Philadelphia Works’ analysis of the Local Area Unemployment Statistics, BLS

2007 - 20132012 - 2013
ConstructionManufacturingEducation and Health Services
Business andFinancial Services
Trade, Transportationand Utilities
Leisure andHospitality Government
-23.1%
-6.2%
-14.6%
2.8% 2.2%0.8%
-6.0%
1.5%
5.9%
-2.4%
11.3%
2.8%4%
-1.1%
Overall, earnings across the U.S. have stayed stagnant and remain below 2007 levels. In Philadelphia, however, 2013 average annual wages were 0.9% above 2007 wages. In recent years, wage increases have been quite gradual (0.2% increase between 2012 and 2013), but the combination of a decrease in unemployment and recent pressure to increase the minimum wage point to a possible acceleration in the rate of wage increases in the coming years.
6 EM
PLO
YMEN
T TREN
DS
Trade, Transportation,and Utilities 14% (86,325 Jobs)
Government 16% (102,857 Jobs)
Education andHealth Service 31% (194,323 Jobs)
Business andFinancial Services 21% (132,151 Jobs)
Leisure andHospitality 10% (64,525 Jobs)
Construction 2% (9,868 Jobs)
Manufacturing 3% (21,772 Jobs)
Employment Trends in 2014 Traditional labor market data at the local level are not yet available for 2014. However, data from other non-traditional sources can provide insight on 2014 employment trends: changes in national employment, preliminary data on employment in Philadelphia, job postings activity, new hires data, and forecasts can all be used to paint an employment picture for Philadelphia today.
FIGURE 5: Percent Change of Jobs by Industry in Philadelphia, Comparing Change between 2007-2013 and 2012-2013
FIGURE 6: Employment by Industry in Philadelphia in 2013
Source: Philadelphia Works’ analysis of the Quarterly Census of Employment & Wages, BLSSource: Philadelphia Works’ analysis of the Quarterly Census of Employment & Wages, BLS
1.5%2001
-1.1%
-0.7%
-1.8%-2.0%
0.4% 0.3%
0.0% 0.1%
0.7%0.4% 0.3%
0.5%
1.3%
-1.6%
2002 2003 2004 2005 2006 2007 2008 2009 2010 2011 2012 2013 2014
1.0%
0.5%
-1.5%
-2.0%
-2.5%
0.0%
-0.5%
-1.0%
3 Philadelphia Metropolitan Division includes Bucks, Chester, Delaware, Montgomery, and Philadelphia Counties in Pennsylvania. 4 According to the data from the U.S. Bureau of Labor Statistics, Current Employment Statistics program.
7 EM
PLO
YMEN
T TREN
DS
Philadelphia U.S.
200820071.5%
1.0%
0.5%
0.0%
-0.5%
-1.0%
-1.5%
-2.0%
2009 2010 2011 2012 2013
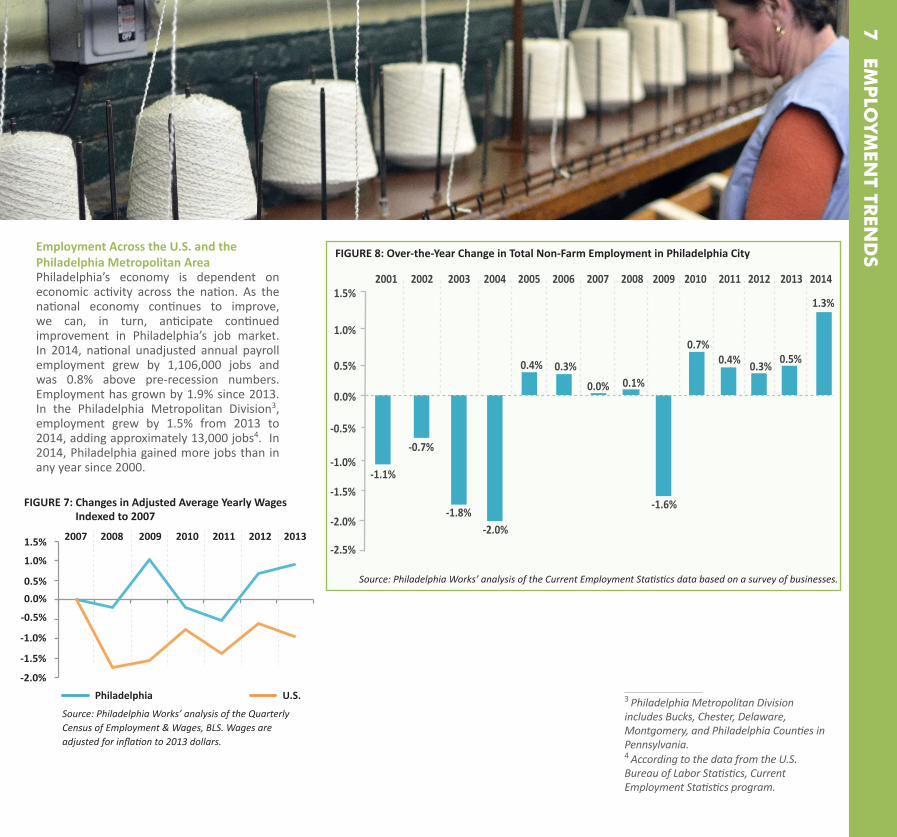
Employment Across the U.S. and the Philadelphia Metropolitan Area Philadelphia’s economy is dependent on economic activity across the nation. As the national economy continues to improve, we can, in turn, anticipate continued improvement in Philadelphia’s job market. In 2014, national unadjusted annual payroll employment grew by 1,106,000 jobs and was 0.8% above pre-recession numbers. Employment has grown by 1.9% since 2013. In the Philadelphia Metropolitan Division3, employment grew by 1.5% from 2013 to 2014, adding approximately 13,000 jobs4. In 2014, Philadelphia gained more jobs than in any year since 2000.
FIGURE 6: Employment by Industry in Philadelphia in 2013
FIGURE 7: Changes in Adjusted Average Yearly Wages Indexed to 2007
FIGURE 8: Over-the-Year Change in Total Non-Farm Employment in Philadelphia City
Source: Philadelphia Works’ analysis of the Quarterly Census of Employment & Wages, BLS. Wages are adjusted for inflation to 2013 dollars.
Source: Philadelphia Works’ analysis of the Current Employment Statistics data based on a survey of businesses.

5 Since some occupations are not customarily listed on the web, instead they are filled through other sources (e.g. labor unions and apprenticeship programs). It is not possible to give a complete picture of the available job opportunities within Philadelphia and its surrounding areas.
Measuring the Availability of Jobs through Online Job Openings Online job openings data are used to measure employment in real time. Job postings from a variety of job boards and corporate sites are captured by innovative web scraping job “spidering” software technology, which analyzes web-based job advertisements.
Approximately 25,100 to 35,600 jobs were advertised online in Philadelphia in 2014, an average of about 28,000 postings each month. There were 2.2 unemployed individuals per posting in 2013, and 1.7 unemployed individual per posting in 2014. Figure 11 shows the gap between the number of postings (blue line) and the number of unemployed individuals (orange line) narrowing. This is an encouraging trend, indicating more jobs available per unemployed adult.5
Change in the Average Volume of New Hires, 2013-2014 Trends in recent hiring provide insight into which industries are likely to experience an increase in employment in the near future. There was a 2% increase in the volume of new hires across all industries in 2013. During this period, education and health services made up a large share of hiring, although the overall volume of hiring in these industries has declined since 2013. Hiring in construction increased by 7% from 2013, and wholesale and retail trade hiring increased by 19%, indicating that manufacturing activity might pick up soon. Similarly, hiring increases in management, professional and technical services also hint that the economy is gaining strength.
Preliminary Data on Employment in Philadelphia While preliminary data for 2014 are subject to change, current estimates show private employment in Philadelphia was above 2013 levels every month from January through September. On average, employment in 2014 was 2% above 2013 levels. Construction (5.1%) and leisure and hospitality (2.8%) had the highest increases, while employment in manufacturing (-1.2%) and government (-1.9%) declined, as illustrated in figure 10.
8 EM
PLO
YMEN
T TREN
DS
Job Postings Unemployed
100,000
80,000
60,000
40,000
20,000
0Mar10
Sep10
Mar11
Sep11
Mar12
Sep12
Mar13
Sep13
Mar14
Sep14
2014 (preliminary) 2013
550,000
540,000
530,000
520,000
510,000Jan Feb Mar Apr May Jun Jul Aug Sep
6.0%
5.0%
4.0%
3.0%
2.0%
1.0%
0%
-1.0%
-2.0%
-3.0%
-1.2%
1.6%
5.1%
1.8%
0.7%
1.7%
2.8%
-1.9%Manufacturing
Construction
TotalPrivate Business
& Financial Services
Leisure &Hospitality
Government
Education& Health Services
Trade, Transport.,
& Utils.
Source: Philadelphia Works’ analysis of the Quarterly Census of Employment & Wages, BLS. The 2014 data are preliminary.
Construction employment is non-disclosable for January through March 2013 and only averages for April through September were included.
FIGURE 9: Private Employment in Philadelphia: 2014 vs. 2013
FIGURE 10: Percent Change in Average Employment 2013 to 2014
FIGURE 11: Number of Unemployed Adults vs. Number of Online Job Postings in Philadelphia
Source: Philadelphia Works’ analysis of the Quarterly Census of Employment & Wages, BLS. The 2014 data are preliminary.
Source: Philadelphia Works’ analysis of the HWOL data released by Center for Workforce Information & Analysis.

0
$20,000
$40,000
$60,000
Self-sufficiency level (single adult): $22,146
Self-sufficiency level (adult+preschooler): $42,691
Less thanHigh School
High SchoolDiplomaor GED
Some College
Bachelor’s Degree +
Adults25-64
$21,134$29,219
$34,810
$50,741
$35,666
6 http://www.philadelphiafed.org/research-and-data/real-time-center/survey-of-professional-forecasters/2014/survq414.cfm 7 Philadelphia Works analysis of the 2010-2012 American Community Survey PUMS micro data; PathWays PA: Overlooked and Undercounted 2012. http://pathwayspa.org.mytempweb.com/wp-content/uploads/2014/01/Overlooked-and-Undercounted-2012.pdf
15%Less than High School
High School Graduate or Equivalency
Some College or Associates Degree
Bachelor Degree or Higher
33.2%
24.7%
26.4%
have struggled to reenter a job market where expectations have shifted significantly. Some of these workers accepted lower wage jobs for lack of better-paying alternatives. Adults with lower education have higher unemployment rates and lower income.
The City’s ongoing goal has been to facilitate lower skilled individuals finding jobs that provide family-sustaining wages. In Philadelphia, the sustaining wage for a single adult, based on a 40-hour work week and year-round employment in 2012, is $22,146 ($11/hour). For one adult with a preschooler, the needed wage is $42,691 ($21/hour)7.
Manufacturing
7%Construction
-15%
Wholesale and Retail 19%
Leisure and Hospitality
Education and Health Services
Business and Financial Services 6%
-8%
4%
A Federal Reserve Bank survey of professional forecasters reported that the U.S. real GDP would grow 2.2% in 2014, 3.0% in 2015, 2.9% in 2016, and 2.7% in 2017. They also predicted that the unemployment rate would be an annual average of 6.2% in 2014, before falling to 5.6% in 2015, 5.4% in 2016, and 5.2% in 20176.
As businesses have downsized, existing staff have often assumed the responsibilities previously assigned to others. As a result, many employers expect workers to have more competencies and ability than they would have in the past. Workers with low skills and little education, displaced by the recession,
9 EM
PLO
YMEN
T TREN
DS
Please see the appendix for a list of growing occupations in Philadelphia that do not require a post-secondary degree.
FIGURE 12: Change in the Average Volume of New Hires, 2013-2014
FIGURE 13: Median Income by Educational Attainment
Source: Philadelphia Works’ analysis of the New Hires data available through Center for Workforce Information & Analysis, PA Department of Labor & Industry.
Source: The 2011-2013 American Community Survey 3 year data. Percentages are estimates only and have margins of error.
Source: Philadelphia Works’ analysis of the 2011-2013 American Com-munity Survey 3 year data. Numbers are estimates only and have margins of error.
FIGURE 14: Educational Attainment for Adults Ages 25 to 64 in Philadelphia, 2011-2013

10 EC
ON
OM
IC D
EVELO
PM
ENT P
RO
GR
AM
MIN
G LED
BY TH
E CITY O
F PH
ILAD
ELPH
IA

8 Birch, D. (1979). The Job Generation Process. U.S. Department of Commerce, National Technical Information Service.9 U.S. Small Business Administration. Small Business Trends. Retrieved September 28, 2013 from http://www.sba.gov/content/small-business-trends.
SUPPORT TO SMALL BUSINESSES
Small Businesses Are The Drivers of Economic Growth and Job Creation In 1979, economist David L. Birch argued in a report titled The Job Generation Process that small businesses are the drivers of economic growth and job creation.8 The majority of businesses in the U.S. are small or medium-sized businesses. Findings showed that smaller-sized businesses in the U.S. (defined as having less than twenty employees) are the overwhelming the majority (98%) of businesses, and they also account for the majority of job creators. The U.S. Small Business Administration conducted a report, which found that since the 1970’s, “small businesses have accounted for 55% of all jobs and 66% of all net new jobs.”9 Existing businesses are responsible for creating the majority of new jobs (60%), and start-ups for 40% of new job creation.10
The Philadelphia Department of Commerce is the umbrella organization which administers all economic development activity in the city. The Department of Commerce coordinates the work of related agencies, including the Philadelphia Industrial Development Corporation (PIDC) and the Philadelphia Redevelopment Authority (PRA) and other agencies to carry out its mission of creating an economic environment environment that is conducive to business success and job creation throughout Philadelphia.
The Department of Commerce is responsible for setting and spearheading policies, which help businesses in the city, from small shops to large corporations, thrive. The Department of Commerce coordinates activities along neighborhood commercial corridors, programs serving small businesses and entrepreneurs, major real estate development projects, large-scale business attraction and retention efforts, as well as efforts to increase contract opportunities for Minority, Women, and Disabled owned businesses.
THE CITY’S ECONOMIC DEVELOPMENT PROGRAMS
FALL INTO FIVE CATEGORIES:
Support to Small Businesses
Improving Neighborhoods
Real Estate Services, Business Attraction and Retention
Minority Inclusion and Participation on City Contracts
(Office of Economic Opportunity)
Business Financing
Photo Credit: M. Kennedy
11 EC
ON
OM
IC D
EVELO
PM
ENT P
RO
GR
AM
MIN
G LED
BY TH
E CITY O
F PH
ILAD
ELPH
IA

SUPPORTING IMMIGRANT ENTREPRENEURS
According to the Pew Charitable Trusts’ 2015 State of the City11, Philadelphia has been steadily growing its population over the last eight years, adding more than 71,000 new residents. Furthermore, a recent study by The Economy League of Greater Philadelphia’s World Class Philadelphia initiative12 found that immigrants are fueling much of Philadelphia’s population growth and are making a significant contribution to neighborhood commercial corridors. “Immigrants currently make up 28% of Greater Philadelphia’s Main Street business owners and generate annual earnings of roughly $295 million.”13 In fact, immigrant entrepreneurs are the main driving force in revitalizing neighborhood commercial corridors. According to the same report, “Between 2000 and 2013, newcomer entrepreneurs from such countries as India, Korea, Greece, China, Vietnam, Ukraine, Italy, Pakistan, Mexico and Iran were responsible for a staggering 96% of Main Street business ownership growth in the region.” The Department of Commerce had an Immigrant Entrepreneurship initiative in place for four years, through a partnership with the U.S. Corporation for National Service. The Department Commerce is committed to supporting immigrant entrepreneurs and will seek out new resources to mitigate language and cultural barriers.
10 U.S. Small Business Administration. (2012). Frequently Asked Questions About Small Business. Retrieved September 28, 2013 from http://www.sba.gov/sites/default/files/FAQ_Sept_2012.pdf11 Pew State of the City 2015, “http://www.pewtrusts.org/en/research-and-analysis/reports/2015/03/philadelphia-2015-the-state-of-the-city”12 http://worldclassgreaterphila.org/regionaldirection/2015/02/18/how-immigrant-entrepreneurs-are-driving-growth-in-greater-philadelphia13 Ibid.
The Department of Commerce provides small business technical assistance and entrepreneurship training to both start-up and established small businesses. The Office of Business Services (OBS) is a unit within Commerce that serves as the City’s frontline to Philadelphia businesses. The OBS staff answer questions, offer guidance, and make referrals to take care of business issues. The Business Technical Assistance Program (BTAP) provides funding to non-profit organizations to work one-on-one and in classroom settings to support small businesses. The City partnered with Goldman Sachs
NEW BUSINESS Contacts
1,907
OFFICE OF BUSINESS SERVICES IN 2014
NEWLY CREATEDBusinesses
50 BUSINESS SERVICE
Hotline Calls
401
NEW BUSINESSCases
1,146
The Philadelphia Department of Commerce, Office of Business Services (OBS) The Office of Business Services (OBS) offers free assistance to any business, large or small, start-up or established, retail, industrial, service providers, and non-profits. OBS has three ways of providing support to small businesses: by phone via the business hotline,
12 EC
ON
OM
IC D
EVELO
PM
ENT P
RO
GR
AM
MIN
G LED
BY TH
E CITY O
F PH
ILAD
ELPH
IA
10,000 Small Businesses in 2012 to bring their program to Philadelphia. A brief overview of the results of each of these programs is included below.
one-on-one support provided by one of OBS’s seven geographically placed Business Services Managers, and the business service website (www.phila.gov/business). Common support areas include: starting a business, permitting, licensing, financing, and taxes.

Business Technical Assistance Program (BTAP)In 2014, the City contracted with six non-profit agencies to provide technical assistance to small businesses and start-ups referred to as the Business Technical Assistance Program or BTAP. These organizations provide classes on how to start a business, one-on-one coaching, specialized workshops, and in some cases financing. All BTAP providers are required to report to the Department of Commerce on business and job creation. According to reports from 2014, the six BTAP providers under contract served 633 individuals self-employed with micro-enterprises. During that time period, the assistance to those micro-enterprise owners contributed to the documented retention of 218 jobs and creation of 15 new jobs.
Goldman Sachs 10,000 Small Businesses Program (GS10KSB)Goldman Sachs 10,000 Small Businesses is a national initiative that offers support to growth-stage small businesses through an educational program and a loan fund. Eligible businesses must have been in business for at least three years, have annual earnings between $500,000 and $2,000,000 and have at least four full-time employees.Philadelphia 10,000 Small Businesses (PHL10KSB) was launched in 2012 in collaboration with the Philadelphia Department of Commerce, the Community College of Philadelphia, PIDC, and other partners. The program aligns nicely with City goals by providing an educational program that targets small businesses that are at a point in their trajectory where they are ready to expand. A high percentage
13 EC
ON
OM
IC D
EVELO
PM
ENT P
RO
GR
AM
MIN
G LED
BY TH
E CITY O
F PH
ILAD
ELPH
IA
of the graduates of 10,000 Small Businesses create new jobs within a year of completing the program. Since the program launched in 2012, there have been 6 cohorts of students. Nearly 200 businesses have enrolled in the program to date (169 graduates and approximately 30 students in the upcoming cohort).
Although it is still early to measure job creation results for recent graduates, a comprehensive report which was developed by Babson College, titled Stimulating Small Business Growth, Progress Report on Goldman Sachs 10,000 Small Businesses, evaluated national outcome data from participating cities. The 2014 report identified that since the program’s launch in 2009, 44% of participants added new jobs within six months of graduating from the program. This is significantly higher than the national average; 18% of U.S. small businesses added jobs during 2013 to 2014, according to the National Small Business Association. 10,000 Small Businesses graduates also rapidly grew in size and in revenue. Of the participating companies, the average job creation rate was 36% and companies grew at an average 68%. These data clearly provide a vision of how impactful the program is and the opportunities it will offer to Philadelphia graduates.
On average, companies participating in
GOLDMAN SACHS 10,000 SMALL BUSINESSES
increased jobs by 36% and their revenue by 68%.
In 2014, the Office of Business Services made 1,907 new business contacts, gained 1,146 new business client cases, assisted 50 newly created businesses, and received 401 phone calls to the business hotline. Job creation cannot be documented directly through these cases. However, based on small businesses as job creation drivers, we know this work to be very important.
Office of Business Services clients reported being SATISFIED or VERY SATISFIED.
92%
Targeted Commercial Corridor Management ProgramCommerce funds selected non-profit organizations to hire a Corridor Manager to work with business, property owners, and other stakeholders to create and maintain an economically vibrant neighborhood commercial corridor.
Business Improvement District (BID) SupportA Business Improvement District is an area with a fixed boundary in which supplemental services are provided, funded either by a mandatory tax or fee, or by voluntary contributions made by property owners, institutions, or businesses within the district. Commerce provides assistance to groups wishing to explore forming a Business Improvement District to serve their commercial area, and also provides information and technical assistance to Philadelphia’s existing BIDs.
Commercial Corridor Cleaning Support ProgramCommerce provides between $20,000-$50,000 annually to selected organizations that perform regularly scheduled litter pick-up and cleaning within their neighborhood commercial corridor.
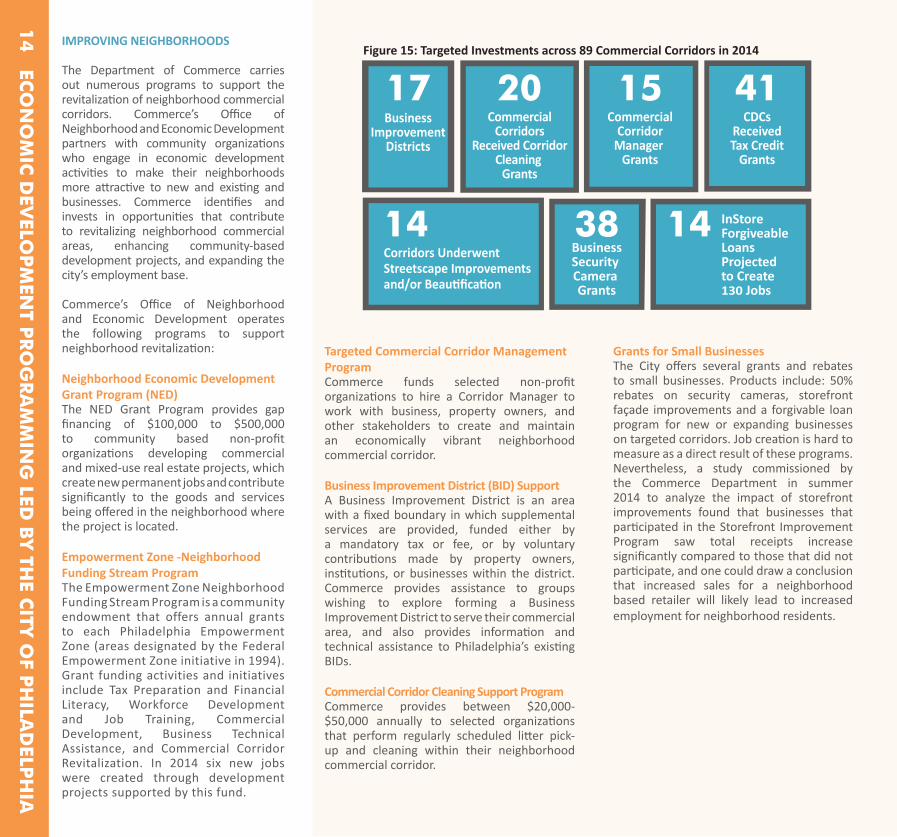
IMPROVING NEIGHBORHOODS
The Department of Commerce carries out numerous programs to support the revitalization of neighborhood commercial corridors. Commerce’s Office of Neighborhood and Economic Development partners with community organizations who engage in economic development activities to make their neighborhoods more attractive to new and existing and businesses. Commerce identifies and invests in opportunities that contribute to revitalizing neighborhood commercial areas, enhancing community-based development projects, and expanding the city’s employment base.
Commerce’s Office of Neighborhood and Economic Development operates the following programs to support neighborhood revitalization:
Neighborhood Economic Development Grant Program (NED)The NED Grant Program provides gap financing of $100,000 to $500,000 to community based non-profit organizations developing commercial and mixed-use real estate projects, which create new permanent jobs and contribute significantly to the goods and services being offered in the neighborhood where the project is located.
Empowerment Zone -Neighborhood Funding Stream ProgramThe Empowerment Zone Neighborhood Funding Stream Program is a community endowment that offers annual grants to each Philadelphia Empowerment Zone (areas designated by the Federal Empowerment Zone initiative in 1994). Grant funding activities and initiatives include Tax Preparation and Financial Literacy, Workforce Development and Job Training, Commercial Development, Business Technical Assistance, and Commercial Corridor Revitalization. In 2014 six new jobs were created through development projects supported by this fund.
CommercialCorridors
Received CorridorCleaning
Grants
20Business
ImprovementDistricts
17CDCs
ReceivedTax Credit
Grants
41
InStoreForgiveableLoansProjectedto Create130 Jobs
14Corridors UnderwentStreetscape Improvementsand/or Beautification
14BusinessSecurity Camera Grants
38
CommercialCorridor
Manager Grants
15
Grants for Small Businesses The City offers several grants and rebates to small businesses. Products include: 50% rebates on security cameras, storefront façade improvements and a forgivable loan program for new or expanding businesses on targeted corridors. Job creation is hard to measure as a direct result of these programs. Nevertheless, a study commissioned by the Commerce Department in summer 2014 to analyze the impact of storefront improvements found that businesses that participated in the Storefront Improvement Program saw total receipts increase significantly compared to those that did not participate, and one could draw a conclusion that increased sales for a neighborhood based retailer will likely lead to increased employment for neighborhood residents.
14 EC
ON
OM
IC D
EVELO
PM
ENT P
RO
GR
AM
MIN
G LED
BY TH
E CITY O
F PH
ILAD
ELPH
IA
Figure 15: Targeted Investments across 89 Commercial Corridors in 2014

14 These data were compiled utilizing City of Philadelphia Department of Revenue total receipts data from 2009-2012 for East Passyunk and 2010-2012 for Frankford. The analysis was limited to businesses that received grants through 2010 and 2011 to provide a common period of post grant outcomes.
Community Development Corporation (CDC) Tax Credit Program:The Community Development Corporation Tax Credit Program encourages and rewards local businesses that make a contribution and commitment to Philadelphia CDCs and their economic development efforts in distressed parts of the City. Businesses receive a tax credit equal to their donation to a qualifying CDC of choice, for between $85,000 and $100,000 annually over ten years.
Businesses and organizations are more likely to take advantage of these programs in areas that have active corridor management. For example, corridors with active Commercial Corridor Managers have seen more dramatic improvements in storefront vacancy rates than the citywide average, based on storefront surveys conducted by the City
Participated in SIP44%
Frankford
East Passyunk
19%
No SIP Participation
No SIP Participation
-5%
Participated in SIP
13%
FIGURE 16: Participants in the Storefront Improvement Program (SIP) See Greater Increases in Revenue
In the East Passyunk Avenue commercial corridor, the revenue for businesses received SIP grants went up 44% between 2009 and 2012 compared to an increase of 13% for businesses which did not participate in SIP.
On the Frankford Avenue commercial corridor in Fishtown, the revenue for businesses, which received SIP grants went up 19% between 2010 and 2012 compared to a decrease of 5% for businesses which did not participate in SIP.
STOREFRONT IMPROVEMENT PROGRAM
Source: Commerce Department 14
Planning Commission in 2003 and 2014. On a citywide scale, the average vacancy rate for all commercial corridors increased by .35% over the past decade, from 17.3% in 2003 to 17.65% in 2014. For the neighborhood pedestrian corridors which have an active corridor management in place, the average vacancy rates actually decreased by 6.2% over the same time period.
74% OCCUPIED
19% Vacant
Out of 2,198Commercial Storefronts on13 COMMERCIAL CORRIDORS with active corridor management in place
Over the past decade, on a citywide
scale, the average vacancy rate for all commercial corri-dors INCREASED by .35%.
In neighborhood commercial corridors with
active corridor management in place, average vacancy
rates actually DECREASEDby 6.2%.
15 EC
ON
OM
IC D
EVELO
PM
ENT P
RO
GR
AM
MIN
G LED
BY TH
E CITY O
F PH
ILAD
ELPH
IA
16 EC
ON
OM
IC D
EVELO
PM
ENT P
RO
GR
AM
MIN
G LED
BY TH
E CITY O
F PH
ILAD
ELPH
IA
15 While the number of businesses lost may appear high, small businesses experience high volatility na-tionwide. According to the SBA’s Office of Advocacy: “About half of all new establishments survive five years or more and about one-third survive 10 years or more.”
A New Program with Results! Instore Forgiveable Loan ProgramThe InStore Program offers forgivable loans for purchasing equipment, materials and making improvements, to eligible retail, food, and creative businesses that want to either establish a new location or expand at an existing one within the commercial corridor. The forgivable loan amount can range from $15,000 – $50,000 per project. The program does not require payments for five years, at which point the loan is forgiven if the recipient has met the requirements of the program guidelines.
Out of2,198
CommercialStorefronts on
13 commercialcorridors
69 New Businesses 235Jobs Created
These targeted improvements along commercial corridors are delivering results beyond improved vacancy rates. For example, corridor managers for the 13 commercial corridors with managers funded by the City reported and job creation in fiscal year 2014. Because these 13 corridor managers are contracted through the Department of Commerce, they are required to submit information quarterly that is used to measure program impacts, including job creation. In summary, these 13 corridors added 70 new businesses, but lost 56 (to closure or relocation), resulting in a net gain of 14 businesses in fiscal year 2014.15 These 14 new businesses represented a net gain of 98 jobs, which combined with job growth at existing businesses along the corridors, totaled 194 net new jobs along these 13 corridors alone in the 2014 fiscal year.
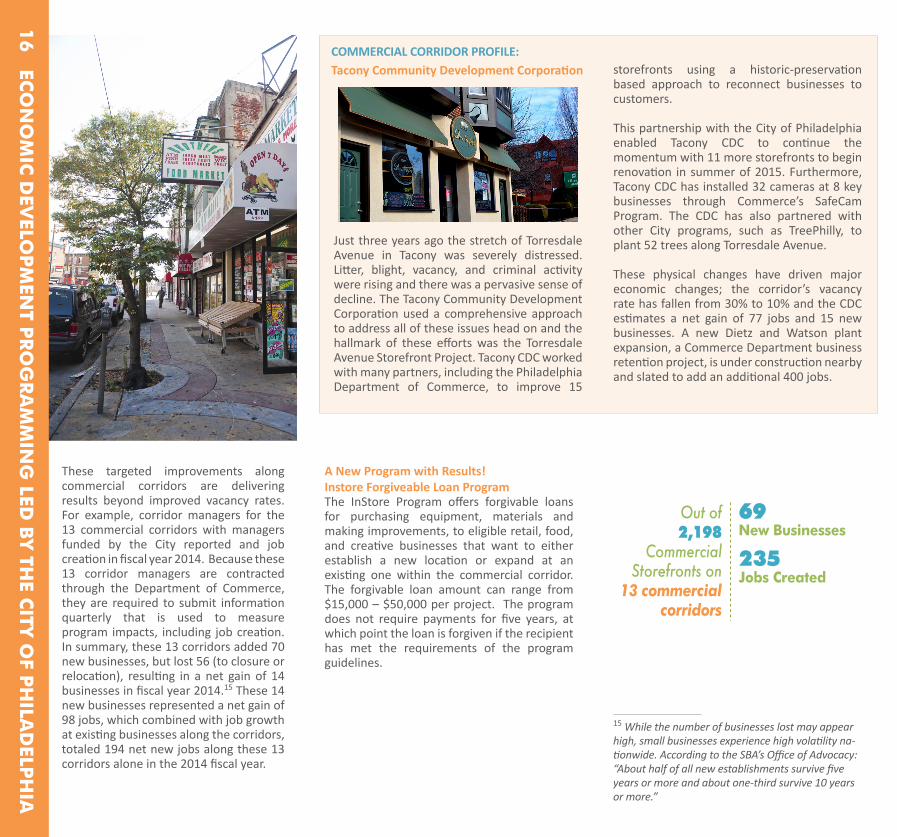
Just three years ago the stretch of Torresdale Avenue in Tacony was severely distressed. Litter, blight, vacancy, and criminal activity were rising and there was a pervasive sense of decline. The Tacony Community Development Corporation used a comprehensive approach to address all of these issues head on and the hallmark of these efforts was the Torresdale Avenue Storefront Project. Tacony CDC worked with many partners, including the Philadelphia Department of Commerce, to improve 15
COMMERCIAL CORRIDOR PROFILE: Tacony Community Development Corporation storefronts using a historic-preservation
based approach to reconnect businesses to customers.
This partnership with the City of Philadelphia enabled Tacony CDC to continue the momentum with 11 more storefronts to begin renovation in summer of 2015. Furthermore, Tacony CDC has installed 32 cameras at 8 key businesses through Commerce’s SafeCam Program. The CDC has also partnered with other City programs, such as TreePhilly, to plant 52 trees along Torresdale Avenue.
These physical changes have driven major economic changes; the corridor’s vacancy rate has fallen from 30% to 10% and the CDC estimates a net gain of 77 jobs and 15 new businesses. A new Dietz and Watson plant expansion, a Commerce Department business retention project, is under construction nearby and slated to add an additional 400 jobs.

In August 2013, The Rose Petals Cafe & Lounge opened for business on Chelten Avenue, a major commercial corridor in the Germantown neighborhood of Philadelphia. Germantown has been sorely lacking in sit-down cafes for many years. The InStore Forgivable Loan Program helps to revitalize commercial neighborhood corridors by strategically investing in businesses for the purpose of enhancing the commercial neighborhood. The Rose Petals Cafe & Lounge was the first recipient of the Department of Commerce’s InStore Forgivable Loan Program.
To receive an InStore loan, a business must show that it offers goods and services, can create jobs, and can increase local foot traffic. Rose Petals was awarded this loan because it is convenient to public transportation and provides the corridor community with one of the neighborhood’s only sit-down cafes. The funding The Rose Petals Cafe received was used to cover the cost of critical start-up supplies, (e.g. refrigeration units, a hood and exhaust system for the stove, and a coffee bar).
SMALL BUSINESS PROFILE: The Rose Petals Cafe And Lounge
Photo Credit: Philadelphia City Rep Flickr Page
BUSINESS ATTRACTION AND RETENTION IN 2014
TOTAL JOBS2,947
NEW FIRMS31
NEW JOBS2,758
RETAINED JOBS189
17 EC
ON
OM
IC D
EVELO
PM
ENT P
RO
GR
AM
MIN
G LED
BY TH
E CITY O
F PH
ILAD
ELPH
IAREAL ESTATE SERVICES, BUSINESS ATTRACTION & RETENTION
Business Attraction and Retention ProgramsThe Department of Commerce actively works to attract medium and large businesses to the City of Philadelphia through the Office of Business Attraction and Retention. Commerce’s Office of Business Attraction and Retention focuses on reaching businesses that are in the surrounding counties or in other U.S. locations, but also has an international component focused on attracting companies from overseas. In researching possible companies, the City prioritizes key growth sectors such as life sciences and healthcare, advanced manufacturing, logistics and distribution, hospitality, clean technology, financial services, and a growing entrepreneurial and startup community. These industries are experiencing tremendous growth nationwide and are also important job creators, as noted on page 4 (under Employment by Industry during the Great Recession).
Compared to major northeast peer cities, Philadelphia offers better value financially in terms of availability of office rentals, lower labor costs, and a comparatively lower cost of living. The City works in partnership with the Philadelphia Industrial Development Corporation (PIDC) to offer resources and incentives for new and growing businesses. These resources can include access to low-cost financing and tax credits for job creation, office location selection assistance for publically owned properties, and assistance with recruiting support workforce and training. New businesses can benefit from a variety of tax credits, such as $100,000 Annual Saleable Tax Credits (Keystone Innovation Zone), $25,000 Job Creation Tax Credit, and New Business Tax Exemptions through the City’s Jump Start Philly initiative.
In 2014, the Office of Business Attraction and Retention attracted and retained companies, leading to 2,947 new jobs created at 31 firms. Of these jobs, 2,947 were new and 189 retained. One example of the impact of the City’s business attraction efforts is the relocation of the America Bible Society, a non-profit organization which is relocating its headquarters from New York City to Center City Philadelphia, bringing 200 new full-time jobs to the city. It should be noted that these numbers are reported projections by participating companies, and thus are subject to change. Furthermore, jobs numbers are not reported uniformly to the Commerce Department.
Assist Real Estate Developers with Large-Scale ProjectsThe Real Estate Development unit helps large real estate projects get through approval and regulatory processes more easily by connecting Developers to key City departments through Developer Services committee meetings. This team can also serve as a liaison throughout the development process. Real estate development is a critical component of economic development. Physical projects create construction jobs and often help to attract new businesses and residents to the City. A prime example is the upcoming $325 million redevelopment of the Gallery shopping mall, expected to break ground in 2015, which will create 1,000 new permanent jobs and more than 2,000 construction jobs. Over the past several years, Philadelphia has been experiencing a real estate boom, which has contributed to a gradual increase in construction jobs – as highlighted on page 8 (under Preliminary Data on Employment in Philadelphia) – and anticipate this number to increase over the next few years.

18 EC
ON
OM
IC D
EVELO
PM
ENT P
RO
GR
AM
MIN
G LED
BY TH
E CITY O
F PH
ILAD
ELPH
IA
Office of Manufacturing and IndustryLocated within the Department of Commerce, the Office of Manufacturing & Industry (OMI) oversees the implementation of the Manufacturing Growth Strategy for Philadelphia, a product of the Mayor’s Manufacturing Task Force, and serves as a general resource for the industrial business community in Philadelphia. When the Mayor’s Manufacturing Task Force was created in 2013, the simple overarching goal was to provide Philadelphia with an industry-led roadmap and actionable recommendations for improving Philadelphia’s competitiveness and address barriers that inhibit growth in the sector.
Thirty manufacturers from the region answered this call to action, spending nearly one year developing a policy map. Almost fifty advisory committee members from government, nonprofit development, and for-profit firms contributed their expertise, along with a highly qualified consultant team led by IHS Global. The result is the Manufacturing Growth Strategy for Philadelphia, a living document that
serves as Philadelphia’s strategic plan for industrial development today and for years to come. It is clear in the Trends section of this document that the manufacturing sector is still struggling; however the City is making progress in bringing back manufacturing. The Nutter Administration is committed to reviving and reinventing the manufacturing industry, a key sector that fosters living wage, entry-level jobs for Philadelphians.
Philadelphia Industrial Development CorporationMuch of the work described above is carried out in a joint partnership with the Philadelphia Industrial Development Corporation (PIDC). PIDC is Philadelphia’s public-private economic development corporation with a mission to spur investment, support business growth and foster development that create jobs, revitalize neighborhoods and drive growth to every corner of Philadelphia. PIDC offers a variety of financing options for small and medium businesses, real estate development and community economic development. PIDC also has a portfolio of industrial and commercial real estate available for developers to consider.
Examples of Businesses Expanding in PhiladelphiaFMC and Comcast are prime examples of companies that are growing in Philadelphia. Both are expanding their headquarters within the Central Business District. Brandywine Realty Trust broke ground at the new 49-story, 861,000 square foot, FMC Tower at Cira Center South, and has leased 253,000 feet to FMC as the anchor tenant.
In July 2014, the Comcast Corporation broke ground for the 59-story, $1.2 billion Comcast Innovation and Technology Center office tower, which is adjacent to its headquarters building in Center City Philadelphia. As a result of this expansion, Comcast will be able to consolidate its employees into one location. The mixed-use tower is expected to be the tallest building in the U.S. outside of New York and Chicago and will be one of the largest private development projects in the history of Pennsylvania. The expansion is expected to create 1,500 new permanent jobs in Philadelphia.

19 EC
ON
OM
IC D
EVELO
PM
ENT P
RO
GR
AM
MIN
G LED
BY TH
E CITY O
F PH
ILAD
ELPH
IA
Job Creation through PIDC Financing ProductsThe Office of Business Attraction and Retention and PIDC work together to assist business in applying for financing products offered by PIDC. PIDC has a variety of different loan programs available to assist businesses, developers, and non-profits in every sector to invest, develop, and grow. In 2014, more than 17,500 jobs were created and retained through the support of PIDC loans. Of that total, 2,529 jobs were newly created and 15,060 jobs were retained.

City of Philadelphia, private industries, and the non-profit sector, in order to promote Minority, Women, or Disabled owned enterprises. The City strives to ensure that at 30% of the contracts are given to Minority, Women, and Disabled owned businesses.
There are 2,310 businesses in the OEO Registry, an increase of 72% over 2010. To date, the number of jobs has not been documented. However, the OEO Registry Survey found that the vast majority of companies in the registry (300 companies, 62.6% of the businesses) have up to 10 employees. This data point is consistent with national trends; businesses owned by minority, women, or people with disabilities tend to be smaller businesses.
MINORITY INCLUSION AND PARTICIPATION
The Minority Business Development Agency reported that the number of minority-owned businesses have been steadily increasing. Of the 28 million small businesses in the U.S., 15% are minority-owned and employ 5.9 million workers. In fact, between 2002 and 2007, minority-owned businesses increased by 46% in the U.S., while during the same period, nonminority-owned businesses only grew 10%. Data from the Small Business Administration reported on business ownership statistics; they found that Asians owned 1.6 million businesses, African-Americans owned 1.9 million businesses, Hispanics owned 2.3 million businesses, and Native American/Pacific Islanders owned 0.3 million businesses. Within the next ten years, minorities are projected to own the majority of business. This increase is in part due to the increase in the transfer of ownership from baby boomers to minority-owners. There has also been an increase of minorities in the labor force, as well as in the overall population.16
Philadelphia has made significant progress in increasing the participation of Minority, Women and Disabled owned enterprises (M/W/DSBEs) on public, quasi-public and private contracts. By the end of Mayor Michael Nutter’s Administration an estimated $2 billion will have been awarded to minority and women owned businesses. The value of prime contracts for M/W/DSBEs is up 74% since 2010. Furthermore, over the past three years, M/W/DSBE participation has consistently exceeded the City’s overall goal of 25% participation, which precipitated Mayor Nutter’s decision to increase the goal to 30% on all eligible contracts for Fiscal Year 2015.
The Registry for Minority, Women, and Disabled Owned BusinessesCommerce’s Office of Economic Opportunity (OEO) operates a registry for certified Minority, Women, and Disabled owned businesses (M/W/DSBEs). The registry offers certified Minority, Women, and Disabled owned businesses an opportunity to benefit from the City’s economic inclusion efforts through an internal and external alliance between the
1-10
11-25
26-50
51-99
100+
193 Firms (62%)
54 Firm(17%)
40 Firms (13%)
14 Firms(4.5%)
10 Firms(3%)
Num
ber o
f Em
ploy
ees
16 http://www.mbda.gov/pressroom/research-library/us-business-fact-sheets
20 EC
ON
OM
IC D
EVELO
PM
ENT P
RO
GR
AM
MIN
G LED
BY TH
E CITY O
F PH
ILAD
ELPH
IA
FIGURE 16: Firms By Number of Employees, OEO Registry Survey

17 http://papers.ssrn.com/sol3/papers.cfm?abstract_id=2157707
BUSINESS FINANCING
Access to capital is a major need in the Philadelphia business community, especially among smaller businesses. The City partners with PIDC and several other Community Development Finance Institutions (CDFIs) to offer lending and venture capital to small businesses. Furthermore, in 2014, Philadelphia became a Kiva City, offering a new 0% Interest microloan product for small businesses.
Non-profit micro-lenders and traditional banks offer much needed capital to start-up or early-stage small businesses that have not yet built a strong credit histroy. The program offers an option for entrepreneurs from very poor and immigrant populations who generally have limited access to affordable credit for starting or growing a business.
Startup PHLStartUp PHL is a collaborative effort between the City of Philadelphia Department of Commerce and PIDC—a forward thinking initiative inspired by the infusion of entrepreneurial talent that is boosting the city’s energy and bringing new vitality to its neighborhoods. The Startup PHL Funds are an effort by the City of Philadelphia and PIDC to increase the availability of investment capital for Philadelphia-based startups. PIDC has partnered with First Round Capital, one of the most active investment firms in the country, and angel investors, including Josh Kopelman, to create a $6 million public/private venture fund: the Startup PHL Funds. PIDC and First Round Capital each invested $3 million into the StartUp PHL Funds. First Round Capital manages the fund, making early-stage investments in Philadelphia-based tech startups. StartUp PHL invests through two funds: Startup PHL Angel Fund and Startup PHL Seed Fund. To date, StartUp PHL has invested in 7 Philadelphia start up businesses.
The Startup PHL Call for Ideas is intended to support and grow the Philadelphia startup and entrepreneurial community. The Department of Commerce will fund up to a total of $500,000 for individuals, partnerships, non-profits and
companies with smart ideas to grow the startup and early-stage business economy in Philadelphia. Funds will be disbursed in multiple rounds over the next few years and individual grant awards are expected to average less than $25,000.
Kiva Zip PhiladelphiaKivaZip.org is an online platform that crowdfunds 0% interest microloans for small businesses throughout the country.The program launched in Philadelphia in December of 2014. Due to the infancy of the program in Philadelphia, its impact on job creation cannot yet be measured. However, cities has shown that program performance in peer cities, Kiva Zip loans have succeeded in empowering low to moderate income business owners and giving them the opportunity to grow. Kiva Zip made 13 loans to Philadelphia businesses during the months leading up to the launch, and since December 2nd of 2014, 29 new loans have been made. In total, the program has funneled $183,225 worth of loan volume throughout the region. Currently, Philadelphia has 6 businesses fundraising for an additional total of $23,000.
A study of Kiva Zip in the Bay Area found that lending to small businesses was beneficial for the business, the employees, and the state and local government tax revenue. In this particular case, every dollar lent spurred nearly $2.00 in additional economic activity for the business, increased employee wages by $0.50 annually, and increased annual state and local tax revenue by $0.07. Kiva Zip also helps businesses to attract new customers and increase sales.17
The 48th Street Grille is a perfect example of a neighborhood business that was able to launch due to support from the Department of Commerce. The 48th Street Grille received funding and resources from numerous additional partners including The Merchants Fund, The Enterprise Center, an SBA loan from First Trust, the Hebrew Loan Fund, and Kiva Zip. Each of these partners provided resources in the form of funding and technical assistance totaling more than $273,000 in financing. Commerce supported the project through the Storefront Improvement Program, which provided distinctive signage and an InStore grant. Without these programs, Carl Lewis, owner of 48th Street Grille, would not have been able to pay for the fit out and equipment purchases needed to turn the space into a vibrant restaurant. He had extensive experience in the culinary world but this is the first restaurant he owned himself. These resources allowed Mr.Lewis to open 48th Street Grille, a new, full service sit-down restaurant in an area, which has been underserved. Prior to the investment of Commerce and its partners, the storefronts were empty. The new business has helped to enliven the small but dense commercial area. Additional new businesses are scheduled to open in the other storefronts this year. The various funding sources helped eliminate barriers for the creation of a new destination restaurant, which is leading to the creation of at least 12 new jobs.
SMALL BUSINESS PROFILE: The 48th Street Grille
21 EC
ON
OM
IC D
EVELO
PM
ENT P
RO
GR
AM
MIN
G LED
BY TH
E CITY O
F PH
ILAD
ELPH
IA

22 P
HILA
DELP
HIA
WO
RK
S, SUP
PO
RTIN
G JO
B G
RO
WTH

Approximately, 8,405 jobs were posted by 878 Philadelphia employers who used Job GatewaySM. 18
127 workers received on-the-job training opportunities that included new hire training, which was subsidized by public workforce funding.
The Philadelphia workforce system placed more than 12,000 residents into jobs during 2014.
Philadelphia Works engaged 25 companies referred by the City agencies. Philadelphia Works Business Engagement team reaches out to new or expanding companies with information about candidate screening services through PA CareerLink® system and on-the-job training subsidies. Eleven companies took advantage of these services. Many of these companies have not yet started hiring and are expected to engage with the system at a later time.
Philadelphia Works, Supporting Job GrowthPhiladelphia Works is the city’s workforce investment board and lead workforce development organization. Philadelphia Works offers the city of Philadelphia a workforce system that is among the most integrated, innovative, productive and transparent systems of its kind in the country. Philadelphia Works invests in employment and training solutions and services that connect employers to workforce talent and career seekers to jobs. Philadelphia Works is supported by federal, state, and privately raised funds and it ensures the highest standards of accountability for these investments. In this work, Philadelphia Works facilitates job creation in the city by helping business find, train, and in some cases, subsidize new employees.
Employer ServicesIn 2014, Philadelphia Works reached more than 2,000 employers in the PA CareerLink® Philadelphia centers (American Job Centers) and through the Employment Advancement and Retention Network (EARN) centers with targeted employment services. Employers posted jobs and hired qualified candidates from these centers.
More than 35 regional employers are now part of Philadelphia Works’ Jobs Compact Initiative, making a signed commitment to use the public workforce system for hiring needs and provide
systematic feedback to Philadelphia Works on the effectiveness of workforce services. (For a list of some of these committed partners, visit Philadelphia Works’ website at www.philaworks.org. In 2014,
Industry Partnerships: Sector-Based StrategiesIndustry partnerships are a multi-employer collaborative effort that brings together management and labor around the common purpose of improving the competitiveness of a cluster of companies with similar needs. 47 employers participate in the Southeastern Regional Workforce Development Partnership (SERWDP), an advanced manufacturing/transportation employer-led industry partnership, overseen by Philadelphia Works, that has offered over 2,377 trainings since its inception in 2007. These companies range in size from 10 to 2,000 employees. The partnership works to maintain competitive advantage in the manufacturing industry, focusing on retaining workers and enhancing business. Employers are encouraged to promote workers with upgraded skills to new positions and open up lesser skilled vacancies to new candidates, contributing to job creation. Philadelphia Works also collaborates with industry partnerships
18 Job GatewaySM is an online tool available at PA CareerLink® to connect job seekers and employers. Services available include job searching and resume creation for job seekers and candidate searching and job postings for employers.
23 P
HILA
DELP
HIA
WO
RK
S, SUP
PO
RTIN
G JO
B G
RO
WTH
related to direct care workers, food processing, logistics and transportation, rotorcraft, higher education, Information Technology and other important employment fields.
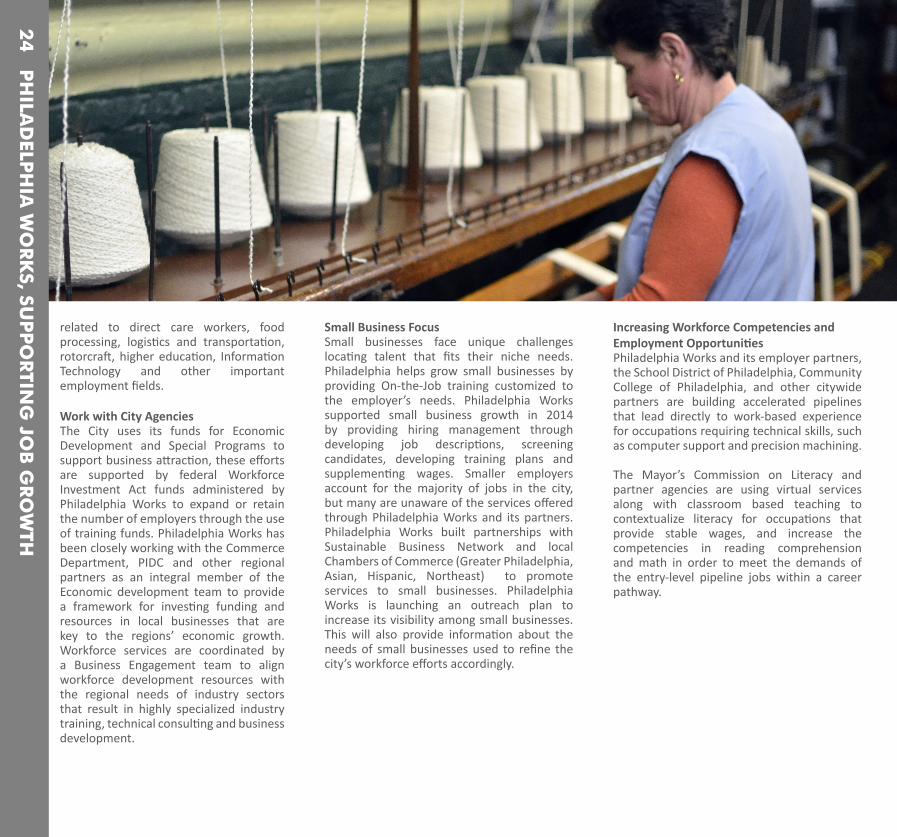
Work with City AgenciesThe City uses its funds for Economic Development and Special Programs to support business attraction, these efforts are supported by federal Workforce Investment Act funds administered by Philadelphia Works to expand or retain the number of employers through the use of training funds. Philadelphia Works has been closely working with the Commerce Department, PIDC and other regional partners as an integral member of the Economic development team to provide a framework for investing funding and resources in local businesses that are key to the regions’ economic growth. Workforce services are coordinated by a Business Engagement team to align workforce development resources with the regional needs of industry sectors that result in highly specialized industry training, technical consulting and business development.
Small Business FocusSmall businesses face unique challenges locating talent that fits their niche needs. Philadelphia helps grow small businesses by providing On-the-Job training customized to the employer’s needs. Philadelphia Works supported small business growth in 2014 by providing hiring management through developing job descriptions, screening candidates, developing training plans and supplementing wages. Smaller employers account for the majority of jobs in the city, but many are unaware of the services offered through Philadelphia Works and its partners. Philadelphia Works built partnerships with Sustainable Business Network and local Chambers of Commerce (Greater Philadelphia, Asian, Hispanic, Northeast) to promote services to small businesses. Philadelphia Works is launching an outreach plan to increase its visibility among small businesses. This will also provide information about the needs of small businesses used to refine the city’s workforce efforts accordingly.
Increasing Workforce Competencies and Employment Opportunities Philadelphia Works and its employer partners, the School District of Philadelphia, Community College of Philadelphia, and other citywide partners are building accelerated pipelines that lead directly to work-based experience for occupations requiring technical skills, such as computer support and precision machining. The Mayor’s Commission on Literacy and partner agencies are using virtual services along with classroom based teaching to contextualize literacy for occupations that provide stable wages, and increase the competencies in reading comprehension and math in order to meet the demands of the entry-level pipeline jobs within a career pathway.
24 P
HILA
DELP
HIA
WO
RK
S, SUP
PO
RTIN
G JO
B G
RO
WTH

25 C
ON
CLU
SION
S AN
D R
ECO
MM
END
ATIO
NS

This report highlights economic development programming that the City leads to create an economic environment throughout Philadelphia that is conducive to business success and job creation. Economic development is a slow and lengthy process, but it is absolutely critical to job creation in Philadelphia. In order to create job opportunities, it is essential Philadelphia attracts new businesses, retain existing businesses, and prompt entrepreneurial development in areas that are lacking job opportunities. The Department of Commerce, Philadelphia Industrial Development Corporation (PIDC) and Philadelphia Works are deeply involved in all of these efforts and have made a significant positive impact on our city.
Without thriving businesses, there are no jobs. It is for this reason that the Department of Commerce dedicates the majority of its resources to supporting businesses and entrepreneurship throughout the city. The City supports new business creation through programs such as the Business Technical Assistance Program, the Office of Business Services and StartUp PHL. For existing businesses, the City provides technical support and access to capital (i.e. Goldman Sachs 10,000 Small Businesses, Kiva, Storefront Improvement Program,
etc.). In Philadelphia neighborhoods, where commercial main streets are often struggling with vacancies and existing businesses may be on the brink, it is critical to invest in the long-term success of these commercial corridors. The Department of Commerce works closely with local Community Development Corporations to revitalize the neighborhood commercial corridors over time.
While economic development in the neighborhoods is primarily related to small business development and neighborhood commercial corridor investments, in Center City, University City, the Navy Yard and other key employment centers, the City’s focus is mainly around retaining firms, attracting new businesses, and developing real estate projects that will lead to job creation (i.e. new hotels, office buildings, etc.). The Department of Commerce and PIDC work in tandem to offer financing, leasing or build-to-suit options, and incentives to companies that are considering a physical presence in Philadelphia. As part of the process of courting new businesses, the City assists interested businesses in identifying potential office locations and educates them about tax-breaks (including tax credits for jobs created) that may be available to them. Over the last year and a half, the City has put a greater emphasis on recruiting international businesses to Philadelphia. Mayor Nutter travelled to Israel, the United Kingdom and
France in 2014 to foster business opportunities. These trade missions are bearing fruits, with several new businesses moving to Philadelphia this year. And with all of these new businesses, come jobs. The Trends section of this report highlighted a decrease in two important segments of the economy – manufacturing and construction. The Department of Commerce is focused on improving outcomes in both of these industry sectors. In 2014, the Department of Commerce opened an Office of Manufacturing and Industry. Recently, this Office issued a one-year report highlighting accomplishments and challenges in the sector. Importantly, the report highlights the number one challenge for manufacturing companies is finding qualified employees that have job skills and that can rapidly learn the specific skills needed to perform on the job. While this is a major challenge, it is also an opportunity. The report finds that the reason for this dearth of talent is the lack of training programs in manufacturing design and process, which would lead to a pipeline of qualified candidates. Recognizing this concern, Philadelphia Works, the City and other partners have worked together to offer trainings and promote greater awareness about manufacturing as a career option. PIDC and the PA Department of Community and Economic Development both offer financing that is tailored to industrial and manufacturing
26 C
ON
CLU
SION
S AN
D R
ECO
MM
END
ATIO
NS
Photo Credit: J. Weinik

businesses for equipment and working capital needs. Although manufacturing jobs have been declining for many years, Philadelphia recognizes that this is an industry that could provide living wage employment to thousands of residents and is therefore very committed to attracting manufacturing businesses and spurring industry innovation. Furthermore, the City is working diligently to prepare Philadelphians for jobs in manufacturing.
Construction jobs have also declined significantly since the great recession; although there has been a small increase in such jobs more recently. The construction industry should see accelerated growth in this sector, as a number of large scale real estate projects are in the works. In fact, a recent Philadelphia Business Journal article19 highlighted the surge in real estate developments over the last few years. According to the Department of Commerce, there are approximately $8.2 billion dollars in active and planned projects underway since the beginning of the Nutter Administration. Given the number of cranes in the air and construction plans in the works, we expect to see an important lift in construction jobs as a result.
As focused on in this report, employment is directly linked to educational attainment. The more education a job-seeker has, the more s/he is likely to earn. Until the public school system is able to create better results in educating our young people, a lack of job-readiness skills will continue to be an issue. Commerce, PIDC and Philadelphia Works can do everything possible to help adults find employment and to foster an economy with jobs; however, it is critical that the education system improve so that Philadelphians have the academic and life skills to succeed in employment.
RECOMMENDATIONS MOVING FORWARD
More Public-Private PartnershipsThe City must partner with local businesses and organizations to revitalize neighborhoods, foster innovation and create jobs. Public-private partnerships are key to being successful. While the City plays a crucial role in fostering economic development citywide and ensuring job creation, the Department of Commerce, PIDC and Philadelphia Works are all constrained by limited resources and the challenges of operating under the restrictions of government regulations. Examples of partnerships that have worked in recent years include:
Goldman Sachs 10,000 Small Businesses: In 2012, the City partnered with Goldman Sachs to offer an educational program and loan fund to growth-stage small businesses. This program has offered a premier business education to nearly 170 small businesses in the area, millions of dollars in loans, and is 100% funded by Goldman Sachs.
Kiva: In 2014, Kiva and the City partnered to launch Kiva City Philadelphia. Kiva offers small business loans starting up to $5,000 at 0% interest to start-up and micro-businesses. Together, Kiva and the City raised more than $300,000, from individuals and foundations, towards this initiative.
The City must continue to build new public-private partnerships to leverage additional dollars for new initiatives. In addition, the City should maintain its work with all existing partners, such as: neighborhood-based organizations, industry associations, chambers of commerce, etc.
27 C
ON
CLU
SION
S AN
D R
ECO
MM
END
ATIO
NS
19 Kostelni, Natalie. The man who made Phila-delphia go BOOM! April 2015

28 C
ON
CLU
SION
S AN
D R
ECO
MM
END
ATIO
NS
Implement Pilot ProgramsThe Department of Commerce operates a number of programs that have been in existence for many years and are proven to be successful. At the same time, several newer programs in the Department of Commerce, such as Kiva Philadelphia and InStore, have emerged out of a process of innovation and pilot-testing and have shown to be very impactful. The City should continue to invest in longstanding, proven programs that have supported business startup/growth and job creation over the years, while also embracing new programs and ideas. The Department of Commerce must remain aware of existing and emerging needs in the business community and consider innovative models that could be launched or replicated in Philadelphia to meet these needs. In many cases, public-private partnerships could provide opportunities to develop innovative programs to further economic development in the city.
Improve Data Collection and AnalysisThe Department of Commerce collects and analyzes data, but data collection is not centralized into one database and collection methodologies vary. Furthermore, Commerce does not measure job creation for all of its programs. Although it is not always easy or possible to collect accurate information about job creation, the Department of Commerce should try to capture job creation data for all of its projects and when this is not possible, determine the best metrics that clearly link to job creation. Recognizing this challenge, the Department of Commerce will plan and implement a new data collection strategy over the course of 2015.
A Continued Focus on Talent DevelopmentThis report highlights the acute need for talent development in Philadelphia. According to a 2014 Campus Philly report20, 64% of college graduates are choosing to stay in Philadelphia. Talent retention efforts in Philadelphia have been very robust over the last few years with numerous agencies, including Graduate! Philadelphia, Campus Philly, The Greater Philadelphia Chamber of Commerce, Philadelphia Works and City agencies, partnering to form Talent Greater Philly, a collective formed to amplify the collective efforts of the region’s many educational support partners, Talent Greater
Philly collaborates on strategies designed to position students to obtain a post-secondary education. In addition to these collaborative efforts, the Department of Commerce should work closely with Philadelphia Works to identify specific workforce needs experienced by small businesses. The Department of Commerce should pull together a small business focus group or advisory committee to develop strategies for improving the talent pool for small businesses.
Build Capacity to Work with Immigrant Businesses In order to support immigrant businesses in continuing this trend of relocating to neighborhood main streets, the City and its partners must increase language and cultural competencies to better assist these businesses with their needs. While the City offers translation and interpretation services, it will be important to hire a diverse bilingual staff as vacancies open up.
20 http://campusphilly.org/choosingphl/

Photo Credit:J. Fusco
29 A
PP
END
IX

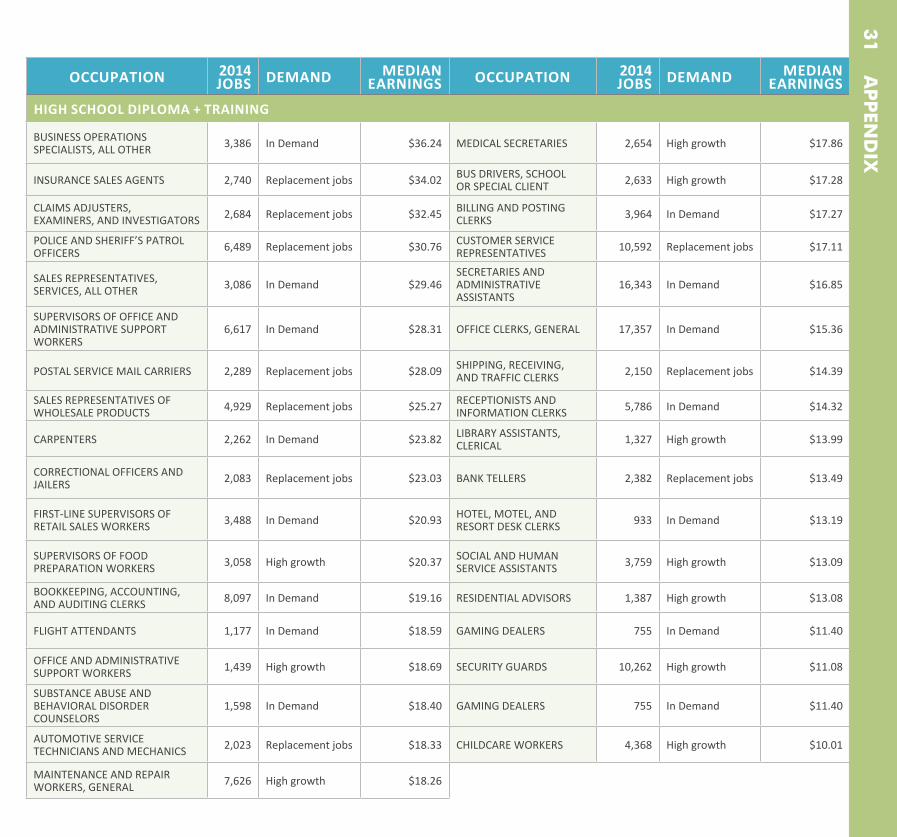
FIGURE 17: Occupations with a Higher Number of Openings in Philadelphia Not Requiring a Post-Secondary Degree
OCCUPATION 2014 JOBS DEMAND MEDIAN
EARNINGS OCCUPATION 2014 JOBS DEMAND MEDIAN
EARNINGS
LESS THAN HIGH SCHOOL DIPLOMA + TRAINING
CONSTRUCTION LABORERS 1,580 In Demand $18.04 FOOD SERVERS, NONRESTAURANT 2,082 In Demand $10.59
LANDSCAPING AND GROUNDSKEEPING WORKERS 2,282 High growth $15.49 STOCK CLERKS AND ORDER
FILLERS 6,014 Replacement jobs $10.31
COOKS, RESTAURANT 3,362 High growth $14.69 RETAIL SALESPERSONS 15,718 Replacement jobs $10.21
COOKS, INSTITUTION AND CAFETERIA 2,281 In Demand $14.11 DISHWASHERS 2,424 High growth $10.06
JANITORS AND CLEANERS 11,654 High growth $14.10 PACKERS AND PACKAGERS, HAND 2,479 Replacement
jobs $10.01
LABORERS AND MATERIAL MOVERS 9,026 Replacement jobs $12.78 PARKING LOT ATTENDANTS 1,780 In Demand $9.99
HOSTS AND HOSTESSES (RESTAURANT) 1,236 High growth $12.40 COUNTER ATTENDANTS
(CAFETERIA AND COFFEE SHOP) 1,813 Replacement jobs $9.86
MAIDS AND HOUSEKEEPING CLEANERS 4,819 High growth $12.18 DINING ROOM AND CAFETERIA
ATTENDANTS 2,246 High growth $9.76
FOOD PREPARATION WORKERS 4,414 In Demand $11.79 AMUSEMENT AND RECREATION ATTENDANTS 1,121 In Demand $9.82
BARTENDERS 3,016 High growth $11.35 DINING ROOM AND CAFETERIA ATTENDANTS 2,246 High growth $9.76
USHERS, LOBBY ATTENDANTS, AND TICKET TAKERS 1,043 In Demand $11.14 FOOD PREPARATION WORKERS
- FAST FOOD 15,555 High growth $9.58
WAITERS AND WAITRESSES 10,787 High growth $10.76 HOME HEALTH AIDES 8,532 High growth $9.44
PERSONAL CARE AIDES 9,563 High growth $10.69
30 A
PP
END
IX
OCCUPATION 2014 JOBS DEMAND MEDIAN
EARNINGS OCCUPATION 2014 JOBS DEMAND MEDIAN
EARNINGS
HIGH SCHOOL DIPLOMA + TRAINING
BUSINESS OPERATIONS SPECIALISTS, ALL OTHER 3,386 In Demand $36.24 MEDICAL SECRETARIES 2,654 High growth $17.86
INSURANCE SALES AGENTS 2,740 Replacement jobs $34.02 BUS DRIVERS, SCHOOL OR SPECIAL CLIENT 2,633 High growth $17.28
CLAIMS ADJUSTERS, EXAMINERS, AND INVESTIGATORS 2,684 Replacement jobs $32.45 BILLING AND POSTING
CLERKS 3,964 In Demand $17.27
POLICE AND SHERIFF’S PATROL OFFICERS 6,489 Replacement jobs $30.76 CUSTOMER SERVICE
REPRESENTATIVES 10,592 Replacement jobs $17.11
SALES REPRESENTATIVES, SERVICES, ALL OTHER 3,086 In Demand $29.46
SECRETARIES AND ADMINISTRATIVE ASSISTANTS
16,343 In Demand $16.85
SUPERVISORS OF OFFICE AND ADMINISTRATIVE SUPPORT WORKERS
6,617 In Demand $28.31 OFFICE CLERKS, GENERAL 17,357 In Demand $15.36
POSTAL SERVICE MAIL CARRIERS 2,289 Replacement jobs $28.09 SHIPPING, RECEIVING, AND TRAFFIC CLERKS 2,150 Replacement jobs $14.39
SALES REPRESENTATIVES OF WHOLESALE PRODUCTS 4,929 Replacement jobs $25.27 RECEPTIONISTS AND
INFORMATION CLERKS 5,786 In Demand $14.32
CARPENTERS 2,262 In Demand $23.82 LIBRARY ASSISTANTS, CLERICAL 1,327 High growth $13.99
CORRECTIONAL OFFICERS AND JAILERS 2,083 Replacement jobs $23.03 BANK TELLERS 2,382 Replacement jobs $13.49
FIRST-LINE SUPERVISORS OF RETAIL SALES WORKERS 3,488 In Demand $20.93 HOTEL, MOTEL, AND
RESORT DESK CLERKS 933 In Demand $13.19
SUPERVISORS OF FOOD PREPARATION WORKERS 3,058 High growth $20.37 SOCIAL AND HUMAN
SERVICE ASSISTANTS 3,759 High growth $13.09
BOOKKEEPING, ACCOUNTING, AND AUDITING CLERKS 8,097 In Demand $19.16 RESIDENTIAL ADVISORS 1,387 High growth $13.08
FLIGHT ATTENDANTS 1,177 In Demand $18.59 GAMING DEALERS 755 In Demand $11.40
OFFICE AND ADMINISTRATIVE SUPPORT WORKERS 1,439 High growth $18.69 SECURITY GUARDS 10,262 High growth $11.08
SUBSTANCE ABUSE AND BEHAVIORAL DISORDER COUNSELORS
1,598 In Demand $18.40 GAMING DEALERS 755 In Demand $11.40
AUTOMOTIVE SERVICE TECHNICIANS AND MECHANICS 2,023 Replacement jobs $18.33 CHILDCARE WORKERS 4,368 High growth $10.01
MAINTENANCE AND REPAIR WORKERS, GENERAL 7,626 High growth $18.26
31 A
PP
END
IX

Source: Philadelphia Works’ analysis of the QCEW (Quarterly Census of Employment and Wages) Employees & Non-QCEW Employees - EMSI 2014.4 Class of Worker data.
32 A
PP
END
IX
POST-SECONDARY CERTIFICATE + TRAINING
OCCUPATION 2014 JOBS DEMAND MEDIAN
EARNINGSLICENSED PRACTICAL AND VOCATIONAL NURSES 4,149 High growth $25.44
COMPUTER USER SUPPORTSPECIALISTS 3,239 High growth $20.67
MEDICAL ASSISTANTS 3,346 High growth $16.85
MEDICAL RECORDS AND HEALTH INFORMATION TECHNICIANS
1,382 In Demand $16.36
NURSING ASSISTANTS 10,566 High growth $15.08
TEACHER ASSISTANTS 5,421 High growth $12.05
HAIRDRESSERS, HAIRSTYLISTS, AND COSMETOLOGISTS 1,843 High growth $11.27
Photo Credit: PhillyPaintingCrew, JonKaufman


1515 ARCH ST #12, PHILADELPHIA, PA 19102WWW.PHILA.GOV/COMMERCE
(215) 683-2000