Embed Size (px)
Citation preview
UNIVERSITÉ DU QUÉBEC :-\ MONTRÉAL
AUGMENTA TION RÉCENTE DE LA PRODUCTIVITÉ PRII'vfAIRE ET DES FLUX DE CARBONE DANS L'ESTUAIRE MARITIME DU SAINT-LAUREr;T :
ÉVIDENCES MICROPALEONTOLOGIQUES ET GÉOCHIMIQUES
MÉMOIRE PRÉSENTÉ
COMME EXIGENCE PARTIELLE DE LA MAITRISE EN SCIENCES DE LA TERRE
PAR BENOIT THlBODEAU
AVRIL 2006
UNIVERSITÉ DU QUÉBEC À MONTRÉAL
RECENT EUTROPHICATION AND CONSEQUENT HYPOXIA IN THE
BOTTOM WATERS OF THE LOWER ST. LAWRENCE ESTUARY:
MICROPALEONTOLOGICAL AND GEOCHEMICAL EVIDENCE
THESIS
PRESENTED AS A PARTIAL FULFILMENT
FOR THE MASTER'S DEGREE IN EARTH SCIENCES
BY
BENOIT THIBODEAU
APRIL 2006
UNIVERSITÉ DU QUÉBEC À MONTRÉAL Service des bibliothèques
Avertissement
La diffusion de ce mémoire se fait dans le respect des droits de son auteur, qui a signé le formulaire Autorisation de reproduire et de diffuser un travail de recherche de cycles supérieurs (SDU-522 - Rév.01-2006). Cette autorisation stipule que «conformément à l'article 11 du Règlement no 8 des études de cycles supérieurs, [l'auteur] concède à l'Université du Québec à Montréal une licence non exclusive d'utilisation et de publication de la totalité ou d'une partie importante de [son] travail de recherche pour des fins pédagogiques et non commerciales. Plus précisément, [l'auteur] autorise l'Université du Québec à Montréal à reproduire, diffuser, prêter, distribuer ou vendre des copies de [son] travail de recherche à des fins non commerciales sur quelque support que ce soit, y compris l'Internet. Cette licence et cette autorisation n'entraînent pas une renonciation de [la] part [de l'auteur] à [ses] droits moraux ni à [ses] droits de propriété intellectuelle. Sauf entente contraire, [l'auteur] conserve la liberté de diffuser et de commercialiser ou non ce travail dont [il] possède un exemplaire.»

AVANT-PROPOS
Ce mémoire de maîtrise a été rédigé sous forme d'article scientifique qui a été
accepté sous condition par la revue Marine Ceology. La langue anglaise a donc été
utilisée et la mise en forme respecte les exigences de Marine Ceology. Les figures
citées dans l'article ont été placées à la suite des références. Deux autres auteurs ont
participé à la rédaction de cet article, Anne de Vernal et Alfonso Mucci,
respectivement professeur au département des Sciences de la Terre et de l'atmosphère
de l'UQAM et au Earth and Planetary Sciences département de l'Université McGill.
Vu l'imposante banque de donnée recueillie et compilée durant ce travailles tableaux
de comptages et autres données sont disponible électroniquement sur un disque
compact joint ou à [email protected].
REMERCIEMENTS
Je remercie ma directrice Anne de Vernal pour son soutien scientifique et monétaire.
Je la remercie également de m'avoir témoigné une grande confiance pour cet
important projet ainsi que pour d'autres tâches reliées à l'enseignement.
Je remercie mon co-directeur Alfonso Mucci pour le partage de son savoir lors des
missions d'échantillonnage ainsi que pour ses judicieuses remarques lors de la
rédaction de l'article et de mes diverses communications scientifiques.
Je remercie aussi tout le personnel technique des laboratoires du GEOTOP qui m'a
prêté assistance durant ma maîtrise; Julie Leduc, Jennifer McKay, Agnieszka

IV
Adamowicz, Louise Cournoyer, Bassam Ghaleb, Maryse Henry, Céline Hallé-Polèse
et Claire Goyette.
Je remercie mes parents pour leur soutien indéfectible et essentiel tout au long de mes
études. Ils m'ont permis d'aller au bout des choses et je leur en serai éternellement
reconnaissant.
Je remercie mes nombreux compagnons de bureau ou d'étage, permanents ou de
passage avec qui j'ai eu énormément de plaisir (par ordre d'apparition dans le film);
Sébastien Papi Caron, Maxime check ma couette Paiement, Pascal 2 bières et il est
parti Audet, Chantal soeurette Gosselin, Taoufik Radi, Marc Humblet, Catherine
Lalande (en anglais dans le texte), Thomas La Parisienne Ledruillenec, Sandrine le
Joker Solignac, le Lapin, Mattthieu Chochotte Moingné, Christian Rigne Chouinard
et Lazar téléphone Aguiar. Un merci tout spécial à tout ceux qui m'ont rapporté des
boules de neiges kitsch et envoyé des cartes postales laides de leurs divers voyages
autour du globe, ceux qui ne l'ont pas fait sont des sans-cœur. Une pensée spéciale à
Alex Myre pour ces batailles de pistolet dans le bureau ainsi que pour ces nombreux
barils vidés. Merci à Cluistelle Not qui m'a soutenu et encouragé.

TABLE DES MATIÈRES
AVANT-PROPOS III
fNTRODUCTION
RECENT EUTROPHICATION AND CONSEQUENT HYPOXIA fN THE BOTTOM WATERS OF THE LOWER ST-LAWRENCE ESTUARY :
LISTE DES FIGURES VI
LISTE DES ABRÉVIATIONS VII
RÉSUMÉ VIII
ABSTRACT IX
CHAPITRE 1
MICROPALEONTOLOGICAL AND GEOCHEMICAL EVIDENCE 4
CONCLUSIONS 41
LISTE DES FIGURES
Figure Page
Figure 1. Carte de localisation 33
Figure 2. Vente de fertilisant au Québec 34
Figure 3. Chronostratigraphie de la carotte AHOO-2220 35
Figure 4. Données palynologiques de la carotte AHOO-2220 36
Figure 5. Foraminifères benthiques de la carotte AHOO-2220 37
Figure 6. Données géochimiques de la carotte AHOO-2220 37
Figure 7. Chronostratigraphie de la carotte CR02-23 38
Figure 8. Données palynologiques de la carotte CR02-23 39
Figure 9. Foraminifères benthiques de la carotte CR02-23 40
Figure 10. Données géochimiques de la carotte CR02-23 40

LISTE DES ABRÉVIATIONS
AR: Accumulation rate
BSPP: Brigantedinium spp
CT: Calcareous tests
EMSL: Estuaire maritime du Saint-Laurent
LSLE: Lower St. Lawrence estuary
IMIC: Islandinium? cezare
IMIN : Islandinium minutum
MAR: Mass accumulation rate
NLAB: Nematosphaeropsis labyryrinthus
OC: Organic carbon
OCEN: Operculiodinium centrocarpum
OL: Organic linings
PDAL: Pentapharsodinium dalei
PERI: Protoperidiniales
SELO: Spiniferites elongatus
SQUA: Selenophemphix quanta
SRAM: Spiniferites ramosus
TC: Total carbon
TN: Total nitrogen
RÉSUMÉ
De récentes études ont démontré que plus de 1300 km2 du fond du chenal laurentien sont baignés par des eaux dont les concentrations d'oxygène dissous sont en deçà de 62.5 /lM ou 2 mg/l, correspondant au seuil qui définit l'hypoxie. Une des causes possibles du développement de l'hypoxie serait l'eutrophisation des eaux de surface liée à l'augmentation de l'activité agricole et industrielle dans les Basses-Terres du Saint-Laurent. Les apports accrus en nitrates rendraient compte d'une productivité primaire et d'un flux de carbone organique croissant. La dégradation de cette matière organique exportée dans les eaux profondes pourrait contribuer à l'appauvrissement progressif de celles-ci en O2 dissous. Dans ce contexte, nous avons analysé les sédiments de deux carottes récoltées le long du chenal laurentien entre Tadoussac et Les Méchins afin de retracer les variations de productivité depuis le dernier siècle et ainsi, de vérifier si ceux-ci révèlent des indices d'une eutrophisation. Les résultats obtenus (carotte boîte AHOO-2220; 48°38,33'N, 68°37,82'W; 324m et CR02-23; 48°42.008'N/68°38.894'W; 345m) révèlent une augmentation récente (après 1960 AD) du 8 13 Corg que nous interprétons comme une augmentation des apports de matière organique marine. De la même façon et sur le même intervalle de temps, la concentration des kystes de dinoflagellés augmente, tout comme leurs flux, ce qui pourrait refléter un accroissement de la productivité primaire. Nous notons aussi une tendance semblable dans la concentration et du flux de réseaux organiques de foraminifères qui reflète probablement un accroissement de la productivité benthique liée à l'augmentation du flux de matière organique aux sédiments. Les concentrations et les flux de tests de foraminifères benthiques sont caractérisés par la même tendance d'augmentation récente. Nous notons aussi l'apparition et l'augmentation progressive de la présence des taxons Brizalina subaneriensis et Bulimina exilis entre les années 1960 et 1970. Ces taxons se singularisent par leur forte tolérance aux faibles concentrations d'oxygène et aux flux de carbone élevés. Les résultats obtenus dans cette étude appuient l'hypothèse d'une augmentation des flux sédimentaires de matière organique marine associés à une augmentation de la productivité primaire dans cette partie de l'estl,laire du St-Laurent. Cette augmentation de productivité pourrait bien être un facteur important dans la diminution récente des teneurs en oxygène dissous, il est donc important d'explorer plus en détail cette hypothèse afin de mieux connaître les mécanismes en cours dans l'estuaire du StLaurent et leur relation avec l'hypoxie récente des eaux de fond.
Mots clés: Hypoxie, eutrophication, foraminifères, géochimie, Saint-Laurent
ABSTRACT
Recent measurements of dissolved oxygen (DO) concentrations in the bottom waters of the Lower St. Lawrence Estuary (LSLE) show that about 1300 I<.m2 of the Laurentian Channel (LC) is now bathed by hypoxic waters (i.e., waters containing less than 62.5 flM or 2 mg/lof dissolved oxygen). A compilation of historical DO measurements of waters taken between 300 and 355 m depth in the Lower St. Lawrence Estuary reveals that DO concentrations have decreased by nearly 50% over the last 70 years. The deep waters of the LC are isolated from the atmosphere by a sharp, permanent pycnocline that begins around 100 - 150 m depth. At depths greater than 150 m the oxygen lost cannot even be replenished by winter convection but only by weak diffusion from the overlying water or by tidal mixing at the head of the LC. For this reason, the oxygen balance is precarious: increased organic carbon fluxes and respiration and/or decreased deep estuarine landward flow will lead to lower oxygen concentrations. Eutrophication is one of the possible causes of hypoxia. An increased flux of nutrients from the watershed would lead to an increase surface productivity and organic carbon flux to the bottom waters. The microbially-mediated remineralization of this organic carbon could contribute to the progressive depletion of dissolved oxygen in the bottom waters. Micropaleontological and geochemical analyses were carried out on two sediment box cores (AHOO-2220 and CR02-23) recovered in the Lower St. Lawrence Estuary (LSLE) in order to document recent temporal variations of primary productivity and carbon fluxes to the bottom waters. These reveal a ten-fold increase in the accumulation rate of dinoflagellate cysts and benthic foraminifera in the sediment over the last four decades which can be interpreted as a recent increase in pelagie and benthic production. Furthermore, the appearance of the benthic foraminiferal species Brizalina subaenariensis and Bulimina exilis, which are tolerant of low oxygen concentrations and high organic fluxes, in the upper 20 cm of the cores, may reflect significant changes in bottom water conditions over the last 40 years. Variations in the microfossil abundances in core AHOO-2220 are strongly correlated with an increase in organic carbon (OC) content (from 1.1 to 1.6%) and to a shift in the isotopie signature of the latter (813CoRG from -24.8 to -24.0%0). Similarly, a concomitant decrease in the CORG:N ratio (from 15 to 12), an increase in organic carbon content (from 1.3 to 1.9%) and an increase in 813CORG (from -24.5 to -23.5%0) were observed in core CR02-23, ail of which suggest an enhanced accumulation of marine over terrestrial OC in the LSLE. Our results imply that a significant increase in marine productivity in the LSLE occurred since the 1960's.
Keywords: Lower St. Lawrence Estuary, eutrophication, hypoxia, dinoflagellate
cysts, benthic foraminifera, geochemistry.
INTRODUCTION
L'hypoxie naturelle est un phénomène assez courant dans plusieurs environnements
côtiers caractérisés par une circulation profonde restreinte comme les fjords. Par
contre, on note de plus en plus l'apparition de zones hypoxiques dans les
environnements côtiers et estuariens. L'apparition de ces zones est souvent associée à
l'apport anthropogénique de nutriments et l'eutrophisation côtière (Cloern, 2001;
Diaz 1995; Gray, 2002).
Des mesures récentes de teneur en oxygène dissous dans les eaux de fond de
l'estuaire maritime du St-Laurent (EMSL) montrent qu'une superficie d'environ 1300
km2 du chenallaurentien est maintenant baignées par des eaux hypoxiques (contenant
moins de 62.5 ~M/I ou 2mg/l d'oxygène dissous (Diaz et Rosenberg, 1995). Une
compilation des données historiques des mesures d'oxygène dissous prises entre 300
et 355 mètres dans l'EMSL révèle que les concentrations d'oxygène dissous ont
diminué de près de 50% au cours des derniers 70 ans (Gilbert et al., 2005).
L'eutrophisation consiste en une augmentation du flux de nutriments lessivés du
bassin versant vers l'estuaire, ce qui permet une plus forte prolifération du
phytoplancton et conséquemment une plus forte exportation de carbone organique
vers les eaux de fond. La dégradation de ce carbone organique par la réaction de
respiration peut contribuer à la diminution progressive de la concentration en oxygène
dissous dans les eaux de fond. Dans la présente étude nous avons analysé des carottes
de sédiment prises dans l'EMSL afin de reconstruire l'historique de la productivité de
surface depuis le dernier siècle et identifié les signes d'eutrophisation récente.
Il existe plusieurs indicateurs d'eutrophisation: la pénétration de la lumière, la
concentration de chlorophylle a, le taux de croissance des épiphytes versus celui des
macrophytes, les changements dans la population de protistes alguaires (des
diatomées aux dinoflagellés, des benthiques aux pélagiques) et l'augmentation de la
décomposition de la matière organique (Livingston, 2000). Par contre les séries de
2
données instrumentales de ces paramètres sont limitées à quelques années vOIr
quelques dizaines d'années. Il est donc important de développer des indicateurs
d'eutrophisation à partir de l'étude du sédiment pour obtenir des séries temporelles
qui permettent de cerner l'évolution du milieu et en dégager les tendances à long
terme afin de déterminer si l'hypoxie récente de l'EMSL est due à des variations
naturelles ou aux activités humaines.
La distribution de l'oxygène dissous dans les différentes masses d'eaux de l'EMSL
(deux en hiver et trois le reste de l'année) est dépendante de la structure thermohaline
de celles-ci. La circulation des masses d'eaux est de type estuarienne, c'est-à-dire des
eaux douces de surface qui se déversent vers l'océan et des eaux de fond froides
venant de l'Atlantique. La couche de surface est bien oxygénée puisqu'elle est en
contact avec l'atmosphère, la couche intermédiaire froide se développe par
convection au printemps et se mélange aux eaux de surface durant l'hiver. Les eaux
de fond proviennent d'un mélange des eaux du Courant du Labrador et des eaux de
l'Atlantique Nord Central et sont isolées de l'atmosphère par une pycnocline
permanente. Étant isolée de l'atmosphère, les eaux de fond s'appauvrissent
graduellement en oxygène dissous de par la respiration et la reminéralisation de la
matière organique provenant des eaux de surfaces, c'est pourquoi la concentration
d'oxygène dans ces eaux est précaire et que toute augmentation des flux de carbone
organique ou du taux de respiration peut entraîner une diminution critique de la
teneur en oxygène dissous.
Nous avons étudié les variations passées de la productivité de l'EMSL en utilisant
plusieurs indicateurs micropaléontologiques et géochimiques du sédiment. Parmis
eux les kystes de dinoflagellé qui ont déjà été utiliser comme indicateur de la
productivité primaire et de la disponibilité des nutriments dans des assemblages
modernes (Devillers et de Vernal, 2000; Radi et de Vernal, 2004) et appliqué à des
séquence sédimentaire holocènes des fjords scandinaves (Dale, 1994; Thorsen etDale,
1997; Dale, 2001), de la mer Adriatique (Sangiorgi and Donders, 2004) et des côtes
nord-est des Etats-Unis (Pospelova et al., 2002; Verardo, 1999). L'abondance et la
3
taxonomie des foraminifères benthiques ont été utilisées pour estimer qualitativement
la productivité benthiques et les conditions d'oxygénation (Loubere, 1991 ;
Mackensen et al., 1993; Sen Gupta, 1996; Bernhard, 1997; Karlsen et al., 2000;
Osterman, 2003; Platon et al., 2005). Ces données ont été couplées avec des mesures
géochimiques, incluant la teneur en carbone organique du sédiment, la signature
isotopique du carbone organique (Ù'3C) et le rapport carbone sur azote (C:N) qui nous
renseignent sur la provenance de la matière organique (Meyers, 1994; Struck et al.,
2000; Voss et al, 2000; Zimmerman and Canuel, 2000; Bratton et al., 2003; McKay et
al.,2004).
CHAPITRE 1
RECENT EUTROPI-llCATION AND CONSEQUENT HYPOXLA IN THE BOTTOM WATERS OF THE LOWER ST-LAWRENCE ESTUARY: MICROPALEONTOLOGICAL
AND GEOCHEMICAL EVIDENCE
Benoît Thibodeau'*, Anne de Vernal l and Alfonso Mucci2
JGEOTOP-UQAM-McGill, CP. 8888, suce. Centre ville, Montréal, Québec, Canada
H3C 3P8
2Department of Earth and Planetary Sciences, McGill University, 3450 Université,
Montréal, Québec, Canada, H3A 2A 7
*Corresponding author: [email protected]
5
Abstract
Micropaleontological and geochemical analyses were carried out on two sediment
box cores (AHOO-2220 and CR02-23) recovered in the Lower St. Lawrence Estuary
(LSLE) in order to document recent temporal variations of primary productivity and
carbon fluxes to the bottom waters. These reveal a ten-fold increase in the
accumulation rate of dinoflagellate cysts and benthic foraminifera in the sediment
over the last four decades which can be interpreted as a recent increase in pelagie and
benthic production. Furthermore, the appearance of the benthic foraminiferal species
Brizalina subaenariensis and Bulimina exilis, which are tolerant of low oxygen
concentrations and high organic fluxes, in the upper 20 cm of the cores, may reflect
significant changes in bottom water conditions over the last 40 years. Variations in
the microfossil abundances in core AHOO-2220 are strongly correlated with an
mcrease in organic carbon (OC) content (from 1.1 to 1.6%) and to a shift in the
isotopie signature of the latter (813CORG from -24.8 to -24.0%0). Similarly, a
concomitant decrease in the CORG:N ratio (from 15 to 12), an increase in organic
carbon content (from 1.3 to 1.9%) and an increase in Ül3CORG (from -24.5 to -23.5%0)
were observed in core CR02-23, ail of which suggest an enhanced accumulation of
marine over terrestrial OC in the LSLE. Our results imply that a significant increase
in marine productivity in the LSLE occurred since the 1960's.
Keywords: Lower St. Lawrence Estuary, eutrophication, hypoxia, dinoflagellate
cysts, benthic foraminifera, geochemistry.
1. Introduction
Hypoxia occurs naturally in many coastal environments with restricted circulation,
such as fjords and inland seas, but the recent proliferation of hypoxic zones along
inhabited coastlines and estuaries appears to be linked to anthropogenic nutrient
6
loading and coastal eutrophication (Cloern, 2001; Colman and Bratton, 2003, Diaz
and Rosenberg, 1995; Gray et al., 2002, Turner and Rabalais, 1994). Severe hypoxia
is defined as the threshold below which significant impacts on the biota can be
observed and corresponds to dissolved oxygen concentrations below 62.5 !lM or 2
mg/L (Diaz and Rosenberg, 1995; Rabalais et al., 2001). In most cases, increased
discharge of nutrients (especially nitrate) in coastal and estuarine environments
enhances primary productivity which, in turn, increases the flux of organic carbon
(OC) to the bottom waters and the mass accumulation rate (MAR) of OC in
sediments. The microbially-mediated remineralization of this organic carbon can
contribute to the progressive depletion of dissolved oxygen in the bottom waters in a
stratified body of water.
A number of indicators of present day eutrophication have been identified: light
penetration depth, chlorophyll a concentration, epiphytic versus macroalgal growth
rates, changes in algal community composition (diatoms to dinoflagellates, benthic to
pelagie) and the increased reminera1ization rate of organic matter (Livingston, 2000).
Unfortunately, time series longer than 30 years are not available for these parameters
in most coastal environments. Tt is, therefore, critical to develop and app1y proxies of
eutrophication in order to reconstruct historical variations of primary productivity and
determine if recent hypoxia results from natural variations or anthropogenic activities
that foster the export of limiting nutrients.
Recent measurements of dissolved oxygen (DO) concentrations in the bottom waters
of the LSLE show that about 1300 km2 of the Laurentian Channel (LC) are now
perrnanently bathed by hypoxic waters (Gilbert et al., 2005). A compilation of
historical DO measurements of waters taken between 300 and 355 m depth in the
LSLE reveals that DO concentrations have decreased by nearly 50% over the last 70
years, from 125 !lM in the 1930s to an average value of 65 !lM for the 1984-2003
period (Gilbert et al., 2005). Preliminary results on the distribution of redox-sensitive
elements (e.g., U, Mo, Re) in a long core (i.e., MD99-2220) recovered in the LSLE
7
show no evidence of pre-anthropogenic anoxia in this area over the Holocene (G.
Chaillou, pers. comm.).
In this paper, we use micropaleontological and geochemical proxies recorded in the
sediments to reconstruct past variations in productivity in the LSLE. Among these,
the abundance and assemblages of dinoflagellate cysts serve as proxies of primary
production and nutrient availability as documented from the modern assemblage (c.f.
Devillers and de Vernal, 2000; Radi and de Vernal, 2004) and applied to the late
Holocene sedimentary sequences of the Scandinavian fjords (Dale, 1994; Thorsen
and Dale, 1997; Dale, 2001), the north-western Adriatic Sea (Sangiorgi and Donders,
2004), and along the NE US coast (Pospelova et al., 2002; Verardo, 1999). The
abundance and taxonomy of benthic foraminifera are also used to qualitatively assess
the benthic oxygen demand since they are sensitive to the OC flux and bottom water
oxygenation (Loubere, 1991; Mackensen et al., 1993; Sen Gupta, 1996; Bernhard,
1997; Karlsen et al., 2000; Osterman, 2003; Platon et al., 2005). These data are
coupled to geochemical measurements, including the organic carbon content, its
isotopie signature (813CORG) and the CORG:N ratio to identify the origin and nature of
the organic matter preserved in the sediment (Meyers, 1994; Struck et al., 2000; Voss
et al, 2000; Zimmerman and Canuel, 2000; Bratton et al., 2003; McKay et al., 2004).
The objective is to qualitatively reconstruct temporal variations of primary
productivity and to link these to the dissolved oxygen record.
2. Study area
2.1 Water masses
The St. Lawrence Estuary and Gulf of St. Lawrence form part of the second largest
freshwater system in the world (freshwater discharge of 10 900m3 s·l) (Bourgault and
Koutitonsky, 1999). The dominant topographie feature of this maritime system is the
8
Laurentian Channel (LC), a submarine valley, 250-500 m deep, that extends over
1240 km landward from the continental shelf edge of the eastern Canadian coast to
Tadoussac (Figure 1). The circulation is estuarine and is characterized by three water
layers: 1) a thin surface layer (down to 50 m) of low salinity water (~25) that flows
seaward and originates from mixing of seawater with freshwater runoff from the
Great Lakes, St. Lawrence and Northern Quebec river drainage system, 2) a seasonal
intermediate, cold and saline (32-34) layer that is present between 50 and 150 m, and
3) a warmer and saltier (>34) deep layer that flows 1andward and is a mixture of the
Labrador Current and North Central Atlantic waters (Dickie and Trites, 1983).
2.2 The oxygen balance
The deep waters of the LC are isolated from the atmosphere by a permanent
pycnoc1ine situated between 100 - 150 m depth. Under these conditions, the bottom
waters gradually lose oxygen through respiration and remineralization of organic
matter that settles through the water column as they flow landward from the mouth of
the LC to its head near Tadoussac. The estimated time it takes for a parcel of water
entering the mouth of the LC at 250 m depth to reach its head is 3-4 years (Gilbert et
al., 2005). At depths greater than 150 m, the oxygen consumed through respiration
cannot even be replenished by winter convection (Petrie, 1996). For this reason, the
oxygen balance is precarious: increased organic carbon fluxes and respiration and/or
decreased landward flow (or increased residence time) will lead to lower oxygen
concentrations.
Based on a detailed analysis of archivai data, Gilbert et al. (2005) proposed that
between one half and two-thirds of the 60 JlM dec1ine in dissolved oxygen
concentration and a concurrent 1.65°C warming of the bottom waters of the LSLE in
the last seven decades are attributable to a decreasing proportion of oxygen-rich
Labrador Current Water in the water mass entering the Gulf of St. Lawrence from the
northwest Atlantic Ocean. A discussion of the changes of the circulation pattern in

9
the Northwestern Atlantic that impinge on the deep estuary ventilation can be found
in Gilbert et al. (2005). Because of the precarious oxygen balance in the LSLE,
increased primary productivity and organic carbon fluxes to the bottom waters could
account for the remainder of the dissolved oxygen decline due to increased oxygen
consumption. Benoit et al. (2006) developed a 2-D coupled advection-diffusion
diagenetic model that emphasizes the raIe of organic carbon oxic mineralization in
generating hypoxic bottom waters in the LSLE.
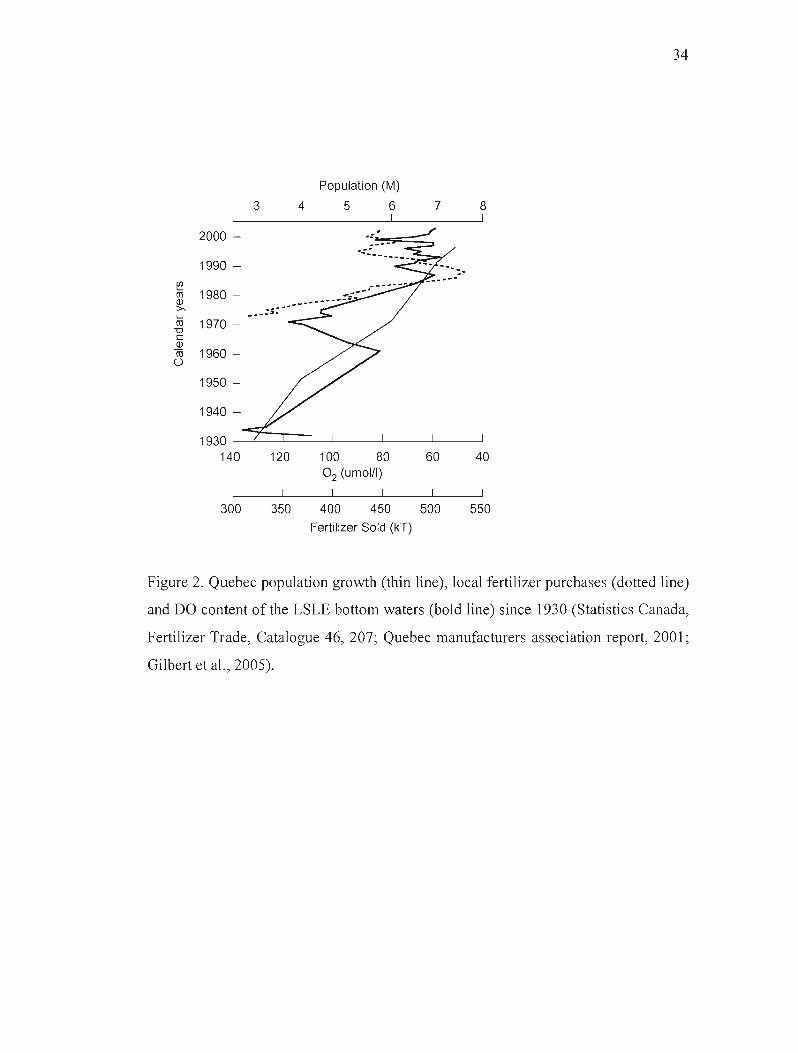
2.3 Land use history
Since the European settlement in the 1i h century, the rate of agricultural growth and
land clearing increased and reached a maximum in the second half of the 20tl1 century
concomitantly with industrial development in Eastern Canada, notably the paper mill
industry. These activities resulted in increased discharge of both nutrients (by soil
erosion) and terrigenous organic carbon (by paper mills waste) to the LSLE. A
historical record of the amount of fertilizers sold (and used) locally reveals a 70%
increase between 1970 and 1988 followed by a modest decrease. Figure 2 shows how
weil the two variables are correlated with the DO content of the LSLE bottom waters.
3. Material and methods
3.1 Coring sites and on-board sampling
Sediment samples were collected !il August 2000 (AHOO-2220,
48°38.33N/68°37.82W; 324m) and September 2002 (CR02-23,
48°42.008'N/68°38.894'W; 345m) on the RN Alcide C. Horth in the LSLE (Figure
1). Undisturbed sediments were recovered with an Ocean Instrument Mark II box
corer. The core (0.12 m2 x 0.5 m long) was immediately transferred to a custom
holding table (Edenborn et al., 1986) and sampled at one centimeter intervals as the
sediment was sequentially exposed by step-wise lowering of the front plate. Core
AHOO-2220 was recovered from the southern margin of the LC whereas CR02-23
10
was taken on the northern margin. Despite the short distance (i.e., 9 km) separating
the two sites, significant differences in the surface water properties and circulation
patterns (El-Sabh and Silverberg, 1990) may influence the flux and nature of the
organic matter settling from the surface and, thus, the sedimentary record.
3.2 Chronology and accumulation rates
Lead-210 activities of dried and crushed samples were obtained indirectly by
measuring the decay rate of its daughter isotope 2IOpo (tl/2 = 138.4 days; a = 5.30
MeV) by alpha spectrometry. The measurements were carried out more than 6
months after sampling to ensure that secular equilibrium had been reached. A 209pO
spike was added to the samples to determine the extraction and counting efficiencies.
Polonium was extracted from the sediment and purified by chemical treatments
(reacted sequentially with HCl, HN03, HF and H202) and deposited on a silver disk
(Flynn, 1968). The 209-210pO activities were measured in a silicon surface-barrier a
spectrometer (EGG&ORTEC type 576A). The excess 210Pb activity was obtained by
subtracting the supported regional (i.e., LSLE) activity value of 1.00 ± 0.08 dpm/g
(Zhang, 2000). Sedimentation rates (constant rate supply model) were calculated
using the radioactive decay constant (À.) of 210Pb and the linear regression slope of the
logaritlunic function of excess 210Pb.
Cesium-137 was measured by ')'-ray spectrometry at 661.6 keV, usmg a low
background high purity Ge well-detector (Canberra). Replicate analyses (n=6) of the
standard reference material IAEA-300 (Baltic Sea sediment) confirmed the
reproducibility (--±1%) of the measured I37Cs activities.
Il
3.3 Micropaleontological analyses
3.3.1 Palynomorphs
Sediment samp1es were treated according to the method described by de Vernal et al.
(1999). Briefly, the sediment was washed through 106 and 10 ~m sieves to eliminate
clay-sized and coarse grained particles. The 10-106 )..lm size fraction was reacted
sequentially with warm hydrochloric acid (HCl 10%) and warm hydrofluoric acid
(HF 49%) to dissolve, respectively, carbonate and silicate phases. The residual solids
were mounted between slides and cover-plates for optical microscopie analyses at
400x to 1000x magnification.
The concentration of palynomorphs was estimated based on the marker grain method
(Matthews, 1969). The addition of a known number of exotic grains (Lycopodium
spores) to each samp1e permits the eva1uation of abso1ute concentrations from the
relative counts of the marker grains and palynomorphs. The reproducibility of the
counts was estimated at ±10% at the 95% confidence interval (de Vernal et aL, 1987).
Ali pa1ynomorphs (i.e., dinocysts, organic linings of benthic foraminifera, pollen
grains and spores) were counted in sampies from core AHOO-2200. Only dinocysts
and organic linings of benthic foraminifera were counted in core CR02-23. The
dinocyst nomenclature conforms to that reported in Rochon et al. (1999).
In this paper, we report concentrations and accumulation rates of dinocysts and
organic linings of benthic foraminifera as weil as the relative abundances of the main
dinocyst taxa. Detailed pa1ynological data can be found in Thibodeau (2005).
Taxonomie affinities between the organic linings (OL) and the calcareous tests (CT)
of benthic foraminifera were demonstrated from laboratory experiments (de Vernal et
al., 1992; Leduc et aL, 2002).
12
3. 3.2 Benthic foraminiferal tests
For each subsample, five cm3 of sediment were dried at room temperature, weighed,
and washed through a 106 ~m screen. The residual fraction was examined under a
binocular microscope (20x). The <1 06 ~m fraction was not examined to avoid small
size tests and juvenile forms that are often difficult to identify. Ali foraminiferal tests,
including calcareous and agglutinated forms, were hand-picked, identified and
counted. The nomenclature of Rodrigues (1980) was adopted.
The concentration, accumulation rates and relative abundances of the most abundant
taxa (Brizalina subaenariensis, Globobulimina auriculata, Bulimina marginata and
Bulimina exilis) are reported here whereas data for other taxa can be found in
Thibodeau (2005).
3.4 Carbon analyses (TOC/TIC, bi3C, CN)
The total carbon (TC) and total nitrogen (TJ'J) contents of an aliquot (5 to 10mg) of
the dried, crushed and homogenized sediment samples were determined with a Carlo
Erba™ NC 2500 elemental analyzer. Total inorganic carbon (TIC) was analyzed
independently using a UIC Coulometrics coulometer fol1owing acidification of the
samples and COz extraction. Total organic carbon (TOC) was obtained by difference
(i.e., TC minus TIC). Precision, as determined from replicate measurements of
Organic Analytical Standard substances (Acetanilide, Atropine, Cyclohexanone-2,4
Dinitrophenyl-Hydrazone and Urea), are estimated at ± 0.1 % for OC and ± 0.3% for
N contents. The analytical reproducibility is 5%.
Sediment samples were acidified with IN HCl, dried, crushed, and homogenized
before isotopic analysis of the organic carbon (OC). The isotopic composition of the
OC was measured with a Carlo Erba™ elemental analyzer inline with a GV
Instruments IsoPrime™ mass spectrometer. Data are reported in the 8 notation in %0
with reference to V-PDB (Coplen, 1995) and the analytical uncertainty is ± 0.1 %0.
The international standard IAEA-C6 sucrose was measured several times during the
13
isotopie analyses and yielded an average value of -10.8 ± 0.1 %0 (n=8) whereas the
reported value is -10.8 %0. The isotopie composition of nitrogen (8 15N) was not
measured due to the very low (~0.14 % W/W) nitrogen content of the sediments.
3. 6 Microfossit accumulation rate estimates
The accumulation rate (AR) is reported as the number of microfossils per square
centimetre per year. It was calculated using the sedimentation rate (cm/yr) and the
concentrations of cysts per cm3 of wet sediment in core AHOO-2220. Given the
ambiguity of the sedimentation rate below 12 cm in core CR02-23, we did not
attempt to calculate AR.
4. Results
4.1 Core AHOO-2220
210Pb d .4. . . Il Excess , 13les actlvlty.. an sed'lmentatlon rates
The excess 2lOpb activity elOPbex) of the sediments, expressed on a logarithmic scale,
shows uniform values in the upper 5 cm of the core (Figure 3). This interval
corresponds to the zone of active bioturbation. The InelOPbex) data in the 5 to 30 cm
interval can be fit reasonably well to a simple linear equation with a slope of -0.062
(r2 = 0.91), corresponding to a sedimentation rate of about 0.50 (± 0.01) cm/yr.
Artificial radionuclides such as l37Cs originated from atmospheric nuclear tests
carried out during the 1952-1972 period with maximum activities corresponding ta
the year 1963 (Jouanneau et al., 1999). Measurements of l37Cs activity and the peak
at ~ 18 cm (Figure 3) are consistent with the sedimentation rate estimated from the
210Pbex activities.
14
According to our age model (Figure 3), the upper 30 cm would represent
approximately 60 years of sedimentation (i.e., 1940-2000 AD). Below 30 cm, the
sedimentation rate could be assumed to be identical to the one derived from the 5 to
30 cm interva1 or estimated from the age model established on the basis of 14C
measurements (n==9) by St-ange et al. (2003) in a long piston core (i.e., MD99-2220)
recovered in 1999 at the box core site. In the latter age model, sedimentation rates are
nearly invariant at 0.15 cm/year for the last 8000 years. Thus, below 30 cm, the
sedimentation rates might possibly range between 0.15 and 0.50 cm/yr. Because of
poor chronological control, we did not attempt to evaluate AR for the lower section of
core AHOO-2220.
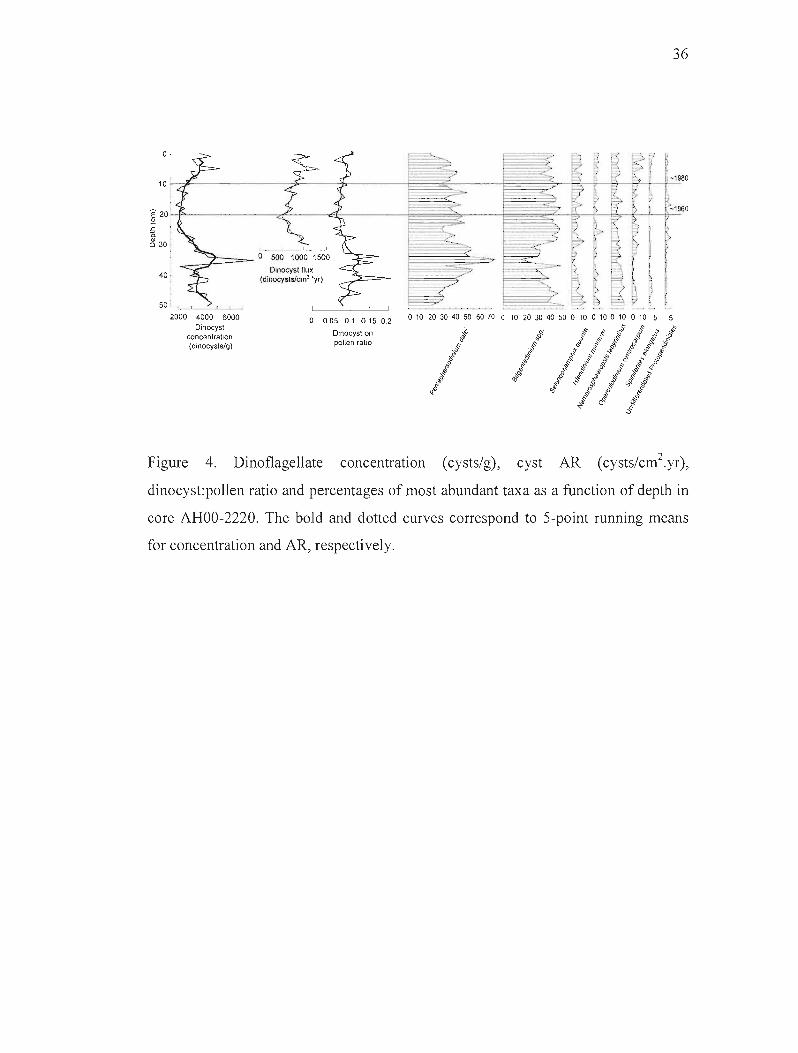
4.1.2. Dinocyst assemblages
Dinocyst concentrations vary from 2000 to 5000 cysts/g (Figure 4). The data reveal a
very significant upward increase of the dinocyst accumulation rate (AR) over the 0
20 cm interval, from approximately 500 to 1500 cysts*cm'2*y(l. These results may
be interpreted as a significant increase in planktonic productivity over the last
decades. Preliminary results of biogenic silica extractions (A. Mucci, pers. comm) on
a core taken close (48°42.1l'N/68°38.94'W; 350m) to AHOO-2220 show no systematic
trends or variations in concentrations (0.17-0.37% W/W) over the 3 to 40 cm depth
interval and a sharp increase in the top 2 cm (0.87%). On the other hand, a historical
compilation of dissolved silica concentrations in the bottom waters (i.e., > 300 m) of
the LSLE reveals a significant increase since 1960 (from 18 to 55 ~M; D. Gilbert,
pers. comm). These data are not consistent with a recent change in ecology (nitrate vs
silicate depleted) or the type of p1anktonic productivity (dinoflagellate vs diatoms) in
surface waters but possibly point to an overall increase in pelagic productivity over
past four decades.
The dinocysts assemblages are dominated throughout the core by heterotrophic taxa
belonging to the genus Brigantedinium (25 to 45%) and by the autotrophic taxon
15
Pentapharsodinium dalei (25 to 55%). In addition to Brigantedinium spp., many
other heterotrophic taxa are present. They include Selenophemphix quanta,
lslandinium minutum, lslandinium? cezare, and unidentified Protoperidinium-type
dark brown cysts which were grouped as "undifferentiated Protoperidinioids". The
autotrophic assemblages include Nematosphaeropsis labyrinthus, Operculodinium
centrocarpum and a few specimens of Spiniferites elongatus. No major change could
be resolved in the composition of the assemblages, except a decrease of
Pentapharsodinium dalei (40 to 20%) and a concomitant increase of Operculodinium
centrocarpum (2 to 10%) in the top 15 cm of the core. Ali others species show high
frequency oscillations, but no clear trend. The ratio of dinocysts to pollen grain shows
the same trend as the concentration and AR of dinocysts and, thus, confirm that the
observed trend does not result from differential dilution by other sediment
components.
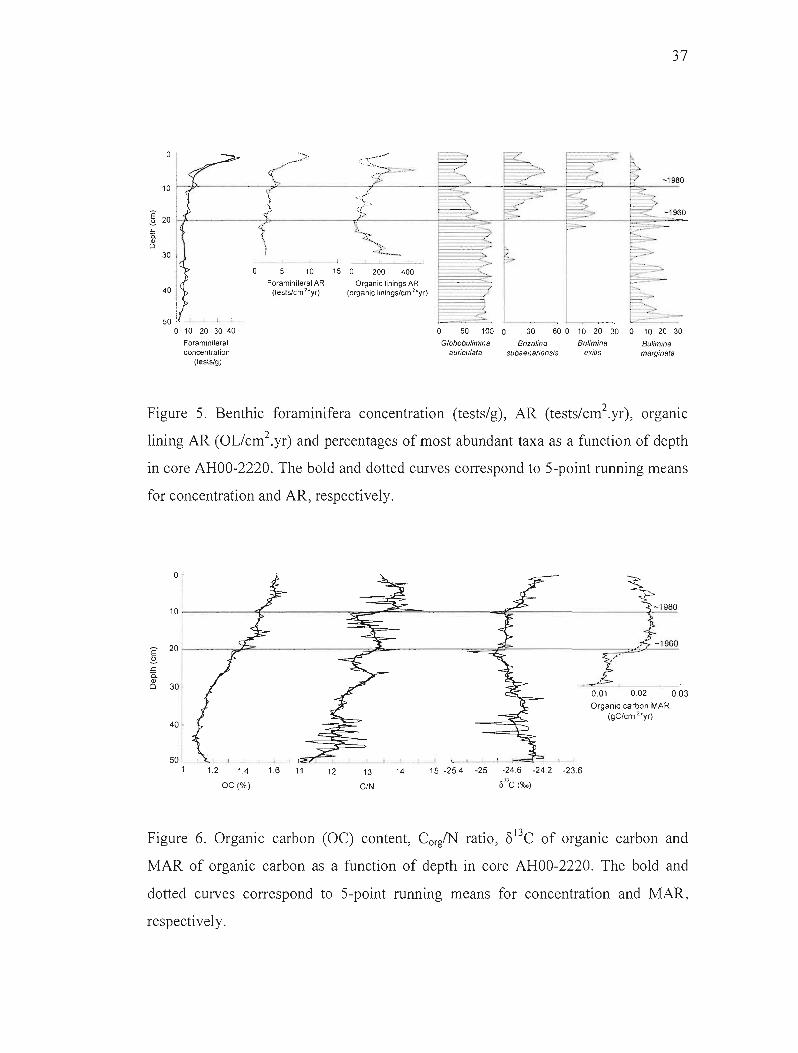
4.1.3. Benthic foraminiferal assemblages
The concentration and AR of benthic foraminifera also increase towards the
sediment-water interface in core AHOO-2220 (Figure 5). Concentrations are fairly
constant (~3 to 7 tests/g) in the lower part of the core (i.e., below 30 cm) and increase
up to 40 tests/g in the upper part of the core. The AR displays a similar trend, with
uniform values ranging between 1 and 5 tests*cm·2*y(1 in the 10-30 cm interval and
a significant increase up to lOto 15 tests*cm'2*y(! in the upper part of the core. The
AR of foraminifera organic linings recovered from palynological preparations also
displays a significant increase in the upper part of the core. In contrast to the
uncertainties related to the preservation of foraminifera shells (i.e., dissolution during
oxic diagenesis), variations in the abundance of organic linings can be clearly
interpreted as a recent increase in benthic foraminifera production.
The foraminifera tests assemblages are characterized by low species diversity, with
only 4 species accounting for more than 95% of the total abundance. The dominant
16
species in the 20-50 cm interval is Globobulimina auriculata (30-100%). Bulimina
marginata is present throughout the core but shows large relative abundance
variations (0-35%). Brizalina subaenariensis appears at 34 cm depth and becomes co
dominant (20 to 60%) in the upper part of core. Bulimina exilis also appears in the
upper part of the core and rapidly becomes a significant component of the assemblage
(up to 30%). The occurrence and increased relative abundance of Brizalina
subaenariensis and Bulimina exilis in the upper part of the core are consistent with a
high organic carbon flux and low dissolved oxygen concentrations (Kaiho, 1994;
Bruchert et al., 2000).
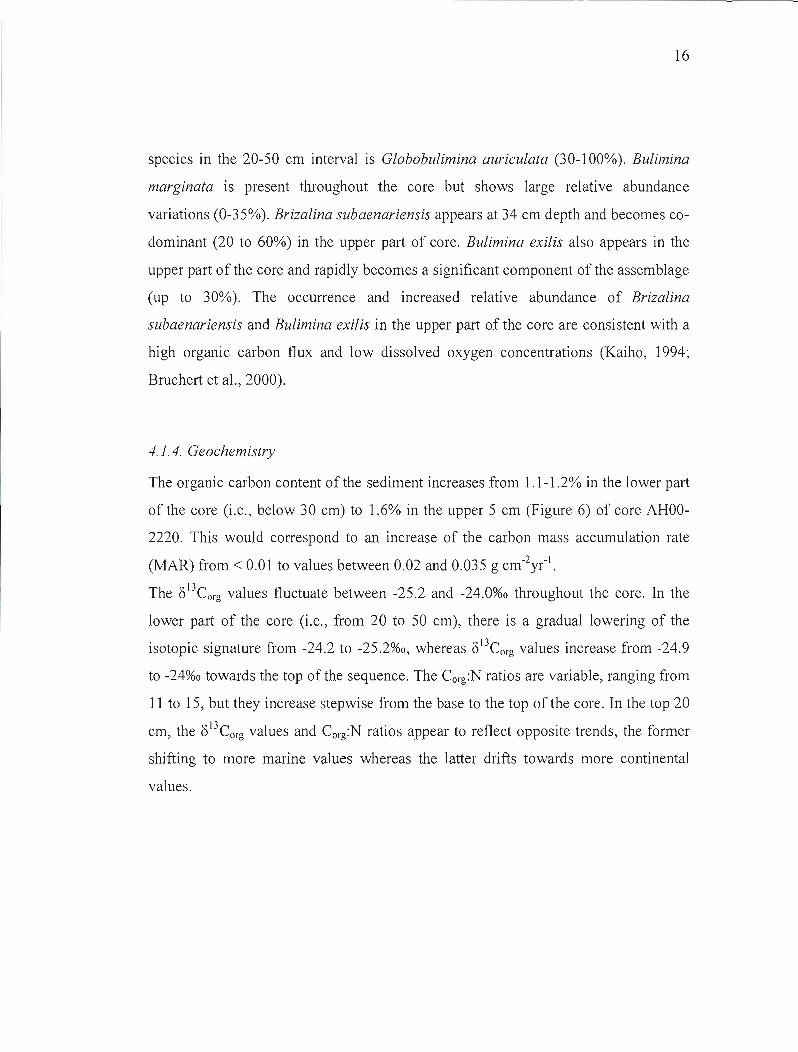
4.1.4. Geochemistry
The organic carbon content of the sediment increases from 1.1-1.2% in the lower part
of the core (i.e., below 30 cm) to 1.6% in the upper 5 cm (Figure 6) of core AHOO
2220. This wou1d correspond to an increase of the carbon mass accumulation rate
(MAR) from < 0.01 to values between 0.02 and 0.035 g cm-2y(i.
The 813Corg values fluctuate between -25.2 and -24.0%0 throughout the core. In the
lower part of the core (i.e., from 20 to 50 cm), there is a graduai lowering of the
isotopie signature from -24.2 to -25.2%0, whereas 813Corg values increase from -24.9
to -24%0 towards the top of the sequence. The Corg:N ratios are variable, ranging from
Il to 15, but they increase stepwise from the base to the top of the core. In the top 20
cm, the 813Corg values and Corg:N ratios appear to reflect opposite trends, the former
shifting to more marine values whereas the latter drifts towards more continental
values.
17
4.2. Core CR02-23
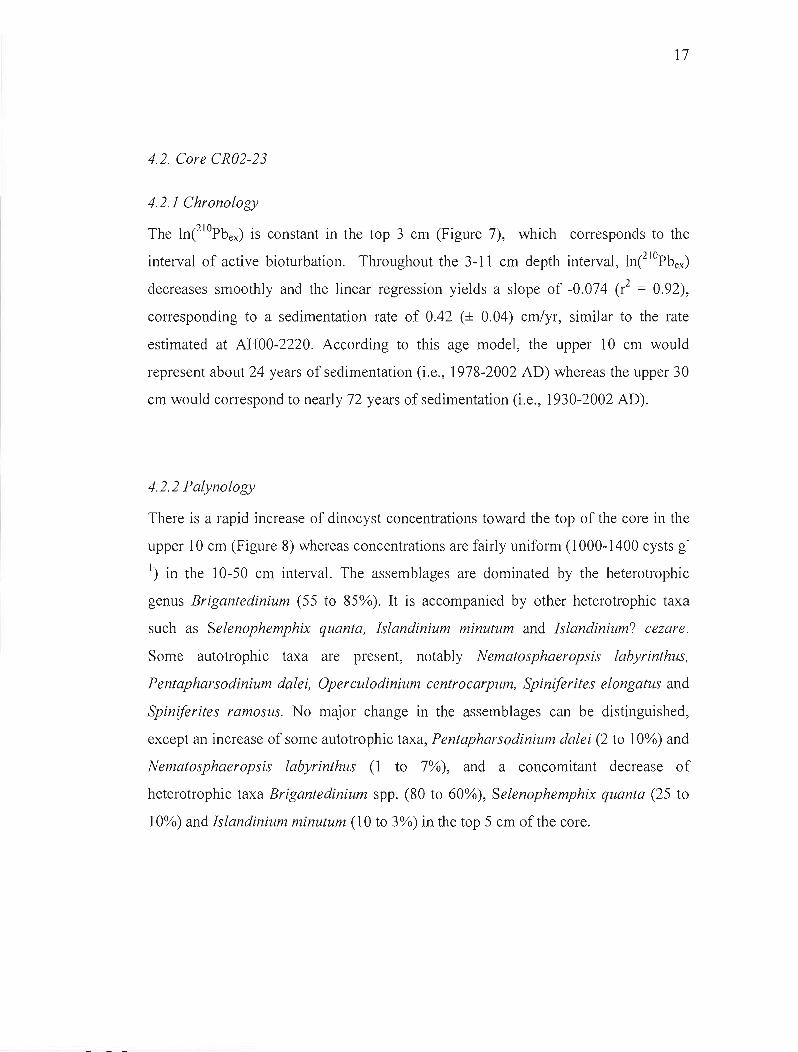
4.2.1 Chronology
The Ine1oPbex) is constant in the top 3 cm (Figure 7), which corresponds to the
interval of active bioturbation. Throughout the 3-11 cm depth interval, Ine1oPbex)
decreases smoothly and the !inear regression yields a slope of -0.074 (1'2 = 0.92),
corresponding to a sedimentation rate of 0.42 (± 0.04) cm/yr, similar to the rate
estimated at AHOO-2220. According to this age model, the upper 10 cm would
represent about 24 years of sedimentation (i.e., 1978-2002 AD) whereas the upper 30
cm would correspond to nearly 72 years of sedimentation (i.e., 1930-2002 AD).
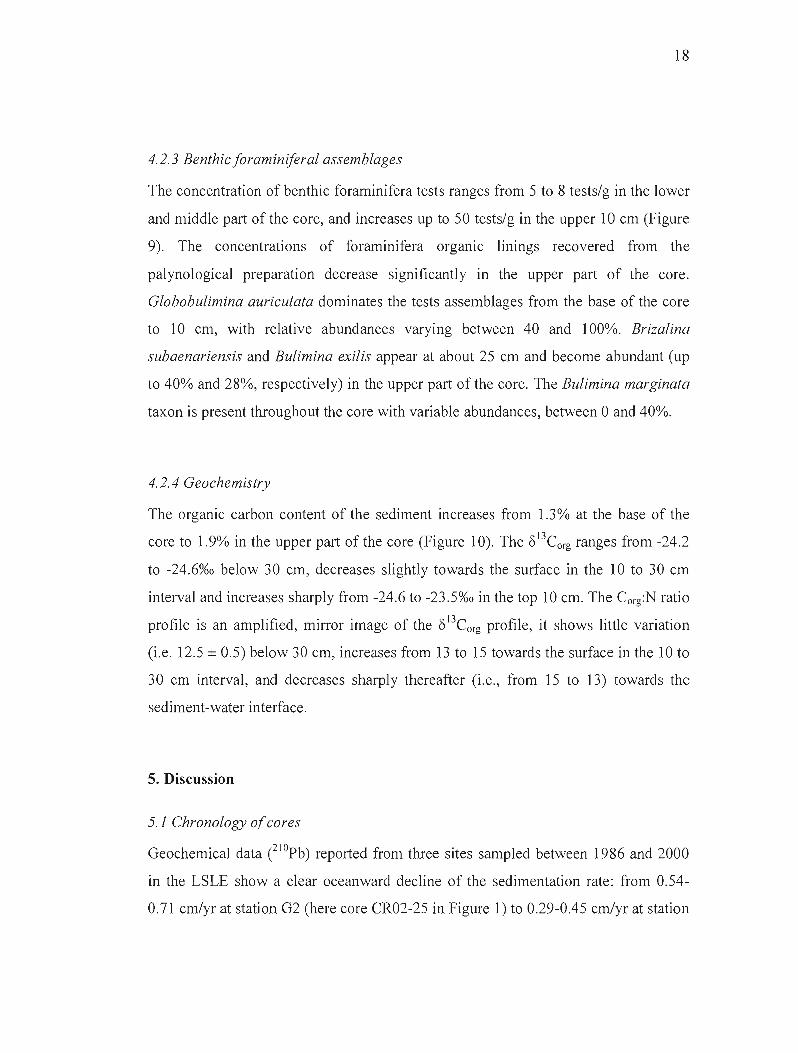
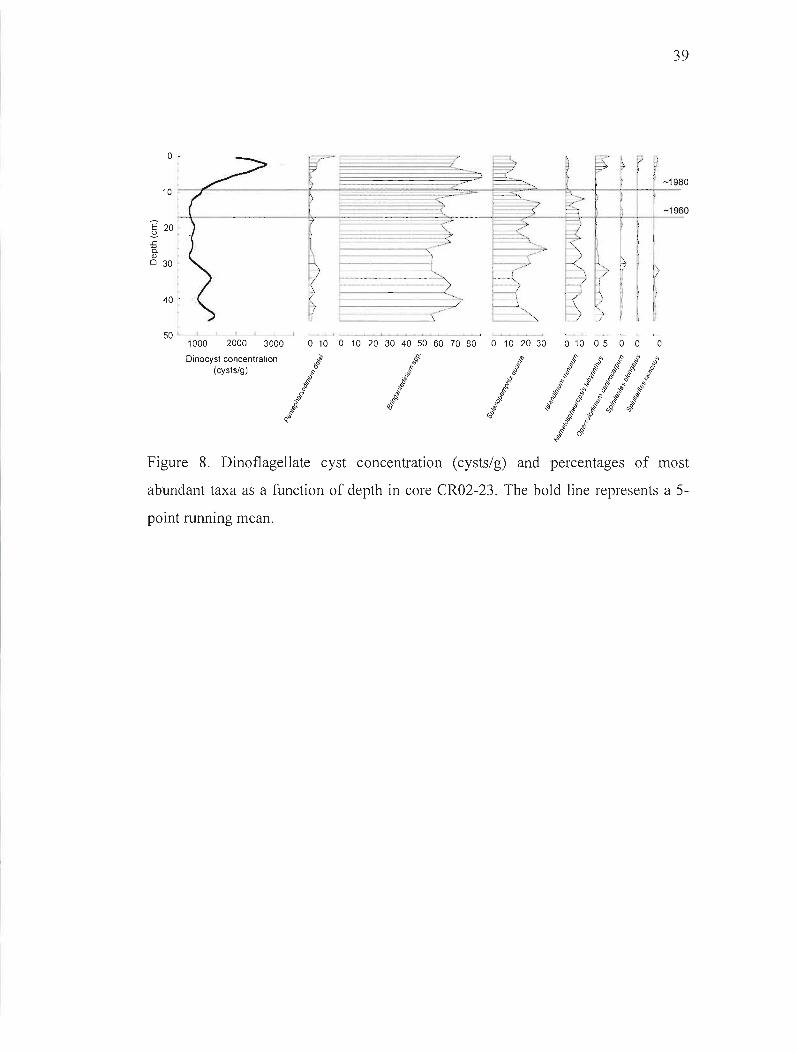
4.2.2 Palynology
There is a rapid increase of dinocyst concentrations toward the top of the core in the
upper 10 cm (Figure 8) whereas concentrations are fairly uniform CI 000-1400 cysts g
1) in the 10-50 cm interval. The assemblages are dominated by the heterotrophic
genus Brigantedinium (55 to 85%). It is accompanied by other heterotrophic taxa
such as Selenophemphix quanta, Islandinium minutum and Islandinium? cezare.
Sorne autotrophic taxa are present, notably Nematosphaeropsis labyrinthus,
Pentapharsodinium dale i, Operculodinium centrocarpum, Spiniferiles elongatus and
Spiniferites ramosus. No major change in the assemblages can be distinguished,
except an increase of sorne autotrophic taxa, Pentapharsodinium dalei (2 to 10%) and
Nematosphaeropsis labyrinthus CI to 7%), and a concomitant decrease of
heterotrophic taxa Brigantedinium spp. (80 to 60%), Selenophemphix quanta (25 to
10%) and Islandinium minutum (10 to 3%) in the top 5 cm of the core.
18
4.2.3 BenthicJoraminiferal assemblages
The concentration of benthic foraminifera tests ranges from 5 to 8 tests/g in the lower
and middle part of the core, and increases up to 50 tests/g in the upper 10 cm (Figure
9). The concentrations of foraminifera organic linings recovered from the
palynological preparation decrease significantly in the upper part of the core.
Globobulimina auriculata dominates the tests assemblages from the base of the core
to 10 cm, with relative abundances varying between 40 and 100%. Brizalina
subaenariensis and Bulimina exilis appear at about 25 cm and become abundant (up
to 40% and 28%, respectively) in the upper part of the core. The Bulimina marginata
taxon is present throughout the core with variable abundances, between 0 and 40%.
4.2.4 Geochemistry
The organic carbon content of the sediment increases from 1.3% at the base of the
core to 1.9% in the upper part of the core (Figure 10). The 813Corg ranges from -24.2
to -24.6%0 below 30 cm, decreases slightly towards the surface in the 10 to 30 cm
interval and increases sharply from -24.6 to -23.5%0 in the top 10 cm. The Corg:N ratio
profile is an amplified, mirror image of the 813Corg profile, it shows !ittle variation
(i.e. 12.5 ± 0.5) below 30 cm, increases from 13 to 15 towards the surface in the 10 to
30 cm interval, and decreases sharply thereafter (i.e., from 15 to 13) towards the
sediment-water interface.
5. Discussion
5.1 Chronology oJcores
Oeochemical data e1opb) reported from three sites sampled between 1986 and 2000
in the LSLE show a clear oceanward decline of the sedimentation rate: from 0.54
0.71 cm/yr at station 02 (here core CR02-25 in Figure 1) to 0.29-0.45 cm/yr at station
19
23 (here core CR02-23) to 0.10-0.22 cmJyr at station 009 at the end of the LSLE in
front of Pointe-des-Monts (Deschamps, 1997; Smith et al., 1999; Zhang, 2000;
Silverberg et al., 1986; Jennane, 1992). The sedimentation rates obtained in the
present study are consistent with these previous estimates: estimated sedimentation
rates in the upper parts of core AH-2220 (located between core CR02-25 and CR02
23) and core CR02-23 are 0.50 cm/yr and 0.42 cm/yr, respectively.
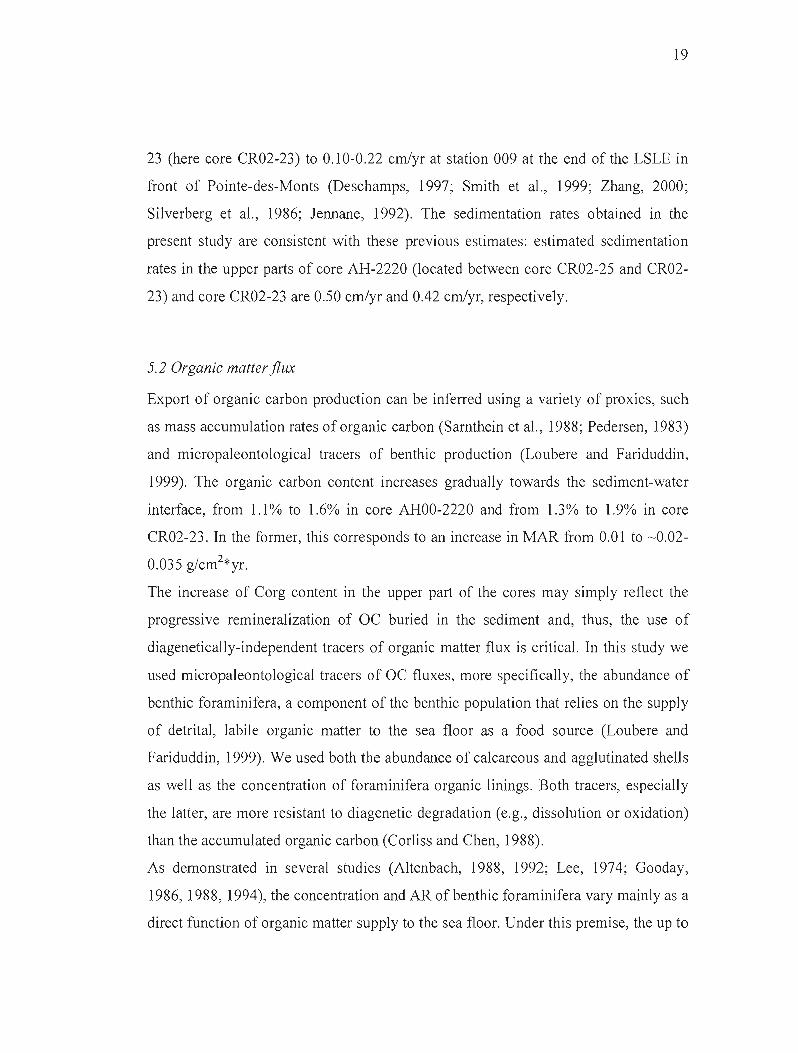
5.2 Organic matter flux
Export of organic carbon production can be inferred using a variety of proxies, such
as mass accumulation rates of organic carbon (Sarnthein et al., 1988; Pedersen, 1983)
and micropaleontological tracers of benthic production (Loubere and Fariduddin,
1999). The organic carbon content increases gradual1y towards the sediment-water
interface, from 1.1 % to 1.6% in core AHOO-2220 and from 1.3% to 1.9% in core
CR02-23. In the former, this corresponds to an increase in MAR from 0.01 to ~0.02
0.035 g/cm2*yr.
The increase of Corg content in the upper part of the cores may simply reflect the
progressive remineralization of OC buried in the sediment and, thus, the use of
diagenetical1y-independent tracers of organic matter flux is critical. In this study we
used micropaleontological tracers of OC fluxes, more specifical1y, the abundance of
benthic foraminifera, a component of the benthic population that relies on the suppl y
of detrital, labile organic matter to the sea floor as a food source (Loubere and
Fariduddin, 1999). We used both the abundance of calcareous and agglutinated shel1s
as weil as the concentration of foraminifera organic linings. Both tracers, especial1y
the latter, are more resistant to diagenetic degradation (e.g., dissolution or oxidation)
than the accumulated organic carbon (Cor1iss and Chen, 1988).
As demonstrated in several studies (Altenbach, 1988, 1992; Lee, 1974; Gooday,
1986, 1988, 1994), the concentration and AR of benthic foraminifera vary mainly as a
direct function of organic matter supply to the sea floor. Under this premise, the up to

20
one order of magnitude increase in concentration and AR of benthic foraminifera
tests and linings observed over the last three decades in the sediments of the LSLE
can be interpreted as a response to an increased labile organic carbon flux.
Alternatively, it could be interpreted as a better preservation and/or lesser predation
of the foraminifera (Verhal1en, 1991) but, given the ten-fold increase in
concentration, it is not likely that they solely account for such a gradient.
Furthermore, it is important to note that the gradient also corresponds to the
occurrence, among the benthic assemblages, of two species that are tolerant of lower
oxygen levels (see section 5.3).
5.3 Primary productivity
The carbon isotopie signature of the sedimentary organic matter is diagnostic of its
origin and, thus, the integrated contribution of its various sources (Meyers, 1994). In
estuarine environments, the carbon isotopie signature reflects the proportion of
particulate and dissolved organic carbon (POC and DOC) derived from both
terrestrial sources and in-situ (i.e., algal) production (Mook and Koene, 1975;
Westerhausen et al., 1993). Marine algae are typical1y composed of OC with a 13C
isotopie composition of -20 to -22%0 whereas continental OC is lighter at -27%0
(Meyers, 1994). The shift in 813Corg recorded in the upper part of the core, over the 0
to 20 cm interval, may therefore be interpreted as a higher contribution of marine
organic carbon to the sediments of the LSLE since the 1960s. The interval below is
characterized by the opposite trend, which may reflect the rapid growth of the paper
mill industry from the 1930's to the 1950's and a corresponding increase in the
discharge ofterrestrial organic matter to the estuary (St-ange et al., 2003). These pre
1960 and post-1960 trends are also observed in the Corg:N ratio profile in core CR02
23, but not in core AHOO-2220. The discrepancy may reflect the spatial heterogeneity
in the water column chemical properties and circulation patterns in this part of the
estuary (El-Sabh and Silverberg, 1990). The Corg:N ratio profile in core AHOO-222Ü
21
in more consistent with other geochemical and micropaleontological proxies at is
shows an increase from the bottom of the core to about 10 cm below the surface, thus
alluding to more important continental inputs before ca. 1960 AD, and a relatively
greater marine organic carbon source over the last decades.
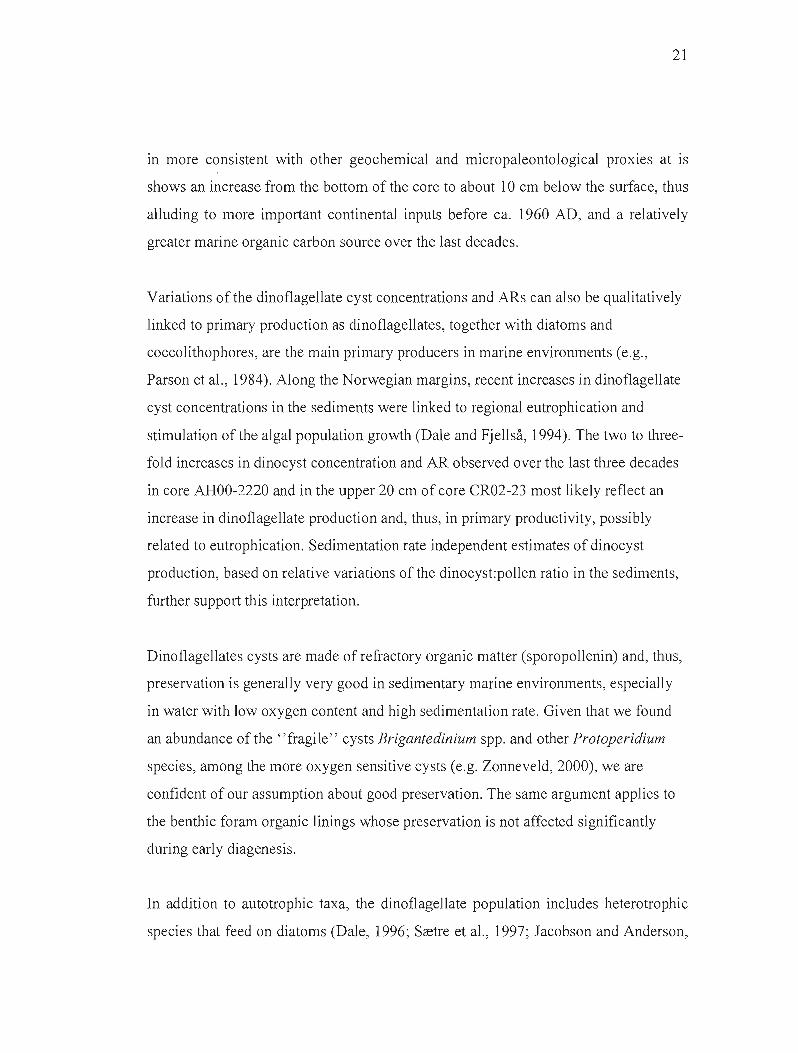
Variations of the dinoflagellate cyst concentrations and ARs can a1so be qua1itative1y
linked to primary production as dinoflagellates, together with diatoms and
coccolithophores, are the main primary producers in marine environments (e.g.,
Parson et al., 1984). Along the Norwegian margins, recent increases in dinoflagellate
cyst concentrations in the sediments were linked to regional eutrophication and
stimulation of the algal population growth (Dale and Fjellsâ, 1994). The two to three
fold increases in dinocyst concentration and AR observed over the last three decades
in core AHOO-2220 and in the upper 20 cm of core CR02-23 most likely reflect an
increase in dinoflagellate production and, thus, in primary productivity, possibly
related to eutrophication. Sedimentation rate independent estimates of dinocyst
production, based on relative variations of the dinocystpollen ratio in the sediments,
further support this interpretation.
Dinoflagellates cysts are made of refractory organic matter (sporopollenin) and, thus,
preservation is generally very good in sedimentary marine environments, especially
in water with low oxygen content and high sedimentation rate. Given that we found
an abundance of the "fragile" cysts Brigantedinium spp. and other Protoperidium
species, among the more oxygen sensitive cysts (e.g. Zonneveld, 2000), we are
confident of our assumption about good preservation. The same argument applies to
the benthic foram organic linings whose preservation is not affected significantly
during early diagenesis.
In addition to autotrophic taxa, the dinoflagellate population includes heterotrophic
species that feed on diatoms (Dale, 1996; Sretre et al., 1997; Jacobson and Anderson,
22
1986). Their cysts, preserved in the sediments, are particu1arly abundant in polynyas
(Hamel et al., 2002) and upwelling areas (Radi and de Vernal, 2004) and constitute
indirect tracers of productivity. No obvious change in the relative abundance of
heterotrophic versus autotrophic dinocysts was noted in the analysis of the cores
retrieved from the LSLE. The small changes in the relative abundance of the dinocyst
taxa over time may reflect changes in hydrographie conditions such as the warming
of LSLE waters by ~ 1°C between 1960-2000 (NODC, 2001). The differences in
dinocyst assemblages that are observed in the two cores further emphasize the spatial
heterogeneity in surface water properties in the LSLE, as noted by Giroux (1990) on
the basis of a clear zonation of dinocyst assemblages, notably for Pentapharsodinium
dalei taxa.
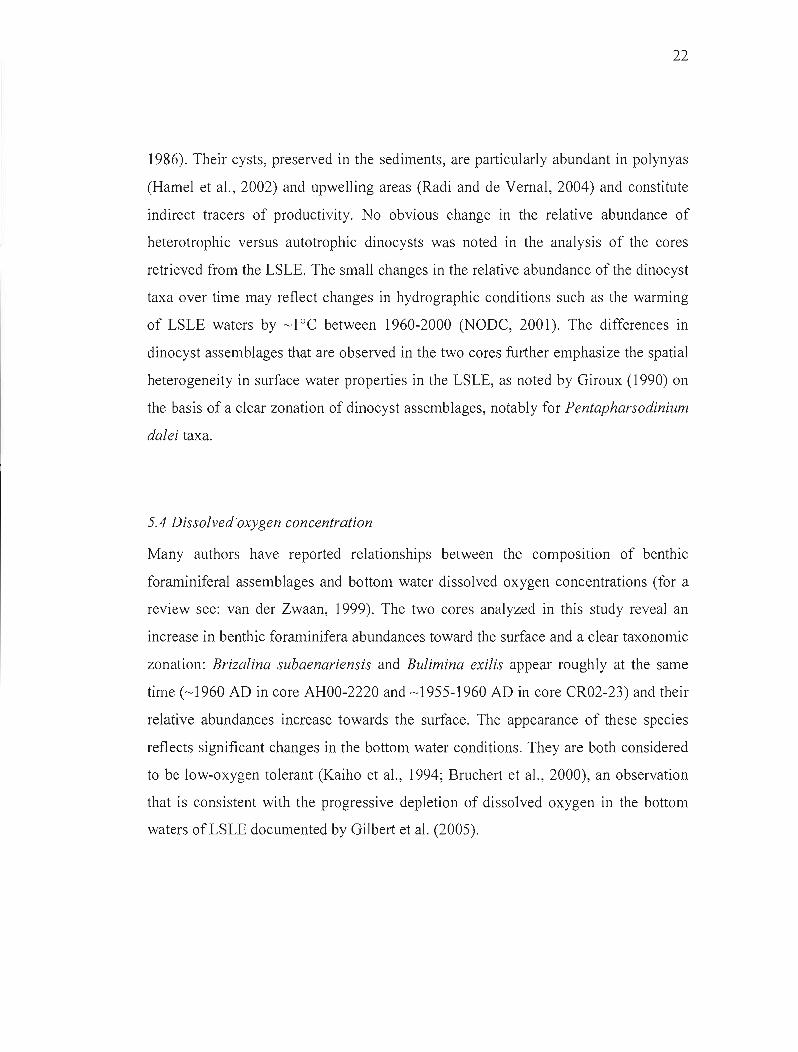
5.4 Dissolvedoxygen concentration
Many authors have reported relationships between the composition of benthic
foraminiferal assemblages and bottom water dissolved oxygen concentrations (for a
review see: van der Zwaan, 1999). The two cores analyzed in this study reveal an
increase in benthic foraminifera abundances toward the surface and a clear taxonomie
zonation: Brizalina subaenariensis and Bulimina exilis appear roughly at the same
time (~1960 AD in core AHOO-2220 and ~ 1955-1960 AD in core CR02-23) and their
relative abundances increase towards the surface. The appearance of these species
reflects significant changes in the bottom water conditions. They are both considered
to be low-oxygen tolerant (Kaiho et al., 1994; Bruchert et al., 2000), an observation
that is consistent with the progressive depletion of disso1ved oxygen in the bottom
waters of LSLE documented by Gilbert et al. (200S).
23
6. Conclusions
Micropaleontological and geochemical analyses of sediment cores collected in the
Lower St. Lawrence Estuary provide consistent evidence for a significant change in
environmental conditions over the last decades. These inc1ude:
Ca) Recent increase of the organic matter flux to the sediment, as reflected by their
organic carbon content and accumulation rate as well as by the abundance of benthic
foraminifera whose proliferation is dependent upon the organic carbon supply to the
sea floor.
Cb) Increased marine biogenic productivity over the last 3 decades, as indicated by the
isotopie signature of the preserved OC and the increased accumulation rate of
dinoflagellate cysts.
Cc) Depletion of dissolved oxygen in the bottom waters, as revealed by the occurrence
of low-oxygen tolerant foraminifera Brizalina subaenariensis and Bulimina exi/is.
These observations are consistent with the hypothesis that a recent eutrophication in
the Lower St. Lawrence Estuary may, at least in part, be responsible for the
progressive depletion of dissolved oxygen concentrations in the bottom waters.
Nevertheless, the spatial extent of this eutrophication signal within the Estuary and
Gulf of St. Lawrence and the origins of the increased primary productivity remain to
be addressed.
7. Acknowledgement
We are grateful to B. Ghaleb for the Pb210 and CS l3? analyses, A. Adamowicz and 1.F
Kielt for the carbon and stable isotope measurements, as weil as 1. Leduc and V.
Loucheur for the micropaleontological analyses. Comments by two anonymous
reviewers improved the manuscript. This work was funded by a Fonds de Recherche
sur la Nature et les Technologies (NATEQ) Team grant and by the Natural Sciences
24
and Engineering Research Council of Canada (NSERC) through Discovery and MFA
grants to A. de Vernal. and A. Mucci.
25
References
Altenbach, AV., 1988. Deep sea benthic foraminifera and flux rate of organic
carbon. Revue de Paléobiologie 2, 719-720.
Altenbach, AV., 1992. Short-term processes and patterns ln the foraminiferal
response to organic flux rates. Marine Micropaleontology 19, 119-129.
Benoit, P., Gratton, Y. and Mucci, A, 2006. Modeling of dissolved oxygen levels in
the bottom waters or the Lower St. Lawrence Estuary: coupling of benthic and
pelagie processes. Marine Chemistry (in press)
Bernhard, J.M., Gupta, B.K.S. and Born, P.F., 1997. Benthic foraminiferal proxy to
estimate dysoxic bottom-water oxygen concentrations: Santa Barbara Basin,
US Pacifie continental margin. Journal of Foraminiferal Research 27, 301
310.
Bourgault, D. and Koutinonsky, V., 1999. Real-time monitoring of the freshwater
discharge at the head of the St. Lawrence Estuary. Atmosphere-Ocean 37,
203-220.
Bratton, J.F., Colman, S.M. and Seal II, R.R., 2003. Eutrophication and carbon
sources in Chesapeake Bay over the last 2700 yr: Human impact in context.
Geochimica et Cosmochimica Acta 67, 3385-3402.
Bruchert, V., Perez, M. E. and Lange, C. B., 2000. Coupled primary production,
benthic foraminiferal assemblage, and sulfur diagenesis in organic-rich
sediments of the Benguela upwelling system. Marine Geology 163,27-40.
Cloern, lE., 2001. Our evolving conceptual model of the coastal eutrophication
problem. Marine Ecology-Progress Series 210, 223-253.
Colman, S.M., and Bratton, J.F., 2003, Anthropogenically induced changes !il
sediment and biogenic silica fluxes in Chesapeake Bay. Geology 31, 71-74.
Coplen, T.B., 1995. Discontinuance of Smow and Pdb. Nature 375, 285-285.
Dale, B., 1996. Dinoflagellate cyst ecology: modeling and geological applications. In:
Palynology: principles and applications; American Association of
26
Stratigraphic Palynologist Foundation. 1. Jansonius and D. C. McGregor
(eds.) 3, 1249-1275.
Dale, B., 2001. The sedimentary record of dinoflagellate cysts: looking back into the
future of phytoplankton blooms. Scientia Marina 65, 257-272.
Dale, B. and Fjellsâ, A., 1994. Dinoflagellate cysts as paleoproductivity indicators:
state of the art, potential and limits. In: Carbon cycling in the glacial ocean:
constraint on the ocean's role in the global change. Zahn, R., Pedersen, T. F.,
Kaminski, M. A., and Labeyrie, L., eds. Springer-Verlag, Berlin, 521-537pp.
de Vernal, A., Larouche, A. and Richard, P.J.H., 1987. Evaluation of palynomorph
concentrations: do the aliquot and the marker-grain method yield comparable
results? Pollen et spores 29, 291-303.
de Vernal, A., Bilodeau, G., Hillaire-Marcel, C. and Kassou, N., 1992. Quantitative
assessment of carbonate dissolution in marine-sediments from foraminifer
linings vs shell ratios - Davis Strait, Northwest North-Atlantic. Geology 20,
527-530.
de Vernal, A., Henry, M. and Bilodeau, G., 1999. Techniques de préparation et
d'analyse en micropaléontologie. Les Cahiers du GEüTüP, 28pp.
Deschamps, P., 1997. Modélisation des profils (238Th/ 232Th) dans les sédiments
estuariens et marins: Application au système du Saint-Laurent. M.Sc. Thesis.
Science de la Terre, Université du Québec à Montréal, 80pp.
Devillers, R. and de Vernal, A., 2000. Distribution of dinoflagellate cysts in surface
sediments of the northern North Atlantic in relation to nutrient content and
productivity in surface waters. Marine Geology 166, 103-124.
Diaz, RJ. and Rosenberg, R., 1995. Marine benthic hypoxia: a reVlew of its
ecological effects and the behavioural responses of benthic macrofauna.
üceanography and Marine Biology Annual Review 33, 245-303.
Dickie, L. and Trites, L.M., (1983). The Gulf of St. Lawrence. In: Estuaries and
enclosed seas. B. H. Ketchum (ed.). Amsterdam, The Netherlands, Elsevier,
403-425.
27
Edenborn, H.M., Mucci, A, Belzile, N., Lebel, 1., Silverberg, N. and Sundby, B.,
1986. A glove box for the fine-scale subsampling of sediments box-cores.
Sedimentology 33,147-150.
EI-Sabh, M.I., Silverberg, N., (ed.), 1990. Oceanography of a large-scale estuarine
system: the St. Lawrence. Springer-Verlag, Berlin (Coastal and estuarine
studies, 39),434 pp.
Flynn, W.W., 1968. The determination of low levels of polonium-210 10
environmental materials. Analytica Chimica Acta 43,221-227.
Gilbert, D., Sundby, B., Gobeil, C., Mucci, A and Tremblay, G.-H., 2005. A seventy
two year record of diminishing deep-water oxygen in the St. Lawrence
estuary: The northwest Atlantic connection. Limnology and Oceanography
50, 1654-1666.
Giroux, L., 1990. Distribution moderne des palynomorphes dans l'estuaire et le golfe
du Saint-Laurent. M.Sc. Thesis. Sciences de la Terre, Université du Québec à
Montréal, 158pp.
Gooday, Al, 1986. Meiofaunal foraminiferans from the bathyal Porcupine Seabight
(northest Atlantic): size structure, standing stock, taxonomic composition,
species diversity and vertical distribution in the sediment. Deep-Sea Research
33,1345-1373.
Gooday, AJ., 1988. A response by benthic foraminifera to the deposition of
phytodetritus in the deep sea. Nature 332, 70-73.
Gooday, AJ., 1994. The biology of deep-sea foraminifera: a reVlew of sorne
advances and their applications in paleoceanography. Palaios 9, 14-31.
Gray, 1.S., Wu, R.S. and Or, Y.Y., 2002. Effects of hypoxia and organic enrichment
on the coastal marine environment. Marine Ecology Progress Series 238,249
279.
Hamel, D., de Vernal, A., Gosselin, M. and Hillaire-Marcel, C., 2002. Organic-walled
microfossils and geochemical tracers: sedimentary indicators of productivity
28
changes in the North Water and northern Baffin Bay during the last centuries.
Deep-Sea Research Part II-Topical Studies in Oceanography 49, 5277-5295.
Jacobson, D.M. and Anderson, D.M., 1986. Thecate heterotrophic dinoflagellates:
feeding behavior and mechanisms. Journal of Phycology 22, 249-258.
Jennane, A, 1992. Application de la méthode du Plomb-21 0 dans l'estuaire et le golfe
du St-Laurent. M.Sc. Thesis. Science de la Terre, Université du Québec à
Montréal, pp.85.
Jouanneau, lM., Castaing, P., Grousset, F., Buat-Menard, P. and Pedemay, P., 1999.
Recording and chronology of a cadmium contamination by Cs-137 in the
Gironde estuary (SW France). Comptes rendus de l'académie des sciences
série II fascicule a-Sciences de la terre et des planètes 329,265-270.
Karlsen, A W., Cronin, T.M., Ishman, S.E., Willard, D.A, Kerhin, R., Holmes,
C.W., and Marot, M., 2000. Historical Trends in Chesapeake Bay Dissolved
Oxygen Based on Benthic Foraminifera from Sediment Cores. Estuaries 23, 4,
488-508.
Kaiho, K., 1994. Benthic foraminiferal dissolved-oxygen index and dissolved-oxygen
Levels in the modern ocean. Geology 22, 719-722.
Leduc, l, Bilodeau, G., de Vernal, A and Mucci, A, 2002. Distribution of benthic
foraminiferal populations in surface sediments of the Saguenay Fjord, before
and after the 1996 flood. Palaeogeography Palaeoclimatology Palaeoecology,
180,207-223.
Lee, J.1., 1974. Towards understanding the niche of foraminifera. In: Foraminifera. R.
H. Hedley and G. M. Adams (eds.), 207-260.
Livingston, R.1., 2000. Eutrophication processes In coastal systems: Origin &
succession of plankton blooms & effects on secondary production in gulf
coast estuaries, Lewis Publishers, 352pp.
Loubere, P., 1991. Deep-sea benthic foraminiferal assemblage response to a surface
ocean productivity gradient: a test. Palaeogeography 6, 193-204.

29
Loubere, P. and Fariduddin, M., 1999. Quantitative estimation of global patterns of
surface ocean biological productivity and its seasonal variation on timescales
from centuries to milleill1ia. Global Biogeochemical Cycles 13, 115-133.
Mackensen, A., Fütterer, D.K., Grobe, H. and Schmiedl, G., 1993. Benthic
foraminiferal assemblages from the eastern South Atlantic Polar Front region
between 35 and 57°S: distribution, ecology and fossilization potential. Marine
Micropaleontology 22, 33-69.
Matthews, J., 1969. The assessment of a method for the determination of absolute
pollen frequency. New Phytologist 68, 161-166.
McKay, J.L., Pedersen, T.F. and Kienast, S.S., 2004. Organic carbon accumulation
over the last 16kyr off Vancouver Island, Canada: evidence for increased
marine productivity during the deglacial. Quaternary Science Reviews 23,
261-281.
Meyers, P.A., 1994. Preservation of elemental and isotopie source identification of
sedimentary organic matter. Chemical Geology 144,289-302.
Mook, W.G. and Koene, B.K.S., 1975. Chemistry of dissolved inorganic carbon in
estuarine and coastal brackish water. Estuarine and Coastal Marine Sciences
3,325-336.
NODe. 2001. World Ocean Atlas. National Oceanographie Center, National
Oceanic and Atmospheric Administration: Boulder, CO, CD-Rom data Sets.
Osterman, L.E., 2003, Benthic foraminifers from the continental shelf and slope of
the Gulf of Mexico: an indicator of shelf hypoxia. Estuarine, Coastal and
Shelf Sciences 58, 17-35.
Parson, T.R., Takahashi, M. and Hargrave, B., 1984. Biological Oceanic Processes.
New York, Pergamon Press, 330pp.
Pedersen, T.F., 1983. Increased productivity in the eastern equatorial Pacifie during
the Last Glacial Maximum (19,000-14,000 yr B.P). Geology Il, 16-19.
Petrie, B., Drinkwater, K., Sandstrom, A., Pettipas, R., Gregory, D., Gilbert D. and
Sekhon P., 1996. Temperature, salinity and sigma-t atlas for the Gulf of St.

30
Lawrence. Canadian Technical Report of Hydrography and Ocean Sciences
178, 256pp.
Platon, E., Gupta B.K.S., Rabalais, N.N. and Tuner R.E., 2005. Effect of seasonal
hypoxia on the benthic foraminiferal community of the Louisiana inner
continental shelf: The 20lh century record. Marine Micropaleontology 54, 263
283.
Pospelova, V., Chmura, G.L., Boothman, W.S. and Latimer, 1.S., 2002.
Dinoflagellates cysts record and human disturbance in two neighboring
estuaries, new Bedford Harbor and Apponagansett Bay, Massachusetts
(USA). The Science of the Total Environment 298, 81-102.
Rabalais, N.N., Turner, R.E. and Wiseman Jr, W.J., 2001. Hypoxia in the Gulf of
Mexico. Journal ofEnvironmental Quality 33, 320-329.
Radi, T. and de Vernal, A, 2004. Dinocyst distribution in surface sediments from the
northeastern Pacifie margin (40-60 degrees N) in relation to hydrographie
conditions, productivity and upwelling. Review of Palaeobotany and
Palynology, 128, 169-193.
Rochon, A, de Vernal, A, Turon, l-L., Matthiessen, 1. and Head, M.J., 1999.
Distribution of recent dinoflagellate cysts in surface sediments from the North
Atlantic ocean and adjacent seas in relation to sea-surface parameters.
American Association of Stratigraphie Palynologist Foundation 35, 140pp.
Rodrigues, c.G., 1980. Holocene microfauna and paleoceanography of the Gulf of St.
Lawrence. Ph.D. Thesis. Carleton University, 352pp.
Sretre, M.M.L., Dale, B., Abdullah, M.I. and Sretre, G.P.O., 1997. Dinoflagellate
cysts as potential indicators of industrial pollution in a Norwegian fjord.
Marine Environmental. Research 44, 167-189.
Sangiorgi, F. and Donders, T.H., 2004. Reconstructing 150 years of eutrophication in
the north-western Adriatic Sea (Italy) using dinoflagellate cysts, pollen and
spores. Estuarine, Coastal and Shelf Sciences 60, 69-79.
31
Sarnthein, M., Winn, K., Duplessy, J.C. and Fontugne, M.R., 1988. Global variations
of surface water productivity in low and mid latitudes: Influence on CO2
reservoirs of the deep ocean and atmosphere during the last 21,000 years.
Palaeogeography 3, 361-399.
Sen Gupta, B.K., Turner, R.E. and Rabalais, N.N., 1996. Seasonnal oxygen depletion
in continental-shelf waters of Louisiana: Historical record of benthic
foraminifers. Geology 24, 227-230.
Silverberg, N., Nguyen, RV., Delibrias, G., Koide, M., Sundby, B., Yokoyama, Y.
and Chesselet, R., 1986. Radionuclide profiles, sedimentation rates, and
bioturbation in modern sediment of the Laurentian Trough, Gulf of St.
Lawrence. Oceanologica Acta 9,285-299.
Smith, J.N. and Schafer, c.T., 1999. Sedimentation, bioturbation, and Hg uptake in
the sediments of the estuary and Gulf of St. Lawrence. Limnology and
Oceanography 44, 207-219.
St-Onge, G., Stoner, J.S. and Hillaire-Marcel, C., 2003. Holocene paleomagnetic
records from the St. Lawrence Estuary, eastern Canada: centennial- to
millennial-scale geomagnetic modulation of cosmogenic isotopes. Emih and
Planetary Science Letters 209, 113-130.
Struck, u., Emeis, K.-C., Voss, M., Christiansen, C. and Kunzendorf, H., 2000.
Records of southern and central Baltic Sea eutrophication in Ol3C and ol5N of
sedimentary organic matter. Marine Geology 164, 157-171.
Thibodeau, B., 2005. Augmentation récente de la productivité primaire dans l'estuaire
maritime du Saint-Laurent: évidences micropaléontologiques et
géochimiques. MSc Thesis. Sciences de la Terre, Université du Québec à
Montréal, 51 pp.
Thorsen, T.A. and Dale, B., 1997. Dinoflagellate cysts as indicators of pollution and
past climate in a Norwegian fjord. Holocene 4, 433-446.
Turner, R.E., Rabalais, N.N., 1994. Coastal eutrophication near Mississippi River
Delta. Nature 368, 619-216.

- -------------
32
Van der Zwaan, G.J., Duijnstee, LA.P., den Dulk M., Ernst, S.R., Jannink, N.T., and
Kouwenhoven, T. 1., 1999. Benthic foraminifers: proxies or problems? A
review of paleocological concepts. Ealih-Science Reviews 46, 213-236.
Verardo, S., 1999. Dinoflagellates, in Cronin, T., Wagner, R., and Slattery, M., eds.,
Microfossils from Chesapeake Bay sediments - illustrations and species
database: United States Geologica1 Survey Open-File Report 99-145, 159pp.
Verhallen, P.J.M., 1991. Late Pleistocene to early Pleistocene Mediterranean mud
dwelling foraminifera, influence of a changing environment on community
structure and evolution. Utrecht Micropaleontology Bulletin 40, 1-219.
Voss, M., Larsen, B., Leivuori, M. and Vallius, H., 2000. Stable isotope signaIs of
eutrophication in Ba1tic Sea sediments. Journal of Marine Systems 25, 287
298.
Westerhausen, L., Poynter, 1., Eglinton, G., Erlenkeuser, H. and Sarnthein, M., 1993.
Marine and terrigenous origin of organic-matter in modern sediments of the
equatorial east Atlantic - the delta-C-13 and molecular record. Deep-Sea
Research Part I-Oceanographic Research Papers 40, 1087-1121.
Zhang, D.C., 2000. Fluxes of short-lived radioisotopes in the marginal marine basins
of eastern Canada. Ph.D. Thesis. Environmenta1 Sciences, Université du
Québec à Montréal, 193pp.
Zimmerman, AR., and Canuel, E.A, 2000. A geochemical record of eutrophication
and anoxia in Chesapeake Bay sediments: anthropogenic influence on organic
matter composition. Marine Chemistry 69, 117-137.
Zonneveld, K.AT, and Brummer, G. A, 2000. Eco10gical significance, transport and
preservation of organic walled dinoflagellate cysts in the Somali Basin, NW
Arabian Sea. Deep-Sea Research II 9, 2229-2256.

33
t.r"<> "'~ . O;y \ , ~
CANADA ~ ~ ~
~'----U-N-IT-E-D-STATES~ot"~~' __
- p ~
200 ' Gulf of 'SI, Lawrence
Figure l, Map showing the Lower St Lawrence Estuary and the location of the
coring sites. The bathymetric contour represents 200 meters. Dots represent coring
sites and stars represent largest nearby cities.
34
Population (M)
3 4 5 6 8 1 1 1 1 1
2000 .: ... -_ ..
-.::. 1990
<Il ..... (0 (j) >. ..... (0 \J
1980
1970 -_.;;;--
c (j)
ro 1960 0
1950
1940
1930 140 120 100 80 60 40
02 (umol/I)
300 350 400 450 500 550 Fertilizer Sold (kT)
Figure 2. Quebec population growth (thin line), local fertilizer purchases (dotted line)
and DO content of the LSLE bottom waters (bold line) since 1930 (Statistics Canada,
Fertilizer Trade, Catalogue 46, 207; Quebec manufacturers association report, 2001;
Gilbert et al., 2005).

35
ChronologyLn (Lead-210 excess) Cesium-13l (dpm/g) 0 0 0 0 0 0 0
veoN(O g~~8;~~d!; ci 6 ~.....: NN~~,-~~~o 0.5 1.5 2
o +-.-10......................""'\:1'.'*'f ~-~_·-r·····i-·+-·-·\
Biological mixing ~
•5 .J-------,T",c-'. ~
. ,:"i ;1980 10cm10 ," .. '
.r: 15 .... "
..... . ..... • -1963:~Cspeak
20 · +---20cm ../ · -1960
.. , . .... ..
25 ../' t.:"
./ ",
30 ,'/' Sedimentation rate , -050cm/yr, R=0.95
Depth (cm)
Figure 3. Excess lead-210 (ln) as a function of depth in core AHOO-2220. Squares
represent samples from the bioturbated zone, not taken into account in the
sedimentation rate calculation. The dotted line is the linear regression used to derive
the sedimentation rates. Cesium-137 activities as a function of depth in core AHOO
2220 are also shown as weIl as the age model for box core AH-2220 as a function of
depth based on lead-210 (line) and cesium-137 (dot).
36
O'
Ê 20 ~
5 a. ~ ,030 ' __~===~ 0 500 1000 1500
40 Dinocyst flux
(dinocysis/cm' 'yr)
50
2000 4000 6000 o 0.05 0.1 015 0.2 o 10 20 30 40 50 60 70 a Dinocyst
concentration (dinocyslslg)
Dinocyst on pollen ratio
Figure 4. Dinoflagellate concentration (cysts/g), cyst AR (cysts/cm2.yr),
dinocystpollen ratio and percentages of most abundant taxa as a function of depth in
core AHOO-2220. The bold and dotted curves correspond to 5-point runnmg means
for concentration and AR, respectively.
37
r---,10 15 0 200 400
t'~--Foraminiferal AR Organic linings AR t:::::=::-._.~_.
(teslsicm"yr) (organic hnings/cm '-yr) f= }40 ~..'-..b~- oZt ~ -250
o 10 20 30 40 o 50 100 0 30 60 0 10 20 30 0 10 20 30
ForamlniferaJ Globobu/imma BnzaJina Btl#mina Bulim;nB concentlalion auricu/ala subaenariensis exilis marginara
(Ieslslg)
Figure 5. Benthic foraminifera concentration (tests/g), AR (tests/cm2.yr), orgamc
lining AR (OL/cm2.yr) and percentages of most abundant taxa as a function of depth
in core AHOO-2220. The bold and dotted curves correspond to 5-point running means
for concentration and AR, respectively.
o.
10
~ 20 ~---j';P"'-----------;;::;>o!b-_-----=-===F==-------rÊ
S .c 15.
r--T"..!.~_Cl" 30
0.01 0.02 003 Organic carbon MAR
(gC/cm "yr) 40·
,50 1 1.2 14 1.6 11 12 13 14 15 ·254 -25 -24.6 -24.2 -23.8
OC(%) C/N Ô"C (0/00)
Figure 6. Organic carbon (OC) content, CorgiN ratio, Ol3C of organic carbon and
MAR of organic carbon as a function of depth in core AHOO-2220. The bold and
dotted curves correspond to 5-point running means for concentration and MAR,
respectively.

38
Ln (Lead-210 excess)
o 'r-'......;......._......;...............,
2 Biological mixing
4 // /'
•........ 6 ..../.,
.,...../ " //;. ......
,/,..,/ Sedimentation rate / -0.42cm/yr, R=O.96
12 Depth (cm)
Figure 7. Excess lead-210 (ln) as a function of depth in core CR02-23. Squares
represent samples from the bioturbated zone, not taken into account in the
sedimentation rate calculation. The dotted line is the linear regression used to
compute the sedimentation rate.
39
-'.~~
~ !
P h' ; ri
;
10
-~
.._:~-====:::....-=--_._.. _._._-,~~Jr_
~ 1_~80 ._._._._._.._-:="
Ê 20!:3 . .c: iS. ID o 30
~---- \. ~_. __.__._ .._- '(-
'-'-- -, > .::>
;.-------1 m m_,:~=-> ,> l f
, -1960
1>
40 . ~ ....... ;----------=-'/
========3'\/ \ ) ~ ~
i' ~
50 L 1. -----'-- '-_
1000 2000 3000 o 10 0 10 20 30 40 50 60 70 80 0 10 20 30 0 10 0 5 0 0 0
Dinocysl concentration (cysls/g)
Figure 8. Dinoflagellate cyst concentration (cysts/g) and percentages of most
abundant taxa as a function of depth in core CRü2-23. The bold line represents a 5
point running mean.

40
7' -1980
;~-=-~~--1960
"" ,-Ci. Q)
o 30
.._..... _..._ ..._-..]'
20 40 60 80
Bulimina marginata
Figure 9. Benthic foraminifera concentration (tests/g), orgamc lining (OL)
concentration (OL/g) and percentages of most abundant taxa as a function of depth in
core CR02-23, Bold lines represent 5-point running means.
0
10
Ê ~ 20 .r:: 0Ol 0
30
40
1.3 1.5 1.7 1.9 11 12 13 14 15 16 -25 -24.5 -24 -23.5
OC(%) C/N S'3C (%0)
Figure 10. Organic carbon (OC) content, Corg/N ratio, and olJC of organic carbon as
a function of depth in core CR02-23. Bold lines represent 5-point running means.
CONCLUSION�
En résumé, notre étude sur des sédiments de l'EMSL met en évidence des
changements environnementaux significatifs depuis les dernières décennies, en
particulier:
Ca) Une augmentation récente des accumulations de matière organique mesurée par la
teneur en carbone organique ainsi que par les foraminifères benthiques qui dépendent
des apports de matière organique.
Cb) Une augmentation de la productivité primaire au cours des dernières décennies
telle qu'indiqué par la signature isotopique de la matière organique et par
l'augmentation du taux d'accumulation des kystes de dinoflagellés.
Cc) Une diminution des concentrations en oxygène dissous à l'interface eau-sédiment
telle qu'indiquée par l'apparition et la prolifération des espèces de foraminifères
benthiques Brizalina subaneriensis et Bulimina exilis.
Cette étude tend donc à démontrer une tendance récente vers une eutrophisation dans
l'estuaire du Saint-Laurent, résultant en une importante modification des conditions
d'oxygénation à l'interface eau-sédiment. Il devient donc très important de suivre
l'évolution de cette masse d'eau car le niveau d'oxygénation devient alarmant pour
l'écosystème du Saint-Laurent. Une étude plus approfondie de l'origine et de
l'étendue spatio-temporelle de l'hypoxie et de l'eutrophisation dans l'estuaire et le
Golfe est nécessaire pour pouvoir préparé un plan de revalorisation de la zone
touchée. Il serait aussi avisé d'étudier la dynamique des différents nutriments qui
pourraient être la cause de l'eutrophisation, comme l'azote.