Embed Size (px)
Citation preview
Page 1 of 1
AUGUST 18, 2020 AGENDA ITEM 2 INFORMATION ITEM CALIFORNIA ABLE ACT BOARD
Executive Director’s Report Background
The Executive Director’s Report includes an overview on the following items:
Strategic Planning Consultant Services Update
NAST Conference Update
Budget Overview
Outreach/Marketing
Financial Literacy
Account Holder Survey Presenter: Dante Allen, Executive Director, California ABLE Act Board
Executive Director’s Report 1 August 18, 2020
CALIFORNIA ABLE ACT BOARD
EXECUTIVE DIRECTOR’S REPORT
AUGUST 18, 2020
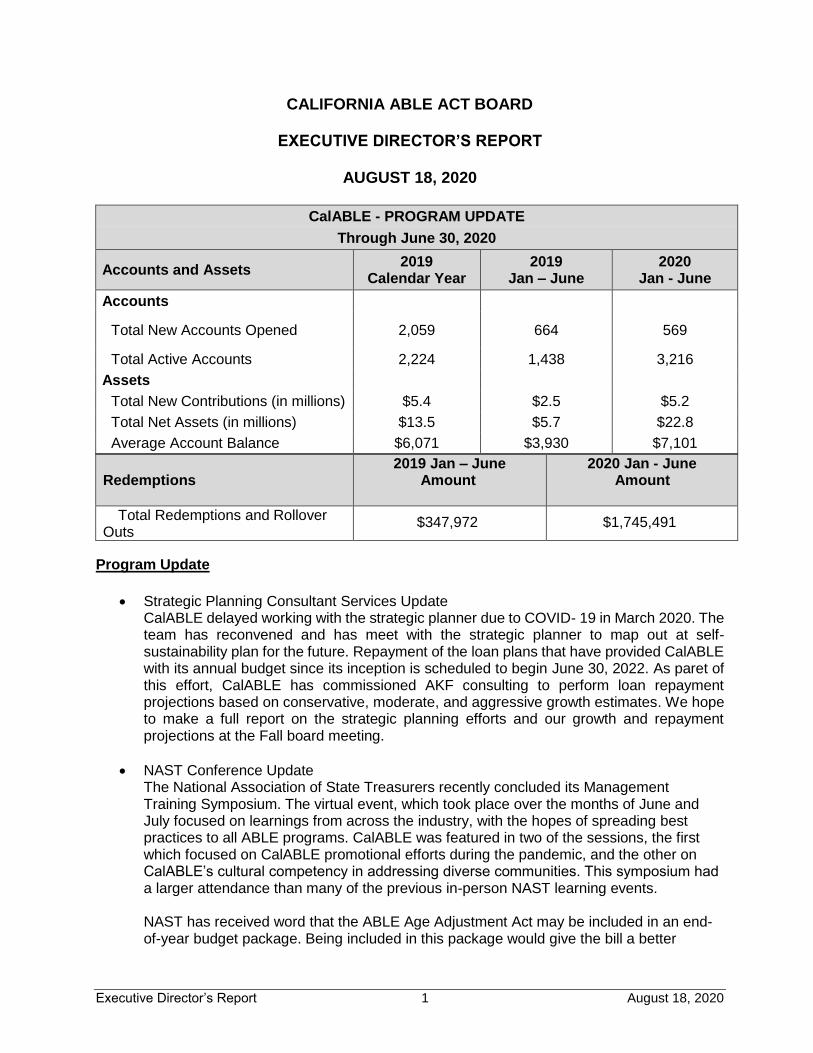
CalABLE - PROGRAM UPDATE
Through June 30, 2020
Accounts and Assets 2019
Calendar Year 2019
Jan – June 2020
Jan - June
Accounts
Total New Accounts Opened 2,059 664 569
Total Active Accounts 2,224 1,438 3,216
Assets
Total New Contributions (in millions) $5.4 $2.5 $5.2
Total Net Assets (in millions) $13.5 $5.7 $22.8
Average Account Balance $6,071 $3,930 $7,101
Redemptions 2019 Jan – June
Amount
2020 Jan - June
Amount
Total Redemptions and Rollover Outs
$347,972 $1,745,491
Program Update
Strategic Planning Consultant Services Update CalABLE delayed working with the strategic planner due to COVID- 19 in March 2020. The team has reconvened and has meet with the strategic planner to map out at self-sustainability plan for the future. Repayment of the loan plans that have provided CalABLE with its annual budget since its inception is scheduled to begin June 30, 2022. As paret of this effort, CalABLE has commissioned AKF consulting to perform loan repayment projections based on conservative, moderate, and aggressive growth estimates. We hope to make a full report on the strategic planning efforts and our growth and repayment projections at the Fall board meeting.
NAST Conference Update The National Association of State Treasurers recently concluded its Management Training Symposium. The virtual event, which took place over the months of June and July focused on learnings from across the industry, with the hopes of spreading best practices to all ABLE programs. CalABLE was featured in two of the sessions, the first which focused on CalABLE promotional efforts during the pandemic, and the other on CalABLE’s cultural competency in addressing diverse communities. This symposium had a larger attendance than many of the previous in-person NAST learning events. NAST has received word that the ABLE Age Adjustment Act may be included in an end-of-year budget package. Being included in this package would give the bill a better
Executive Director’s Report 2 August 18, 2020
chance at being passed before year end. Additionally, CalABLE and the STO have reached out to Congressman Antonio Cardenas (D) representing district 29, which includes the San Fernando Valley. We are reaching out to Rep. Cardenas to see if he would be willing to include Age Adjustment Act language into one his bills addressing retirement funding or protection of workers health benefits. These bills might also give the Adjust Act a better chance at being passed in the current congress.
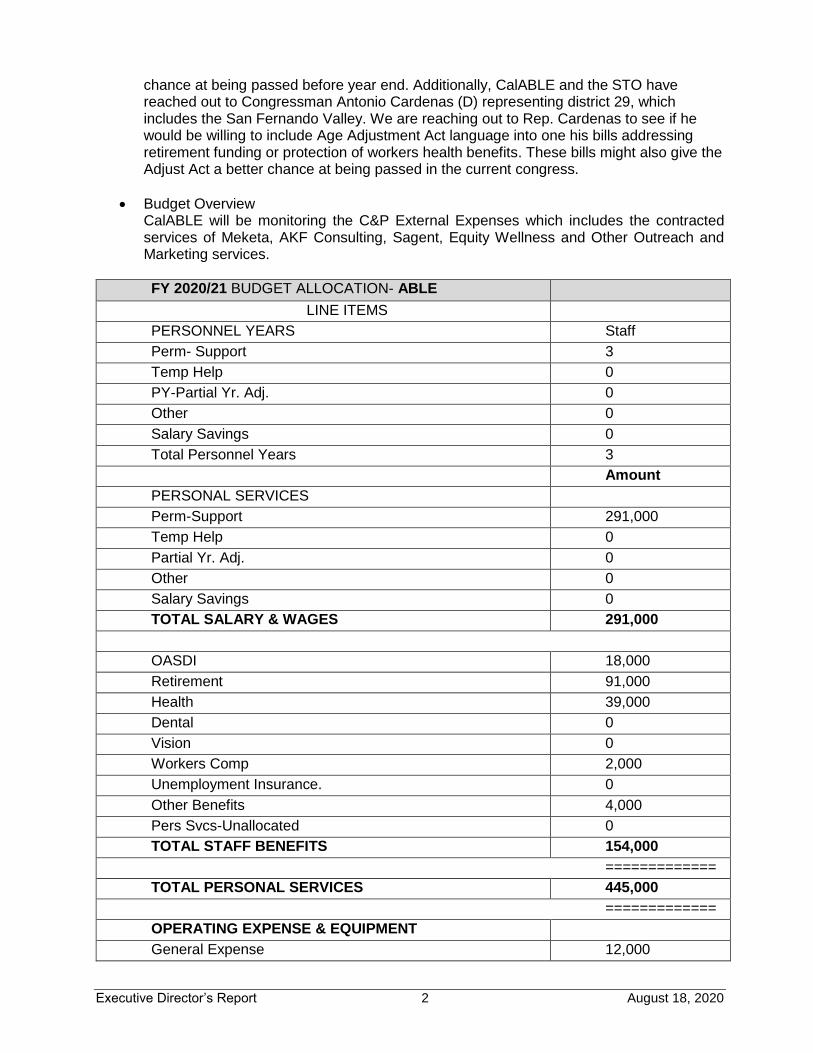
Budget Overview CalABLE will be monitoring the C&P External Expenses which includes the contracted services of Meketa, AKF Consulting, Sagent, Equity Wellness and Other Outreach and Marketing services.
FY 2020/21 BUDGET ALLOCATION- ABLE
LINE ITEMS
PERSONNEL YEARS Staff
Perm- Support 3
Temp Help 0
PY-Partial Yr. Adj. 0
Other 0
Salary Savings 0
Total Personnel Years 3
Amount
PERSONAL SERVICES
Perm-Support 291,000
Temp Help 0
Partial Yr. Adj. 0
Other 0
Salary Savings 0
TOTAL SALARY & WAGES 291,000
OASDI 18,000
Retirement 91,000
Health 39,000
Dental 0
Vision 0
Workers Comp 2,000
Unemployment Insurance. 0
Other Benefits 4,000
Pers Svcs-Unallocated 0
TOTAL STAFF BENEFITS 154,000
=============
TOTAL PERSONAL SERVICES 445,000
=============
OPERATING EXPENSE & EQUIPMENT
General Expense 12,000
Executive Director’s Report 3 August 18, 2020
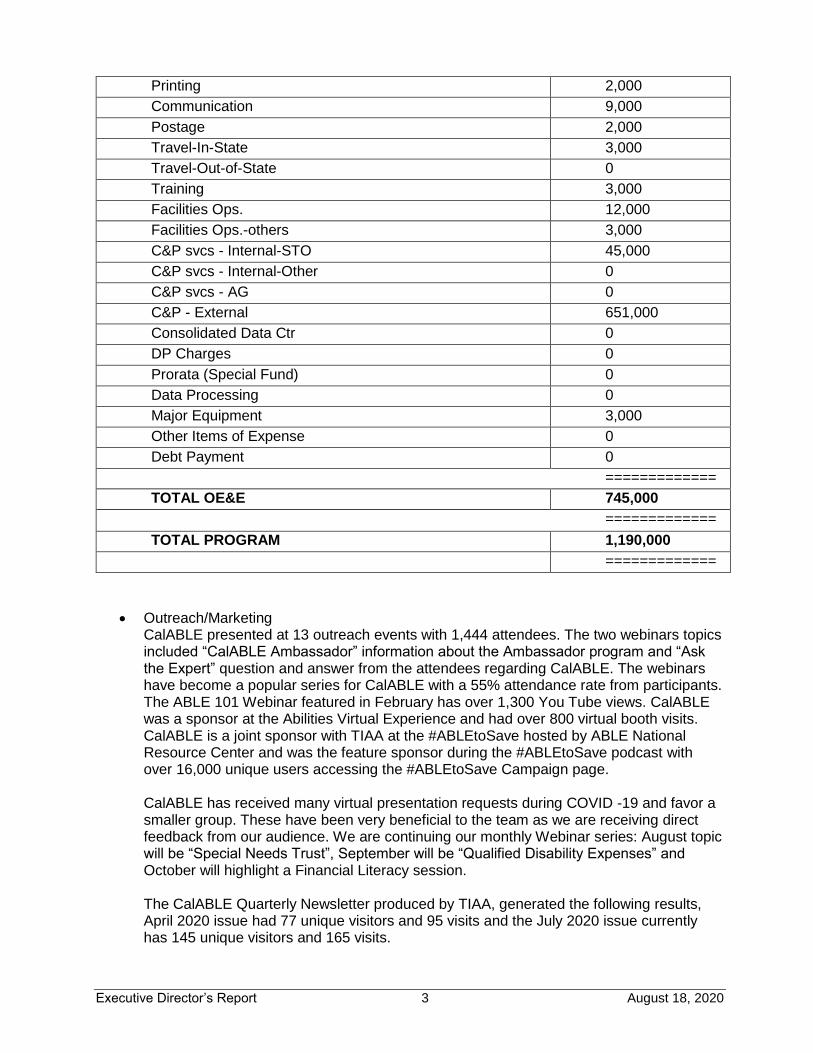
Printing 2,000
Communication 9,000
Postage 2,000
Travel-In-State 3,000
Travel-Out-of-State 0
Training 3,000
Facilities Ops. 12,000
Facilities Ops.-others 3,000
C&P svcs - Internal-STO 45,000
C&P svcs - Internal-Other 0
C&P svcs - AG 0
C&P - External 651,000
Consolidated Data Ctr 0
DP Charges 0
Prorata (Special Fund) 0
Data Processing 0
Major Equipment 3,000
Other Items of Expense 0
Debt Payment 0
=============
TOTAL OE&E 745,000
=============
TOTAL PROGRAM 1,190,000
=============
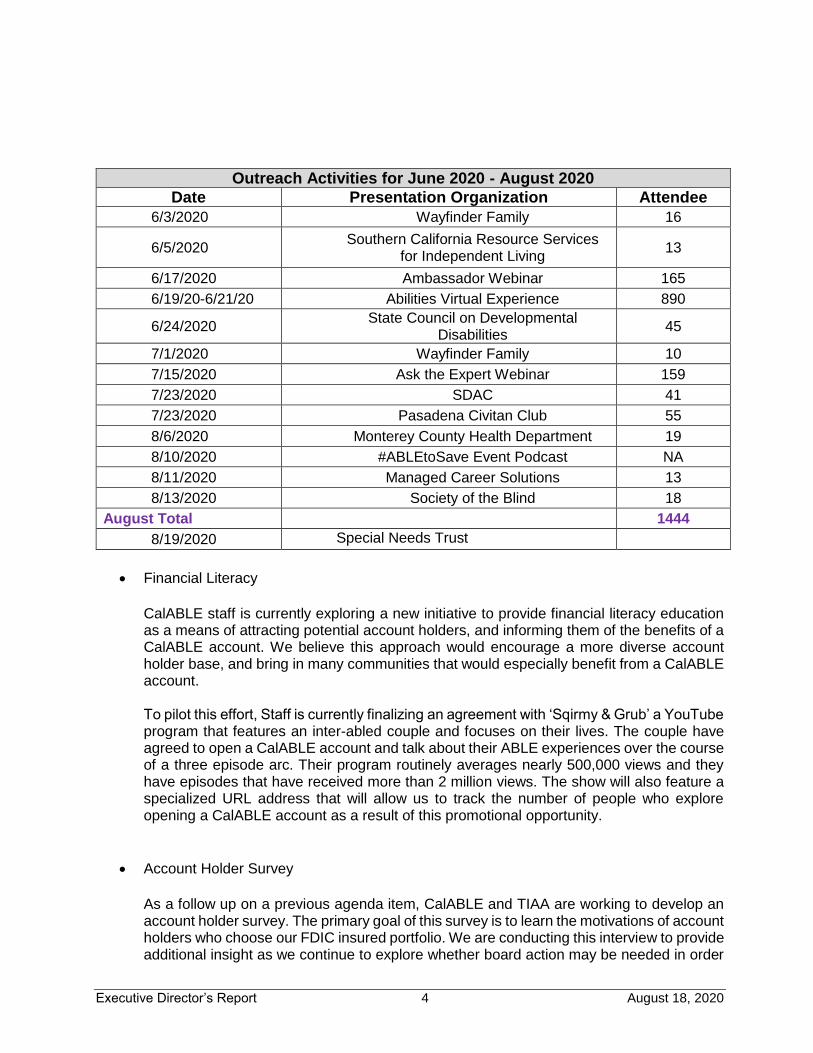
Outreach/Marketing CalABLE presented at 13 outreach events with 1,444 attendees. The two webinars topics included “CalABLE Ambassador” information about the Ambassador program and “Ask the Expert” question and answer from the attendees regarding CalABLE. The webinars have become a popular series for CalABLE with a 55% attendance rate from participants. The ABLE 101 Webinar featured in February has over 1,300 You Tube views. CalABLE was a sponsor at the Abilities Virtual Experience and had over 800 virtual booth visits. CalABLE is a joint sponsor with TIAA at the #ABLEtoSave hosted by ABLE National Resource Center and was the feature sponsor during the #ABLEtoSave podcast with over 16,000 unique users accessing the #ABLEtoSave Campaign page. CalABLE has received many virtual presentation requests during COVID -19 and favor a smaller group. These have been very beneficial to the team as we are receiving direct feedback from our audience. We are continuing our monthly Webinar series: August topic will be “Special Needs Trust”, September will be “Qualified Disability Expenses” and October will highlight a Financial Literacy session. The CalABLE Quarterly Newsletter produced by TIAA, generated the following results, April 2020 issue had 77 unique visitors and 95 visits and the July 2020 issue currently has 145 unique visitors and 165 visits.
Executive Director’s Report 4 August 18, 2020
Outreach Activities for June 2020 - August 2020
Date Presentation Organization Attendee
6/3/2020 Wayfinder Family 16
6/5/2020 Southern California Resource Services
for Independent Living
13
6/17/2020 Ambassador Webinar 165
6/19/20-6/21/20 Abilities Virtual Experience 890
6/24/2020 State Council on Developmental
Disabilities 45
7/1/2020 Wayfinder Family 10
7/15/2020 Ask the Expert Webinar 159
7/23/2020 SDAC 41
7/23/2020 Pasadena Civitan Club 55
8/6/2020 Monterey County Health Department 19
8/10/2020 #ABLEtoSave Event Podcast NA
8/11/2020 Managed Career Solutions 13
8/13/2020 Society of the Blind 18
August Total
1444
8/19/2020 Special Needs Trust
Financial Literacy
CalABLE staff is currently exploring a new initiative to provide financial literacy education as a means of attracting potential account holders, and informing them of the benefits of a CalABLE account. We believe this approach would encourage a more diverse account holder base, and bring in many communities that would especially benefit from a CalABLE account. To pilot this effort, Staff is currently finalizing an agreement with ‘Sqirmy & Grub’ a YouTube program that features an inter-abled couple and focuses on their lives. The couple have agreed to open a CalABLE account and talk about their ABLE experiences over the course of a three episode arc. Their program routinely averages nearly 500,000 views and they have episodes that have received more than 2 million views. The show will also feature a specialized URL address that will allow us to track the number of people who explore opening a CalABLE account as a result of this promotional opportunity.
Account Holder Survey
As a follow up on a previous agenda item, CalABLE and TIAA are working to develop an account holder survey. The primary goal of this survey is to learn the motivations of account holders who choose our FDIC insured portfolio. We are conducting this interview to provide additional insight as we continue to explore whether board action may be needed in order
August 18, 2020
ABLE Landscape Update
2
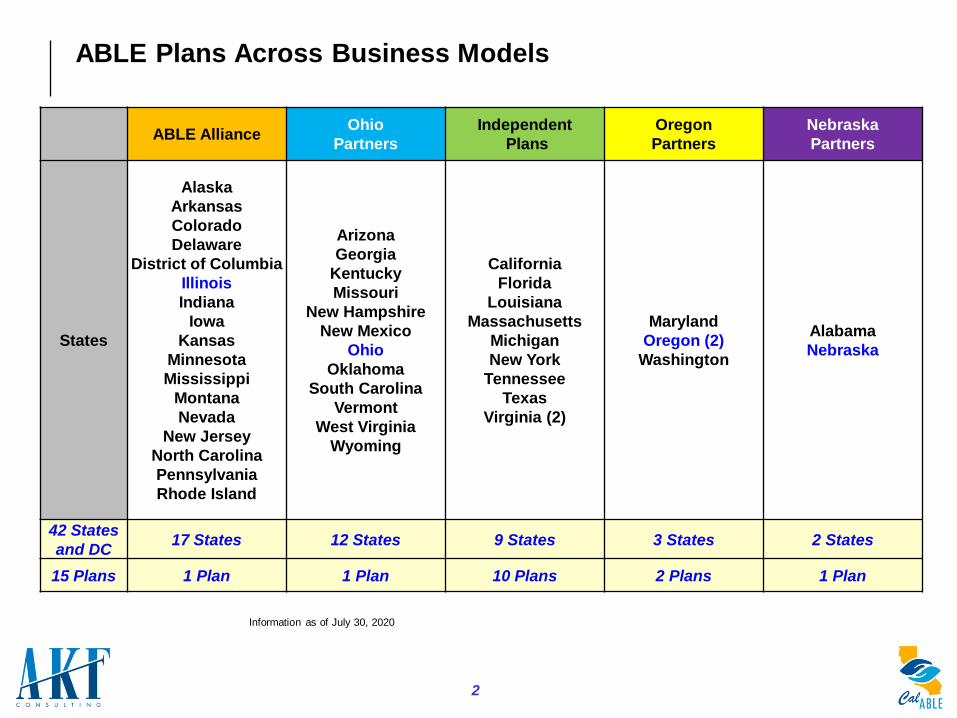
ABLE AllianceOhio
Partners
Independent
Plans
Oregon
Partners
Nebraska
Partners
States
Alaska
Arkansas
Colorado
Delaware
District of Columbia
Illinois
Indiana
Iowa
Kansas
Minnesota
Mississippi
Montana
Nevada
New Jersey
North Carolina
Pennsylvania
Rhode Island
Arizona
Georgia
Kentucky
Missouri
New Hampshire
New Mexico
Ohio
Oklahoma
South Carolina
Vermont
West Virginia
Wyoming
California
Florida
Louisiana
Massachusetts
Michigan
New York
Tennessee
Texas
Virginia (2)
Maryland
Oregon (2)
Washington
Alabama
Nebraska
42 States
and DC17 States 12 States 9 States 3 States 2 States
15 Plans 1 Plan 1 Plan 10 Plans 2 Plans 1 Plan
Information as of July 30, 2020
ABLE Plans Across Business Models
3
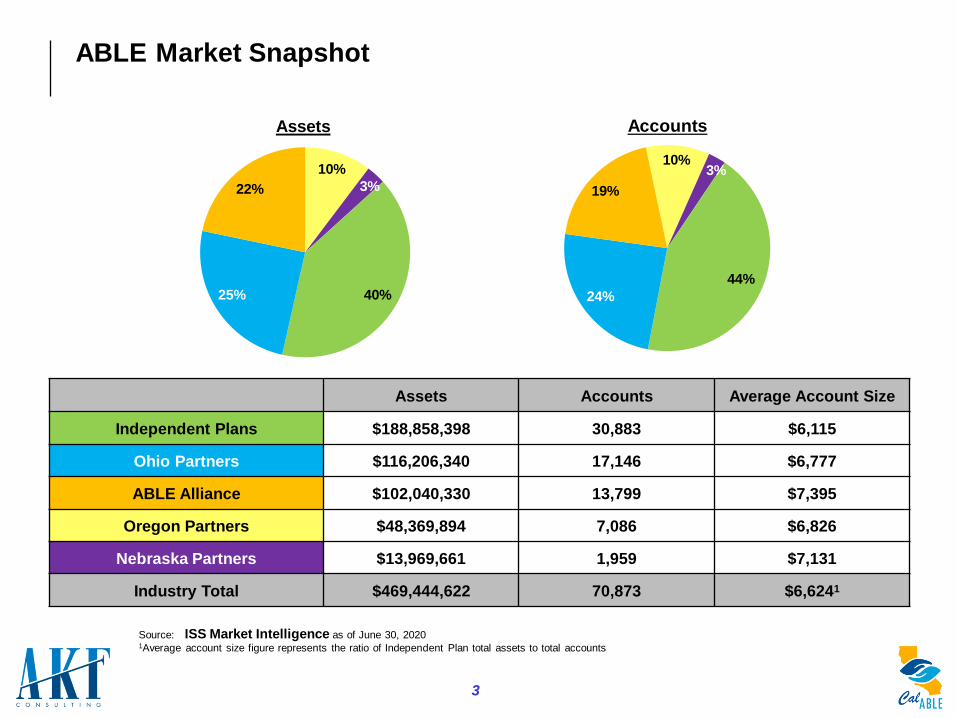
ABLE Market Snapshot
Source: ISS Market Intelligence as of June 30, 20201Average account size figure represents the ratio of Independent Plan total assets to total accounts
Assets Accounts Average Account Size
Independent Plans $188,858,398 30,883 $6,115
Ohio Partners $116,206,340 17,146 $6,777
ABLE Alliance $102,040,330 13,799 $7,395
Oregon Partners $48,369,894 7,086 $6,826
Nebraska Partners $13,969,661 1,959 $7,131
Industry Total $469,444,622 70,873 $6,6241
10%3%
44%
24%
19%
Accounts
10%
3%
40%25%
22%
Assets
4
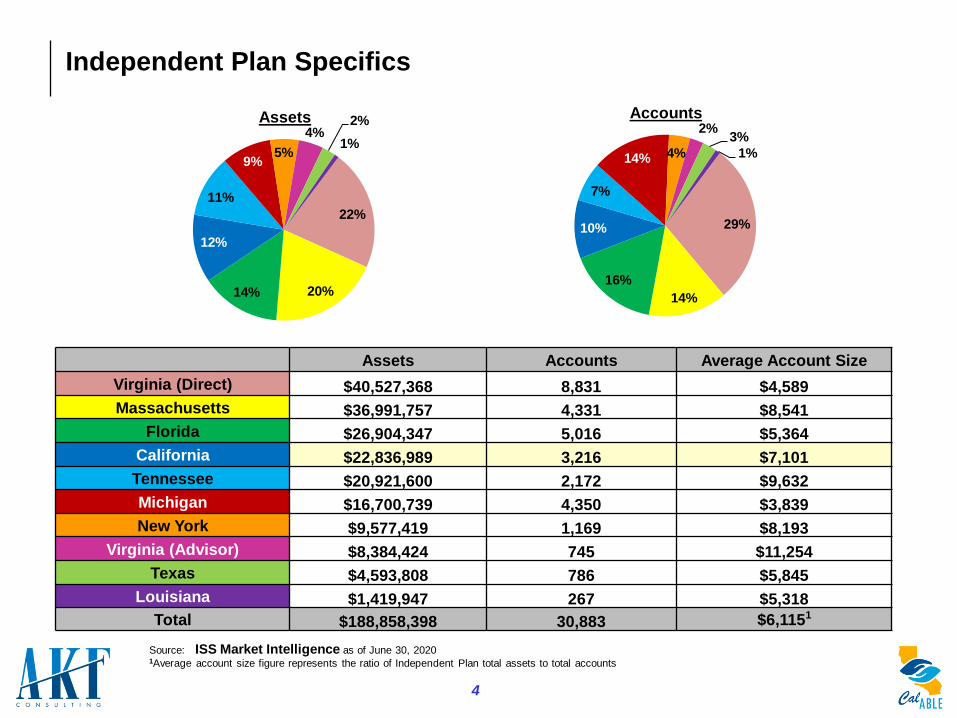
Independent Plan Specifics
Source: ISS Market Intelligence as of June 30, 20201Average account size figure represents the ratio of Independent Plan total assets to total accounts
Assets Accounts Average Account Size
Virginia (Direct) $40,527,368 8,831 $4,589
Massachusetts $36,991,757 4,331 $8,541
Florida $26,904,347 5,016 $5,364
California $22,836,989 3,216 $7,101
Tennessee $20,921,600 2,172 $9,632
Michigan $16,700,739 4,350 $3,839
New York $9,577,419 1,169 $8,193
Virginia (Advisor) $8,384,424 745 $11,254
Texas $4,593,808 786 $5,845
Louisiana $1,419,947 267 $5,318
Total $188,858,398 30,883 $6,1151
22%
20%14%
12%
11%
9%5%
4%2%
1%
Assets
29%
14%
16%
10%
7%
14% 4%
2%3%
1%
Accounts
5
Ohio Independent Nebraska Oregon Alliance
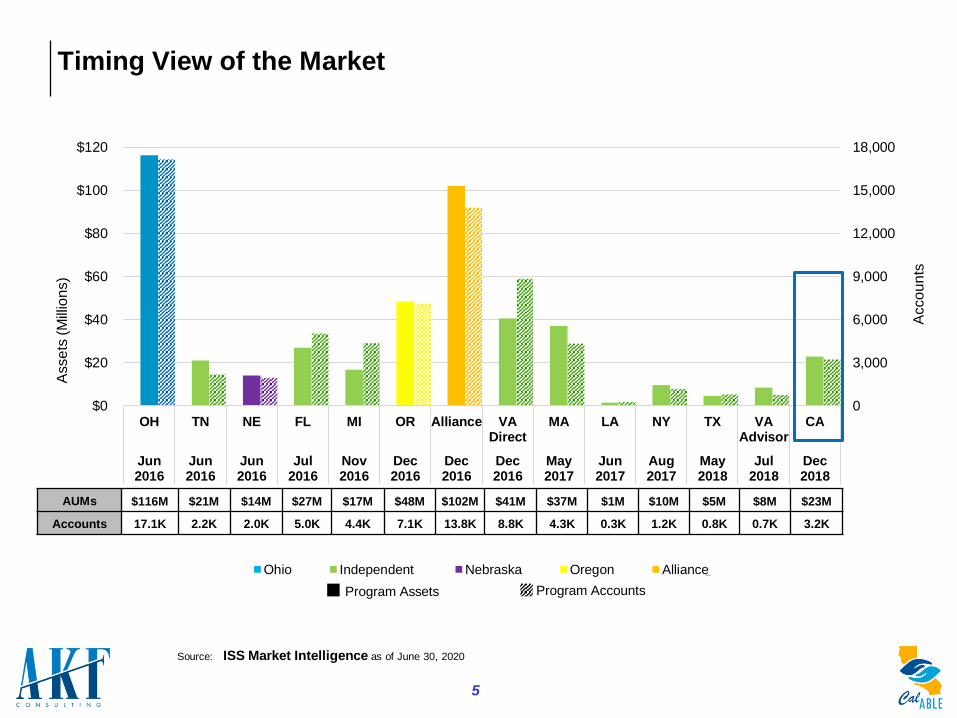
Timing View of the Market
0
3,000
6,000
9,000
12,000
15,000
18,000
$0
$20
$40
$60
$80
$100
$120
OH TN NE FL MI OR Alliance VADirect
MA LA NY TX VAAdvisor
CA
Jun2016
Jun2016
Jun2016
Jul2016
Nov2016
Dec2016
Dec2016
Dec2016
May2017
Jun2017
Aug2017
May2018
Jul2018
Dec2018
Acco
un
ts
Asse
ts (
Mill
ion
s)
AUMs $116M $21M $14M $27M $17M $48M $102M $41M $37M $1M $10M $5M $8M $23M
Accounts 17.1K 2.2K 2.0K 5.0K 4.4K 7.1K 13.8K 8.8K 4.3K 0.3K 1.2K 0.8K 0.7K 3.2K
Source: ISS Market Intelligence as of June 30, 2020
Program Assets Program Accounts
6
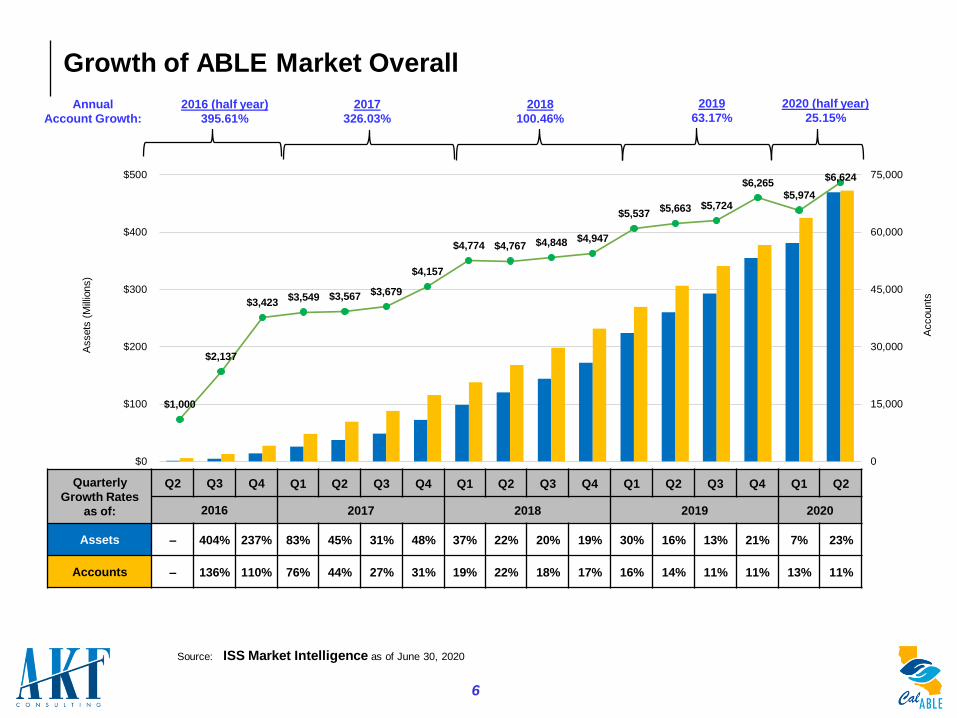
Growth of ABLE Market Overall
Quarterly
Growth Rates
as of:
Q2 Q3 Q4 Q1 Q2 Q3 Q4 Q1 Q2 Q3 Q4 Q1 Q2 Q3 Q4 Q1 Q2
2016 2017 2018 2019 2020
Assets – 404% 237% 83% 45% 31% 48% 37% 22% 20% 19% 30% 16% 13% 21% 7% 23%
Accounts – 136% 110% 76% 44% 27% 31% 19% 22% 18% 17% 16% 14% 11% 11% 13% 11%
2018
100.46%
2019
63.17%2017
326.03%
2016 (half year)
395.61%
Annual
Account Growth:
Source: ISS Market Intelligence as of June 30, 2020
$1,000
$2,137
$3,423 $3,549 $3,567 $3,679
$4,157
$4,774 $4,767 $4,848 $4,947
$5,537 $5,663 $5,724
$6,265 $5,974
$6,624
0
15,000
30,000
45,000
60,000
75,000
$0
$100
$200
$300
$400
$500
Accounts
Assets
(M
illio
ns)
2020 (half year)
25.15%
7
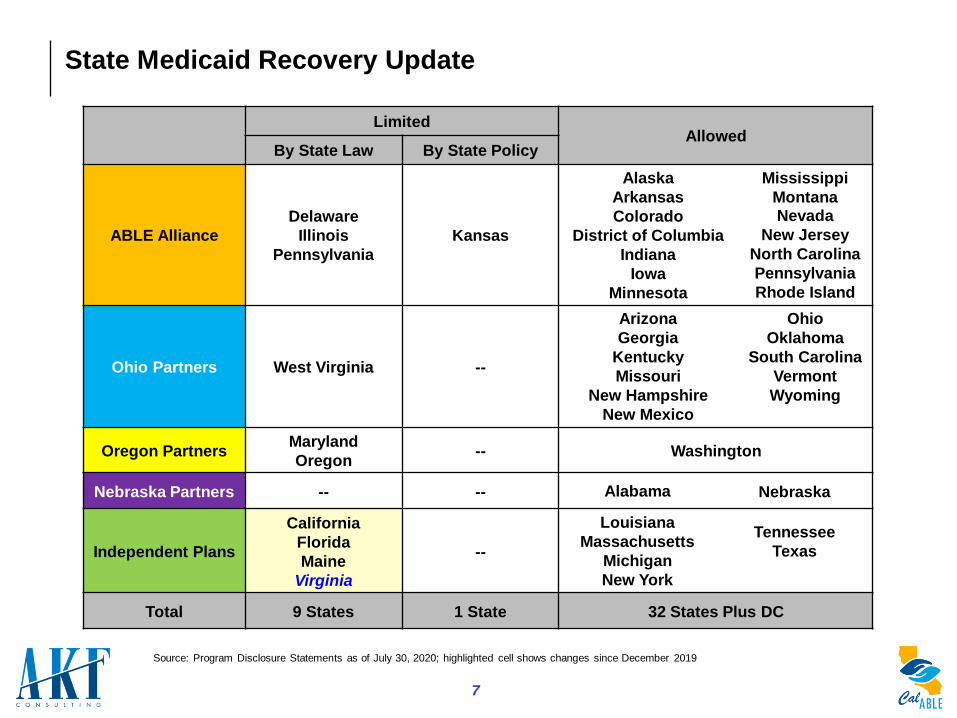
State Medicaid Recovery Update
To come
LimitedAllowed
By State Law By State Policy
ABLE Alliance
Delaware
Illinois
Pennsylvania
Kansas
Alaska
Arkansas
Colorado
District of Columbia
Indiana
Iowa
Minnesota
Mississippi
MontanaNevada
New Jersey
North Carolina
Pennsylvania
Rhode Island
Ohio Partners West Virginia --
Arizona
Georgia
Kentucky
Missouri
New Hampshire
New Mexico
Ohio
Oklahoma
South Carolina
Vermont
Wyoming
Oregon PartnersMaryland
Oregon-- Washington
Nebraska Partners -- -- Alabama Nebraska
Independent Plans
California
Florida
Maine
Virginia
--
Louisiana
Massachusetts
Michigan
New York
Tennessee
Texas
Total 9 States 1 State 32 States Plus DC
Source: Program Disclosure Statements as of July 30, 2020; highlighted cell shows changes since December 2019

8
No Changes to Investment Options
3 3 3 34 4
3
56
4
6
3
7
1
23
13
1 1 1 1
1
1
1
1 12
1
1
1 1 1
1
4 4 4
5 5 5 5
6
7 7 7
8 8
15
0
3
6
9
12
15
Num
ber
of C
hoic
es
Static Option Individual Option Cash/Money Market Option Checking / Debit Option
Source: Program Disclosure Statements available as of July 30, 2020
Tennessee updates include three new individual options and two fewer static options
9
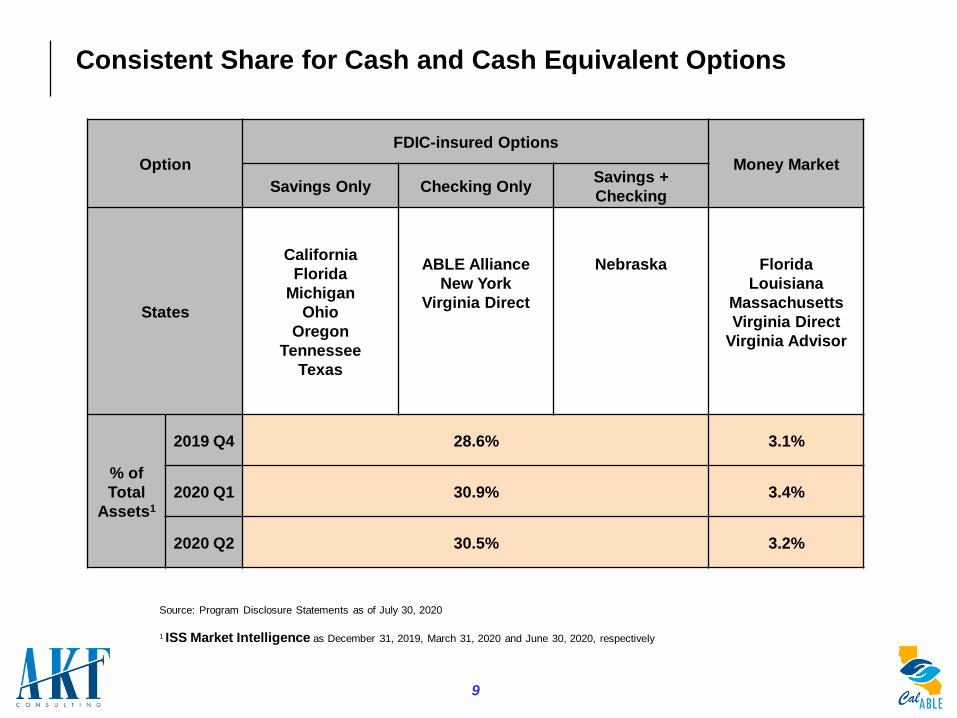
Consistent Share for Cash and Cash Equivalent Options
Option
FDIC-insured Options
Money Market
Savings Only Checking OnlySavings +
Checking
States
California
Florida
Michigan
Ohio
Oregon
Tennessee
Texas
ABLE Alliance
New York
Virginia Direct
Nebraska Florida
Louisiana
Massachusetts
Virginia Direct
Virginia Advisor
% of
Total
Assets1
2019 Q4 28.6% 3.1%
2020 Q1 30.9% 3.4%
2020 Q2 30.5% 3.2%
Source: Program Disclosure Statements as of July 30, 2020
1 ISS Market Intelligence as December 31, 2019, March 31, 2020 and June 30, 2020, respectively
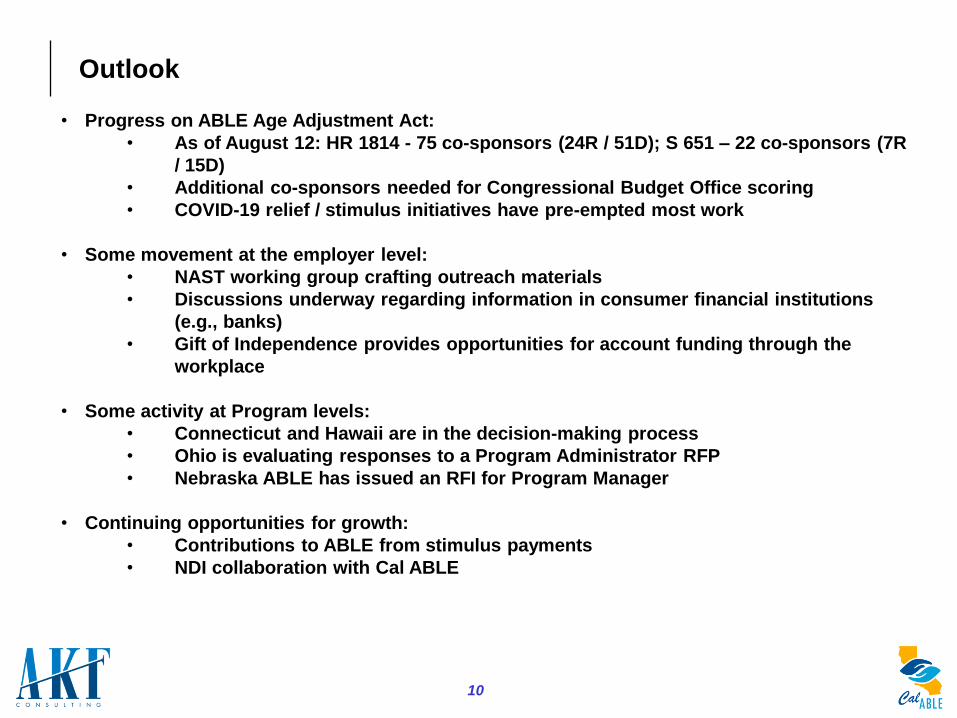
Outlook
• Progress on ABLE Age Adjustment Act:
• As of August 12: HR 1814 - 75 co-sponsors (24R / 51D); S 651 – 22 co-sponsors (7R
/ 15D)
• Additional co-sponsors needed for Congressional Budget Office scoring
• COVID-19 relief / stimulus initiatives have pre-empted most work
• Some movement at the employer level:
• NAST working group crafting outreach materials
• Discussions underway regarding information in consumer financial institutions
(e.g., banks)
• Gift of Independence provides opportunities for account funding through the
workplace
• Some activity at Program levels:
• Connecticut and Hawaii are in the decision-making process
• Ohio is evaluating responses to a Program Administrator RFP
• Nebraska ABLE has issued an RFI for Program Manager
• Continuing opportunities for growth:
• Contributions to ABLE from stimulus payments
• NDI collaboration with Cal ABLE
10
AKF Legal Disclosure
Pursuant to Municipal Securities Rulemaking Board (“MSRB”) Rule G-42, on Duties of Non-Solicitor Municipal Advisors, Municipal Advisors are
required to make certain written disclosures to clients and potential clients which include, among other things, Conflicts of Interest and Legal or
Disciplinary events of AKF and its associated persons.
Conflicts of Interest
Compensation
AKF represents that in connection with the issuance of municipal fund securities, AKF receives compensation from its client issuers for services
rendered on an hourly, retainer or fixed fee basis. Consistent with the requirements of MSRB Rule G-42, AKF hereby discloses that such forms
of compensation may present a potential conflict of interest regarding AKF’s ability to provide unbiased advice regarding a municipal fund
security transaction. This potential conflict of interest will not impair AKF’s ability to render unbiased and competent advice or to fulfill its fiduciary
duty.
Other Municipal Advisor Relationships
AKF serves a wide variety of clients that may from time to time have interests that could have a direct or indirect impact on the interests of other
AKF clients. For example, AKF serves as Municipal Advisor to other municipal fund securities clients and, in such cases, owes a regulatory duty
to such clients just as it will with the entity receiving this proposal, if hired. These other clients may, from time to time and depending on the
specific circumstances, have competing interests. In acting in the interests of its various clients, AKF could potentially face a conflict of interest
arising from these competing client interests. AKF fulfills its regulatory duty and mitigates such conflicts by dealing honestly and with the utmost
good faith with all clients.
If AKF becomes aware of any potential or actual conflicts of interest after this disclosure, AKF will disclose the detailed information in writing to
the client or obligated person in a timely manner.
Legal or Disciplinary Events
AKF does not have any legal events or disciplinary history on its Form MA and Form MA-I, which includes information about any criminal actions,
regulatory actions, investigations, terminations, judgments, liens, civil judicial actions, customer complaints, arbitrations and civil litigation. You
may electronically access AKF’s most recent Form MA and each most recent Form MA-I filed with the Securities and Exchange Commission at
the following website: www.sec.gov/edgar/searchedgar/companysearch.html. If any material legal or regulatory action is brought against AKF,
AKF will provide complete and detailed disclosure to its clients, thereby allowing each client to evaluate AKF, its management and personnel.
Executive Director’s Report 5 August 18, 2020
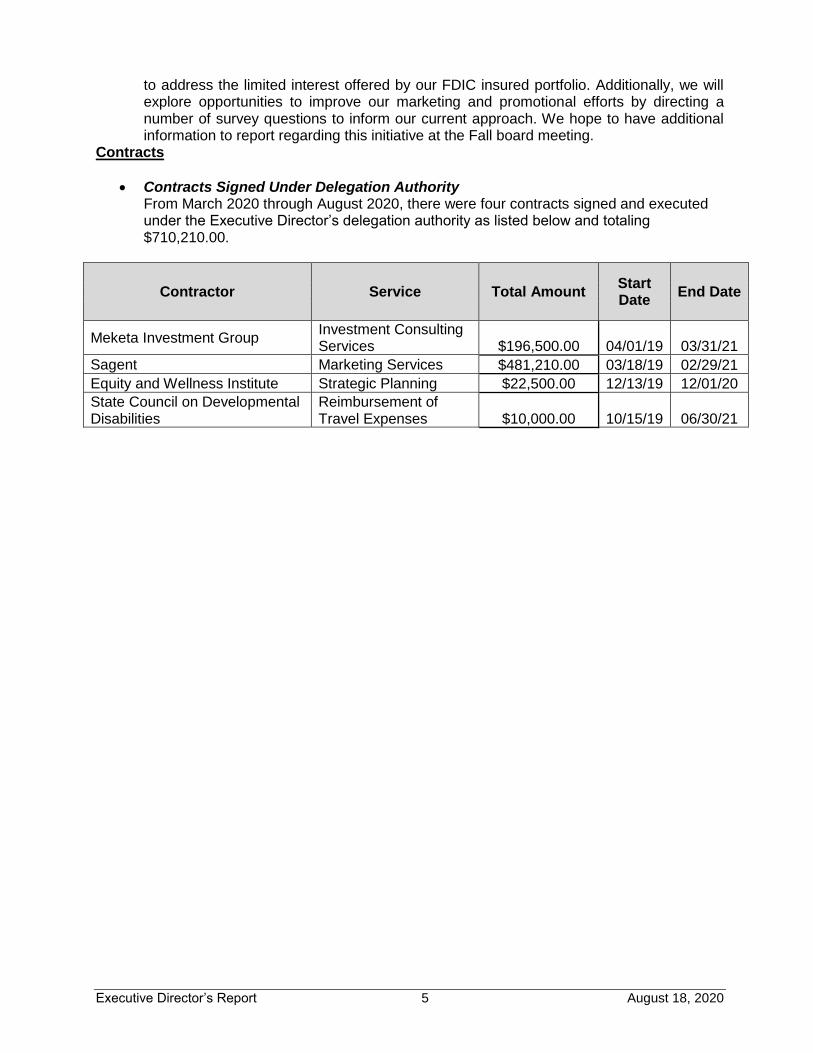
to address the limited interest offered by our FDIC insured portfolio. Additionally, we will explore opportunities to improve our marketing and promotional efforts by directing a number of survey questions to inform our current approach. We hope to have additional information to report regarding this initiative at the Fall board meeting.
Contracts
Contracts Signed Under Delegation Authority From March 2020 through August 2020, there were four contracts signed and executed under the Executive Director’s delegation authority as listed below and totaling $710,210.00.
Contractor Service Total Amount Start Date
End Date
Meketa Investment Group Investment Consulting Services $196,500.00 04/01/19 03/31/21
Sagent Marketing Services $481,210.00 03/18/19 02/29/21
Equity and Wellness Institute Strategic Planning $22,500.00 12/13/19 12/01/20
State Council on Developmental Disabilities
Reimbursement of Travel Expenses $10,000.00 10/15/19 06/30/21
![A D D E N D U M # [Insert Number]...15 CBC (DIFF/PLT) 85025 1,300 $ - 16 HEP B SURF AG W/CONF 87340 1,300 $ - 17 VIT D 25OH LC/MS/MS 82306 1,300 $ - 18 BASIC METAB PNL 80048 1,000](https://img.pdfslide.net/doc/110x75/5f93a9244db57d560d439f51/a-d-d-e-n-d-u-m-insert-number-15-cbc-diffplt-85025-1300-16-hep-b.jpg)


![Abstract - arXivarXiv:2011.09445v1 [cs.RO] 18 Nov 2020 C AUTIOUS B AYESIAN O PTIMIZATION FOR E FFICIENT AND S CALABLE P OLICY S EARCH policy parameter spaces” (Sigaud and Stulp,2019,](https://img.pdfslide.net/doc/110x75/60c67ce892511f5e28459f7a/abstract-arxiv-arxiv201109445v1-csro-18-nov-2020-c-autious-b-ayesian-o-ptimization.jpg)