Embed Size (px)
Citation preview

August 2010

2
Disclaimer
This presentation is strictly confidential and may not be copied, published, distributed or transmitted. The information in this presentation is being provided by
IndusInd Bank Limited (the “Bank”).
This presentation has been prepared for information purposes only and is not an offer or invitation, directly or indirectly, to buy or sell any securities, nor shall
part, or all, of this presentation form the basis at or be relied on in connection with, any contract or investment decision in relation to any securities. This
presentation is not an offer document or a prospectus under the [Indian] Companies Act, 1956, as amended, the Securities and Exchange Board of India
(Issue of Capital and Disclosure Requirements) Regulations, 2009, as amended and any other applicable law.
This presentation contains forward-looking statements based on the currently held beliefs and assumptions of the management of the Bank, which are
expressed in good faith and, in their opinion, reasonable. Forward-looking statements involve known and unknown risks, uncertainties and other factors,
which may cause the actual results, financial condition, performance, or achievements of the Bank or industry results, to differ materially from the results,
financial condition, performance or achievements expressed or implied by such forward-looking statements. The risks and uncertainties relating to these
statements include, but are not limited to, risks and uncertainties regarding expansion plans and the benefits there from, fluctuations in our earnings, our
ability to manage growth and implement strategies, intense competition in our business including those factors which may affect our cost advantage, costs of
raw materials, wage increases in India, our ability to attract and retain highly skilled professionals, time and cost overruns, changes in technology, availability
of financing, our ability to successfully complete and integrate our expansion plans, liabilities, political instability and general economic conditions affecting
our industries. Given these risks, uncertainties and other factors, recipients of this document are cautioned not to place undue reliance on these forward-
looking statements. The Bank disclaims any obligation to update these forward-looking statements to reflect future events or developments.
This presentation is not an offer of securities for sale in the United States. Securities may not be offered or sold in the United States absent registration or an
exemption from registration. No shares or other securities may be offered or sold other than in compliance with the laws of relevant jurisdictions, including
the United States Securities Act of 1933, as amended.
By viewing this presentation you acknowledge that you will be solely responsible for your own assessment of the market and the market position of the Bank
and that you will conduct your own analysis and be solely responsible for forming your own view of the potential future performance of the business of the
Bank.
Except as otherwise noted, all of the information contained herein is indicative and is based on management information, current plans and estimates in the
form as it has been disclosed in this presentation. Industry and market-related information is obtained or derived from industry publications and has not been
verified by us. The information contained in this presentation, except as otherwise noted, is only current as of the date of the presentation, and is subject to
change without notice. The Bank may alter, modify or otherwise change in any manner the content of this presentation, without any obligation to notify any
person of such revision or changes. Persons relying on the information in this presentation should do so at their own risk and the Bank shall not be
responsible for any kind of consequences or liability to any person arising out of, relying and acting upon any such information.

Overview

4
A New Private Sector Bank
Overview
Incorporated in 1994
Widespread & loyal customer base of ~ 2.1 million as at June 30, 2010
Pan India presence through a network of 224 branches, 514 marketing outlets, 533 ATMs, representative offices in Dubai and London
and strategic alliances in UAE and Qatar as at June 30, 2010; further regulatory clearances for 113 new branches are in place
Amongst the largest financiers of Vehicles; Presence in this segment in India for last 25 years
Expertise in Commercial and Small Business Sectors and Cross Border Remittances
Strong Enterprise-wide Risk Management (EWRM) framework and a robust technology platform
Total Assets of Rs 355 billion (US$ 7.6 billion) as at June 30, 2010
CRAR at 13.7% as at June 30, 2010
7511,483
3,503
FY08 FY09 FY10
CAGR: 22.3%
232,619276,147
353,695
FY08 FY09 FY10
CAGR: 116.0% CAGR: 23.3%
Income (Rs Mn) Net Profit (Rs Mn) Total Assets (Rs Mn)
18,80723,095
27,070
2,976
4,563
5,535
FY08 FY09 FY10
Interest Income Other Income

5
With over 16 years of Operating History
Tie ups with exchange houses in Middle East and banks in the United States
GDR - raised Rs 1,460 million, tied up with Cholamandalam MS for bancassurance
Signed an agreement with National Multi Commodity Exchange Ltd as clearing banker
Tied-up with Religare Securities for offering 3-in-1 account covering banking, depository & securities trading
Tied up with Aviva Life Insurance for bancassurance
Signed an agreement with NCDEX as clearing banker
Opened its second representative office in London
Ashok Leyland Finance Ltd, a leading NBFC merged with the Bank (total 115 branches); opened representative office in Dubai
IndusInd Enterprises & Finance Ltd, a NBFC & one of the promoters of the Bank amalgamated with the Bank
Increased branch network to 53
Incorporated in 1994; Promoted by a group of Non Resident Indians. Started operations with Rs 1000 Mn Capital
1994-00
2002
2003
2004
2005
2006
2009
Raised Rs 1,000 million through preferential issue of shares
IPO - raised Rs 1,800 million, became clearing bank to First Commodities Clearing Corporation of India
Awards/Recognition: The Smart Workplace - Economic Times, Best CSR Practice Company – BSE/NASSCOM
New management team headed by Romesh Sobti inducted from ABN AMRO Bank NV
GDR Issue - raised Rs 2,222 million; Ratings: ICRA A1+ - CDs, Crisil P1+: CDs, FDs
New Launch/Rollout: Mid market Investment Bank, 3rd Party Distribution Platform, Warehouse Receipt Finance
Extended microfinance to 300,000+ women by partnering leading MFIs like SKS Mircofinance
Extensive IT initiatives
Became clearing/settlement bank for NSE currency futures exchange
2000 – Became clearing/settlement bank for BSE/NSE
Regulatory clearances for 113 new branches are in place (as of June 30, 2010)
Appointed as Clearing & Settlement Bank at 6 major Tea Auction centres (includes 2 which were added in 2010)
Tied up with BONY Mellon for on line remittances from United States to India
QIP Issue – raised Rs. 4803 million in August 2009
Awarded the „Technology Bank of the Year-2009‟ from IBA
Tier II Issue – raised Rs. 4200 million in April 2010
2010
2007
2008
Recognised for „Best Performance in Credit Quality‟ by Financial Express
“Excellence Award‟, the 2nd best new generation bank in Kerala by the State Forum of Bankers‟ Clubs, Kerala
Received the ISO 27001 certification for IT operations
Awarded the “Best Priority Sector Bank” amongst the private sector banks by Dun & Bradstreet

6
Distinguished Board
Name Designation Occupation
Mr. R. Seshasayee Chairman Managing Director of Ashok Leyland Ltd.
Mr. Romesh Sobti Whole-time Director Managing Director & CEO
Mr. T. Anantha Narayanan Independent, Non-executive Retired as Executive Director (Finance) of Ashok Leyland Ltd.
Dr. T.T. Ram Mohan Independent, Non-executive Professor – Finance & Accounting, IIM Ahmedabad
Mr. Premchand Godha Independent, Non-executive Industrialist
Mr. Ajay Hinduja Non-executive Industrialist
Director, Hinduja Group India Limited, a promoter company
Mr. S.C. Tripathi Independent, Non-executive Retired as Secretary, Ministry of Petroleum and Natural Gas
Mr. Ashok Kini Independent, Non-executive Retired as Managing Director of State Bank of India
Mr. R. Sundararaman Independent, Non-executive Retired as Dy. Managing Director of State Bank of India
Mr. Y.M. Kale Alternate Director to Mr. Ajay Hinduja Service
Ensuring transparency with all stakeholders

7
New Execution-focused Management
Management Team Designation Previous Assignments
Romesh Sobti Managing Director & CEO
Executive Vice President – Country Executive, India and Head, UAE &
Sub-continent at ABN AMRO bank N.V.
Has been associated with ANZ Grindlays Bank plc & State Bank of
India in his 33 year career
Paul Abraham Chief Operating Officer MD of ABN AMRO Central Enterprise Services
COO of ABN AMRO Bank in India
Sumant Kathpalia Head - Consumer Banking Head - Consumer Banking, ABN AMRO Bank India
Suhail Chander Head - Corporate & Commercial Banking Head - Consumer & Commercial Banking, ABN AMRO Malaysia &
Singapore
KS Sridhar Chief Risk Officer Senior Vice President and Country Risk Officer, ABN AMRO India
J Moses Harding Head - Global Markets Group
Head - Treasury, International & Capital Markets since 2003 at
IndusInd
Prior positions at State Bank & Centurion Bank
SV Parthasarathy Head - Consumer Finance Executive Director, Ashok Leyland Finance
Ramesh Ganesan Head - Transaction Banking Executive Director, ABN AMRO India
SV ZaregaonkarChief Financial Officer &
Head - Investor Relations
Joined IndusInd in 1995 as Head Operations
Prior positions at Dena Bank
Suresh N Pai Head – Commercial and Corporate Services Joined IndusInd in 1996
Prior positions at Corporation Bank
Zubin Mody Head - Human Resources HR head, ICICI Lombard
Sanjeev Anand Head - Commercial Banking Head, Commercial Banking, ABN Amro, India
Planning Cycle I: 2008-11

9
Themes for Planning Cycle: 2008-11
Mission & Measurable Targets
Business Segments reorganized
Focus on Productivity, Profitability & Efficiency
New Products & Services to ensure strong customer proposition
Expand Network / Footprint
Image Makeover / Build the Brand
Invest in Technology & Process

10
Stated Ambition with Measurable Targets
Mission Statement
To position IndusInd Bank as a Top 3 performer in the new private
sector bank space in 3 years
Profitability
Productivity
Efficiency
Measu
red
By
RoA
RoE
Net Interest Margins
Cost to Income Ratio
Revenue per Employee
Net NPAs
Ob
jecti
ves

11
Business Units
Global Markets Transaction Banking
Product Groups
Client Groups
Consumer Banking Corp. & Commercial Banking
Consumer Finance
Retail Liabilities
Corporate &
Investment Banking
Commercial Banking
Business Banking
Financial Institutions &
Public Sector
Banking Channel Management
& Services
Wealth Management &
Third Party Distribution
Reorganized business into client based units and product groups that work across client groups with the objective to enhance focus
and customer orientation and service levels; also restructured geographical structure, regional offices and branch structure
Various initiatives undertaken within each business segment to enhance customer acquisition and visibility

12
Distribution Expansion to Drive Growth
As at, end FY08 FY09 FY10 Q1FY11
Branch Network 180 180 210 224
ATMs 336 356 497 533
Marketing Outlets 410 410 499 514
Strengthening Distribution infrastructure
Regulatory clearances for 113 new branches are in place
Branch/Representative Office
Strategic Alliance
13
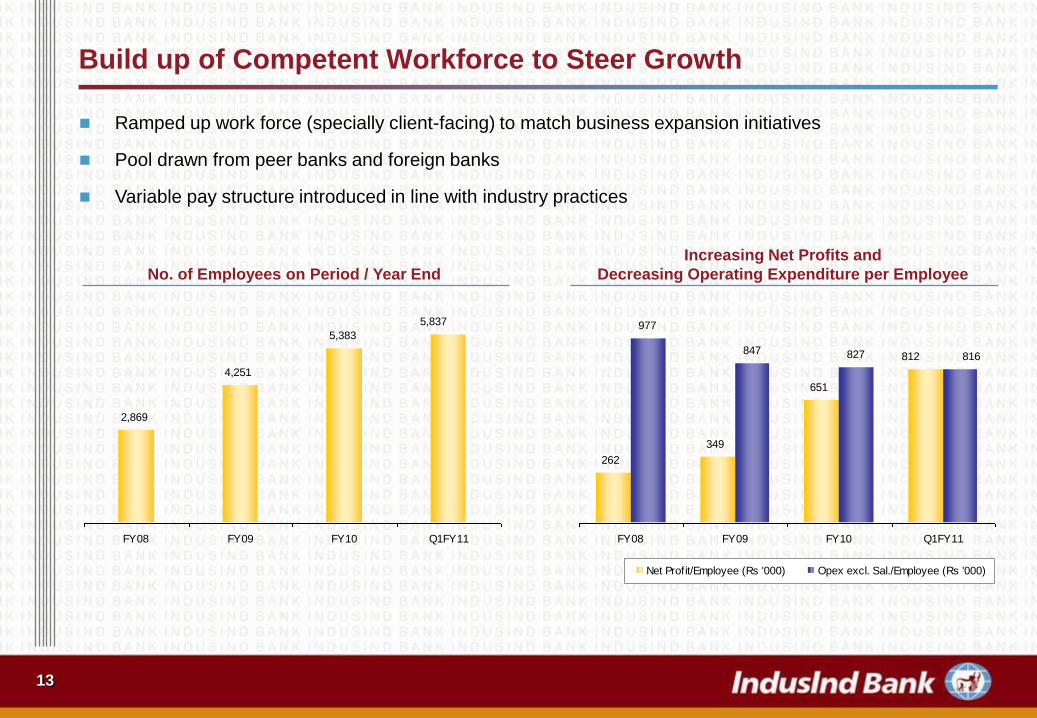
Build up of Competent Workforce to Steer Growth
Ramped up work force (specially client-facing) to match business expansion initiatives
Pool drawn from peer banks and foreign banks
Variable pay structure introduced in line with industry practices
262
349
651
977
847 827 812 816
FY08 FY09 FY10 Q1FY11
Net Profit/Employee (Rs '000) Opex excl. Sal./Employee (Rs '000)
Increasing Net Profits and
Decreasing Operating Expenditure per EmployeeNo. of Employees on Period / Year End
2,869
4,251
5,383
5,837
FY08 FY09 FY10 Q1FY11

14
Revamped Risk Organisation
Risk Organisation
Credit Approval &
MonitoringCredit Risk Mgmt
Market Risk Mgmt
& ALM
Operational Risk
Mgmt
Fin Restr &
Reconstnn
CQA & Loan
Review
Risk and Control
Self Assessment
(RCSA)
Key Risk Indicators
(KRIs.)
Loss Data
Collection
Risk Profiling of
branches
Operational Risk
Assessment
Process for New
Products
Business Continuity
Plan (BCP)
Separate group
monitors NPLs
Account-wise
monitoring &
recovery
mechanism
Quality check on
entire credit
process
Tracking of credit
rating
Tracking of portfolio
quality
Proactive
Monitoring of Risk
& exposures
Daily valuation
VaR & PV01 Based
Limit.
Online monitoring
of Risk parameter
Liquidity Gaps
monitoring – Daily
Parallel monitoring
of intra-day liquidity
position.
Duration based gap
approach
Stress testing for
Liquidity, interest
and foreign
exchange risk
ALM system
Fund Transfer
Pricing (FTP)
Risk Rating Models
revised and
benchmarked
against external
rating
Basel II
implementation
ICAAP
Stress testing
Portfolio Mgmt &
Credit Quality
Monitoring
reinforced
Credit Appraisal/
Approval process
Credit standards
tightened
Credit Admin
reinforced and
centralised in hubs
Early waning
signals/ Exceptions
tracking
Enhanced
monitoring
mechanism

15
Continuous Process Improvement
Centralization / Standardization Initiatives Sustainable Environment – Green Banking
Electronic Banking – New platforms to engage Clients
e-Engagement with Internal Clients
Launched a front end Branch Banking platform
Image based work flow solution for consumer and trade finance
transaction processing
Image based work flow solution for branch expense processing
Centralised procurement; locally delivered at branches
2 CPUs at Mumbai and Chennai
ATM management outsourced to a specialist vendor
Electronic Customer Request / Complaint handling
Sales Force Automation for RM and FOS
Strategic procurement in partnership with WIPRO and e-auctions
Revamp and upgrade National IT Com backbone and Info Security
Architecture
Ethos of a “responsible corporate citizen” permeates entire bank;
changes in Attitudes, Behaviour, Spaces and Policy
Implementation of solar powered ATMs; plans to replicate in 100
ATMs during FY11
Thin client computing, server virtualisation
Eco friendly paper, double sided printing, e-waste management,
power and water conservation
Retrofitting cars to Compressed Natural Gas
Indus Net
Internet based banking services portal for retail clients
347,000 registered customers
Diverse services; on-line account status view
Indus Online / Indus Direct
Internet based banking portal for corporate clients
Secure, robust technology
Wide suite of transaction processing capability
231 registered users; txn volume Rs.28.66 billion Q1 FY 11
Clearing and Settlement Platform for Commodities; Tea Auction
Settlement Systems at 6 Tea Exchanges
Supply Chain Portal
Web portal / service desk for all IT procurement requests, regular
branch requirements, service and maintenance requests
Human Resources Information System; a comprehensive portal to
engage with employees; attendance, leave, goal setting and
performance management
E-Learning portal for employees
New Initiatives
RET Retail Remote Trading for FX
Upgrade of Trade Platform
Replacing Core Banking Solution

16
Recognition for our Performance
Awarded the “Best Priority Sector Bank” amongst the private sector banks by Dun & Bradstreet
Received the „Technology Bank of the Year-2009‟ award from the Indian Banks‟ Association (IBA)
The State Forum of Bankers‟ Clubs, Kerala, bestowed on the Bank the „Excellence Award‟, as the second best new
generation bank in Kerala
Recognised for „Best Performance in Credit Quality‟ by Financial Express
Received the ISO 27001 certification for IT operations which conform to the Information Management System Standard -
ISO/IEC 27001
Awards & Recognition
P1+ rating for certificate of deposit program by CRISIL
Rating of „LAA-‟ for Lower Tier II subordinate debt program and „LA+‟ for Upper Tier II bond program by ICRA
Rating of „AA-„ for Lower Tier II subordinate debt program by CARE
Rating of „A+(ind)‟ for Lower Tier II subordinate debt program and „A-(ind)‟ for Upper Tier II bond program by Fitch Ratings
Ratings

17
How we Measure Up on Key Metrics
3.3%
1.4%
1.8%
2.9%
FY08 FY09 FY10 Q1FY11
Net Interest Margin (NIM) RoA RoE
Cost to Income Ratio Net NPA Revenue/Employee (Rs Mn)
Improvement in all the key operating metrics
1.3%
0.3%
0.6%
1.1%
FY08 FY09 FY10 Q1FY11
6.8%
10.4%
16.2%
20.7%
FY08 FY09 FY10 Q1FY11
67.2%
59.8%
51.1% 49.5%
FY08 FY09 FY10 Q1FY11
2.3%
1.1%
0.5%0.4%
FY08 FY09 FY10 Q1FY11
2.1 2.2
2.7
3.1
FY08 FY09 FY10 Q1FY11
18
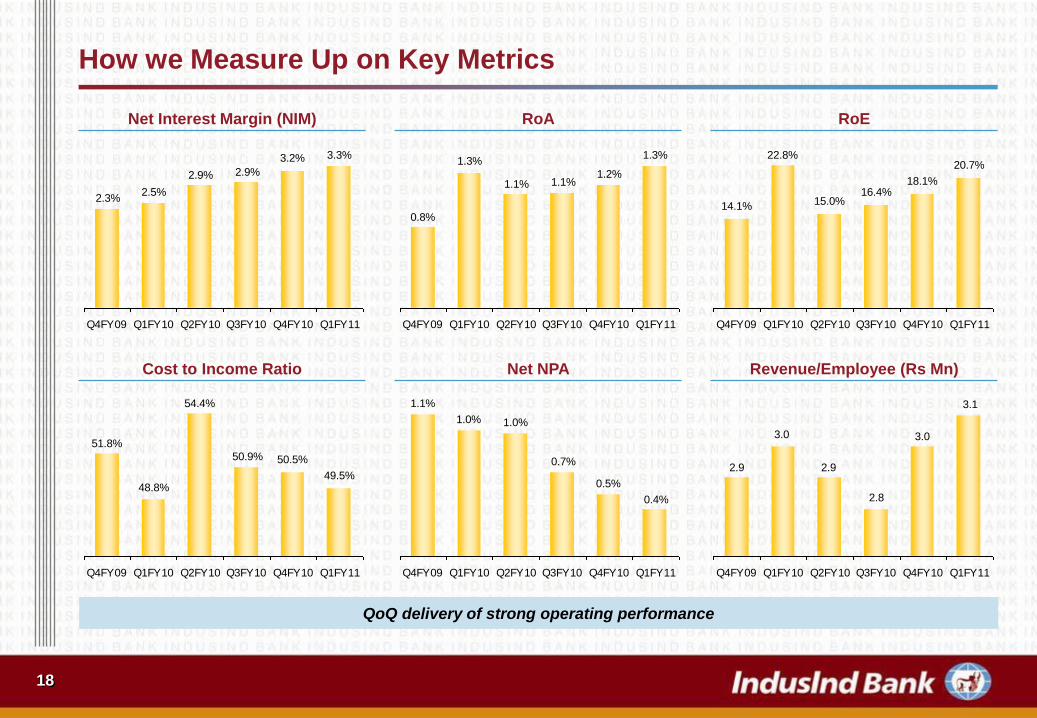
How we Measure Up on Key Metrics
Net Interest Margin (NIM) RoA RoE
Cost to Income Ratio Net NPA Revenue/Employee (Rs Mn)
QoQ delivery of strong operating performance
3.2% 3.3%
2.3%2.5%
2.9% 2.9%
Q4FY09 Q1FY10 Q2FY10 Q3FY10 Q4FY10 Q1FY11
1.3%
0.8%
1.3%
1.1% 1.1%1.2%
Q4FY09 Q1FY10 Q2FY10 Q3FY10 Q4FY10 Q1FY11
14.1%
22.8%
15.0%16.4%
18.1%
20.7%
Q4FY09 Q1FY10 Q2FY10 Q3FY10 Q4FY10 Q1FY11
54.4%
50.5%
49.5%
50.9%
51.8%
48.8%
Q4FY09 Q1FY10 Q2FY10 Q3FY10 Q4FY10 Q1FY11
1.1%
0.4%
0.5%
0.7%
1.0% 1.0%
Q4FY09 Q1FY10 Q2FY10 Q3FY10 Q4FY10 Q1FY11
2.9
3.0
2.9
2.8
3.0
3.1
Q4FY09 Q1FY10 Q2FY10 Q3FY10 Q4FY10 Q1FY11

Financial Performance

20
Strong Headline Numbers for Q1FY11
Net Interest
IncomeRs 2,957 mn 77%
Core Fee Rs 1,296 mn 50%
Revenue Rs 4,566 mn 34%
Operating
ProfitRs 2,306 mn 32%
Net
ProfitRs 1,186 mn 37%
Y-o-Y Growth

21
Balance Sheet
FY09 FY10 Growth Q1FY10 Q1FY11 Growth
Capital & Liabilities
Capital 3,552 4,106 16% 3,552 4,111 16%
Reserves and Surplus (incl. ESOP o/s) 13,092 19,866 52% 13,952 21,078 51%
Deposits 221,102 267,102 21% 216,388 273,824 27%
Borrowings 28,170 49,343 75% 32,353 41,854 29%
Other Liabilities and Provisions 10,231 13,278 30% 11,727 14,188 21%
TOTAL 276,147 353,695 28% 277,972 355,055 28%
Assets
Cash and Balances with RBI 11,908 20,992 76% 14,024 20,894 49%
Balances with Banks 7,329 5,040 -31% 6,218 4,352 -30%
Investments 80,834 104,018 29% 75,845 94,223 24%
Advances 157,706 205,506 30% 164,516 216,081 31%
Fixed Assets 6,232 6,448 3% 6,213 6,491 4%
Other Assets 12,138 11,691 -4% 11,156 13,014 17%
TOTAL 276,147 353,695 28% 277,972 355,055 28%
Core Banking (Advances + Deposit) 378,808 472,608 25% 380,904 489,905 29%
(Rs Mn)

22
Profit and Loss Account
FY09 FY10 Growth Q1FY10 Q1FY11 Growth
Net Interest Income 4,590 8,864 93% 1,674 2,957 77%
Other Income 4,563 5,535 21% 1,728 1,610 -7%
Total Income 9,153 14,399 57% 3,401 4,566 34%
Operating Expenses 5,470 7,360 35% 1,658 2,260 36%
Operating Profit 3,683 7,039 91% 1,743 2,306 32%
Provisions & Contingencies 1,408 1,708 21% 343 487 42%
Profit before Tax 2,275 5,331 134% 1,400 1,819 30%
Provision for Tax 792 1,827 131% 535 633 18%
Profit after Tax 1,483 3,503 136% 865 1,185 37%
(Rs Mn)

23
40% 42%45%57%
60% 58%
55%43%
127,953
157,706
205,506 216,081
FY08 FY09 FY10 Q1FY11
Consumer Finance Division Corporate & Commercial Banking
23
Well Diversified Loan Book
Loan Book (Rs Mn)
30 Jun-10 %
C&I 61.4 28
Comm. Banking 46.4 21
Loan to Small Business 18.5 9
Total 126.3 58
Consumer Finance 30 Jun-10 %
Comm. Vehicle Loans 44.1 20
Utility Vehicle Loans 7.5 3
Three Wheeler Loans 10.3 5
Two Wheeler Loans 8.8 4
Car Loans 5.4 3
Equipment Financing 12.0 6
Other (Home, Personal) 1.6 1
Total Advances 89.6 42
(Rs Bn)(Rs Bn)
C&I
28%
Commercial Banking
21%
Loan to Small Business
9%
Equipment Financing
6%Car Loans
3% 2 W Loans
4%
3 W Loans
5%
Utility Vehicle Loans
3%
Comm. Vehicle Loans
20%
Others (Home, Personal)
1%

24
NBFCs
Pharma
Housing Finance Co.
Steel
Construction
Textiles
Telecom
Aluminium
Hospital & Medical Serv.
Real Estate
Construction Equip.
Auto Ancillaries
Microfinance Institution
Other Industry
24
Diversified Corporate Loan Book
Industry-wise Advances
4.8%
3.3%
2.1%
2.1%
1.9%
1.6%
1.6%
1.3%
1.2%
1.1%
1.1%
1.0%
0.9%
34.4%

25
And Improving Liability and CASA
66,634
29,883
42,549
63,21715.7%
19.2%
23.7%24.3%
0
10,000
20,000
30,000
40,000
50,000
60,000
70,000
FY08 FY09 FY10 Q1FY11
10%
12%
14%
16%
18%
20%
22%
24%
26%
CASA (Rs.Mn) Ratio
CASA Uptick Strong management focus on
Building CASA through
• New product launches
• restructuring of branch network
• focus on self employed and small business
• Targetting CA pools
Broad basing the wholesale deposits
Tenor mapping
Current Account (CA)
46,230
18,019
29,550
44,0689.5%
13.4%
16.5%16.9%
0
10,000
20,000
30,000
40,000
50,000
FY08 FY09 FY10 Q1FY11
5%
7%
9%
11%
13%
15%
17%
19%
CA (Rs.Mn) % of Total Deposits
Savings Account (SA)
20,404
11,86412,999
19,150
6.2%
5.9%
7.2%
7.5%
0
10,000
20,000
30,000
FY08 FY09 FY10 Q1FY11
5%
7%
9%
SA (Rs.Mn) % of Total Deposits

26
Other Income
FY09 FY10 Growth Q1FY10 Q1FY11 Growth
Fee Based Income 2,508 3,501 39.54% 715 1,090 52.45%
Profit on Exchange Transactions 719 845 17.52% 174 288 65.52%
Profit on Sale of Investments 1,216 1,110 8.72% 868 199 (77.07%)
Profit/(Loss) on sale of assets (306) (340) (11.11%) (86) (3) (96.51%)
NPA Recovery 238 222 6.72% 5 30 500.00%
Lease Rentals 188 197 5.35% 52 6 (88.46%)
Total 4,563 5,535 21.30% 1,728 1,610 (6.83%)
(Rs Mn)

27
Diverse Revenues from Core Fee Income
FY09 FY10 Growth Q1FY10 Q1FY11 Growth
Trade Fees 414 538 30% 102 191 87%
Loan Processing fees 610 915 50% 212 304 43%
Foreign Exchange Income 313 612 96% 93 201 117%
TPP Distribution Income (Insurance, MF) 673 1161 73% 169 362 114%
General Banking Fees 1,001 1,097 10% 289 238 -17%
Total core fee 3011 4323 44% 865 1,296 50%
Broadened the fee income base
Revamped Transaction Banking products suite: cash management, trade and financing, supply chain financing, global
remittances, commodity financing, and electronic banking services to clients across business groups
Realignment of pricing of General Banking products
Thrust on cross selling to existing client base using Relationship Managers and Managed Sales
Third Party Products distribution capabilities developed
(Rs Mn)

28
Favourable Yield / Cost Movement
Yield on Advances
12.2%12.6%13.2%
11.8%
0%
2%
4%
6%
8%
10%
12%
14%
FY08 FY09 FY10 Q1FY11
Cost of Deposits
6.0%6.8%
8.2%7.8%
6.7%
0%
2%
4%
6%
8%
10%
12%
14%
FY07 FY08 FY09 FY10 Q1FY11
Q1FY10 FY10 Q1FY11
Outstanding
(Rs Mn)
Yield
(%)
Outstanding
(Rs Mn)
Yield
(%)
Outstanding
(Rs Mn)Yield (%)
Corporate and
Commercial Banking91,729 11.9% 122,842 9.1% 126,316 9.2%
Consumer Finance
Division72,787 15.0% 82,664 15.9% 89,765 16.1%
Total 164,516 13.4% 205,506 11.85% 216,081 12.2%
Segment-wise Yield
* Yield / Cost based on daily averages

29
Provision Coverage Ratio
70%
60%
50%
35%
31%
Q1FY10 Q2FY10 Q3FY10 Q4FY10 Q1FY11
Achieved regulatory norm of 70% ahead of stipulated time frame
30
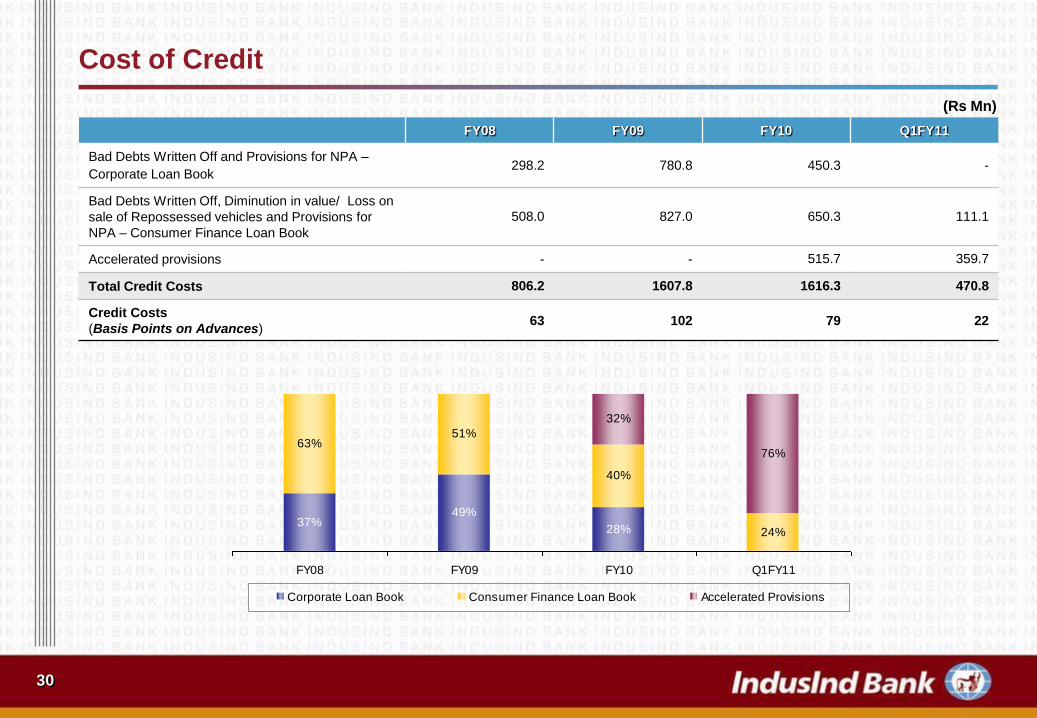
Cost of Credit
FY08 FY09 FY10 Q1FY11
Bad Debts Written Off and Provisions for NPA –
Corporate Loan Book298.2 780.8 450.3 -
Bad Debts Written Off, Diminution in value/ Loss on
sale of Repossessed vehicles and Provisions for
NPA – Consumer Finance Loan Book
508.0 827.0 650.3 111.1
Accelerated provisions - - 515.7 359.7
Total Credit Costs 806.2 1607.8 1616.3 470.8
Credit Costs
(Basis Points on Advances)63 102 79 22
37%49%
28%
32%
76%
24%
40%
51%63%
FY08 FY09 FY10 Q1FY11
Corporate Loan Book Consumer Finance Loan Book Accelerated Provisions
(Rs Mn)

31
Loan Portfolio - Movement in NPA
FY09 FY10 Q1FY11
CCB CFD Total CCB CFD Total CCB CFD Total
Opening Balance 2,059 1,864 3,923 596 1,954 2,550 827 1,727 2,554
Additions 898 1,292 2,190 616 1,600 2,216 105 563 668
Deduction 2,361 1,202 3,563 385 1,827 2,212 31 440 471
Gross NPA 596 1,954 2,550 827 1,727 2,554 901 1,850 2751
Provisions 247 512 759 827 709 1,536 901 1,026 1927
Net NPA 349 1,442 1,791 - 1,018 1,018 - 824 824
Total Advances 86,432 71,274 1,57,706 122,842 82,664 205,506 126,316 89,765 216,081
% of Gross NPA 0.7% 2.7% 1.6% 0.7% 2.1% 1.2% 0.7% 2.0% 1.3%
% of Net NPA 0.4% 2.0% 1.1% - 1.2% 0.5% - 0.9% 0.4%
Provision Coverage 41.4% 26.2% 29.8% 100.0% 41.0% 60.1% 100.0% 55.4% 70.0%
(Rs Mn)
CCB - Corporate and Commercial Banking
CFD - Consumer Finance Division

32
CFD - Segment wise NPA
665596
703749
326333
517607
2.0%
1.9%
1.5% 1.5%
0.7%0.8%
1.4%
1.7%
Q2FY10 Q3FY10 Q4FY10 Q1FY11
Commercial Vehicle Utility Construction Equipment
3-Wheelers 2-Wheelers Cars
96
77 8876 57
4450
75
1.6%
1.2%1.1%
1.2%
0.8%
0.6%
0.8%
1.3%
Q2FY10 Q3FY10 Q4FY10 Q1FY11
188209
184 181162
175 139
94
1.5%1.6%
1.9%1.8%
1.6% 1.6%
1.2%
0.8%
Q2FY10 Q3FY10 Q4FY10 Q1FY11
47
32 35
64
52
2725
38
0.6%
0.4% 0.4%
0.6%
0.5%
0.3%0.3%
0.5%
Q2FY10 Q3FY10 Q4FY10 Q1FY11
461 454 475
483
209
347349
371
5.6%5.2% 5.2% 5.3%
2.40%
3.90%4.10%
4.50%
Q2FY10 Q3FY10 Q4FY10 Q1FY11
250224
179
187
86
128167
200
5.3%4.8%
3.7%3.4%
1.6%
2.7%
3.6%
4.3%
Q2FY10 Q3FY10 Q4FY10 Q1FY11
Gross NPA (Rs Mn) Net NPA (Rs Mn) Gross NPA (%) Net NPA (%)

33
Loan Portfolio – Restructured Standard Advances
Q1-11 Q1-10 Q4-10
No. Rs Mn No. Rs Mn No. Rs Mn
Restructured Loans (Net) 77 453 129 757 85 472
Advances 216,081 164,516 205,506
Restructured Loans 0.2% 0.5% 0.2%

34
CRAR - Basel II
30 Jun-10 30 Jun-09
Credit Risk RWA 225,731 169,086
Market Risk RWA 3,282 3,072
Operational Risk RWA 15,784 10,948
Total Risk Weighted Assets 244,797 183,106
Tier I 21,379 15,134
Tier II 12,170 8,934
Total Capital 33,549 24,068
CRAR 13.71% 13.14%
Tier I 8.73% 8.26%
Tier II 4.97% 4.88%
(Rs Mn)

Planning Cycle II: 2011-14

36
Themes for Planning Cycle II
Continue building on Planning Cycle - I acquiring scale organically & inorganically including strategic
alliances
Re-rating of the Profitability, Productivity & Efficiency targets
Complete the “Universal Bank” agenda
Products
Client Segments
Build Scale
Products
Client base
Distribution network
• Expand branch network
• Expand ATM network

37
Growth Drivers over Next 3 Years
Consumer Finance
New Products
Loans against Property
Credit Cards
Corporate
Banking
Incremental Revenues
Supply Chain Financing
Infrastructure Lending
Commodity Finance
Co-operative Bank Sector Initiatives
Fee Income
New Products / Client Segments
Consumer
HNI Advisory & Offshore
Health Insurance
White Labelled Mortgages
Corporate
Investment Banking (Debt / PE / Advisory)

38
Management Outlook - Disciplined Growth Strategy
To continue to optimize balance sheet and business mix to improve profitability
To continue to create a more enhanced and deeper customer focus and leverage customer relationships
To widen and leverage delivery channels and achieve disciplined growth
To improve operating efficiencies
To continue to engage and retain employees
To continue to improve brand equity

39
Shareholding Pattern
Shares held by Custodians & against
w hich Depository Receipts have
been issued
16%Others (incl NRIs and Directors and
their relatives and friends)
3%
Individuals
12%
Bodies Corporates
12%
FIIs
29%
MFs / Banks / Insurance Co and
Financial Institutions
6%
Promoters and Promoter Group
22%
As at June 30, 2010

Thank you