Embed Size (px)
Citation preview

California Public Employees’ Retirement System Actuarial Office
P.O. Box 942701 Sacramento, CA 94229-2701 TTY: (916) 795-3240 (888) 225-7377 phone • (916) 795-2744 fax www.calpers.ca.gov
August 2016 SAFETY PLAN OF THE COUNTY OF BUTTE (CalPERS ID: 7607918484) Annual Valuation Report as of June 30, 2015 Dear Employer, As an attachment to this letter, you will find a copy of the June 30, 2015 actuarial valuation report of your pension plan. Your 2015 actuarial valuation report contains important actuarial information about your pension plan at CalPERS. Your CalPERS staff actuary, whose signature appears in the “Actuarial Certification” section on page 1, is available to discuss the report with you after August 31, 2016. Future Contributions The exhibit below displays the minimum employer contributions for Fiscal Year 2017-18 and projected contributions for Fiscal Year 2018-19, before any cost sharing. The projected contributions for Fiscal Year 2018-19 are based on the most recent information available, including an estimate of the investment return for Fiscal Year 2015-16, namely 0.0 percent. For a projection of employer contributions beyond Fiscal Year 2018-19, please refer to the “Projected Employer Contributions” in the “Highlights and Executive Summary” section. This 5-year projection of future employer contributions supersedes any previous projections we have provided. The “Risk Analysis” section of the valuation report also contains estimated employer contributions in future years under a variety of investment return scenarios.
Fiscal Year Employer Normal Cost Rate
Employer Payment of Unfunded Liability
Employee PEPRA Rate
2017-18 16.476% $2,355,530 11.50% 2018-19 (projected) 16.5% $3,046,165 N/A
Member contributions other than cost sharing (whether paid by the employer or the employee) are in addition to the above. The employer contributions in this report do not reflect any cost sharing arrangement you may have with your employees. The estimates for Fiscal Year 2018-19 also assume that there are no future contract amendments and no liability gains or losses (such as larger than expected pay increases, more retirements than expected, etc.). This is a very important assumption because these gains and losses do occur and can have a significant impact on required contributions. These gains and losses cannot be predicted in advance so the projected employer contributions are just estimates. The actual required employer contributions for Fiscal Year 2018-19 will be provided in next year’s report.

SAFETY PLAN OF THE COUNTY OF BUTTE (CalPERS ID: 7607918484) Annual Valuation Report as of June 30, 2015 Page 2
Changes since the Prior Year’s Valuation Beginning with Fiscal Year 2017-18 CalPERS will collect employer contributions toward the plan’s unfunded liability as dollar amounts instead of the prior method of a contribution rate. This change will address potential funding issues that could arise from a declining payroll or reduction in the number of active members in the plan. Funding the unfunded liability as a percentage of payroll could lead to the underfunding of the plans. Although employers will be invoiced at the beginning of the fiscal year for their unfunded liability payment the plan’s normal cost contribution will continue to be collected as a percentage of payroll.
The CalPERS Board of Administration adopted a Risk Mitigation Policy which is designed to reduce funding risk over time. The policy establishes a mechanism whereby CalPERS investment performance that significantly outperforms the discount rate triggers adjustments to the discount rate, expected investment return and strategic asset allocation targets. A minimum excess investment return of 4% above the existing discount rate is necessary to cause a funding risk mitigation event. The policy has no impact on the current year valuation results but is expected to have an impact in future years. More details on the Risk Mitigation Policy can be found on our website. Besides the above noted changes, there may also be changes specific to the plan such as contract amendments and funding changes. Further descriptions of general changes are included in the “Highlights and Executive Summary” section and in Appendix A, “Actuarial Methods and Assumptions.” The effects of the changes on the required contributions are included in the “Reconciliation of Required Employer Contributions” section. We understand that you might have a number of questions about these results. While we are very interested in discussing these results with your agency, in the interest of allowing us to give every public agency their results, we ask that you wait until after August 31 to contact us with actuarial questions. If you have other questions, you may call the Customer Contact Center at (888)-CalPERS or (888-225-7377). Sincerely,
ALAN MILLIGAN Chief Actuary

ACTUARIAL VALUATION as of June 30, 2015
for the SAFETY PLAN
of the COUNTY OF BUTTE
(CalPERS ID: 7607918484) (Rate Plan ID: 48)
REQUIRED CONTRIBUTIONS
FOR FISCAL YEAR July 1, 2017 – June 30, 2018

TABLE OF CONTENTS
ACTUARIAL CERTIFICATION 1
HIGHLIGHTS AND EXECUTIVE SUMMARY
Introduction 3
Purpose of the Report 3 Required Contributions 4 Plan’s Funded Status 5 Projected Employer Contributions 5 Cost 6 Changes Since the Prior Year’s Valuation 7 Subsequent Events 7
ASSETS
Reconciliation of the Market Value of Assets 9 Asset Allocation 10 CalPERS History of Investment Returns 11
LIABILITIES AND CONTRIBUTIONS
Development of Accrued and Unfunded Liabilities 13 (Gain) / Loss Analysis 06/30/14 - 06/30/15 14 Schedule of Amortization Bases 15 30-Year Amortization Schedule and Alternatives 16 Reconciliation of Required Employer Contributions 18 Employer Contribution History 19 Funding History 19
RISK ANALYSIS
Analysis of Future Investment Return Scenarios 21 Analysis of Discount Rate Sensitivity 22 Volatility Ratios 23 Hypothetical Termination Liability 24
PLAN’S MAJOR BENEFIT PROVISIONS
Plan’s Major Benefit Options 26
APPENDIX A – ACTUARIAL METHODS AND ASSUMPTIONS
Actuarial Data A1 Actuarial Methods A1 – A2 Actuarial Assumptions A3 – A21 Miscellaneous A21
APPENDIX B – PRINCIPAL PLAN PROVISIONS B1 – B10 APPENDIX C – PARTICIPANT DATA
Summary of Valuation Data C1 Active Members C2 Transferred and Terminated Members C3 Retired Members and Beneficiaries C4 – C5
APPENDIX D – DEVELOPMENT OF PEPRA MEMBER CONTRIBUTION RATE D1 APPENDIX E – GLOSSARY OF ACTUARIAL TERMS E1 – E2 (CY) FIN PROCESS CONTROL ID: 481665 (PY) FIN PROCESS CONTROL ID: 465022 REPORT ID: 99820

CALPERS ACTUARIAL VALUATION - June 30, 2015 SAFETY PLAN OF THE COUNTY OF BUTTE CalPERS ID: 7607918484
Page 1
ACTUARIAL CERTIFICATION
To the best of our knowledge, this report is complete and accurate and contains sufficient information to disclose, fully and fairly, the funded condition of the SAFETY PLAN OF THE COUNTY OF BUTTE. This valuation is based on the member and financial data as of June 30, 2015 provided by the various CalPERS databases and the benefits under this plan with CalPERS as of the date this report was produced. It is our opinion that the valuation has been performed in accordance with generally accepted actuarial principles, in accordance with standards of practice prescribed by the Actuarial Standards Board, and that the assumptions and methods are internally consistent and reasonable for this plan, as prescribed by the CalPERS Board of Administration according to provisions set forth in the California Public Employees’ Retirement Law. The undersigned is an actuary for CalPERS, who is a member of the American Academy of Actuaries and the Society of Actuaries and meets the Qualification Standards of the American Academy of Actuaries to render the actuarial opinion contained herein.
STUART BENNETT, ASA, MAAA Senior Pension Actuary, CalPERS

HIGHLIGHTS AND EXECUTIVE SUMMARY
INTRODUCTION
PURPOSE OF THE REPORT
REQUIRED CONTRIBUTIONS
PLAN’S FUNDED STATUS
PROJECTED EMPLOYER CONTRIBUTIONS
COST
CHANGES SINCE THE PRIOR YEAR’S VALUATION
SUBSEQUENT EVENTS

CALPERS ACTUARIAL VALUATION - June 30, 2015 SAFETY PLAN OF THE COUNTY OF BUTTE CalPERS ID: 7607918484
Page 3
Introduction
This report presents the results of the June 30, 2015 actuarial valuation of the SAFETY PLAN OF THE COUNTY OF BUTTE of the California Public Employees’ Retirement System (CalPERS). This actuarial valuation sets the required employer contributions for Fiscal Year 2017-18. The CalPERS Board of Administration adopted a Risk Mitigation Policy which is designed to reduce funding risk over time. The policy establishes a mechanism whereby CalPERS investment performance that significantly outperforms the discount rate triggers adjustments to the discount rate, expected investment return and strategic asset allocation targets. A minimum excess investment return of 4% above the existing discount rate is necessary to cause a funding risk mitigation event. The Risk Mitigation Policy does not have an impact on the current year actuarial valuation. More details on the Risk Mitigation Policy can be found on our website.
Purpose of the Report
The actuarial valuation was prepared by the CalPERS Actuarial Office using data as of June 30, 2015. The purpose of the report is to: Set forth the assets and accrued liabilities of this plan as of June 30, 2015; Determine the required employer contributions for the fiscal year July 1, 2017 through June 30, 2018; Provide actuarial information as of June 30, 2015 to the CalPERS Board of Administration and other
interested parties. The pension funding information presented in this report should not be used in financial reports subject to Governmental Accounting Standards Board (GASB) Statement No. 68 for an Agent Employer Defined Benefit Pension Plan. A separate accounting valuation report for such purposes is available from CalPERS and details for ordering are available on our website. The use of this report for any other purposes may be inappropriate. In particular, this report does not contain information applicable to alternative benefit costs. The employer should contact their actuary before disseminating any portion of this report for any reason that is not explicitly described above. California Actuarial Advisory Panel Recommendations This report includes all the basic disclosure elements as described in the Model Disclosure Elements for Actuarial Valuation Reports recommended in 2011 by the California Actuarial Advisory Panel (CAAP), with the exception of including the original base amounts of the various components of the unfunded liability in the Schedule of Amortization Bases shown on page 15. Additionally, this report includes the following “Enhanced Risk Disclosures” also recommended by the CAAP in the Model Disclosure Elements document:
A “Deterministic Stress Test,” projecting future results under different investment income scenarios
A “Sensitivity Analysis,” showing the impact on current valuation results using a 1 percent plus or minus change in the discount rate.

CALPERS ACTUARIAL VALUATION - June 30, 2015 SAFETY PLAN OF THE COUNTY OF BUTTE CalPERS ID: 7607918484
Page 4
Required Contributions
Fiscal Year
Required Employer Contribution 2017-18
Employer Normal Cost Rate
16.476%
Plus Either
1) Monthly Employer Dollar UAL Payment $ 196,294
Or
2) Annual UAL Prepayment Option
$
2,271,875
Required PEPRA Member Contribution Rate
11.50%
The total minimum required employer contribution is the sum of the Plan’s Employer Normal Cost Rate (expressed as a percentage of payroll) plus the Employer Unfunded Accrued Liability (UAL) Contribution Amount (billed monthly in dollars). Only the UAL portion of the employer contribution can be prepaid (which must be received in full no later than July 31). Plan Normal Cost contributions will be made as part of the payroll reporting process. If there is contractual cost sharing or other change, this amount will change. §20572 of the Public Employees’ Retirement Law assesses interest at an annual rate of 10 percent if a contracting agency fails to remit the required contributions when due. For additional detail regarding the determination of the required contribution for PEPRA members, see Appendix D. Required member contributions for Classic members can be found in Appendix B.
Fiscal Year Fiscal Year
2016-17 2017-18
Normal Cost Contribution as a Percentage of Payroll
Total Normal Cost 25.925% 25.485%
Employee Contribution1 8.827% 9.009%
Employer Normal Cost 17.098% 16.476%
Projected Annual Payroll for Contribution Year $ 19,581,610 $ 20,423,272
Estimated Employer Contributions Based On
Projected Payroll
Total Normal Cost $ 5,076,532 $ 5,204,872
Employee Contribution1 1,728,469 1,839,933
Employer Normal Cost 3,348,063 3,364,939
Unfunded Liability Contribution 1,846,539 2,355,530
Estimated Total Employer Contribution2 $ 5,194,602 $ 5,720,469
1 For classic members, this is the percentage specified in the Public Employees Retirement Law, net of any reduction from
the use of a modified formula or other factors. For PEPRA members, the member contribution rate is based on 50 percent of the normal cost. A development of PEPRA member contribution rates can be found in Appendix D. Employee cost sharing is not shown in this report.
2 As a percentage of projected payroll the UAL contribution for Fiscal Year 2017-18 is 11.534 percent for an estimated
total employer contribution rate of 28.010 percent. As determined in the June 30, 2014 valuation, the Fiscal Year 2016-17 UAL contribution is 9.430 percent for a total employer contribution rate of 26.528 percent.
CALPERS ACTUARIAL VALUATION - June 30, 2015 SAFETY PLAN OF THE COUNTY OF BUTTE CalPERS ID: 7607918484
Page 5
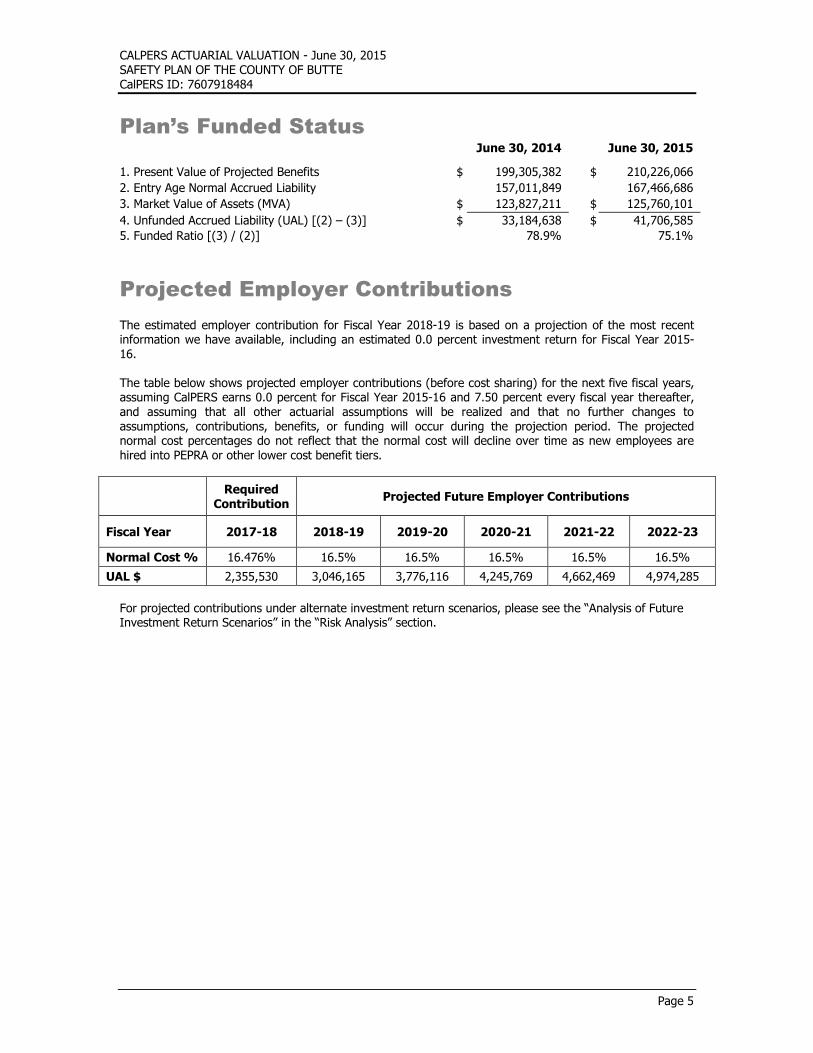
Plan’s Funded Status
Projected Employer Contributions
The estimated employer contribution for Fiscal Year 2018-19 is based on a projection of the most recent information we have available, including an estimated 0.0 percent investment return for Fiscal Year 2015-
16. The table below shows projected employer contributions (before cost sharing) for the next five fiscal years, assuming CalPERS earns 0.0 percent for Fiscal Year 2015-16 and 7.50 percent every fiscal year thereafter, and assuming that all other actuarial assumptions will be realized and that no further changes to assumptions, contributions, benefits, or funding will occur during the projection period. The projected normal cost percentages do not reflect that the normal cost will decline over time as new employees are hired into PEPRA or other lower cost benefit tiers.
Required
Contribution Projected Future Employer Contributions
Fiscal Year 2017-18 2018-19 2019-20 2020-21 2021-22 2022-23
Normal Cost % 16.476% 16.5% 16.5% 16.5% 16.5% 16.5%
UAL $ 2,355,530 3,046,165 3,776,116 4,245,769 4,662,469 4,974,285
For projected contributions under alternate investment return scenarios, please see the “Analysis of Future Investment Return Scenarios” in the “Risk Analysis” section.
June 30, 2014 June 30, 2015
1. Present Value of Projected Benefits $ 199,305,382 $ 210,226,066
2. Entry Age Normal Accrued Liability 157,011,849 167,466,686
3. Market Value of Assets (MVA) $ 123,827,211 $ 125,760,101
4. Unfunded Accrued Liability (UAL) [(2) – (3)] $ 33,184,638 $ 41,706,585
5. Funded Ratio [(3) / (2)] 78.9% 75.1%

CALPERS ACTUARIAL VALUATION - June 30, 2015 SAFETY PLAN OF THE COUNTY OF BUTTE CalPERS ID: 7607918484
Page 6
Cost
Actuarial Cost Estimates in General What will this pension plan cost? Unfortunately, there is no simple answer. There are two major reasons for the complexity of the answer. First, actuarial calculations, including the ones in this report, are based on a number of assumptions about the future. These assumptions can be divided into two categories.
Demographic assumptions include the percentage of employees that will terminate, die, become disabled, and retire in each future year.
Economic assumptions include future salary increases for each active employee, and the assumption with the greatest impact: future asset returns at CalPERS for each year into the future until the last dollar is paid to current members of the plan.
While CalPERS has set these assumptions to reflect our best estimate of the real future of the plan, it must
be understood that these assumptions are very long-term predictors and will surely not be realized in any one year. For example, while the asset earnings at CalPERS have averaged more than the assumed return of 7.5 percent for the past twenty year period ending June 30, 2015, returns for each fiscal year ranged from negative -24 percent to +21.7 percent. Second, the very nature of actuarial funding produces the answer to the question of plan cost as the sum of two separate pieces.
The Normal Cost (i.e., the annual cost associated with one year of service accrual) expressed as a percentage of total active payroll.
The Past Service Cost or Accrued Liability (i.e., the current value of the benefit for all credited past service of current members) which is expressed as a lump sum dollar amount.
The cost is the sum of a percent of future pay and a lump sum dollar amount. In prior years CalPERS converted Past Service Cost to a percent of payroll and expressed the total required employer contribution as a single rate. Going forward the Past Service Cost will no longer be converted to a percent of payroll and
this cost will be invoiced to the employer as a monthly dollar contribution amount with the option to prepay the annual amount at the beginning of the fiscal year. The normal cost will continue to be expressed as a percentage of active payroll with employer and employee contributions payable as part of the payroll reporting process.

CALPERS ACTUARIAL VALUATION - June 30, 2015 SAFETY PLAN OF THE COUNTY OF BUTTE CalPERS ID: 7607918484
Page 7
Changes since the Prior Year’s Valuation
Benefits The standard actuarial practice at CalPERS is to recognize mandated legislative benefit changes in the first annual valuation following the effective date of the legislation. Voluntary benefit changes by plan amendment are generally included in the first valuation that is prepared after the amendment becomes effective, even if the valuation date is prior to the effective date of the amendment. This valuation generally reflects plan changes by amendments effective before the date of the report. Please refer to the “Plan’s Major Benefit Options” and Appendix B for a summary of the plan provisions used in this valuation. The effect of any mandated benefit changes or plan amendments on the unfunded liability is shown in the “(Gain)/Loss Analysis” and the effect on the employer contribution is shown in the “Reconciliation of Required Employer Contributions.” It should be noted that no change in liability or contribution is shown for any plan changes which were already included in the prior year’s valuation.
Actuarial Methods and Assumptions Beginning with Fiscal Year 2017-18 CalPERS will collect employer contributions toward the plan’s unfunded liability as dollar amounts instead of the prior method of a contribution rate. This change will address potential funding issues that could arise from a declining payroll or reduction in the number of active members in the plan. Funding the unfunded liability as a percentage of payroll could lead to the underfunding of the plans. Although employers will be invoiced at the beginning of the fiscal year for their unfunded liability payment the plan’s normal cost contribution will continue to be collected as a percentage of payroll.
Subsequent Events
Risk Mitigation The CalPERS Board of Administration adopted a Risk Mitigation Policy which is designed to reduce funding risk over time. The policy establishes a mechanism whereby CalPERS investment performance that significantly outperforms the discount rate triggers adjustments to the discount rate, expected investment return and strategic asset allocation targets. A minimum excess investment return of 4% above the existing discount rate is necessary to cause a funding risk mitigation event. More details on the Risk Mitigation Policy
can be found on our website.

ASSETS
RECONCILIATION OF THE MARKET VALUE OF ASSETS
ASSET ALLOCATION
CALPERS HISTORY OF INVESTMENT RETURNS

CALPERS ACTUARIAL VALUATION - June 30, 2015 SAFETY PLAN OF THE COUNTY OF BUTTE CalPERS ID: 7607918484
Page 9
Reconciliation of the Market Value of Assets
1. Market Value of Assets as of 6/30/14 including Receivables $ 123,827,211
2. Change in Receivables for Service Buybacks as of 6/30/14 (11,054)
3. Employer Contributions 4,084,403
4. Employee Contributions 1,681,493
5. Benefit Payments to Retirees and Beneficiaries (6,385,511)
6. Refunds (105,464)
7. Lump Sum Payments 0
8. Transfers and Miscellaneous Adjustments 47,243
9. Investment Return 2,621,780
10. Market Value of Assets as of 6/30/15 including Receivables $ 125,760,101

CALPERS ACTUARIAL VALUATION - June 30, 2015 SAFETY PLAN OF THE COUNTY OF BUTTE CalPERS ID: 7607918484
Page 10
Asset Allocation
CalPERS adheres to an Asset Allocation Strategy which establishes asset class allocation policy targets and ranges, and manages those asset class allocations within their policy ranges. CalPERS Investment Belief No. 6 recognizes that strategic asset allocation is the dominant determinant of portfolio risk and return. On February 19, 2014, the CalPERS Board of Administration adopted changes to the current asset allocation as shown in the Policy Target Allocation below expressed as a percentage of total assets. The asset allocation has an expected long term blended rate of return of 7.5 percent. The asset allocation and market value of assets shown below reflect the values of the Public Employees’ Retirement Fund (PERF) in its entirety as of June 30, 2015. The assets for COUNTY OF BUTTE SAFETY PLAN are part of the PERF and are invested accordingly.
(A)
Asset Class
(B) Market Value
($ Billion)
(C) Policy Target
Allocation
Global Equity 162.5 51.0%
Private Equity 29.0 10.0%
Global Fixed Income 53.1 20.0%
Liquidity 7.5 1.0%
Real Assets 31.8 12.0%
Inflation Sensitive Assets 15.6 6.0%
Other 2.4 0.0%
Total Fund $301.9 100.0%
Global Equity 53.8%
Private Equity 9.6%
Global Fixed Income 17.6%
Liquidity 2.5%
Real Assets 10.5%
Inflation 5.2%
Other 0.8%
Asset Allocation at 6/30/2015

CALPERS ACTUARIAL VALUATION - June 30, 2015 SAFETY PLAN OF THE COUNTY OF BUTTE CalPERS ID: 7607918484
Page 11
CalPERS History of Investment Returns
The following is a chart with the 20-year historical annual returns of the Public Employees Retirement Fund for each fiscal year ending on June 30. Beginning in 2002, the figures are reported as gross of fees.
The table below shows historical geometric mean annual returns of the Public Employees Retirement Fund for various time periods ending on June 30, 2015, (figures are reported as gross of fees). The geometric mean rate of return is the average rate per period compounded over multiple periods. It should be recognized that in any given year the rate of return is volatile. Although the expected rate of return on the recently adopted new asset allocation is 7.5 percent, the portfolio has an expected volatility of 11.76 percent per year. The volatility is a measure of the risk of the portfolio expressed in the standard deviation of the fund’s total return distribution, expressed as a percentage. Consequently, when looking at investment returns, it is more instructive to look at returns over longer time horizons.
History of CalPERS Geometric Mean Rates of Return and Volatilities
1 year 5 year 10 year 20 year 30 year
Geometric Return 2.4% 10.7% 6.1% 7.7% 9.1%
Volatility – 9.4% 14.0% 11.8% 10.5%
-25.0%
-20.0%
-15.0%
-10.0%
-5.0%
0.0%
5.0%
10.0%
15.0%
20.0%
25.0%
96 97 98 99 00 01 02 03 04 05 06 07 08 09 10 11 12 13 14 15
15
.3%
20
.1%
19
.5%
12
.5%
10
.5%
-7.2
%
-6.1
%
3.7
%
16
.6%
12
.3%
11
.8%
19
.1%
-5.1
%
-24
.0%
13
.3%
21
.7%
0.1
%
13
.2%
17
.7%
2.4
%

LIABILITIES AND CONTRIBUTIONS
DEVELOPMENT OF ACCRUED AND UNFUNDED LIABILITIES
(GAIN) / LOSS ANALYSIS 06/30/14 - 06/30/15
SCHEDULE OF AMORTIZATION BASES
30-YEAR AMORTIZATION SCHEDULES AND ALTERNATIVES
RECONCILIATION OF REQUIRED EMPLOYER CONTRIBUTIONS
EMPLOYER CONTRIBUTION HISTORY
FUNDING HISTORY

CALPERS ACTUARIAL VALUATION - June 30, 2015 SAFETY PLAN OF THE COUNTY OF BUTTE CalPERS ID: 7607918484
Page 13
Development of Accrued and Unfunded Liabilities
June 30, 2014 June 30, 2015
1. Present Value of Projected Benefits
a) Active Members $ 106,725,686 112,547,810
b) Transferred Members 7,438,874 7,185,168
c) Terminated Members 2,082,998 1,623,084
d) Members and Beneficiaries Receiving Payments 83,057,824 88,870,004
e) Total $ 199,305,382 210,226,066
2. Present Value of Future Employer Normal Costs $ 27,108,975 26,669,002
3. Present Value of Future Employee Contributions $ 15,184,558 16,090,378
4. Entry Age Normal Accrued Liability
a) Active Members [(1a) - (2) - (3)] $ 64,432,153 69,788,430
b) Transferred Members (1b) 7,438,874 7,185,168
c) Terminated Members (1c) 2,082,998 1,623,084
d) Members and Beneficiaries Receiving Payments (1d) 83,057,824 88,870,004
e) Total $ 157,011,849 167,466,686
5. Market Value of Assets (MVA) $ 123,827,211 125,760,101
6. Unfunded Accrued Liability (UAL) [(4e) - (5)] $ 33,184,638 41,706,585
7. Funded Ratio [(5) / (4e)] 78.9% 75.1%

CALPERS ACTUARIAL VALUATION - June 30, 2015 SAFETY PLAN OF THE COUNTY OF BUTTE CalPERS ID: 7607918484
Page 14
(Gain)/Loss Analysis 6/30/14 – 6/30/15
To calculate the cost requirements of the plan, assumptions are made about future events that affect the amount and timing of benefits to be paid and assets to be accumulated. Each year, actual experience is compared to the expected experience based on the actuarial assumptions. This results in actuarial gains or losses, as shown below.
1. Total (Gain)/Loss for the Year a) Unfunded Accrued Liability (UAL) as of 6/30/14 $ 33,184,638 b) Expected Payment on the UAL during 2014/2015 821,361 c) Interest through 6/30/15 [.075 x (1a) - ((1.075)½ - 1) x (1b)] 2,458,604 d) Expected UAL before all other changes [(1a) - (1b) + (1c)] 34,821,881 e) Change due to plan changes 0 f) Change due to assumption change 0 g) Expected UAL after all other changes [(1d) + (1e) + (1f)] 34,821,881
h) Actual UAL as of 6/30/15 41,706,585
i) Total (Gain)/Loss for 2014/2015 [(1h) - (1g)] $ 6,884,704 2. Contribution (Gain)/Loss for the Year a) Expected Contribution (Employer and Employee) $ 5,619,953 b) Interest on Expected Contributions 206,938 c) Actual Contributions 5,765,896 d) Interest on Actual Contributions 212,312 e) Expected Contributions with Interest [(2a) + (2b)] 5,826,891 f) Actual Contributions with Interest [(2c) + (2d)] 5,978,208
g) Contribution (Gain)/Loss [(2e) - (2f)] $ (151,317) 3. Asset (Gain)/Loss for the Year a) Market Value of Assets as of 6/30/14 $ 123,827,211 b) Prior Fiscal Year Receivables (200,020) c) Current Fiscal Year Receivables 188,966
d) Contributions Received 5,765,896 e) Benefits and Refunds Paid (6,490,975) f) Transfers and Miscellaneous Adjustments 47,243 g) Expected Int. [.075 x (3a + 3b) + ((1.075)½ - 1) x ((3d) + (3e) + (3f))] 9,247,080 h) Expected Assets as of 6/30/15 [(3a) + (3b) + (3c) + (3d) + (3e) + (3f) + (3g)] 132,385,401 i) Market Value of Assets as of 6/30/15 125,760,101
j) Asset (Gain)/Loss [(3h) - (3i)] $ 6,625,300 4. Liability (Gain)/Loss for the Year a) Total (Gain)/Loss (1i) $ 6,884,704 b) Contribution (Gain)/Loss (2g) (151,317) c) Asset (Gain)/Loss (3j) 6,625,300
d) Liability (Gain)/Loss [(4a) - (4b) - (4c)] $ 410,721

CALPERS ACTUARIAL VALUATION - June 30, 2015 SAFETY PLAN OF THE COUNTY OF BUTTE
CalPERS ID: 7607918484
Page 15
Schedule of Amortization Bases
There is a two-year lag between the valuation date and the start of the contribution fiscal year. The assets, liabilities, and funded status of the plan are measured as of the valuation date: June 30, 2015. The required employer contributions determined by the valuation are for the fiscal year beginning two years after the valuation date: Fiscal Year 2017-18. This two-year lag is necessary due to the amount of time needed to extract and test the membership and financial data, and the need to provide public agencies with their required employer contribution well in advance of the start of the fiscal year. The Unfunded Accrued Liability (UAL) is used to determine the employer contribution and therefore must be rolled forward two years from the valuation date to the
first day of the fiscal year for which the contribution is being determined. The UAL is rolled forward each year by subtracting the expected payment on the UAL for the fiscal year and adjusting for interest. The expected payment on the UAL for a fiscal year is equal to the Expected Employer Contribution for the fiscal year minus the Expected Normal Cost for the year. The Employer Contribution for the first fiscal year is determined by the actuarial valuation two years ago and the contribution for the second year is from the actuarial valuation one year ago. The Normal Cost Rate for each of the two fiscal years is assumed to be the same as the rate determined by the current valuation. All expected dollar amounts are determined by multiplying the rate by the expected payroll for the applicable fiscal year, based on payroll as of the valuation date.
Reason for Base Date
Established
Amorti-zation Period
Balance 6/30/15
Expected Payment 2015-16
Balance 6/30/16
Expected Payment 2016-17
Balance 6/30/17
Scheduled Payment for
2017-18
FRESH START 06/30/05 20 $6,286,562 $447,535 $6,294,039 $460,961 $6,288,158 $474,790
ASSUMPTION CHANGE 06/30/09 14 $2,689,645 $235,591 $2,647,102 $242,659 $2,594,041 $249,938
SPECIAL (GAIN)/LOSS 06/30/09 24 $4,404,250 $284,862 $4,439,218 $293,408 $4,467,948 $302,210
SPECIAL (GAIN)/LOSS 06/30/10 25 $(108,484) $(6,876) $(109,491) $(7,082) $(110,361) $(7,294)
ASSUMPTION CHANGE 06/30/11 16 $2,617,800 $211,635 $2,594,707 $217,984 $2,563,299 $224,524
SPECIAL (GAIN)/LOSS 06/30/11 26 $(1,430,071) $(88,922) $(1,445,130) $(91,590) $(1,458,553) $(94,337)
PAYMENT (GAIN)/LOSS 06/30/12 27 $(18,636,834) $(1,138,227) $(18,854,457) $(1,172,374) $(19,052,998) $(1,207,545)
(GAIN)/LOSS 06/30/12 27 $20,665,970 $1,262,155 $20,907,288 $1,300,019 $21,127,446 $1,339,020
(GAIN)/LOSS 06/30/13 28 $18,482,209 $259,953 $19,598,850 $535,503 $20,513,542 $827,352
ASSUMPTION CHANGE 06/30/14 19 $11,615,053 $(347,336) $12,846,308 $244,692 $13,556,079 $504,066
(GAIN)/LOSS 06/30/14 29 $(11,764,222) $(16,005) $(12,629,944) $(177,641) $(13,393,008) $(365,940)
(GAIN)/LOSS 06/30/15 30 $6,884,707 $98,623 $7,298,806 $110,526 $7,731,621 $108,746
TOTAL $41,706,585 $1,202,988 $43,587,296 $1,957,065 $44,827,214 $2,355,530

CALPERS ACTUARIAL VALUATION - June 30, 2015 SAFETY PLAN OF THE COUNTY OF BUTTE CalPERS ID: 7607918484
Page 20 Page 16
30-Year Amortization Schedule and Alternatives
The amortization schedule on the previous page shows the minimum contributions required according to CalPERS amortization policy. There has been considerable interest from many agencies in paying off these unfunded accrued liabilities sooner and the possible savings in doing so. As a result, we have provided alternate amortization schedules to help analyze the current amortization schedule and illustrate the advantages of accelerating unfunded liability payments. Shown on the following page are future year amortization payments based on 1) the current amortization schedule reflecting the individual bases and remaining periods shown on the previous page, and 2) alternate “fresh start” amortization schedules using two sample periods that would both result in interest savings relative to the current amortization schedule. Note that the payments under each alternate scenario increase by 3 percent for each year into the future. The schedules do not attempt to reflect any experience after June 30, 2015 that may deviate from the actuarial assumptions. Therefore, future amortization payments displayed in the Current Amortization Schedule may not match projected amortization payments
shown in connection with Projected Employer Contributions provided elsewhere in this report. The Current Amortization Schedule typically contains individual bases that are both positive and negative. Positive bases result from plan changes, assumption changes or plan experience that result in increases to unfunded liability. Negative bases result from plan changes, assumption changes or plan experience that result in decreases to unfunded liability. The combination of positive and negative bases within an amortization schedule can result in unusual or problematic circumstances in future years such as:
A positive total unfunded liability with a negative total payment, A negative total unfunded liability with a positive total payment, or Total payments that completely amortize the unfunded liability over a very short period of time
In any year where one of the above scenarios occurs, the actuary will consider corrective action such as replacing the existing unfunded liability bases with a single “fresh start” base and amortizing it over a reasonable period. The Current Amortization Schedule on the following page may appear to show that, based on the current amortization bases, one of the above scenarios will occur at some point in the future. It is impossible to know today whether such a scenario will in fact arise since there will be additional bases added to the amortization schedule in each future year. Should such a scenario arise in any future year, the actuary will take appropriate action based on guidelines in the CalPERS amortization policy. For purposes of this display, total payments include any negative payments. Therefore, the amount of estimated savings may be understated to the extent that negative payments appear in the current schedule.

CALPERS ACTUARIAL VALUATION - June 30, 2015 SAFETY PLAN OF THE COUNTY OF BUTTE CalPERS ID: 7607918484
Page 17
30-Year Amortization Schedule and Alternatives
Alternate Schedules
Current Amortization
Schedule 20 Year Amortization 15 Year Amortization
Date Balance Payment Balance Payment Balance Payment
6/30/2017 44,827,214 2,355,530 44,827,214 3,384,698 44,827,214 4,109,290
6/30/2018 45,746,990 2,893,397 44,679,925 3,486,239 43,928,653 4,232,569
6/30/2019 46,178,076 3,461,414 44,416,310 3,590,826 42,834,881 4,359,546
6/30/2020 46,052,560 3,759,554 44,024,486 3,698,551 41,527,424 4,490,332
6/30/2021 45,608,515 3,994,734 43,491,583 3,809,507 39,986,306 4,625,042
6/30/2022 44,887,324 4,114,576 42,803,671 3,923,793 38,189,933 4,763,793
6/30/2023 43,987,787 4,238,013 41,945,671 4,041,506 36,114,972 4,906,707
6/30/2024 42,892,805 4,365,155 40,901,274 4,162,752 33,736,213 5,053,908
6/30/2025 41,583,875 4,496,110 39,652,836 4,287,634 31,026,425 5,205,525
6/30/2026 40,041,000 4,630,991 38,181,286 4,416,263 27,956,203 5,361,691
6/30/2027 38,242,561 4,769,920 36,466,003 4,548,751 24,493,799 5,522,542
6/30/2028 36,165,193 4,913,020 34,484,708 4,685,214 20,604,940 5,688,218
6/30/2029 33,783,653 5,060,411 32,213,328 4,825,770 16,252,641 5,858,865
6/30/2030 31,070,683 5,212,221 29,625,863 4,970,543 11,396,988 6,034,631
6/30/2031 27,996,836 4,990,537 26,694,234 5,119,659 5,994,924 6,215,670
6/30/2032 24,922,302 4,747,592 23,388,125 5,273,249
6/30/2033 21,869,065 4,125,285 19,674,814 5,431,447
6/30/2034 19,232,057 3,832,473 15,518,981 5,594,390
6/30/2035 16,700,873 3,518,376 10,882,517 5,762,222
6/30/2036 14,305,507 3,181,987 5,724,308 5,935,088
6/30/2037 12,079,268 2,419,922
6/30/2038 10,476,185 2,492,519
6/30/2039 8,677,601 2,567,295
6/30/2040 6,666,592 2,644,312
6/30/2041 4,424,906 1,548,699
6/30/2042 3,151,046 1,416,101
6/30/2043 1,919,130 1,227,351
6/30/2044 790,523 524,404
6/30/2045 306,097 78,982
6/30/2046 247,165 256,266
Totals 97,837,147 90,948,102 76,428,329
Estimated Savings 6,889,045 21,408,818

CALPERS ACTUARIAL VALUATION - June 30, 2015 SAFETY PLAN OF THE COUNTY OF BUTTE CalPERS ID: 7607918484
Page 18
Reconciliation of Required Employer
Contributions
Normal Cost (% of Payroll)
1. For Period 7/1/16 – 6/30/17
a) Employer Normal Cost 17.098%
b) Employee Contribution 8.827%
c) Total Normal Cost 25.925%
2. Effect of changes since the prior year annual valuation
a) Effect of changes in demographics results (0.440%)
b) Effect of plan changes 0.000%
c) Effect of changes in assumptions 0.000%
d) Net effect of the changes above [sum of (a) through (c)] (0.440%)
3. For Period 7/1/17 – 6/30/18
a) Employer Normal Cost 16.476%
b) Employee Contribution 9.009%
c) Total Normal Cost 25.485%
Employer Normal Cost Change [(3a) – (1a)] (0.622%)
Employee Contribution Change [(3b) – (1b)] 0.182%
Unfunded Liability Contribution ($)
1. For Period 7/1/16 – 6/30/17 1,846,539
2. Effect of changes since the prior year annual valuation
a) Effect of changes in demographics and financial results 108,746
b) Effect of plan changes 0
c) Effect of changes in assumptions 0
d) Effect of progression of amortization payments
400,245
e) Effect of changes due to Fresh Start 0
f) Effect of elimination of amortization base 0
g) Net effect of the changes above [sum of (a) through (f)] 508,991
3. For Period 7/1/17 – 6/30/18 [(1)+(2g)] 2,355,530
The amounts shown for the period 7/1/16 – 6/30/17 may be different if a prepayment of unfunded actuarial liability is made or a plan change became effective after the prior year’s actuarial valuation was performed.

CALPERS ACTUARIAL VALUATION - June 30, 2015 SAFETY PLAN OF THE COUNTY OF BUTTE CalPERS ID: 7607918484
Page 19
Employer Contribution History
The table below provides a recent history of the required employer contributions for the plan, as determined by the annual actuarial valuation. It does not account for prepayments or benefit changes made during a fiscal year.
Required By Valuation
Fiscal Year
Employer Normal Cost
Unfunded Rate
Unfunded Liability Payment ($)
2012 - 13 15.206% 4.330% N/A
2013 - 14 15.488% 4.349% N/A
2014 - 15 15.484% 6.137% N/A
2015 - 16 15.581% 7.377% N/A
2016 - 17 17.098% 9.430% N/A
2017 - 18 16.476% N/A 2,355,530
Funding History
The table below shows the recent history of the actuarial accrued liability, the market value of assets, the funded ratio and the annual covered payroll.
Valuation
Date
Accrued Liability
Market Value
of Assets (MVA)
Unfunded Liability
Funded Ratio
Annual
Covered Payroll
06/30/10 $ 112,862,174 $ 78,382,010 $ 34,480,164 69.4% $ 16,802,391
06/30/11 120,716,989 94,577,294 26,139,695 78.3% 16,885,154
06/30/12 128,784,164 94,291,436 34,492,728 73.2% 17,485,609
06/30/13 137,952,080 105,882,380 32,069,700 76.8% 18,206,175
06/30/14 157,011,849 123,827,211 33,184,638 78.9% 17,919,947
06/30/15 167,466,686 125,760,101 41,706,585 75.1% 18,690,187

RISK ANALYSIS
ANALYSIS OF FUTURE INVESTMENT RETURN SCENARIOS
ANALYSIS OF DISCOUNT RATE SENSITIVITY
VOLATILITY RATIOS
HYPOTHETICAL TERMINATION LIABILITY

CALPERS ACTUARIAL VALUATION - June 30, 2015 SAFETY PLAN OF THE COUNTY OF BUTTE CalPERS ID: 7607918484
Page 21
Analysis of Future Investment Return Scenarios
The investment return for Fiscal Year 2015-16 was not known at the time this report was produced. The investment return in Fiscal Year 2015-16 as of April 30, 2016 is 0.0 percent before administrative expenses. For purposes of projecting future employer contributions, we are assuming a 0.0 percent investment return for Fiscal Year 2015-16. The investment return realized during a fiscal year first affects the required contribution for the fiscal year two years later. For example, the investment return for Fiscal Year 2015-16 will first be reflected in the June 30, 2016 actuarial valuation that will be used to set the employer contribution for Fiscal Year 2018-19. The Fiscal Year 2016-17 investment return will first be reflected in the June 30, 2017 actuarial valuation that will be used to set the employer contribution for Fiscal Year 2019-20 and so forth. As part of this report, a sensitivity analysis was performed to determine the effects of various investment returns during fiscal years 2016-17, 2017-18 and 2018-19 on the 2019-20, 2020-21 and 2021-22 employer
contributions. Once again, the projections assume that all other actuarial assumptions will be realized and that no further changes to assumptions, contributions, benefits, or funding will occur. Five different investment return scenarios were selected. The first scenario is a -3.8 percent return for each of the 2016-17, 2017-18, and 2018-19 fiscal years.
Based on the current investment allocation, this is what one would expect if the markets were to give us about a 5th percentile return from July 1, 2016 through June 30, 2019.
The second scenario is a 2.8 percent return for each of the 2016-17, 2017-18, and 2018-19 fiscal years. Based on the current investment allocation, this is what one would expect if the markets were to give us about a 25th percentile return from July 1, 2016 through June 30, 2019.
The third scenario is a 7.5 percent return for each of the 2016-17, 2017-18, and 2018-19 fiscal years. Based on the current investment allocation, this is what one would expect if the markets were to give us about a 49th percentile return from July 1, 2016 through June 30, 2019.
The fourth scenario is a 12.0 percent return for each of the 2016-17, 2017-18, and 2018-19 fiscal years. Based on the current investment allocation, this is what one would expect if the markets were to give us about a 75th percentile return from July 1, 2016 through June 30, 2019.
Finally, the last scenario is an 18.9 percent return for each of the 2016-17, 2017-18, and 2018-19 fiscal years. Based on the current investment allocation, this is what one would expect if the markets were to give us about a 95th percentile return from July 1, 2016 through June 30, 2019.
The table below shows the estimated projected contributions and the estimated increases for the plan under the five different scenarios.
2016-19 Investment Return Scenario
Fiscal Year Estimated Change Between 2018-19
and 2021-22 2019-20 2020-21 2021-22
(3.8%)
Normal Cost 16.5% 16.5% 16.5% 0.0%
UAL Contribution $4,005,981 $4,941,072 $6,065,831 $3,019,666
2.8%
Normal Cost 16.5% 16.5% 16.5% 0.0%
UAL Contribution $3,871,722 $4,541,270 $5,271,725 $2,225,560
7.5%
Normal Cost 16.5% 16.5% 16.5% 0.0%
UAL Contribution $3,776,116 $4,245,769 $4,662,469 $1,616,304
12.0%
Normal Cost 16.8% 17.1% 17.4% 0.9%
UAL Contribution $3,688,426 $3,983,180 $4,120,927 $1,074,762
18.9%
Normal Cost 17.4% 18.4% 19.4% 2.9%
UAL Contribution $3,557,883 $3,591,540 $3,300,870 $254,705

CALPERS ACTUARIAL VALUATION - June 30, 2015 SAFETY PLAN OF THE COUNTY OF BUTTE CalPERS ID: 7607918484
Page 22
For the last two scenarios in the table above the results incorporate the impact of CalPERS Risk Mitigation Policy. A 12.0% return would result in a reduction of the discount rate by 0.05% and a return of 18.9% would reduce the discount rate by 0.15%. Reducing the discount rate increases both the plan’s accrued liability and normal cost. While the projections reflect estimated changes to the normal cost due to lower discount rates, they do not reflect the possible increase in the PEPRA member contribution rate in such scenarios. More details about the Risk Mitigation policy can be found on our website. The projected normal cost percentages do not reflect that the normal cost will decline over time as new employees are hired into PEPRA or other lower cost benefit tiers.
Analysis of Discount Rate Sensitivity
The following analysis looks at the Fiscal Year 2017-18 total normal cost rates and liabilities under two different discount rate scenarios. Shown below are the total normal cost rates assuming discount rates that
are 1 percent lower and 1 percent higher than the current valuation discount rate. This analysis shows the potential plan impacts if the PERF were to realize investment returns of 6.50 percent or 8.50 percent over the long-term. This type of analysis gives the reader a sense of the long-term risk to required contributions.
Sensitivity Analysis
As of June 30, 2015 6.50% Discount Rate (-1%)
7.50% Discount Rate (assumed rate)
8.50% Discount Rate (+1%)
Plan’s Total Normal Cost 31.943% 25.485% 20.558%
Accrued Liability $191,846,244 $167,466,686 $147,504,183
Unfunded Accrued Liability $66,086,143 $41,706,585 $21,744,082

CALPERS ACTUARIAL VALUATION - June 30, 2015 SAFETY PLAN OF THE COUNTY OF BUTTE CalPERS ID: 7607918484
Page 23
Volatility Ratios
The actuarial calculations supplied in this communication are based on a number of assumptions about long-term demographic and economic behavior. Unless these assumptions (terminations, deaths, disabilities, retirements, salary growth, and investment return) are exactly realized each year, there will be differences on a year-to-year basis. The year-to-year differences between actual experience and the assumptions are called actuarial gains and losses and serve to lower or raise required employer contributions from one year to the next. Therefore, employer contributions will inevitably fluctuate, especially due to the ups and downs of investment returns. Asset Volatility Ratio (AVR) Plans that have higher asset-to-payroll ratios experience more volatile employer contributions (as a percentage of payroll) due to investment return. For example, a plan with an asset-to-payroll ratio of 8 may experience twice the contribution volatility due to investment return volatility than a plan with an asset-to-
payroll ratio of 4. Shown below is the asset volatility ratio, a measure of the plan’s current volatility. It should be noted that this ratio is a measure of the current situation. It increases over time but generally tends to stabilize as the plan matures. Liability Volatility Ratio (LVR) Plans that have higher liability-to-payroll ratios experience more volatile employer contributions (as a percentage of payroll) due to investment return and changes in liability. For example, a plan with a liability-to-payroll ratio of 8 is expected to have twice the contribution volatility of a plan with a liability-to-payroll ratio of 4. The liability volatility ratio is also included in the table below. It should be noted that this ratio indicates a longer-term potential for contribution volatility. The asset volatility ratio, described above, will tend to move closer to the liability volatility ratio as the plan matures.
Contribution Volatility As of June 30, 2015
1. Market Value of Assets without Receivables $ 125,571,135
2. Payroll 18,690,187
3. Asset Volatility Ratio (AVR) [(1) / ( 2)] 6.7
4. Accrued Liability $ 167,466,686
5. Liability Volatility Ratio (LVR) [(4) / (2)] 9.0

CALPERS ACTUARIAL VALUATION - June 30, 2015 SAFETY PLAN OF THE COUNTY OF BUTTE CalPERS ID: 7607918484
Page 24
Hypothetical Termination Liability
The hypothetical termination liability is an estimate of the financial position of the plan had the contract with CalPERS been terminated as of June 30, 2015. The plan liability on a termination basis is calculated differently compared to the plan’s ongoing funding liability. For this hypothetical termination liability calculation, both compensation and service are frozen as of the valuation date and no future pay increases or service accruals are assumed. A more conservative investment policy and asset allocation strategy was adopted by the CalPERS Board for the Terminated Agency Pool. The Terminated Agency Pool has limited funding sources since no future employer contributions will be made. Therefore, expected benefit payments are secured by risk-free assets and benefit security for members is increased while limiting the funding risk. However, this asset allocation has a lower expected rate of return than the PERF and consequently, a lower discount rate assumption. The lower discount rate for the Terminated Agency Pool results in higher liabilities for terminated plans.
The effective termination discount rate will depend on actual market rates of return for risk-free securities on the date of termination. As market discount rates are variable the table below shows a range for the hypothetical termination liability based on the lowest and highest interest rates observed during an approximate 2-year period centered around the valuation date.
Market Value of
Assets (MVA)
Hypothetical Termination Liability1,2
@ 2.00%
Funded Status
Unfunded Termination
Liability @ 2.00%
Hypothetical Termination
Liability1,2 @ 3.25%
Funded Status
Unfunded Termination
Liability @ 3.25%
$125,760,101 $339,140,631 37.1% $213,380,530 $275,704,436 45.6% $149,944,335
1 The hypothetical liabilities calculated above include a 7 percent mortality contingency load in accordance with Board
policy. Other actuarial assumptions, such as wage and inflation assumptions, can be found in Appendix A.
2 The current discount rate assumption used for termination valuations is a weighted average of the 10-year and 30-year U.S. Treasury yields where the weights are based on matching asset and liability durations as of the termination date. The discount rates used in the table are based on 20-year Treasury bonds, rounded to the nearest quarter percentage point, which is a good proxy for most plans. The 20-year Treasury yield was 2.75 percent on June 30, 2015.
In order to terminate the plan, you must first contact our Retirement Services Contract Unit to initiate a Resolution of Intent to Terminate. The completed Resolution will allow the plan actuary to give you a preliminary termination valuation with a more up-to-date estimate of the plan liabilities. CalPERS advises you to consult with the plan actuary before beginning this process.

PLAN’S MAJOR BENEFIT PROVISIONS

CALPERS ACTUARIAL VALUATION – June 30, 2015 SAFETY PLAN OF THE COUNTY OF BUTTE
CalPERS ID: 7607918484
Plan’s Major Benefit Options
Shown below is a summary of the major optional benefits for which your agency has contracted. A description of principal standard and optional plan provisions is in the following section of this Appendix.
Contract Package
Active Peace
Active Local Sheriff
Active Peace
Active Local Sheriff
Receiving Local Sheriff
Receiving Peace
Benefit Provision
Benefit Formula 2.0% @ 50 3.0% @ 50 2.7% @ 57 2.7% @ 57 Social Security Coverage Yes Yes Yes Yes Full/Modified Modified Modified Full Full
Employee Contribution Rate 9.00% 9.00% 11.50% 11.50% Final Average Compensation Period One Year One Year Three Year Three Year Sick Leave Credit Yes Yes Yes Yes Non-Industrial Disability Standard Standard Standard Standard Industrial Disability Yes Yes Yes Yes Pre-Retirement Death Benefits
Optional Settlement 2W Yes Yes Yes Yes 1959 Survivor Benefit Level No No No No Special Yes Yes Yes Yes Alternate (firefighters) No No No No
Post-Retirement Death Benefits
Lump Sum $2000 $2000 $2000 $2000 $2000 $2000 Survivor Allowance (PRSA) No No No No No No
COLA 2% 2% 2% 2% 2% 2%
Page 26

APPENDICES
APPENDIX A – ACTUARIAL METHODS AND ASSUMPTIONS
APPENDIX B – PRINCIPAL PLAN PROVISIONS
APPENDIX C – PARTICIPANT DATA
APPENDIX D – DEVELOPMENT OF PEPRA MEMBER CONTRIBUTION RATES
APPENDIX E – GLOSSARY OF ACTUARIAL TERMS

APPENDIX A
ACTUARIAL METHODS AND ASSUMPTIONS
ACTUARIAL DATA
ACTUARIAL METHODS
ACTUARIAL ASSUMPTIONS
MISCELLANEOUS

CALPERS ACTUARIAL VALUATION – June 30, 2015 APPENDIX A ACTUARIAL METHODS AND ASSUMPTIONS
A-1
Actuarial Data
As stated in the Actuarial Certification, the data which serves as the basis of this valuation has been obtained from the various CalPERS databases. We have reviewed the valuation data and believe that it is reasonable and appropriate in aggregate. We are unaware of any potential data issues that would have a material effect on the results of this valuation, except that data does not always contain the latest salary information for former members now in reciprocal systems and does not recognize the potential for unusually large salary deviation in certain cases such as elected officials. Therefore, salary information in these cases may not be accurate. These situations are relatively infrequent, however, and when they do occur, they generally do not have a material impact on the required employer contributions.
Actuarial Methods
Actuarial Cost Method The actuarial cost method used is the Entry Age Normal Cost Method. Under this method, projected benefits are determined for all members and the associated liabilities are spread in a manner that produces level annual cost as a percentage of pay in each year from the member’s age of hire (entry age) to their assumed retirement age on the valuation date. The cost allocated to the current fiscal year is called the normal cost. The actuarial accrued liability for active members is then calculated as the portion of the total cost of the plan allocated to prior years. The actuarial accrued liability for members currently receiving benefits and for members entitled to deferred benefits is equal to the present value of the benefits expected to be paid. No normal costs are applicable for these participants. Amortization of Unfunded Actuarial Accrued Liability The excess of the total actuarial accrued liability over the market value of plan assets is called the unfunded actuarial accrued liability (UAL). Funding requirements are determined by adding the normal cost and an
amortization payment toward the unfunded liability. Commencing with the June 30, 2013 valuation, all new gains or losses are tracked and amortized over a fixed 30-year period with a 5 year ramp up at the beginning and a 5 year ramp down at the end of the amortization period. All changes in liability due to plan amendments (other than golden handshakes) are amortized over a 20-year period with no ramp. Changes in actuarial assumptions, or changes in actuarial methodology are amortized over a 20-year period with a 5 year ramp up at the beginning and a 5 year ramp down at the end of the amortization period. Changes in unfunded accrued liability due to a Golden Handshake will be amortized over a period of 5 years. Exceptions for Inconsistencies: An exception to the amortization rules above is used whenever their application results in inconsistencies. In these cases, a “fresh start” approach is used. This means that the current unfunded actuarial liability is projected and amortized over a set number of years. For example, a fresh start is needed in the following situations:
1) When a positive payment would be required on a negative unfunded actuarial liability (or conversely a negative payment on a positive unfunded actuarial liability); or
2) When there are excess assets, rather than an unfunded liability. In this situation, a 30-year fresh start is used.
It should be noted that the actuary may determine that a fresh start is necessary under other circumstances. In all cases of a fresh start, the period is set by the actuary at what is deemed appropriate; however, the period will not be greater than 30 years.
CALPERS ACTUARIAL VALUATION – June 30, 2015 APPENDIX A ACTUARIAL METHODS AND ASSUMPTIONS
A-2
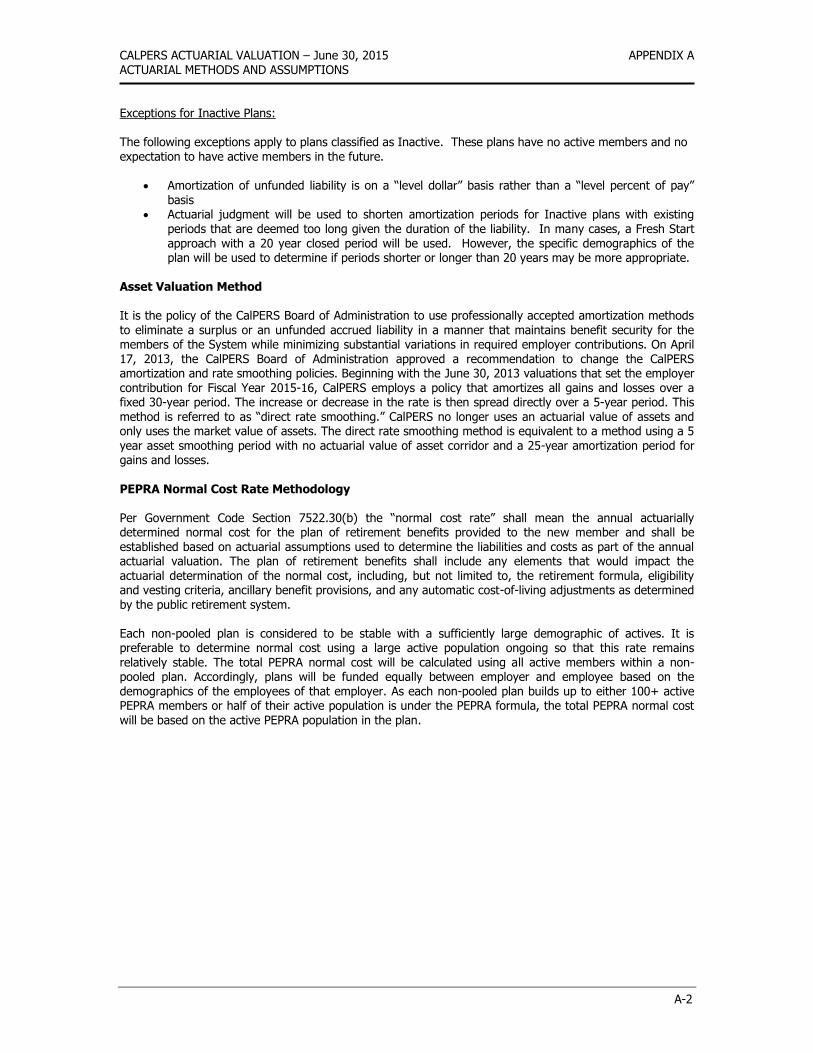
Exceptions for Inactive Plans: The following exceptions apply to plans classified as Inactive. These plans have no active members and no expectation to have active members in the future.
Amortization of unfunded liability is on a “level dollar” basis rather than a “level percent of pay” basis
Actuarial judgment will be used to shorten amortization periods for Inactive plans with existing periods that are deemed too long given the duration of the liability. In many cases, a Fresh Start approach with a 20 year closed period will be used. However, the specific demographics of the plan will be used to determine if periods shorter or longer than 20 years may be more appropriate.
Asset Valuation Method It is the policy of the CalPERS Board of Administration to use professionally accepted amortization methods to eliminate a surplus or an unfunded accrued liability in a manner that maintains benefit security for the members of the System while minimizing substantial variations in required employer contributions. On April 17, 2013, the CalPERS Board of Administration approved a recommendation to change the CalPERS amortization and rate smoothing policies. Beginning with the June 30, 2013 valuations that set the employer contribution for Fiscal Year 2015-16, CalPERS employs a policy that amortizes all gains and losses over a fixed 30-year period. The increase or decrease in the rate is then spread directly over a 5-year period. This method is referred to as “direct rate smoothing.” CalPERS no longer uses an actuarial value of assets and only uses the market value of assets. The direct rate smoothing method is equivalent to a method using a 5 year asset smoothing period with no actuarial value of asset corridor and a 25-year amortization period for gains and losses. PEPRA Normal Cost Rate Methodology Per Government Code Section 7522.30(b) the “normal cost rate” shall mean the annual actuarially determined normal cost for the plan of retirement benefits provided to the new member and shall be established based on actuarial assumptions used to determine the liabilities and costs as part of the annual actuarial valuation. The plan of retirement benefits shall include any elements that would impact the
actuarial determination of the normal cost, including, but not limited to, the retirement formula, eligibility and vesting criteria, ancillary benefit provisions, and any automatic cost-of-living adjustments as determined by the public retirement system. Each non-pooled plan is considered to be stable with a sufficiently large demographic of actives. It is preferable to determine normal cost using a large active population ongoing so that this rate remains relatively stable. The total PEPRA normal cost will be calculated using all active members within a non-pooled plan. Accordingly, plans will be funded equally between employer and employee based on the demographics of the employees of that employer. As each non-pooled plan builds up to either 100+ active PEPRA members or half of their active population is under the PEPRA formula, the total PEPRA normal cost will be based on the active PEPRA population in the plan.

CALPERS ACTUARIAL VALUATION – June 30, 2015 APPENDIX A ACTUARIAL METHODS AND ASSUMPTIONS
A-3
Actuarial Assumptions
In 2014, CalPERS completed a 2-year asset liability management study incorporating actuarial assumptions and strategic asset allocation. On February 19, 2014, the CalPERS Board of Administration adopted relatively modest changes to the current asset allocation that will reduce the expected volatility of returns. The adopted asset allocation is expected to have a long-term blended return that continues to support a discount rate assumption of 7.5 percent. The Board also approved several changes to the demographic assumptions that more closely align with actual experience. The most significant of these is mortality improvement to acknowledge the greater life expectancies we are seeing in our membership and expected continued improvements. The new actuarial assumptions were first used in the June 30, 2014 valuation to set the Fiscal Year 2016-17 contribution for public agency employers. The increase in liability due to new actuarial assumptions is amortized over a 20-year period with a 5-year ramp-up/ramp-down in accordance with Board policy. These new actuarial assumptions are set forth in this section. For more details and additional rationale for the selection of the actuarial assumptions, please refer to the
CalPERS Experience Study and Review of Actuarial Assumptions report from January 2014 that can be found on the CalPERS website under: “Forms and Publications”. Click on “View All” and search for Experience Study. All actuarial assumptions (except the discount rates used for the hypothetical termination liability) represent an estimate of future experience rather than observations of the estimates inherent in market data. Economic Assumptions
Discount Rate 7.5 percent compounded annually (net of expenses). This assumption is used for all plans.
Termination Liability Discount Rate The current discount rate assumption used for termination valuations is a weighted average of the 10-year and 30-year U.S. Treasury yields where the weights are based on matching asset and liability durations as of the termination date.
The hypothetical termination liabilities in this report are calculated using an observed range of market interest rates. This range is based on the lowest and highest 20-year Treasury bond observed during an approximate 2-year period centered around the valuation date. The 20-year Treasury bond has a similar duration to most plan liabilities and serves as a good proxy for the termination discount rate. The 20-year Treasury yield was 2.75 percent on June 30, 2015.

CALPERS ACTUARIAL VALUATION – June 30, 2015 APPENDIX A ACTUARIAL METHODS AND ASSUMPTIONS
A-4
Salary Growth
Annual increases vary by category, entry age, and duration of service. A sample of assumed increases are shown below.
Public Agency Miscellaneous
Duration of Service (Entry Age 20) (Entry Age 30) (Entry Age 40)
0 0.1220 0.1160 0.1020
1 0.0990 0.0940 0.0830
2 0.0860 0.0810 0.0710
3 0.0770 0.0720 0.0630
4 0.0700 0.0650 0.0570
5 0.0640 0.0600 0.0520
10 0.0460 0.0430 0.0390
15 0.0420 0.0400 0.0360
20 0.0390 0.0380 0.0340
25 0.0370 0.0360 0.0330
30 0.0350 0.0340 0.0320
Public Agency Fire
Duration of Service (Entry Age 20) (Entry Age 30) (Entry Age 40)
0 0.2000 0.1980 0.1680
1 0.1490 0.1460 0.1250
2 0.1200 0.1160 0.0990
3 0.0980 0.0940 0.0810
4 0.0820 0.0780 0.0670
5 0.0690 0.0640 0.0550
10 0.0470 0.0460 0.0420
15 0.0440 0.0420 0.0390
20 0.0420 0.0390 0.0360
25 0.0400 0.0370 0.0340
30 0.0380 0.0360 0.0340
Public Agency Police
Duration of Service (Entry Age 20) (Entry Age 30) (Entry Age 40)
0 0.1500 0.1470 0.1310
1 0.1160 0.1120 0.1010
2 0.0950 0.0920 0.0830
3 0.0810 0.0780 0.0700
4 0.0700 0.0670 0.0600
5 0.0610 0.0580 0.0520
10 0.0450 0.0430 0.0370
15 0.0450 0.0430 0.0370
20 0.0450 0.0430 0.0370
25 0.0450 0.0430 0.0370
30 0.0450 0.0430 0.0370

CALPERS ACTUARIAL VALUATION – June 30, 2015 APPENDIX A ACTUARIAL METHODS AND ASSUMPTIONS
A-5
Salary Growth (continued)
Public Agency County Peace Officers
Duration of Service (Entry Age 20) (Entry Age 30) (Entry Age 40)
0 0.1770 0.1670 0.1500
1 0.1340 0.1260 0.1140
2 0.1080 0.1030 0.0940
3 0.0900 0.0860 0.0790
4 0.0760 0.0730 0.0670
5 0.0650 0.0620 0.0580
10 0.0470 0.0450 0.0410
15 0.0460 0.0450 0.0390
20 0.0460 0.0450 0.0380
25 0.0460 0.0450 0.0380
30 0.0460 0.0440 0.0380
Schools
Duration of Service (Entry Age 20) (Entry Age 30) (Entry Age 40)
0 0.0900 0.0880 0.0820
1 0.0780 0.0750 0.0700
2 0.0700 0.0680 0.0630
3 0.0650 0.0630 0.0580
4 0.0610 0.0590 0.0540
5 0.0580 0.0560 0.0510
10 0.0460 0.0450 0.0410
15 0.0420 0.0410 0.0380
20 0.0390 0.0380 0.0350
25 0.0370 0.0350 0.0330
30 0.0350 0.0330 0.0310
The Miscellaneous salary scale is used for Local Prosecutors. The Police salary scale is used for Other Safety, Local Sheriff, and School Police.
Overall Payroll Growth
3.00 percent compounded annually (used in projecting the payroll over which the unfunded liability is amortized). This assumption is used for all plans.
Inflation 2.75 percent compounded annually. This assumption is used for all plans.
Non-valued Potential Additional Liabilities The potential liability loss for a cost-of-living increase exceeding the 2.75 percent inflation assumption, and any potential liability loss from future member service purchases are not reflected in the valuation.
Miscellaneous Loading Factors
Credit for Unused Sick Leave Total years of service is increased by 1 percent for those plans that have accepted the provision providing Credit for Unused Sick Leave.

CALPERS ACTUARIAL VALUATION – June 30, 2015 APPENDIX A ACTUARIAL METHODS AND ASSUMPTIONS
A-6
Conversion of Employer Paid Member Contributions (EPMC)
Total years of service is increased by the Employee Contribution Rate for those plans with the provision providing for the Conversion of Employer Paid Member Contributions (EPMC) during the final compensation period.
Norris Decision (Best Factors)
Employees hired prior to July 1, 1982 have projected benefit amounts increased in order to reflect the use of “Best Factors” in the calculation of optional benefit forms. This is due to a 1983 Supreme Court decision, known as the Norris decision, which required males and females to be treated equally in the determination of benefit amounts. Consequently, anyone already employed at that time is given the best possible conversion factor when optional benefits are determined. No loading is necessary for employees hired after July 1, 1982.
Termination Liability The termination liabilities include a 7 percent contingency load. This load is for unforeseen improvements in mortality.
Demographic Assumptions
Pre-Retirement Mortality Non-industrial death rates vary by age and gender. Industrial death rates vary by age. See sample rates in table below. The non-industrial death rates are used for all plans. The industrial death rates are used for safety plans (except for Local Prosecutor safety members where the corresponding miscellaneous plan does not have the Industrial Death Benefit).
Non-Industrial Death Industrial Death (Not Job-Related) (Job-Related)
Age Male Female Male and Female
20 0.00031 0.00020 0.00003 25 0.00040 0.00023 0.00007 30 0.00049 0.00025 0.00010 35 0.00057 0.00035 0.00012 40 0.00075 0.00050 0.00013 45 0.00106 0.00071 0.00014 50 0.00155 0.00100 0.00015 55 0.00228 0.00138 0.00016 60 0.00308 0.00182 0.00017 65 0.00400 0.00257 0.00018 70 0.00524 0.00367 0.00019 75 0.00713 0.00526 0.00020 80 0.00990 0.00814 0.00021
Miscellaneous plans usually have industrial death rates set to zero unless the agency has specifically contracted for industrial death benefits. If so, each non-industrial death rate shown above will be split into two components; 99 percent will become the non-industrial death rate and 1 percent will become the industrial death rate.

CALPERS ACTUARIAL VALUATION – June 30, 2015 APPENDIX A ACTUARIAL METHODS AND ASSUMPTIONS
A-7
Post-Retirement Mortality
Rates vary by age, type of retirement, and gender. See sample rates in table below. These rates are used for all plans.
Healthy Recipients
Non-Industrially Disabled Industrially Disabled (Not Job-Related) (Job-Related)
Age Male Female Male Female Male Female
50 0.00501 0.00466 0.01680 0.01158 0.00501 0.00466 55 0.00599 0.00416 0.01973 0.01149 0.00599 0.00416 60 0.00710 0.00436 0.02289 0.01235 0.00754 0.00518 65 0.00829 0.00588 0.02451 0.01607 0.01122 0.00838 70 0.01305 0.00993 0.02875 0.02211 0.01635 0.01395 75 0.02205 0.01722 0.03990 0.03037 0.02834 0.02319 80 0.03899 0.02902 0.06083 0.04725 0.04899 0.03910 85 0.06969 0.05243 0.09731 0.07762 0.07679 0.06251 90 0.12974 0.09887 0.14804 0.12890 0.12974 0.09887
95 0.22444 0.18489 0.22444 0.21746 0.22444 0.18489 100 0.32536 0.30017 0.32536 0.30017 0.32536 0.30017 105 0.58527 0.56093 0.58527 0.56093 0.58527 0.56093 110 1.00000 1.00000 1.00000 1.00000 1.00000 1.00000
The post-retirement mortality rates above include 20 years of projected on-going mortality improvement using Scale BB published by the Society of Actuaries.
Marital Status
For active members, a percentage who are married upon retirement is assumed according to member category as shown in the following table.
Member Category Percent Married
Miscellaneous Member 85% Local Police 90% Local Fire 90%
Other Local Safety 90% School Police 90%
Age of Spouse
It is assumed that female spouses are 3 years younger than male spouses. This assumption is used for all plans.
Terminated Members It is assumed that terminated members refund immediately if non-vested. Terminated members who are vested are assumed to follow the same service retirement pattern as active members but with a load to reflect the expected higher rates of retirement, especially at lower ages. The following table shows the load factors that are applied to the service retirement assumption for active members to obtain the service retirement pattern for separated vested members:
Age Load Factor Miscellaneous Load Factor Safety
50 190% 310%
51 110% 190% 52 110% 105%
53 through 54 100% 105% 55 100% 140%
56 and above 100% (no change) 100% (no change)
Termination with Refund Rates vary by entry age and service for miscellaneous plans. Rates vary by service for safety plans. See sample rates in tables below.

CALPERS ACTUARIAL VALUATION – June 30, 2015 APPENDIX A ACTUARIAL METHODS AND ASSUMPTIONS
A-8
Public Agency Miscellaneous
Duration of Service Entry Age 20 Entry Age 25 Entry Age 30 Entry Age 35 Entry Age 40 Entry Age 45
0 0.1742 0.1674 0.1606 0.1537 0.1468 0.1400
1 0.1545 0.1477 0.1409 0.1339 0.1271 0.1203
2 0.1348 0.1280 0.1212 0.1142 0.1074 0.1006
3 0.1151 0.1083 0.1015 0.0945 0.0877 0.0809
4 0.0954 0.0886 0.0818 0.0748 0.0680 0.0612
5 0.0212 0.0193 0.0174 0.0155 0.0136 0.0116
10 0.0138 0.0121 0.0104 0.0088 0.0071 0.0055
15 0.0060 0.0051 0.0042 0.0032 0.0023 0.0014
20 0.0037 0.0029 0.0021 0.0013 0.0005 0.0001
25 0.0017 0.0011 0.0005 0.0001 0.0001 0.0001
30 0.0005 0.0001 0.0001 0.0001 0.0001 0.0001
35 0.0001 0.0001 0.0001 0.0001 0.0001 0.0001
Public Agency Safety
Duration of Service Fire Police County Peace Officer
0 0.0710 0.1013 0.0997
1 0.0554 0.0636 0.0782
2 0.0398 0.0271 0.0566
3 0.0242 0.0258 0.0437
4 0.0218 0.0245 0.0414
5 0.0029 0.0086 0.0145
10 0.0009 0.0053 0.0089
15 0.0006 0.0027 0.0045
20 0.0005 0.0017 0.0020
25 0.0003 0.0012 0.0009
30 0.0003 0.0009 0.0006
35 0.0003 0.0009 0.0006
The police termination and refund rates are also used for Public Agency Local Prosecutors, Other Safety, Local Sheriff, and School Police.
Schools
Duration of
Service Entry Age 20 Entry Age 25 Entry Age 30 Entry Age 35 Entry Age 40 Entry Age 45
0 0.1730 0.1627 0.1525 0.1422 0.1319 0.1217
1 0.1585 0.1482 0.1379 0.1277 0.1174 0.1071
2 0.1440 0.1336 0.1234 0.1131 0.1028 0.0926
3 0.1295 0.1192 0.1089 0.0987 0.0884 0.0781
4 0.1149 0.1046 0.0944 0.0841 0.0738 0.0636
5 0.0278 0.0249 0.0221 0.0192 0.0164 0.0135
10 0.0172 0.0147 0.0122 0.0098 0.0074 0.0049
15 0.0115 0.0094 0.0074 0.0053 0.0032 0.0011
20 0.0073 0.0055 0.0038 0.0020 0.0002 0.0002
25 0.0037 0.0023 0.0010 0.0002 0.0002 0.0002
30 0.0015 0.0003 0.0002 0.0002 0.0002 0.0002
35 0.0002 0.0002 0.0002 0.0002 0.0002 0.0002

CALPERS ACTUARIAL VALUATION – June 30, 2015 APPENDIX A ACTUARIAL METHODS AND ASSUMPTIONS
A-9
Termination with Vested Benefits
Rates vary by entry age and service for miscellaneous plans. Rates vary by service for safety plans. See sample rates in tables below.
Public Agency Miscellaneous
Duration of Service Entry Age 20 Entry Age 25 Entry Age 30 Entry Age 35 Entry Age 40
5 0.0656 0.0597 0.0537 0.0477 0.0418
10 0.0530 0.0466 0.0403 0.0339 0.0000
15 0.0443 0.0373 0.0305 0.0000 0.0000
20 0.0333 0.0261 0.0000 0.0000 0.0000
25 0.0212 0.0000 0.0000 0.0000 0.0000
30 0.0000 0.0000 0.0000 0.0000 0.0000
35 0.0000 0.0000 0.0000 0.0000 0.0000
Public Agency Safety
Duration of
Service Fire Police
County Peace
Officer
5 0.0162 0.0163 0.0265
10 0.0061 0.0126 0.0204
15 0.0058 0.0082 0.0130
20 0.0053 0.0065 0.0074
25 0.0047 0.0058 0.0043
30 0.0045 0.0056 0.0030
35 0.0000 0.0000 0.0000
When a member is eligible to retire, the termination with vested benefits probability is set to
zero. After termination with vested benefits, a miscellaneous member is assumed to retire at age 59
and a safety member at age 54. The Police termination with vested benefits rates are also used for Public Agency Local
Prosecutors, Other Safety, Local Sheriff, and School Police.
Schools
Duration of
Service Entry Age 20 Entry Age 25 Entry Age 30 Entry Age 35 Entry Age 40
5 0.0816 0.0733 0.0649 0.0566 0.0482
10 0.0629 0.0540 0.0450 0.0359 0.0000
15 0.0537 0.0440 0.0344 0.0000 0.0000
20 0.0420 0.0317 0.0000 0.0000 0.0000
25 0.0291 0.0000 0.0000 0.0000 0.0000
30 0.0000 0.0000 0.0000 0.0000 0.0000
35 0.0000 0.0000 0.0000 0.0000 0.0000
CALPERS ACTUARIAL VALUATION – June 30, 2015 APPENDIX A ACTUARIAL METHODS AND ASSUMPTIONS
A-10
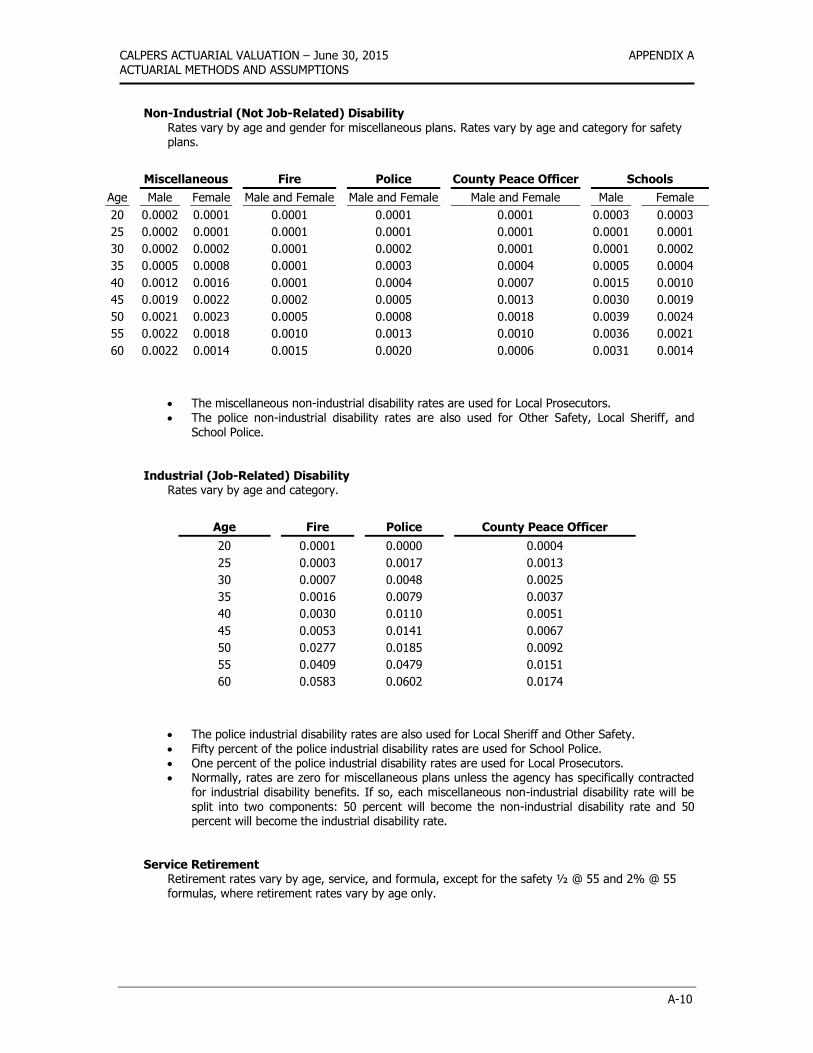
Non-Industrial (Not Job-Related) Disability
Rates vary by age and gender for miscellaneous plans. Rates vary by age and category for safety plans.
Miscellaneous Fire Police County Peace Officer Schools
Age Male Female Male and Female Male and Female Male and Female Male Female
20 0.0002 0.0001 0.0001 0.0001 0.0001 0.0003 0.0003
25 0.0002 0.0001 0.0001 0.0001 0.0001 0.0001 0.0001
30 0.0002 0.0002 0.0001 0.0002 0.0001 0.0001 0.0002
35 0.0005 0.0008 0.0001 0.0003 0.0004 0.0005 0.0004
40 0.0012 0.0016 0.0001 0.0004 0.0007 0.0015 0.0010
45 0.0019 0.0022 0.0002 0.0005 0.0013 0.0030 0.0019
50 0.0021 0.0023 0.0005 0.0008 0.0018 0.0039 0.0024
55 0.0022 0.0018 0.0010 0.0013 0.0010 0.0036 0.0021
60 0.0022 0.0014 0.0015 0.0020 0.0006 0.0031 0.0014
The miscellaneous non-industrial disability rates are used for Local Prosecutors. The police non-industrial disability rates are also used for Other Safety, Local Sheriff, and
School Police.
Industrial (Job-Related) Disability Rates vary by age and category.
Age Fire Police County Peace Officer
20 0.0001 0.0000 0.0004
25 0.0003 0.0017 0.0013
30 0.0007 0.0048 0.0025
35 0.0016 0.0079 0.0037
40 0.0030 0.0110 0.0051
45 0.0053 0.0141 0.0067
50 0.0277 0.0185 0.0092
55 0.0409 0.0479 0.0151
60 0.0583 0.0602 0.0174
The police industrial disability rates are also used for Local Sheriff and Other Safety. Fifty percent of the police industrial disability rates are used for School Police. One percent of the police industrial disability rates are used for Local Prosecutors. Normally, rates are zero for miscellaneous plans unless the agency has specifically contracted
for industrial disability benefits. If so, each miscellaneous non-industrial disability rate will be
split into two components: 50 percent will become the non-industrial disability rate and 50 percent will become the industrial disability rate.
Service Retirement
Retirement rates vary by age, service, and formula, except for the safety ½ @ 55 and 2% @ 55 formulas, where retirement rates vary by age only.

CALPERS ACTUARIAL VALUATION – June 30, 2015 APPENDIX A ACTUARIAL METHODS AND ASSUMPTIONS
A-11
Service Retirement
Public Agency Miscellaneous 1.5% @ 65
Duration of Service
Age 5 Years 10 Years 15 Years 20 Years 25 Years 30 Years
50 0.008 0.011 0.013 0.015 0.017 0.019
51 0.007 0.010 0.012 0.013 0.015 0.017
52 0.010 0.014 0.017 0.019 0.021 0.024
53 0.008 0.012 0.015 0.017 0.019 0.022
54 0.012 0.016 0.019 0.022 0.025 0.028
55 0.018 0.025 0.031 0.035 0.038 0.043
56 0.015 0.021 0.025 0.029 0.032 0.036
57 0.020 0.028 0.033 0.038 0.043 0.048
58 0.024 0.033 0.040 0.046 0.052 0.058
59 0.028 0.039 0.048 0.054 0.060 0.067
60 0.049 0.069 0.083 0.094 0.105 0.118
61 0.062 0.087 0.106 0.120 0.133 0.150
62 0.104 0.146 0.177 0.200 0.223 0.251
63 0.099 0.139 0.169 0.191 0.213 0.239
64 0.097 0.136 0.165 0.186 0.209 0.233
65 0.140 0.197 0.240 0.271 0.302 0.339
66 0.092 0.130 0.157 0.177 0.198 0.222
67 0.129 0.181 0.220 0.249 0.277 0.311
68 0.092 0.129 0.156 0.177 0.197 0.221
69 0.092 0.130 0.158 0.178 0.199 0.224
70 0.103 0.144 0.175 0.198 0.221 0.248
Public Agency Miscellaneous 2% @ 60
Duration of Service
Age 5 Years 10 Years 15 Years 20 Years 25 Years 30 Years
50 0.010 0.013 0.015 0.018 0.019 0.021
51 0.009 0.011 0.014 0.016 0.017 0.019
52 0.011 0.014 0.017 0.020 0.022 0.024
53 0.010 0.012 0.015 0.017 0.020 0.021
54 0.015 0.019 0.023 0.025 0.029 0.031
55 0.022 0.029 0.035 0.040 0.045 0.049
56 0.018 0.024 0.028 0.033 0.036 0.040
57 0.024 0.032 0.038 0.043 0.049 0.053
58 0.027 0.036 0.043 0.049 0.055 0.061
59 0.033 0.044 0.054 0.061 0.068 0.076
60 0.056 0.077 0.092 0.105 0.117 0.130
61 0.071 0.097 0.118 0.134 0.149 0.166
62 0.117 0.164 0.198 0.224 0.250 0.280
63 0.122 0.171 0.207 0.234 0.261 0.292
64 0.114 0.159 0.193 0.218 0.244 0.271
65 0.150 0.209 0.255 0.287 0.321 0.358
66 0.114 0.158 0.192 0.217 0.243 0.270
67 0.141 0.196 0.238 0.270 0.301 0.337
68 0.103 0.143 0.174 0.196 0.219 0.245
69 0.109 0.153 0.185 0.209 0.234 0.261
70 0.117 0.162 0.197 0.222 0.248 0.277

CALPERS ACTUARIAL VALUATION – June 30, 2015 APPENDIX A ACTUARIAL METHODS AND ASSUMPTIONS
A-12
Service Retirement
Public Agency Miscellaneous 2% @ 55
Duration of Service
Age 5 Years 10 Years 15 Years 20 Years 25 Years 30 Years
50 0.014 0.018 0.021 0.025 0.027 0.031
51 0.012 0.014 0.017 0.020 0.021 0.025
52 0.013 0.017 0.019 0.023 0.025 0.028
53 0.015 0.020 0.023 0.027 0.030 0.034
54 0.026 0.033 0.038 0.045 0.051 0.059
55 0.048 0.061 0.074 0.088 0.100 0.117
56 0.042 0.053 0.063 0.075 0.085 0.100
57 0.044 0.056 0.067 0.081 0.091 0.107
58 0.049 0.062 0.074 0.089 0.100 0.118
59 0.057 0.072 0.086 0.103 0.118 0.138
60 0.067 0.086 0.103 0.123 0.139 0.164
61 0.081 0.103 0.124 0.148 0.168 0.199
62 0.116 0.147 0.178 0.214 0.243 0.288
63 0.114 0.144 0.174 0.208 0.237 0.281
64 0.108 0.138 0.166 0.199 0.227 0.268
65 0.155 0.197 0.238 0.285 0.325 0.386
66 0.132 0.168 0.203 0.243 0.276 0.328
67 0.122 0.155 0.189 0.225 0.256 0.304
68 0.111 0.141 0.170 0.204 0.232 0.274
69 0.114 0.144 0.174 0.209 0.238 0.282
70 0.130 0.165 0.200 0.240 0.272 0.323
Public Agency Miscellaneous 2.5% @ 55
Duration of Service
Age 5 Years 10 Years 15 Years 20 Years 25 Years 30 Years
50 0.004 0.009 0.019 0.029 0.049 0.094
51 0.004 0.009 0.019 0.029 0.049 0.094
52 0.004 0.009 0.020 0.030 0.050 0.095
53 0.008 0.014 0.025 0.036 0.058 0.104
54 0.024 0.034 0.050 0.066 0.091 0.142
55 0.066 0.088 0.115 0.142 0.179 0.241
56 0.042 0.057 0.078 0.098 0.128 0.184
57 0.041 0.057 0.077 0.097 0.128 0.183
58 0.045 0.061 0.083 0.104 0.136 0.192
59 0.055 0.074 0.098 0.123 0.157 0.216
60 0.066 0.088 0.115 0.142 0.179 0.241
61 0.072 0.095 0.124 0.153 0.191 0.255
62 0.099 0.130 0.166 0.202 0.248 0.319
63 0.092 0.121 0.155 0.189 0.233 0.302
64 0.091 0.119 0.153 0.187 0.231 0.299
65 0.122 0.160 0.202 0.245 0.297 0.374
66 0.138 0.179 0.226 0.272 0.329 0.411
67 0.114 0.149 0.189 0.229 0.279 0.354
68 0.100 0.131 0.168 0.204 0.250 0.322
69 0.114 0.149 0.189 0.229 0.279 0.354
70 0.127 0.165 0.209 0.253 0.306 0.385

CALPERS ACTUARIAL VALUATION – June 30, 2015 APPENDIX A ACTUARIAL METHODS AND ASSUMPTIONS
A-13
Service Retirement
Public Agency Miscellaneous 2.7% @ 55
Duration of Service
Age 5 Years 10 Years 15 Years 20 Years 25 Years 30 Years
50 0.004 0.009 0.014 0.035 0.055 0.095
51 0.002 0.006 0.011 0.030 0.050 0.090
52 0.006 0.012 0.017 0.038 0.059 0.099
53 0.010 0.017 0.024 0.046 0.068 0.110
54 0.032 0.044 0.057 0.085 0.113 0.160
55 0.076 0.101 0.125 0.165 0.205 0.265
56 0.055 0.074 0.093 0.127 0.160 0.214
57 0.050 0.068 0.086 0.118 0.151 0.204
58 0.055 0.074 0.093 0.127 0.161 0.215
59 0.061 0.082 0.102 0.138 0.174 0.229
60 0.069 0.093 0.116 0.154 0.192 0.250
61 0.086 0.113 0.141 0.183 0.225 0.288
62 0.105 0.138 0.171 0.218 0.266 0.334
63 0.103 0.135 0.167 0.215 0.262 0.329
64 0.109 0.143 0.177 0.226 0.275 0.344
65 0.134 0.174 0.215 0.270 0.326 0.401
66 0.147 0.191 0.235 0.294 0.354 0.433
67 0.121 0.158 0.196 0.248 0.300 0.372
68 0.113 0.147 0.182 0.232 0.282 0.352
69 0.117 0.153 0.189 0.240 0.291 0.362
70 0.141 0.183 0.226 0.283 0.341 0.418
Public Agency Miscellaneous 3% @ 60
Duration of Service
Age 5 Years 10 Years 15 Years 20 Years 25 Years 30 Years
50 0.012 0.018 0.024 0.039 0.040 0.091
51 0.009 0.014 0.019 0.034 0.034 0.084
52 0.014 0.020 0.026 0.043 0.044 0.096
53 0.016 0.023 0.031 0.048 0.050 0.102
54 0.026 0.036 0.045 0.065 0.070 0.125
55 0.043 0.057 0.072 0.096 0.105 0.165
56 0.042 0.056 0.070 0.094 0.103 0.162
57 0.049 0.065 0.082 0.108 0.119 0.180
58 0.057 0.076 0.094 0.122 0.136 0.199
59 0.076 0.100 0.123 0.157 0.175 0.244
60 0.114 0.148 0.182 0.226 0.255 0.334
61 0.095 0.123 0.152 0.190 0.214 0.288
62 0.133 0.172 0.211 0.260 0.294 0.378
63 0.129 0.166 0.204 0.252 0.285 0.368
64 0.143 0.185 0.226 0.278 0.315 0.401
65 0.202 0.260 0.318 0.386 0.439 0.542
66 0.177 0.228 0.279 0.340 0.386 0.482
67 0.151 0.194 0.238 0.292 0.331 0.420
68 0.139 0.179 0.220 0.270 0.306 0.391
69 0.190 0.245 0.299 0.364 0.414 0.513
70 0.140 0.182 0.223 0.274 0.310 0.396

CALPERS ACTUARIAL VALUATION – June 30, 2015 APPENDIX A ACTUARIAL METHODS AND ASSUMPTIONS
A-14
Service Retirement
Public Agency Miscellaneous 2% @ 62
Duration of Service
Age 5 Years 10 Years 15 Years 20 Years 25 Years 30 Years
50 0.000 0.000 0.000 0.000 0.000 0.000
51 0.000 0.000 0.000 0.000 0.000 0.000
52 0.010 0.013 0.016 0.019 0.022 0.024
53 0.013 0.017 0.020 0.024 0.027 0.031
54 0.021 0.027 0.033 0.039 0.045 0.050
55 0.044 0.056 0.068 0.080 0.092 0.104
56 0.030 0.039 0.047 0.055 0.063 0.072
57 0.036 0.046 0.056 0.066 0.076 0.086
58 0.046 0.059 0.072 0.085 0.097 0.110
59 0.058 0.074 0.089 0.105 0.121 0.137
60 0.062 0.078 0.095 0.112 0.129 0.146
61 0.062 0.079 0.096 0.113 0.129 0.146
62 0.097 0.123 0.150 0.176 0.202 0.229
63 0.089 0.113 0.137 0.162 0.186 0.210
64 0.094 0.120 0.145 0.171 0.197 0.222
65 0.129 0.164 0.199 0.234 0.269 0.304
66 0.105 0.133 0.162 0.190 0.219 0.247
67 0.105 0.133 0.162 0.190 0.219 0.247
68 0.105 0.133 0.162 0.190 0.219 0.247
69 0.105 0.133 0.162 0.190 0.219 0.247
70 0.125 0.160 0.194 0.228 0.262 0.296
Service Retirement
Public Agency Fire ½ @ 55 and 2% @ 55
Age 50 51 52 53 54 55
Rate 0.0159 0.0000 0.0344 0.0199 0.0413 0.0751
Age 56 57 58 59 60
Rate 0.1108 0.0000 0.0950 0.0441 1.00000
Public Agency Police ½ @ 55 and 2% @ 55
Age 50 51 52 53 54 55
Rate 0.0255 0.0000 0.0164 0.0272 0.0095 0.1667
Age 56 57 58 59 60
Rate 0.0692 0.0511 0.0724 0.0704 1.0000
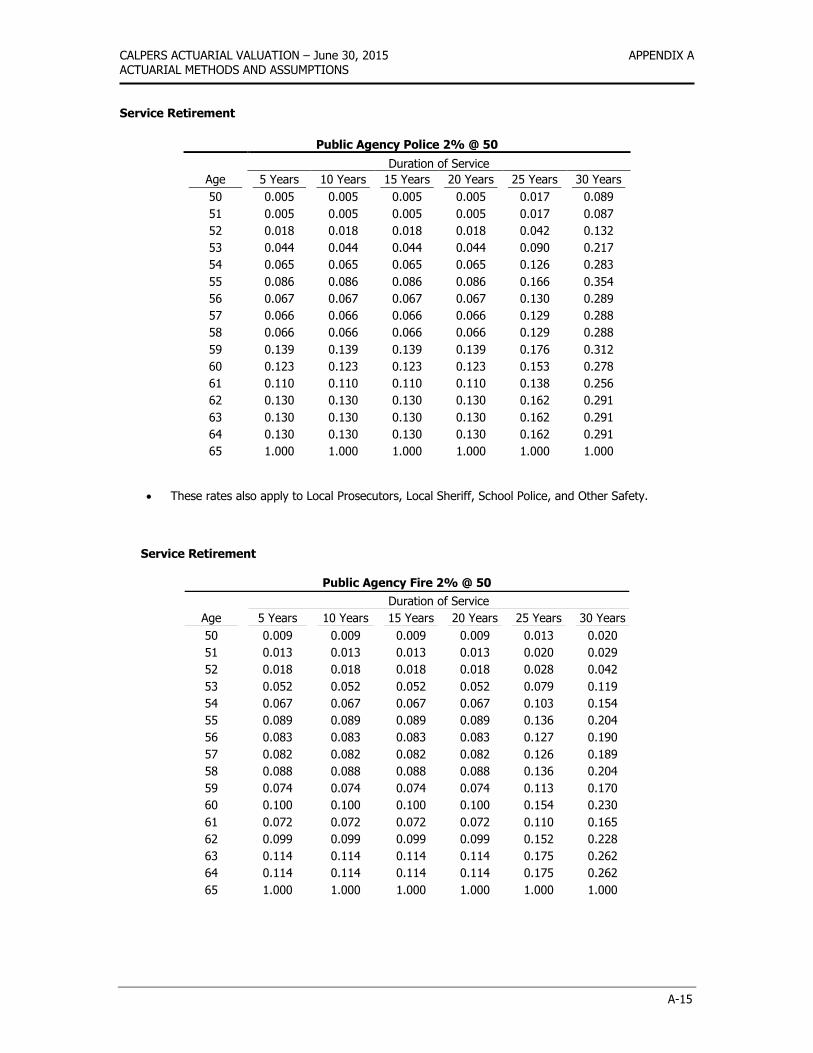
CALPERS ACTUARIAL VALUATION – June 30, 2015 APPENDIX A ACTUARIAL METHODS AND ASSUMPTIONS
A-15
Service Retirement
Public Agency Police 2% @ 50
Duration of Service
Age 5 Years 10 Years 15 Years 20 Years 25 Years 30 Years
50 0.005 0.005 0.005 0.005 0.017 0.089
51 0.005 0.005 0.005 0.005 0.017 0.087
52 0.018 0.018 0.018 0.018 0.042 0.132
53 0.044 0.044 0.044 0.044 0.090 0.217
54 0.065 0.065 0.065 0.065 0.126 0.283
55 0.086 0.086 0.086 0.086 0.166 0.354
56 0.067 0.067 0.067 0.067 0.130 0.289
57 0.066 0.066 0.066 0.066 0.129 0.288
58 0.066 0.066 0.066 0.066 0.129 0.288
59 0.139 0.139 0.139 0.139 0.176 0.312
60 0.123 0.123 0.123 0.123 0.153 0.278
61 0.110 0.110 0.110 0.110 0.138 0.256
62 0.130 0.130 0.130 0.130 0.162 0.291
63 0.130 0.130 0.130 0.130 0.162 0.291
64 0.130 0.130 0.130 0.130 0.162 0.291
65 1.000 1.000 1.000 1.000 1.000 1.000
These rates also apply to Local Prosecutors, Local Sheriff, School Police, and Other Safety.
Service Retirement
Public Agency Fire 2% @ 50
Duration of Service
Age 5 Years 10 Years 15 Years 20 Years 25 Years 30 Years
50 0.009 0.009 0.009 0.009 0.013 0.020
51 0.013 0.013 0.013 0.013 0.020 0.029
52 0.018 0.018 0.018 0.018 0.028 0.042
53 0.052 0.052 0.052 0.052 0.079 0.119
54 0.067 0.067 0.067 0.067 0.103 0.154
55 0.089 0.089 0.089 0.089 0.136 0.204
56 0.083 0.083 0.083 0.083 0.127 0.190
57 0.082 0.082 0.082 0.082 0.126 0.189
58 0.088 0.088 0.088 0.088 0.136 0.204
59 0.074 0.074 0.074 0.074 0.113 0.170
60 0.100 0.100 0.100 0.100 0.154 0.230
61 0.072 0.072 0.072 0.072 0.110 0.165
62 0.099 0.099 0.099 0.099 0.152 0.228
63 0.114 0.114 0.114 0.114 0.175 0.262
64 0.114 0.114 0.114 0.114 0.175 0.262
65 1.000 1.000 1.000 1.000 1.000 1.000

CALPERS ACTUARIAL VALUATION – June 30, 2015 APPENDIX A ACTUARIAL METHODS AND ASSUMPTIONS
A-16
Service Retirement
Public Agency Police 3% @ 55
Duration of Service
Age 5 Years 10 Years 15 Years 20 Years 25 Years 30 Years
50 0.004 0.004 0.004 0.004 0.015 0.086
51 0.014 0.014 0.014 0.014 0.034 0.114
52 0.026 0.026 0.026 0.026 0.060 0.154
53 0.038 0.038 0.038 0.038 0.083 0.188
54 0.071 0.071 0.071 0.071 0.151 0.292
55 0.061 0.061 0.061 0.061 0.131 0.261
56 0.072 0.072 0.072 0.072 0.153 0.295
57 0.065 0.065 0.065 0.065 0.140 0.273
58 0.066 0.066 0.066 0.066 0.142 0.277
59 0.118 0.118 0.118 0.118 0.247 0.437
60 0.065 0.065 0.065 0.065 0.138 0.272
61 0.084 0.084 0.084 0.084 0.178 0.332
62 0.108 0.108 0.108 0.108 0.226 0.405
63 0.084 0.084 0.084 0.084 0.178 0.332
64 0.084 0.084 0.084 0.084 0.178 0.332
65 1.000 1.000 1.000 1.000 1.000 1.000
These rates also apply to Local Prosecutors, Local Sheriff, School Police, and Other Safety.
Service Retirement
Public Agency Fire 3% @ 55
Duration of Service
Age 5 Years 10 Years 15 Years 20 Years 25 Years 30 Years
50 0.001 0.001 0.001 0.006 0.016 0.069
51 0.002 0.002 0.002 0.006 0.018 0.071
52 0.012 0.012 0.012 0.021 0.040 0.098
53 0.032 0.032 0.032 0.049 0.085 0.149
54 0.057 0.057 0.057 0.087 0.144 0.217
55 0.073 0.073 0.073 0.109 0.179 0.259
56 0.064 0.064 0.064 0.097 0.161 0.238
57 0.063 0.063 0.063 0.095 0.157 0.233
58 0.065 0.065 0.065 0.099 0.163 0.241
59 0.088 0.088 0.088 0.131 0.213 0.299
60 0.105 0.105 0.105 0.155 0.251 0.344
61 0.118 0.118 0.118 0.175 0.282 0.380
62 0.087 0.087 0.087 0.128 0.210 0.295
63 0.067 0.067 0.067 0.100 0.165 0.243
64 0.067 0.067 0.067 0.100 0.165 0.243
65 1.000 1.000 1.000 1.000 1.000 1.000

CALPERS ACTUARIAL VALUATION – June 30, 2015 APPENDIX A ACTUARIAL METHODS AND ASSUMPTIONS
A-17
Service Retirement
Public Agency Police 3% @ 50
Duration of Service
Age 5 Years 10 Years 15 Years 20 Years 25 Years 30 Years
50 0.050 0.050 0.050 0.099 0.240 0.314
51 0.034 0.034 0.034 0.072 0.198 0.260
52 0.033 0.033 0.033 0.071 0.198 0.259
53 0.039 0.039 0.039 0.080 0.212 0.277
54 0.045 0.045 0.045 0.092 0.229 0.300
55 0.052 0.052 0.052 0.105 0.248 0.323
56 0.042 0.042 0.042 0.087 0.221 0.289
57 0.043 0.043 0.043 0.088 0.223 0.292
58 0.054 0.054 0.054 0.109 0.255 0.333
59 0.054 0.054 0.054 0.108 0.253 0.330
60 0.060 0.060 0.060 0.121 0.272 0.355
61 0.048 0.048 0.048 0.098 0.238 0.311
62 0.061 0.061 0.061 0.122 0.274 0.357
63 0.057 0.057 0.057 0.115 0.263 0.343
64 0.069 0.069 0.069 0.137 0.296 0.385
65 1.000 1.000 1.000 1.000 1.000 1.000
These rates also apply to Local Prosecutors, Local Sheriff, School Police, and Other Safety.
Service Retirement
Public Agency Fire 3% @ 50
Duration of Service
Age 5 Years 10 Years 15 Years 20 Years 25 Years 30 Years
50 0.020 0.020 0.020 0.040 0.130 0.192
51 0.008 0.008 0.008 0.023 0.107 0.164
52 0.023 0.023 0.023 0.043 0.136 0.198
53 0.023 0.023 0.023 0.043 0.135 0.198
54 0.027 0.027 0.027 0.048 0.143 0.207
55 0.043 0.043 0.043 0.070 0.174 0.244
56 0.053 0.053 0.053 0.085 0.196 0.269
57 0.054 0.054 0.054 0.086 0.197 0.271
58 0.052 0.052 0.052 0.084 0.193 0.268
59 0.075 0.075 0.075 0.116 0.239 0.321
60 0.065 0.065 0.065 0.102 0.219 0.298
61 0.076 0.076 0.076 0.117 0.241 0.324
62 0.068 0.068 0.068 0.106 0.224 0.304
63 0.027 0.027 0.027 0.049 0.143 0.208
64 0.094 0.094 0.094 0.143 0.277 0.366
65 1.000 1.000 1.000 1.000 1.000 1.000

CALPERS ACTUARIAL VALUATION – June 30, 2015 APPENDIX A ACTUARIAL METHODS AND ASSUMPTIONS
A-18
Service Retirement
Public Agency Police 2% @ 57
Duration of Service
Age 5 Years 10 Years 15 Years 20 Years 25 Years 30 Years
50 0.011 0.011 0.011 0.011 0.020 0.036
51 0.009 0.009 0.009 0.009 0.016 0.028
52 0.018 0.018 0.018 0.018 0.034 0.060
53 0.037 0.037 0.037 0.037 0.067 0.119
54 0.049 0.049 0.049 0.049 0.089 0.159
55 0.063 0.063 0.063 0.063 0.115 0.205
56 0.045 0.045 0.045 0.045 0.082 0.146
57 0.064 0.064 0.064 0.064 0.117 0.209
58 0.047 0.047 0.047 0.047 0.086 0.154
59 0.105 0.105 0.105 0.105 0.130 0.191
60 0.105 0.105 0.105 0.105 0.129 0.188
61 0.105 0.105 0.105 0.105 0.129 0.188
62 0.105 0.105 0.105 0.105 0.129 0.188
63 0.105 0.105 0.105 0.105 0.129 0.188
64 0.105 0.105 0.105 0.105 0.129 0.188
65 1.000 1.000 1.000 1.000 1.000 1.000
These rates also apply to Local Prosecutors, Local Sheriff, School Police, and Other Safety. Service Retirement
Public Agency Fire 2% @ 57
Duration of Service
Age 5 Years 10 Years 15 Years 20 Years 25 Years 30 Years
50 0.005 0.005 0.005 0.005 0.008 0.012
51 0.006 0.006 0.006 0.006 0.009 0.013
52 0.012 0.012 0.012 0.012 0.019 0.028
53 0.033 0.033 0.033 0.033 0.050 0.075
54 0.045 0.045 0.045 0.045 0.069 0.103
55 0.061 0.061 0.061 0.061 0.094 0.140
56 0.055 0.055 0.055 0.055 0.084 0.126
57 0.081 0.081 0.081 0.081 0.125 0.187
58 0.059 0.059 0.059 0.059 0.091 0.137
59 0.055 0.055 0.055 0.055 0.084 0.126
60 0.085 0.085 0.085 0.085 0.131 0.196
61 0.085 0.085 0.085 0.085 0.131 0.196
62 0.085 0.085 0.085 0.085 0.131 0.196
63 0.085 0.085 0.085 0.085 0.131 0.196
64 0.085 0.085 0.085 0.085 0.131 0.196
65 1.000 1.000 1.000 1.000 1.000 1.000

CALPERS ACTUARIAL VALUATION – June 30, 2015 APPENDIX A ACTUARIAL METHODS AND ASSUMPTIONS
A-19
Service Retirement
Public Agency Police 2.5% @ 57
Duration of Service
Age 5 Years 10 Years 15 Years 20 Years 25 Years 30 Years
50 0.014 0.014 0.014 0.014 0.025 0.045
51 0.012 0.012 0.012 0.012 0.021 0.038
52 0.025 0.025 0.025 0.025 0.046 0.081
53 0.047 0.047 0.047 0.047 0.086 0.154
54 0.063 0.063 0.063 0.063 0.115 0.205
55 0.076 0.076 0.076 0.076 0.140 0.249
56 0.054 0.054 0.054 0.054 0.099 0.177
57 0.071 0.071 0.071 0.071 0.130 0.232
58 0.057 0.057 0.057 0.057 0.103 0.184
59 0.126 0.126 0.126 0.126 0.156 0.229
60 0.126 0.126 0.126 0.126 0.155 0.226
61 0.126 0.126 0.126 0.126 0.155 0.226
62 0.126 0.126 0.126 0.126 0.155 0.226
63 0.126 0.126 0.126 0.126 0.155 0.226
64 0.126 0.126 0.126 0.126 0.155 0.226
65 1.000 1.000 1.000 1.000 1.000 1.000
These rates also apply to Local Prosecutors, Local Sheriff, School Police, and Other Safety. Service Retirement
Public Agency Fire 2.5% @ 57
Duration of Service
Age 5 Years 10 Years 15 Years 20 Years 25 Years 30 Years
50 0.007 0.007 0.007 0.007 0.010 0.015
51 0.008 0.008 0.008 0.008 0.012 0.018
52 0.016 0.016 0.016 0.016 0.025 0.038
53 0.042 0.042 0.042 0.042 0.064 0.096
54 0.057 0.057 0.057 0.057 0.088 0.132
55 0.074 0.074 0.074 0.074 0.114 0.170
56 0.066 0.066 0.066 0.066 0.102 0.153
57 0.090 0.090 0.090 0.090 0.139 0.208
58 0.071 0.071 0.071 0.071 0.110 0.164
59 0.066 0.066 0.066 0.066 0.101 0.151
60 0.102 0.102 0.102 0.102 0.157 0.235
61 0.102 0.102 0.102 0.102 0.157 0.236
62 0.102 0.102 0.102 0.102 0.157 0.236
63 0.102 0.102 0.102 0.102 0.157 0.236
64 0.102 0.102 0.102 0.102 0.157 0.236
65 1.000 1.000 1.000 1.000 1.000 1.000

CALPERS ACTUARIAL VALUATION – June 30, 2015 APPENDIX A ACTUARIAL METHODS AND ASSUMPTIONS
A-20
Service Retirement
Public Agency Police 2.7% @ 57
Duration of Service
Age 5 Years 10 Years 15 Years 20 Years 25 Years 30 Years
50 0.0138 0.0138 0.0138 0.0138 0.0253 0.0451
51 0.0123 0.0123 0.0123 0.0123 0.0226 0.0402
52 0.0249 0.0249 0.0249 0.0249 0.0456 0.0812
53 0.0497 0.0497 0.0497 0.0497 0.0909 0.1621
54 0.0662 0.0662 0.0662 0.0662 0.1211 0.2160
55 0.0854 0.0854 0.0854 0.0854 0.1563 0.2785
56 0.0606 0.0606 0.0606 0.0606 0.1108 0.1975
57 0.0711 0.0711 0.0711 0.0711 0.1300 0.2318
58 0.0628 0.0628 0.0628 0.0628 0.1149 0.2049
59 0.1396 0.1396 0.1396 0.1396 0.1735 0.2544
60 0.1396 0.1396 0.1396 0.1396 0.1719 0.2506
61 0.1396 0.1396 0.1396 0.1396 0.1719 0.2506
62 0.1396 0.1396 0.1396 0.1396 0.1719 0.2506
63 0.1396 0.1396 0.1396 0.1396 0.1719 0.2506
64 0.1396 0.1396 0.1396 0.1396 0.1719 0.2506
65 1.0000 1.0000 1.0000 1.0000 1.0000 1.0000
These rates also apply to Local Prosecutors, Local Sheriff, School Police, and Other Safety. Service Retirement
Public Agency Fire 2.7% @ 57
Duration of Service
Age 5 Years 10 Years 15 Years 20 Years 25 Years 30 Years
50 0.0065 0.0065 0.0065 0.0065 0.0101 0.0151
51 0.0081 0.0081 0.0081 0.0081 0.0125 0.0187
52 0.0164 0.0164 0.0164 0.0164 0.0254 0.0380
53 0.0442 0.0442 0.0442 0.0442 0.0680 0.1018
54 0.0606 0.0606 0.0606 0.0606 0.0934 0.1397
55 0.0825 0.0825 0.0825 0.0825 0.1269 0.1900
56 0.0740 0.0740 0.0740 0.0740 0.1140 0.1706
57 0.0901 0.0901 0.0901 0.0901 0.1387 0.2077
58 0.0790 0.0790 0.0790 0.0790 0.1217 0.1821
59 0.0729 0.0729 0.0729 0.0729 0.1123 0.1681
60 0.1135 0.1135 0.1135 0.1135 0.1747 0.2615
61 0.1136 0.1136 0.1136 0.1136 0.1749 0.2618
62 0.1136 0.1136 0.1136 0.1136 0.1749 0.2618
63 0.1136 0.1136 0.1136 0.1136 0.1749 0.2618
64 0.1136 0.1136 0.1136 0.1136 0.1749 0.2618
65 1.0000 1.0000 1.0000 1.0000 1.0000 1.0000

CALPERS ACTUARIAL VALUATION – June 30, 2015 APPENDIX A ACTUARIAL METHODS AND ASSUMPTIONS
A-21
Service Retirement
Schools 2% @ 55
Duration of Service
Age 5 Years 10 Years 15 Years 20 Years 25 Years 30 Years
50 0.005 0.009 0.013 0.015 0.016 0.018
51 0.005 0.010 0.014 0.017 0.019 0.021
52 0.006 0.012 0.017 0.020 0.022 0.025
53 0.007 0.014 0.019 0.023 0.026 0.029
54 0.012 0.024 0.033 0.039 0.044 0.049
55 0.024 0.048 0.067 0.079 0.088 0.099
56 0.020 0.039 0.055 0.065 0.072 0.081
57 0.021 0.042 0.059 0.070 0.078 0.087
58 0.025 0.050 0.070 0.083 0.092 0.103
59 0.029 0.057 0.080 0.095 0.105 0.118
60 0.037 0.073 0.102 0.121 0.134 0.150
61 0.046 0.090 0.126 0.149 0.166 0.186
62 0.076 0.151 0.212 0.250 0.278 0.311
63 0.069 0.136 0.191 0.225 0.251 0.281
64 0.067 0.133 0.185 0.219 0.244 0.273
65 0.091 0.180 0.251 0.297 0.331 0.370
66 0.072 0.143 0.200 0.237 0.264 0.295
67 0.067 0.132 0.185 0.218 0.243 0.272
68 0.060 0.118 0.165 0.195 0.217 0.243
69 0.067 0.133 0.187 0.220 0.246 0.275
70 0.066 0.131 0.183 0.216 0.241 0.270
Miscellaneous
Internal Revenue Code Section 415 The limitations on benefits imposed by Internal Revenue Code Section 415 are taken into account in this valuation. Each year the impact of any changes in this limitation since the prior valuation is included and amortized as part of the actuarial gain or loss base. This results in lower contributions for those employers contributing to the Replacement Benefit Fund and protects CalPERS from prefunding expected benefits in excess of limits imposed by federal tax law. Internal Revenue Code Section 401(a)(17) The limitations on compensation imposed by Internal Revenue Code Section 401(a)(17) are taken into account in this valuation. Each year, the impact of any changes in the compensation limitation since the
prior valuation is included and amortized as part of the actuarial gain or loss base. The compensation limit for classic members for the 2015 calendar year is $265,000.

APPENDIX B
PRINCIPAL PLAN PROVISIONS
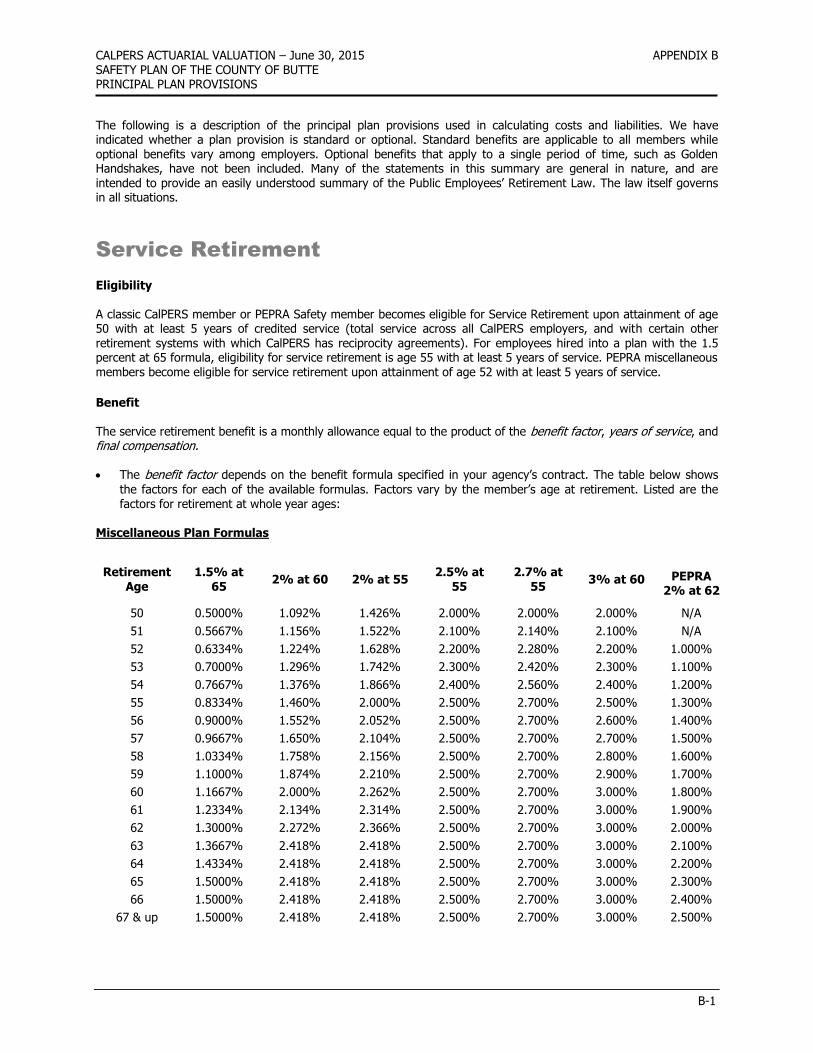
CALPERS ACTUARIAL VALUATION – June 30, 2015 APPENDIX B SAFETY PLAN OF THE COUNTY OF BUTTE PRINCIPAL PLAN PROVISIONS
B-1
The following is a description of the principal plan provisions used in calculating costs and liabilities. We have indicated whether a plan provision is standard or optional. Standard benefits are applicable to all members while optional benefits vary among employers. Optional benefits that apply to a single period of time, such as Golden Handshakes, have not been included. Many of the statements in this summary are general in nature, and are intended to provide an easily understood summary of the Public Employees’ Retirement Law. The law itself governs in all situations.
Service Retirement
Eligibility A classic CalPERS member or PEPRA Safety member becomes eligible for Service Retirement upon attainment of age 50 with at least 5 years of credited service (total service across all CalPERS employers, and with certain other
retirement systems with which CalPERS has reciprocity agreements). For employees hired into a plan with the 1.5 percent at 65 formula, eligibility for service retirement is age 55 with at least 5 years of service. PEPRA miscellaneous members become eligible for service retirement upon attainment of age 52 with at least 5 years of service.
Benefit The service retirement benefit is a monthly allowance equal to the product of the benefit factor, years of service, and final compensation. The benefit factor depends on the benefit formula specified in your agency’s contract. The table below shows
the factors for each of the available formulas. Factors vary by the member’s age at retirement. Listed are the factors for retirement at whole year ages:
Miscellaneous Plan Formulas
Retirement
Age
1.5% at
65 2% at 60 2% at 55
2.5% at
55
2.7% at
55 3% at 60
PEPRA 2% at 62
50 0.5000% 1.092% 1.426% 2.000% 2.000% 2.000% N/A
51 0.5667% 1.156% 1.522% 2.100% 2.140% 2.100% N/A
52 0.6334% 1.224% 1.628% 2.200% 2.280% 2.200% 1.000%
53 0.7000% 1.296% 1.742% 2.300% 2.420% 2.300% 1.100%
54 0.7667% 1.376% 1.866% 2.400% 2.560% 2.400% 1.200%
55 0.8334% 1.460% 2.000% 2.500% 2.700% 2.500% 1.300%
56 0.9000% 1.552% 2.052% 2.500% 2.700% 2.600% 1.400%
57 0.9667% 1.650% 2.104% 2.500% 2.700% 2.700% 1.500%
58 1.0334% 1.758% 2.156% 2.500% 2.700% 2.800% 1.600%
59 1.1000% 1.874% 2.210% 2.500% 2.700% 2.900% 1.700%
60 1.1667% 2.000% 2.262% 2.500% 2.700% 3.000% 1.800%
61 1.2334% 2.134% 2.314% 2.500% 2.700% 3.000% 1.900%
62 1.3000% 2.272% 2.366% 2.500% 2.700% 3.000% 2.000%
63 1.3667% 2.418% 2.418% 2.500% 2.700% 3.000% 2.100%
64 1.4334% 2.418% 2.418% 2.500% 2.700% 3.000% 2.200%
65 1.5000% 2.418% 2.418% 2.500% 2.700% 3.000% 2.300%
66 1.5000% 2.418% 2.418% 2.500% 2.700% 3.000% 2.400%
67 & up 1.5000% 2.418% 2.418% 2.500% 2.700% 3.000% 2.500%

CALPERS ACTUARIAL VALUATION – June 30, 2015 APPENDIX B SAFETY PLAN OF THE COUNTY OF BUTTE PRINCIPAL PLAN PROVISIONS
B-2
Safety Plan Formulas
Retirement Age
½ at 55 * 2% at 55 2% at 50 3% at 55 3% at 50
50 1.783% 1.426% 2.000% 2.400% 3.000%
51 1.903% 1.522% 2.140% 2.520% 3.000%
52 2.035% 1.628% 2.280% 2.640% 3.000%
53 2.178% 1.742% 2.420% 2.760% 3.000%
54 2.333% 1.866% 2.560% 2.880% 3.000%
55 & Up 2.500% 2.000% 2.700% 3.000% 3.000%
* For this formula, the benefit factor also varies by entry age. The factors shown are for members with an entry age of 35 or greater. If entry age is less than 35, then the age 55 benefit factor is 50 percent divided by the difference between age 55 and entry age. The benefit factor for ages prior to age 55 is the same proportion of the age 55 benefit factor as in the above table. PEPRA Safety Plan Formulas
Retirement Age 2% at 57 2.5% at 57 2.7% at 57
50 1.426% 2.000% 2.000%
51 1.508% 2.071% 2.100%
52 1.590% 2.143% 2.200%
53 1.672% 2.214% 2.300%
54 1.754% 2.286% 2.400%
55 1.836% 2.357% 2.500%
56 1.918% 2.429% 2.600%
57 & Up 2.000% 2.500% 2.700%
The years of service is the amount credited by CalPERS to a member while he or she is employed in this group
(or for other periods that are recognized under the employer’s contract with CalPERS). For a member who has earned service with multiple CalPERS employers, the benefit from each employer is calculated separately according to each employer’s contract, and then added together for the total allowance. An agency may contract for an optional benefit where any unused sick leave accumulated at the time of retirement will be converted to credited service at a rate of 0.004 years of service for each day of sick leave.
The final compensation is the monthly average of the member’s highest 36 or 12 consecutive months’ full-time
equivalent monthly pay (no matter which CalPERS employer paid this compensation). The standard benefit is 36 months. Employers had the option of providing a final compensation equal to the highest 12 consecutive months for classic plans only. Final compensation must be defined by the highest 36 consecutive months’ pay under the 1.5% at 65 formula. PEPRA members have a cap on the annual salary that can be used to calculate final compensation for all new members based on the Social Security contribution and benefit base. For employees that participate in Social Security this cap is $117,020 for 2015 and for those employees that do not participate in Social Security the cap for 2015 is $140,424. Adjustments to the caps are permitted annually based on changes to the CPI for all urban consumers.
Employees must be covered by Social Security with the 1.5% at 65 formula. Social Security is optional for all
other benefit formulas. For employees covered by Social Security, the modified formula is the standard benefit. Under this type of formula, the final compensation is offset by $133.33 (or by one third if the final compensation is less than $400). Employers may contract for the full benefit with Social Security that will eliminate the offset applicable to the final compensation. For employees not covered by Social Security, the full benefit is paid with
CALPERS ACTUARIAL VALUATION – June 30, 2015 APPENDIX B SAFETY PLAN OF THE COUNTY OF BUTTE PRINCIPAL PLAN PROVISIONS
B-3
no offsets. Auxiliary organizations of the CSUC system may elect reduced contribution rates, in which case the offset is $317 if members are not covered by Social Security or $513 if members are covered by Social Security.
The miscellaneous and PEPRA safety service retirement benefit is not capped. The classic service retirement
benefit is capped at 90 percent of final compensation.
Vested Deferred Retirement
Eligibility for Deferred Status A CalPERS member becomes eligible for a deferred vested retirement benefit when he or she leaves employment, keeps his or her contribution account balance on deposit with CalPERS, and has earned at least 5 years of credited service (total service across all CalPERS employers, and with certain other retirement systems with which CalPERS has reciprocity agreements). Eligibility to Start Receiving Benefits The CalPERS classic members and PEPRA safety members become eligible to receive the deferred retirement benefit upon satisfying the eligibility requirements for deferred status and upon attainment of age 50 (55 for employees hired into a 1.5% @ 65 plan). PEPRA miscellaneous members become eligible to receive the deferred retirement benefit upon satisfying the eligibility requirements for deferred status and upon attainment of age 52. Benefit The vested deferred retirement benefit is the same as the service retirement benefit, where the benefit factor is based on the member’s age at allowance commencement. For members who have earned service with multiple CalPERS employers, the benefit from each employer is calculated separately according to each employer’s contract, and then added together for the total allowance.
Non-Industrial (Non-Job Related) Disability Retirement
Eligibility A CalPERS member is eligible for Non-Industrial Disability Retirement if he or she becomes disabled and has at least 5 years of credited service (total service across all CalPERS employers, and with certain other retirement systems with which CalPERS has reciprocity agreements). There is no special age requirement. Disabled means the member is unable to perform his or her job because of an illness or injury, which is expected to be permanent or to last indefinitely. The illness or injury does not have to be job related. A CalPERS member must be actively employed by any CalPERS employer at the time of disability in order to be eligible for this benefit. Standard Benefit The standard Non-Industrial Disability Retirement benefit is a monthly allowance equal to 1.8 percent of final compensation, multiplied by service, which is determined as follows: Service is CalPERS credited service, for members with less than 10 years of service or greater than 18.518 years
of service; or Service is CalPERS credited service plus the additional number of years that the member would have worked
until age 60, for members with at least 10 years but not more than 18.518 years of service. The maximum benefit in this case is 33 1/3 percent of final compensation.

CALPERS ACTUARIAL VALUATION – June 30, 2015 APPENDIX B SAFETY PLAN OF THE COUNTY OF BUTTE PRINCIPAL PLAN PROVISIONS
B-4
Improved Benefit Employers have the option of providing the improved Non-Industrial Disability Retirement benefit. This benefit provides a monthly allowance equal to 30 percent of final compensation for the first 5 years of service, plus 1 percent for each additional year of service to a maximum of 50 percent of final compensation. Members who are eligible for a larger service retirement benefit may choose to receive that benefit in lieu of a disability benefit. Members eligible to retire, and who have attained the normal retirement age determined by their service retirement benefit formula, will receive the same dollar amount for disability retirement as that payable for service retirement. For members who have earned service with multiple CalPERS employers, the benefit attributed to each employer is the total disability allowance multiplied by the ratio of service with a particular employer to the total CalPERS service.
Industrial (Job Related) Disability Retirement
All safety members have this benefit. For miscellaneous members, employers have the option of providing this benefit. An employer may choose to provide the increased benefit option or the improved benefit option. Eligibility An employee is eligible for Industrial Disability Retirement if he or she becomes disabled while working, where disabled means the member is unable to perform the duties of the job because of a work-related illness or injury, which is expected to be permanent or to last indefinitely. A CalPERS member who has left active employment within this group is not eligible for this benefit, except to the extent described below. Standard Benefit The standard Industrial Disability Retirement benefit is a monthly allowance equal to 50 percent of final compensation.
Increased Benefit (75 percent of Final Compensation) The increased Industrial Disability Retirement benefit is a monthly allowance equal to 75 percent final compensation for total disability. Improved Benefit (50 percent to 90 percent of Final Compensation) The improved Industrial Disability Retirement benefit is a monthly allowance equal to the Workman’s Compensation Appeals Board permanent disability rate percentage (if 50 percent or greater, with a maximum of 90 percent) times the final compensation. For a CalPERS member not actively employed in this group who became disabled while employed by some other CalPERS employer, the benefit is a return of accumulated member contributions with respect to employment in this group. With the standard or increased benefit, a member may also choose to receive the annuitization of the accumulated member contributions. If a member is eligible for service retirement and if the service retirement benefit is more than the industrial disability retirement benefit, the member may choose to receive the larger benefit.

CALPERS ACTUARIAL VALUATION – June 30, 2015 APPENDIX B SAFETY PLAN OF THE COUNTY OF BUTTE PRINCIPAL PLAN PROVISIONS
B-5
Post-Retirement Death Benefit
Standard Lump Sum Payment Upon the death of a retiree, a one-time lump sum payment of $500 will be made to the retiree’s designated survivor(s), or to the retiree’s estate.
Improved Lump Sum Payment Employers have the option of providing an improved lump sum death benefit of $600, $2,000, $3,000, $4,000 or $5,000.
Form of Payment for Retirement Allowance
Standard Form of Payment Generally, the retirement allowance is paid to the retiree in the form of an annuity for as long as he or she is alive. The retiree may choose to provide for a portion of his or her allowance to be paid to any designated beneficiary after the retiree’s death. CalPERS provides for a variety of such benefit options, which the retiree pays for by taking a reduction in his or her retirement allowance. Such reduction takes into account the amount to be provided to the beneficiary and the probable duration of payments (based on the ages of the member and beneficiary) made subsequent to the member’s death.
Improved Form of Payment (Post-Retirement Survivor Allowance) Employers have the option to contract for the post-retirement survivor allowance.
For retirement allowances with respect to service subject to the modified formula, 25 percent of the retirement allowance will automatically be continued to certain statutory beneficiaries upon the death of the retiree, without a reduction in the retiree’s allowance. For retirement allowances with respect to service subject to the full or supplemental formula, 50 percent of the retirement allowance will automatically be continued to certain statutory beneficiaries upon the death of the retiree, without a reduction in the retiree’s allowance. This additional benefit is referred to as post-retirement survivor allowance (PRSA) or simply as survivor continuance.
In other words, 25 percent or 50 percent of the allowance, the continuance portion, is paid to the retiree for as long as he or she is alive, and that same amount is continued to the retiree’s spouse (or if no eligible spouse, to unmarried child(ren) until they attain age 18; or, if no eligible child(ren), to a qualifying dependent parent) for the rest of his or her lifetime. This benefit will not be discontinued in the event the spouse remarries. The remaining 75 percent or 50 percent of the retirement allowance, which may be referred to as the option portion of the benefit, is paid to the retiree as an annuity for as long as he or she is alive. Or, the retiree may choose to provide for some of this option portion to be paid to any designated beneficiary after the retiree’s death. Benefit options applicable to the option portion are the same as those offered with the standard form. The reduction is calculated in the same manner but is applied only to the option portion.

CALPERS ACTUARIAL VALUATION – June 30, 2015 APPENDIX B SAFETY PLAN OF THE COUNTY OF BUTTE PRINCIPAL PLAN PROVISIONS
B-6
Pre-Retirement Death Benefits
Basic Death Benefit
This is a standard benefit. Eligibility An employee’s beneficiary (or estate) may receive the basic death benefit if the member dies while actively employed. A CalPERS member must be actively employed with the CalPERS employer providing this benefit to be eligible for this benefit. A member’s survivor who is eligible for any other pre-retirement death benefit may choose to receive that death benefit instead of this basic death benefit.
Benefit The basic death benefit is a lump sum in the amount of the member’s accumulated contributions, where interest is currently credited at 7.5 percent per year, plus a lump sum in the amount of one month's salary for each completed year of current service, up to a maximum of six months' salary. For purposes of this benefit, one month's salary is defined as the member's average monthly full-time rate of compensation during the 12 months preceding death.
1957 Survivor Benefit
This is a standard benefit. Eligibility An employee’s eligible survivor(s) may receive the 1957 Survivor benefit if the member dies while actively employed, has attained at least age 50 for classic and safety PEPRA members and age 52 for miscellaneous PEPRA members, and has at least 5 years of credited service (total service across all CalPERS employers and with certain other retirement systems with which CalPERS has reciprocity agreements). A CalPERS member must be actively employed with the CalPERS employer providing this benefit to be eligible for this benefit. An eligible survivor means the surviving spouse to whom the member was married at least one year before death or, if there is no eligible spouse, to the member's unmarried child(ren) under age 18. A member’s survivor who is eligible for any other pre-retirement death benefit may choose to receive that death benefit instead of this 1957 Survivor benefit. Benefit The 1957 Survivor benefit is a monthly allowance equal to one-half of the unmodified service retirement benefit that the member would have been entitled to receive if the member had retired on the date of his or her death. If the benefit is payable to the spouse, the benefit is discontinued upon the death of the spouse. If the benefit is payable to dependent child(ren), the benefit will be discontinued upon death or attainment of age 18, unless the child(ren) is disabled. The total amount paid will be at least equal to the basic death benefit.

CALPERS ACTUARIAL VALUATION – June 30, 2015 APPENDIX B SAFETY PLAN OF THE COUNTY OF BUTTE PRINCIPAL PLAN PROVISIONS
B-7
Optional Settlement 2W Death Benefit
This is an optional benefit. Eligibility An employee’s eligible survivor may receive the Optional Settlement 2W Death benefit if the member dies while actively employed, has attained at least age 50 for classic and safety PEPRA members and age 52 for miscellaneous PEPRA members, and has at least 5 years of credited service (total service across all CalPERS employers and with certain other retirement systems with which CalPERS has reciprocity agreements). A CalPERS member who is no longer actively employed with any CalPERS employer is not eligible for this benefit. An eligible survivor means the surviving spouse to whom the member was married at least one year before death. A member’s survivor who is eligible for any other pre-retirement death benefit may choose to receive that death benefit instead of this Optional Settlement 2W Death benefit.
Benefit The Optional Settlement 2W Death benefit is a monthly allowance equal to the service retirement benefit that the member would have received had the member retired on the date of his or her death and elected Optional Settlement 2W. (A retiree who elects Optional Settlement 2W receives an allowance that has been reduced so that it will continue to be paid after his or her death to a surviving beneficiary.) The allowance is payable as long as the surviving spouse lives, at which time it is continued to any unmarried child(ren) under age 18, if applicable. The total amount paid will be at least equal to the basic death benefit.
Special Death Benefit
This is a standard benefit for safety members. An employer may elect to provide this benefit for miscellaneous members. Eligibility An employee’s eligible survivor(s) may receive the special death benefit if the member dies while actively employed and the death is job-related. A CalPERS member who is no longer actively employed with any CalPERS employer is not eligible for this benefit. An eligible survivor means the surviving spouse to whom the member was married prior to the onset of the injury or illness that resulted in death. If there is no eligible spouse, an eligible survivor means the member's unmarried child(ren) under age 22. An eligible survivor who chooses to receive this benefit will not receive any other death benefit. Benefit The special death benefit is a monthly allowance equal to 50 percent of final compensation, and will be increased whenever the compensation paid to active employees is increased but ceasing to increase when the member would have attained age 50. The allowance is payable to the surviving spouse until death at which time the allowance is continued to any unmarried child(ren) under age 22. There is a guarantee that the total amount paid will at least
equal the basic death benefit. If the member’s death is the result of an accident or injury caused by external violence or physical force incurred in the performance of the member’s duty, and there are eligible surviving child(ren) (eligible means unmarried child(ren) under age 22) in addition to an eligible spouse, then an additional monthly allowance is paid equal to the following:
if 1 eligible child: 12.5 percent of final compensation if 2 eligible children: 20.0 percent of final compensation if 3 or more eligible children: 25.0 percent of final compensation

CALPERS ACTUARIAL VALUATION – June 30, 2015 APPENDIX B SAFETY PLAN OF THE COUNTY OF BUTTE PRINCIPAL PLAN PROVISIONS
B-8
Alternate Death Benefit for Local Fire Members
This is an optional benefit available only to local fire members. Eligibility An employee’s eligible survivor(s) may receive the alternate death benefit in lieu of the basic death benefit or the 1957 Survivor benefit if the member dies while actively employed and has at least 20 years of total CalPERS service. A CalPERS member who is no longer actively employed with any CalPERS employer is not eligible for this benefit. An eligible survivor means the surviving spouse to whom the member was married prior to the onset of the injury or illness that resulted in death. If there is no eligible spouse, an eligible survivor means the member's unmarried child(ren) under age 18. Benefit
The Alternate Death benefit is a monthly allowance equal to the service retirement benefit that the member would have received had the member retired on the date of his or her death and elected Optional Settlement 2W. (A retiree who elects Optional Settlement 2W receives an allowance that has been reduced so that it will continue to be paid after his or her death to a surviving beneficiary.) If the member has not yet attained age 50, the benefit is equal to that which would be payable if the member had retired at age 50, based on service credited at the time of death. The allowance is payable as long as the surviving spouse lives, at which time it is continued to any unmarried child(ren) under age 18, if applicable. The total amount paid will be at least equal to the basic death benefit.
Cost-of-Living Adjustments (COLA)
Standard Benefit Retirement and survivor allowances are adjusted each year in May for cost of living, beginning the second calendar year after the year of retirement. The standard cost-of-living adjustment (COLA) is 2 percent. Annual adjustments
are calculated by first determining the lesser of 1) 2 percent compounded from the end of the year of retirement or 2) actual rate of inflation. The resulting increase is divided by the total increase provided in prior years. For any particular year, the COLA adjustment may be less than 2 percent (when the rate of inflation is low), may be greater than the rate of inflation (when the rate of inflation is low after several years of high inflation) or may even be greater than 2 percent (when inflation is high after several years of low inflation). Improved Benefit Employers have the option of providing a COLA of 3 percent, 4 percent, or 5 percent, determined in the same manner as described above for the standard 2 percent COLA. An improved COLA is not available with the 1.5% at 65 formula.
Purchasing Power Protection Allowance (PPPA)
Retirement and survivor allowances are protected against inflation by PPPA. PPPA benefits are cost-of-living adjustments that are intended to maintain an individual’s allowance at 80 percent of the initial allowance at retirement adjusted for inflation since retirement. The PPPA benefit will be coordinated with other cost-of-living adjustments provided under the plan.

CALPERS ACTUARIAL VALUATION – June 30, 2015 APPENDIX B SAFETY PLAN OF THE COUNTY OF BUTTE PRINCIPAL PLAN PROVISIONS
B-9
Employee Contributions
Each employee contributes toward his or her retirement based upon the retirement formula. The standard employee contribution is as described below.
The percent contributed below the monthly compensation breakpoint is 0 percent.
The monthly compensation breakpoint is $0 for full and supplemental formula members and $133.33 for employees covered by the modified formula.
The percent contributed above the monthly compensation breakpoint depends upon the benefit formula, as
shown in the table below.
Benefit Formula Percent Contributed above the Breakpoint
Miscellaneous, 1.5% at 65 2%
Miscellaneous, 2% at 60 7%
Miscellaneous, 2% at 55 7%
Miscellaneous, 2.5% at 55 8%
Miscellaneous, 2.7% at 55 8%
Miscellaneous, 3% at 60 8%
Miscellaneous, 2% at 62 50% of the Total Normal Cost
Miscellaneous, 1.5% at 65 50% of the Total Normal Cost
Safety, 1/2 at 55 Varies by entry age
Safety, 2% at 55 7%
Safety, 2% at 50 9%
Safety, 3% at 55 9%
Safety, 3% at 50 9%
Safety, 2% at 57 50% of the Total Normal Cost
Safety, 2.5% at 57 50% of the Total Normal Cost
Safety, 2.7% at 57 50% of the Total Normal Cost
The employer may choose to “pick-up” these contributions for classic members (Employer Paid Member Contributions or EPMC). EPMC is prohibited for new PEPRA members. An employer may also include Employee Cost Sharing in the contract, where employees agree to share the cost of the employer contribution. These contributions are paid in addition to the member contribution. Auxiliary organizations of the CSUC system may elect reduced contribution rates, in which case the offset is $317 and the contribution rate is 6 percent if members are not covered by Social Security. If members are covered by Social Security, the offset is $513 and the contribution rate is 5 percent.
Refund of Employee Contributions
If the member’s service with the employer ends, and if the member does not satisfy the eligibility conditions for any of the retirement benefits above, the member may elect to receive a refund of his or her employee contributions, which are credited with 6 percent interest compounded annually.

CALPERS ACTUARIAL VALUATION – June 30, 2015 APPENDIX B SAFETY PLAN OF THE COUNTY OF BUTTE PRINCIPAL PLAN PROVISIONS
B-10
1959 Survivor Benefit
This is a pre-retirement death benefit available only to members not covered by Social Security. Any agency joining CalPERS subsequent to 1993 is required to provide this benefit if the members are not covered by Social Security. The benefit is optional for agencies joining CalPERS prior to 1994. Levels 1, 2 and 3 are now closed. Any new agency or any agency wishing to add this benefit or increase the current level may only choose the 4th or Indexed Level. This benefit is not included in the results presented in this valuation. More information on this benefit is available on the CalPERS website at www.calpers.ca.gov.

APPENDIX C
PARTICIPANT DATA
SUMMARY OF VALUATION DATA
ACTIVE MEMBERS
TRANSFERRED AND TERMINATED MEMBERS
RETIRED MEMBERS AND BENEFICIARIES

CALPERS ACTUARIAL VALUATION – June 30, 2015 APPENDIX C SAFETY PLAN OF THE COUNTY OF BUTTE PARTICIPANT DATA
C-1
Summary of Valuation Data
June 30, 2014 June 30, 2015
1. Active Members
a) Counts 299 301
b) Average Attained Age
40.59 40.85
c) Average Entry Age to Rate Plan 29.71 29.64
d) Average Years of Service 10.88 11.21
e) Average Annual Covered Pay $ 59,933 $ 62,094
f) Annual Covered Payroll 17,919,947 18,690,187
g) Projected Annual Payroll for Contribution Year 19,581,610 20,423,272
h) Present Value of Future Payroll 170,513,962 175,570,761
2. Transferred Members
a) Counts 98 112
b) Average Attained Age 41.07 40.38
c) Average Years of Service 3.88 3.74
d) Average Annual Covered Pay $ 72,376 $ 71,016
3. Terminated Members
a) Counts 56 57
b) Average Attained Age 38.49 38.47
c) Average Years of Service 3.82 3.53
d) Average Annual Covered Pay $ 43,540 $ 44,312
4. Retired Members and Beneficiaries
a) Counts 267 274
b) Average Attained Age 63.87 63.86
c) Average Annual Benefits $ 23,116 $ 24,101
5. Active to Retired Ratio [(1a) / (4a)] 1.12 1.10
Counts of members included in the valuation are counts of the records processed by the valuation. Multiple records may exist for those who have service in more than one valuation group. This does not result in double counting of liabilities. Average Annual Benefits represents benefit amounts payable by this plan only. Some members may have service with another agency and would therefore have a larger total benefit than would be included as part of the average shown here.

CALPERS ACTUARIAL VALUATION – June 30, 2015 APPENDIX C SAFETY PLAN OF THE COUNTY OF BUTTE PARTICIPANT DATA
C-2
Active Members
Counts of members included in the valuation are counts of the records processed by the valuation. Multiple records may exist for those who have service in more than one valuation group. This does not result in double counting of liabilities.
Distribution of Active Members by Age and Service
Years of Service at Valuation Date
Attained Age 0-4 5-9 10-14 15-19 20-25 25+ Total
15-24 9 1 0 0 0 0 10
25-29 24 4 0 0 0 0 28
30-34 21 17 6 0 0 0 44
35-39 13 18 23 4 0 0 58
40-44 2 14 26 22 4 0 68
45-49 2 6 10 12 10 1 41
50-54 2 2 9 8 4 7 32
55-59 0 2 7 3 2 2 16
60-64 1 0 0 1 0 0 2
65 and over 0 0 0 1 1 0 2
All Ages 74 64 81 51 21 10 301
Distribution of Average Annual Salaries by Age and Service
Years of Service at Valuation Date
Attained Age 0-4 5-9 10-14 15-19 20-25 25+ Average
15-24 $40,995 $55,074 $0 $0 $0 $0 $42,403
25-29 43,260 56,315 0 0 0 0 45,125
30-34 49,669 57,986 53,354 0 0 0 53,385
35-39 53,063 61,011 64,285 66,237 0 0 60,888
40-44 51,373 58,317 63,600 71,060 100,189 0 66,718
45-49 45,862 63,357 61,083 70,544 76,877 66,794 67,434
50-54 69,222 63,462 64,926 68,491 94,350 87,967 74,712
55-59 0 49,852 67,041 83,996 73,039 69,078 69,076
60-64 132,288 0 0 58,520 0 0 95,404
65 and over 0 0 0 66,778 66,988 0 66,883
All Ages $48,720 $59,180 $63,169 $70,588 $83,809 $82,072 $62,094

CALPERS ACTUARIAL VALUATION – June 30, 2015 APPENDIX C SAFETY PLAN OF THE COUNTY OF BUTTE PARTICIPANT DATA
C-3
Transferred and Terminated Members
Distribution of Transfers to Other CalPERS Plans by Age and Service
Years of Service at Valuation Date
Attained Age 0-4 5-9 10-14 15-19 20-25 25+ Total
Average Salary
15-24 1 0 0 0 0 0 1 $44,543
25-29 10 0 0 0 0 0 10 48,698
30-34 18 3 0 0 0 0 21 64,790
35-39 14 4 0 0 0 0 18 74,903
40-44 17 13 0 0 0 0 30 74,056
45-49 14 6 0 1 0 0 21 79,848
50-54 7 0 2 0 0 0 9 77,653
55-59 0 1 0 0 0 0 1 72,170
60-64 1 0 0 0 0 0 1 43,861
65 and over 0 0 0 0 0 0 0 0
All Ages 82 27 2 1 0 0 112 71,016
Distribution of Terminated Participants with Funds on Deposit by Age and Service
Years of Service at Valuation Date
Attained Age 0-4 5-9 10-14 15-19 20-25 25+ Total
Average Salary
15-24 2 0 0 0 0 0 2 $41,376
25-29 5 0 0 0 0 0 5 35,390
30-34 10 4 0 0 0 0 14 45,502
35-39 12 1 0 0 0 0 13 35,654
40-44 6 4 1 0 0 0 11 58,630
45-49 4 3 0 0 1 0 8 47,170
50-54 0 1 1 0 0 0 2 43,780
55-59 2 0 0 0 0 0 2 27,854
60-64 0 0 0 0 0 0 0 0
65 and over 0 0 0 0 0 0 0 0
All Ages 41 13 2 0 1 0 57 44,312

CALPERS ACTUARIAL VALUATION – June 30, 2015 APPENDIX C SAFETY PLAN OF THE COUNTY OF BUTTE PARTICIPANT DATA
C-4
Retired Members and Beneficiaries
Distribution of Retirees and Beneficiaries by Age and Retirement Type*
Attained Age
Service Retirement
Non-Industrial Disability
Industrial Disability
Non-Industrial
Death Industrial
Death
Death After
Retirement Total
Under 30 0 0 0 0 0 1 1
30-34 0 0 1 0 0 0 1
35-39 0 0 5 0 1 0 6
40-44 0 0 8 0 0 1 9
45-49 0 0 9 0 0 0 9
50-54 13 2 4 0 1 0 20
55-59 33 0 17 0 1 2 53
60-64 25 0 17 0 0 3 45
65-69 38 0 14 0 0 4 56
70-74 19 0 10 0 1 5 35
75-79 11 0 2 0 0 5 18
80-84 9 0 2 0 0 3 14
85 and Over 3 1 1 0 0 2 7
All Ages 151 3 90 0 4 26 274
Distribution of Average Annual Amounts for Retirees and Beneficiaries by Age and Retirement Type*
Attained Age
Service Retirement
Non-Industrial Disability
Industrial Disability
Non-Industrial
Death Industrial
Death
Death After
Retirement Average
Under 30 $0 $0 $0 $0 $0 $7,034 $7,034
30-34 0 0 24,762 0 0 0 24,762
35-39 0 0 18,158 0 37,409 0 21,367
40-44 0 0 25,361 0 0 7,034 23,325
45-49 0 0 21,580 0 0 0 21,580
50-54 30,260 15,136 25,746 0 41,529 0 28,408
55-59 23,793 0 22,740 0 37,409 7,330 23,091
60-64 36,893 0 18,827 0 0 28,893 29,534
65-69 29,317 0 12,171 0 0 17,536 24,189
70-74 29,233 0 21,454 0 63,642 15,113 25,976
75-79 19,478 0 27,528 0 0 20,678 20,706
80-84 11,919 0 22,555 0 0 8,477 12,701
85 and Over 15,789 13,998 2,267 0 0 20,329 14,899
All Ages $27,412 $14,757 $20,107 $0 $44,997 $16,561 $24,101

CALPERS ACTUARIAL VALUATION – June 30, 2015 APPENDIX C SAFETY PLAN OF THE COUNTY OF BUTTE PARTICIPANT DATA
C-5
Retired Members and Beneficiaries (continued)
Distribution of Retirees and Beneficiaries by Years Retired and Retirement Type*
Years Retired
Service Retirement
Non-Industrial Disability
Industrial Disability
Non-Industrial
Death Industrial
Death
Death After
Retirement Total
Under 5 Yrs 50 0 15 0 0 5 70
5-9 35 2 19 0 0 9 65
10-14 37 0 11 0 2 4 54
15-19 11 0 13 0 1 4 29
20-24 14 0 6 0 0 2 22
25-29 4 0 13 0 1 2 20
30 and Over 0 1 13 0 0 0 14
All Years 151 3 90 0 4 26 274
Distribution of Average Annual Amounts for Retirees and Beneficiaries by Years Retired and Retirement Type*
Years Retired
Service Retirement
Non-Industrial Disability
Industrial Disability
Non-Industrial
Death Industrial
Death
Death After
Retirement Average
Under 5 Yrs $28,869 $0 $23,980 $0 $0 $16,277 $26,922
5-9 29,093 15,136 23,646 0 0 19,851 25,791
10-14 30,695 0 25,663 0 50,526 18,144 29,475
15-19 26,312 0 13,843 0 37,409 10,948 18,986
20-24 14,568 0 15,981 0 0 15,667 15,053
25-29 12,116 0 14,868 0 41,529 11,425 15,307
30 and Over 0 13,998 19,173 0 0 0 18,804
All Years $27,412 $14,757 $20,107 $0 $44,997 $16,561 $24,101
* Counts of members do not include alternate payees receiving benefits while the member is still working. Therefore, the total counts may not match information on page 25 of the report. Multiple records may exist for those who have service in more than one coverage group. This does not result in double counting of liabilities.

APPENDIX D
DEVELOPMENT OF PEPRA MEMBER CONTRIBUTION
RATES
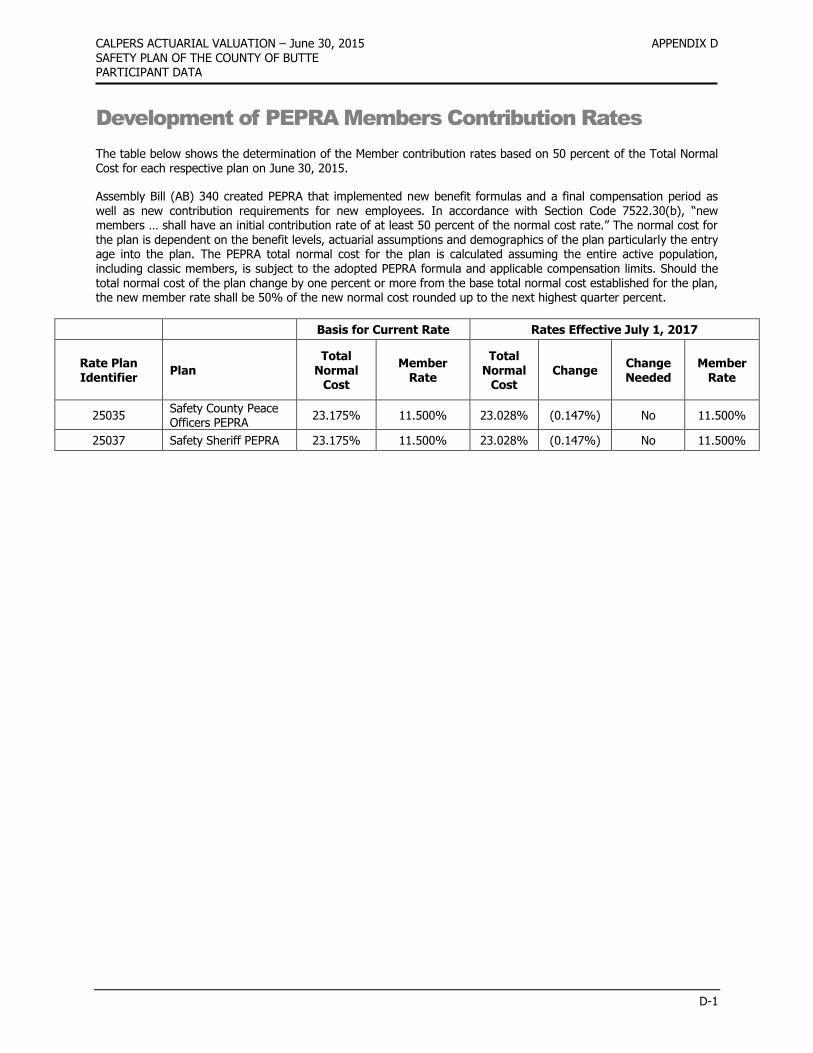
CALPERS ACTUARIAL VALUATION – June 30, 2015 APPENDIX D SAFETY PLAN OF THE COUNTY OF BUTTE PARTICIPANT DATA
D-1
Development of PEPRA Members Contribution Rates
The table below shows the determination of the Member contribution rates based on 50 percent of the Total Normal Cost for each respective plan on June 30, 2015.
Assembly Bill (AB) 340 created PEPRA that implemented new benefit formulas and a final compensation period as well as new contribution requirements for new employees. In accordance with Section Code 7522.30(b), “new members … shall have an initial contribution rate of at least 50 percent of the normal cost rate.” The normal cost for the plan is dependent on the benefit levels, actuarial assumptions and demographics of the plan particularly the entry age into the plan. The PEPRA total normal cost for the plan is calculated assuming the entire active population, including classic members, is subject to the adopted PEPRA formula and applicable compensation limits. Should the total normal cost of the plan change by one percent or more from the base total normal cost established for the plan, the new member rate shall be 50% of the new normal cost rounded up to the next highest quarter percent.
Basis for Current Rate Rates Effective July 1, 2017
Rate Plan Identifier
Plan Total
Normal Cost
Member Rate
Total Normal
Cost Change
Change Needed
Member Rate
25035 Safety County Peace Officers PEPRA
23.175% 11.500% 23.028% (0.147%) No 11.500%
25037 Safety Sheriff PEPRA 23.175% 11.500% 23.028% (0.147%) No 11.500%

APPENDIX E
GLOSSARY OF ACTUARIAL TERMS
CALPERS ACTUARIAL VALUATION – June 30, 2015 APPENDIX E SAFETY PLAN OF THE COUNTY OF BUTTE GLOSSARY OF ACTUARIAL TERMS
E-1
Glossary of Actuarial Terms
Accrued Liability (also called Actuarial Accrued Liability or Entry Age Normal Accrued Liability)
The total dollars needed as of the valuation date to fund all benefits earned in the past for current members. Actuarial Assumptions
Assumptions made about certain events that will affect pension costs. Assumptions generally can be broken down into two categories: demographic and economic. Demographic assumptions include such things as mortality, disability and retirement rates. Economic assumptions include discount rate, salary growth and inflation.
Actuarial Methods
Procedures employed by actuaries to achieve certain funding goals of a pension plan. Actuarial methods include funding method, setting the length of time to fund the Accrued Liability and determining the Value of Assets.
Actuarial Valuation
The determination, as of a valuation date of the Normal Cost, Accrued liability, and related actuarial present values for a pension plan. These valuations are performed annually or when an employer is contemplating a change to their plan provisions.
Amortization Bases
Separate payment schedules for different portions of the Unfunded Liability. The total Unfunded Liability of a Risk Pool or non-pooled plan can be segregated by "cause,” creating “bases” and each such base will be separately amortized and paid for over a specific period of time. However, all bases are amortized using investment and payroll assumptions from the current valuation. This can be likened to a home having a first mortgage of 24 years remaining payments and a second mortgage that has 10 years remaining payments. Each base or each mortgage note has its own terms (payment period, principal, etc.)
Generally, in an actuarial valuation, the separate bases consist of changes in unfunded liability due to contract amendments, actuarial assumption changes, actuarial methodology changes, and/or gains and losses. Payment periods are determined by Board policy and vary based on the cause of the change.
Amortization Period
The number of years required to pay off an Amortization Base. Classic Member (under PEPRA)
A classic member is a member who joined CalPERS prior to January, 1, 2013 and who is not defined as a new member under PEPRA. (See definition of new member below)
Discount Rate Assumption
The actuarial assumption that was called “investment return” in earlier CalPERS reports or “actuarial interest rate” in Section 20014 of the California Public Employees’ Retirement Law (PERL).
Entry Age
The earliest age at which a plan member begins to accrue benefits under a defined benefit pension plan. In most cases, this is the age of the member on their date of hire.
Entry Age Normal Cost Method
An actuarial cost method designed to fund a member's total plan benefit over the course of his or her career. This method is designed to yield a rate expressed as a level percentage of payroll. (The assumed retirement age less the entry age is the amount of time required to fund a member’s total benefit. Generally, the older a member on the date of hire, the greater the entry age normal cost. This is mainly because there is less time to earn investment income to fund the future benefits.)

CALPERS ACTUARIAL VALUATION – June 30, 2015 APPENDIX E SAFETY PLAN OF THE COUNTY OF BUTTE GLOSSARY OF ACTUARIAL TERMS
E-2
Fresh Start A Fresh Start is when multiple amortization bases are collapsed to one base and amortized together over a new funding period.
Funded Status
A measure of how well funded, or how "on track" a plan or risk pool is with respect to assets versus accrued liabilities. A ratio greater than 100% means the plan or risk pool has more assets than liabilities and a ratio less than 100% means liabilities are greater than assets.
GASB 68
Statement No. 68 of the Governmental Accounting Standards Board. The accounting standard governing a state or local governmental employer’s accounting and financial reporting for pensions. GASB 68 replaces GASB 27 effective the first fiscal year beginning after June 15, 2014.
New Member (under PEPRA) A new member includes an individual who becomes a member of a public retirement system for the first time on
or after January 1, 2013, and who was not a member of another public retirement system prior to that date, and who is not subject to reciprocity with another public retirement system.
Normal Cost
The annual cost of service accrual for the upcoming fiscal year for active employees. The normal cost should be viewed as the long term contribution rate.
Pension Actuary
A business professional that is authorized by the Society of Actuaries, and the American Academy of Actuaries to perform the calculations necessary to properly fund a pension plan.
PEPRA
The California Public Employees’ Pension Reform Act of 2013 Prepayment Contribution
A payment made by the employer to reduce or eliminate the year’s required employer contribution. Present Value of Benefits (PVB)
The total dollars needed as of the valuation date to fund all benefits earned in the past or expected to be earned in the future for current members.
Superfunded
A condition existing when a plan’s Actuarial Value of Assets exceeds its Present Value of Benefits. Prior to the passage of PEPRA, when this condition existed on a given valuation date for a given plan, employee contributions for the rate year covered by that valuation could be waived.
Unfunded Liability (UAL)
When a plan or pool’s Value of Assets is less than its Accrued Liability, the difference is the plan or pool’s Unfunded Liability. If the Unfunded Liability is positive, the plan or pool will have to pay contributions exceeding the Normal Cost.