Embed Size (px)
Citation preview
PROJECT DESIGN DOCUMENT FORM (CDM PDD) - Version 02 CDM – Executive Board page 1
This template shall not be altered. It shall be completed without modifying/adding headings or logo, format or font.
CLEAN DEVELOPMENT MECHANISM PROJECT DESIGN DOCUMENT FORM (CDM-PDD)
Version 02 - in effect as of: 1 July 2004)
AUROBINDO AGRO ENERGY PRIVATE LIMITED.
21 MW GRID CONNECTED ELECTRICITY GENERATION FROM BIOMASS RESIDUES
PROJECT DESIGN DOCUMENT FORM (CDM PDD) - Version 02 CDM – Executive Board page 2
This template shall not be altered. It shall be completed without modifying/adding headings or logo, format or font.
CONTENTS A. General description of project activity B. Application of a baseline methodology C. Duration of the project activity / Crediting period D. Application of a monitoring methodology and plan E. Estimation of GHG emissions by sources F. Environmental impacts G. Stakeholders’ comments
Annexes Annex 1: Contact information on participants in the project activity Annex 2: Information regarding public funding Annex 3: Baseline information Annex 4. Monitoring Plan
Annex 5: Biomass Availability Annex 6: Power Scenario in India
PROJECT DESIGN DOCUMENT FORM (CDM PDD) - Version 02 CDM – Executive Board page 3
This template shall not be altered. It shall be completed without modifying/adding headings or logo, format or font.
SECTION A. General description of project activity A.1 Title of the project activity: 21 MW grid connected biomass based power generation by Aurobindo Agro Energy Pvt.Ltd,
Kalayarkovil, Sivagangai District in TamilNadu.
Version: 1 Date : 08/07/2006 A.2. Description of the project activity:
The 21 MW grid connected biomass based power plant has been implemented by Aurobindo Agro
Energy Pvt Ltd. (AAEPL), in Sivagangai district of Tamilnadu,India.The generated green power will be
sold and exported to Tamil Nadu Electricity Board (TNEB) grid based on a 15 year Power Purchase
Agreement (PPA) with TNEB. This biomass based power generation will replace the fossil fuel based
thermal power generation in the southern regional grid. The project activity is proposed to be
implemented in two phases,
Phase- I:
8.5 MW capacity is planned to be commissioned before August 2006.
Phase- II:
Ground work for 12.5 MW capacity has been completed and power generation will be started before
March -2008
The implementation of power generation projects based on biomass in rural areas will create adequate
employment opportunities, additional income generation, awareness and positive impact in the mind of
local people, which in turn will improve life standards of local people.
The following are the main purpose of the project activity:
Contribute to the Sustainable Development through the effective utilization of biomass residues
available in the project region for Power generation, thereby enhancing additional income
through rural employment opportunities in the region.
Climate Change mitigation through the generation of eco-friendly power and reduce the
dependence on fossil fuel based conventional power.
The main objective of project activity is to achieve sustainable development in the rural region by
enhancing four pillars of sustainable development such as:
PROJECT DESIGN DOCUMENT FORM (CDM PDD) - Version 02 CDM – Executive Board page 4
This template shall not be altered. It shall be completed without modifying/adding headings or logo, format or font.
Social well being
Economic well being
Environmental well being
Technological well being
Social well being
• Social inequalities have been cleared due to the emergence of power plant which provides jobs for both skilled and unskilled labours in the local area.
• The effective collection and utilisation of biomass residues for power generation will give a
social status to the farmers Economic well being
• To construct the power plant a large area has been required so the project promoter purchased wastelands from farmers. The farmers are benefited as they have limited or no use of the wasteland.
• The continuous operation of power plant provides daily employment and regular income for
casual labours near project site.
• The requirement of biomass fuel for power plant will provide regular income for both biomass dealers and owners dealing with biomass transport.
Environmental well being CO2 emission from thermal power plants by burning fossil fuel plays a major role in the climate change
alleviation and enhancement of global warming. Aurobindo Agro Energy Pvt.Ltd involved themselves in
environmental friendly power generation sector by using biomass as a prime fuel in their power plant to
generate green power. Combustion of biomass in the proposed project does not result in net increase in
GHG emissions of CO2, CH4 and NOx. While the CO2 forms the major constituent of GHG emissions
with about 98%, CH4 and NOx constitute the remaining 2%. Typical ultimate analysis of biomass
materials indicates the Nitrogen content within 1 to 2%, which is negligible. Hence CO2 is considered as
the only GHG emissions from biomass. However since emissions from biomass is considered CO2 neutral
based on their life cycle emissions analysis, no CO2 emissions is estimated from this project.
Technology Well being
PROJECT DESIGN DOCUMENT FORM (CDM PDD) - Version 02 CDM – Executive Board page 5
This template shall not be altered. It shall be completed without modifying/adding headings or logo, format or font.
The technology implemented in the project activity is based on combustion of biomass for steam
generation in high temperature and high pressure boiler and generation of power from steam turbine
based on Rankine cycle technology. Some of the benefits due to implementation of technology are
explained below :
• Reduce specific water consumption
• As this technology is well improved there will be a consistent operation of power plant which
gives confidence to employees working at site.
• All the grid connected biomass based power projects in India are based on the biomass
combustion boiler and Rankine cycle, a highly advanced and state-of-art technology. Hence
considerable operational experience is available in the country and the access to the technology
has been well established.
• In sharp contrast to fossil fuels and most of the other renewable energy sources, the local
harvesting and utilisation of biomass and its local conversion into electricity and energy creates
local value addition most of which stays in the local economy and contributes to poverty
reduction
• The plant’s operation and maintanence requirements are not so complex. Hence even local skills
can also get an opportunity to operate the plant, which is additional benefit for people in local
area of project activity.
A.3. Project participants: Name of party involved ((host) indicates a host party)
Private and/or Public entity (ies) project
participants
Kindly indicate if the Party involved wishes to be considered as project
participant Ministry of Environment and Forest, Government of India
(host)
Aurobindo Agro Energy Private Limited
No
A.4.Technical description of the project activity:
PROJECT DESIGN DOCUMENT FORM (CDM PDD) - Version 02 CDM – Executive Board page 6
This template shall not be altered. It shall be completed without modifying/adding headings or logo, format or font.
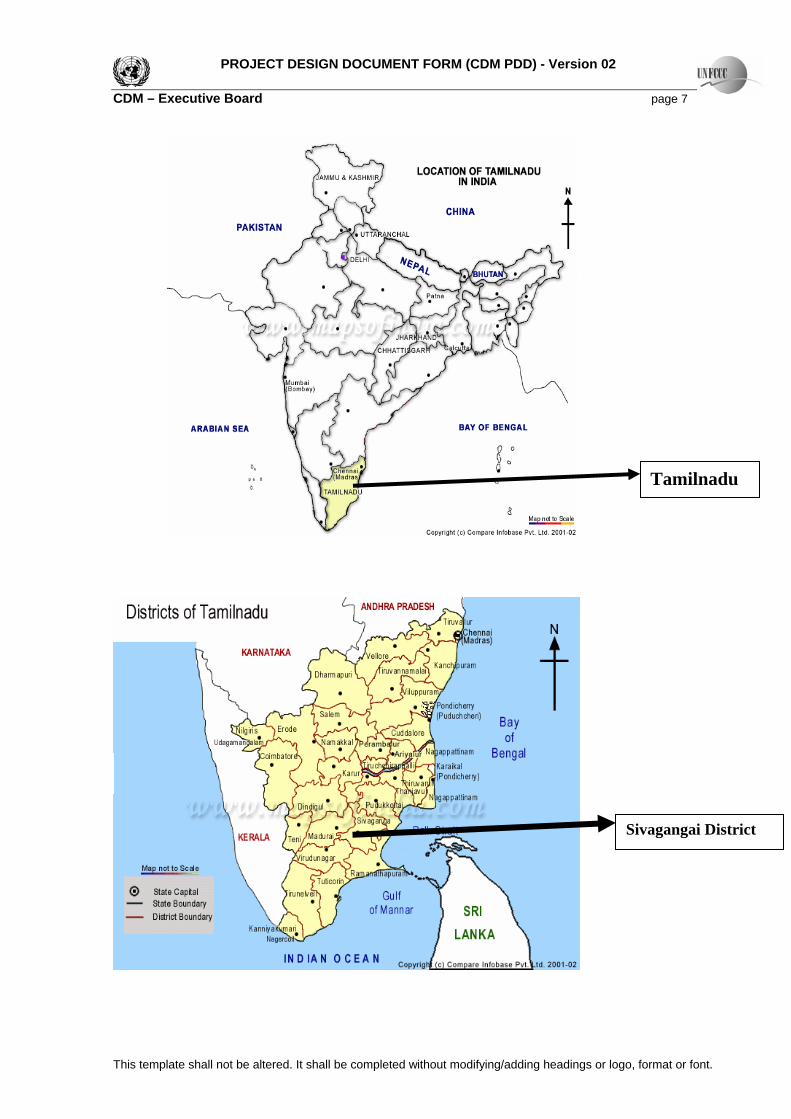
A.4.1. Location of the project activity: A.4.1.1.Host Party (ies): India A.4.1.2.Region/State/Province etc.: Tamilnadu A.4.1.3.City/Town/Community etc: Virgadi Kadambangulam Village, Kalayarkoil Taluka, Sivagangai District. A.4.1.4.Detail of physical location, including information allowing the unique identification of this project activity (maximum one page):
The project site is physically located at Sivagangai District, Tamilnadu. The state highway is 2.5 km from
the plant site.Sivagangai Railway Station is about 16 kms.The nearest airport is Madurai and is about 60
kms from project site. The site is located at 78 °5 ‘E longitude and 9° 2 ‘N latitude
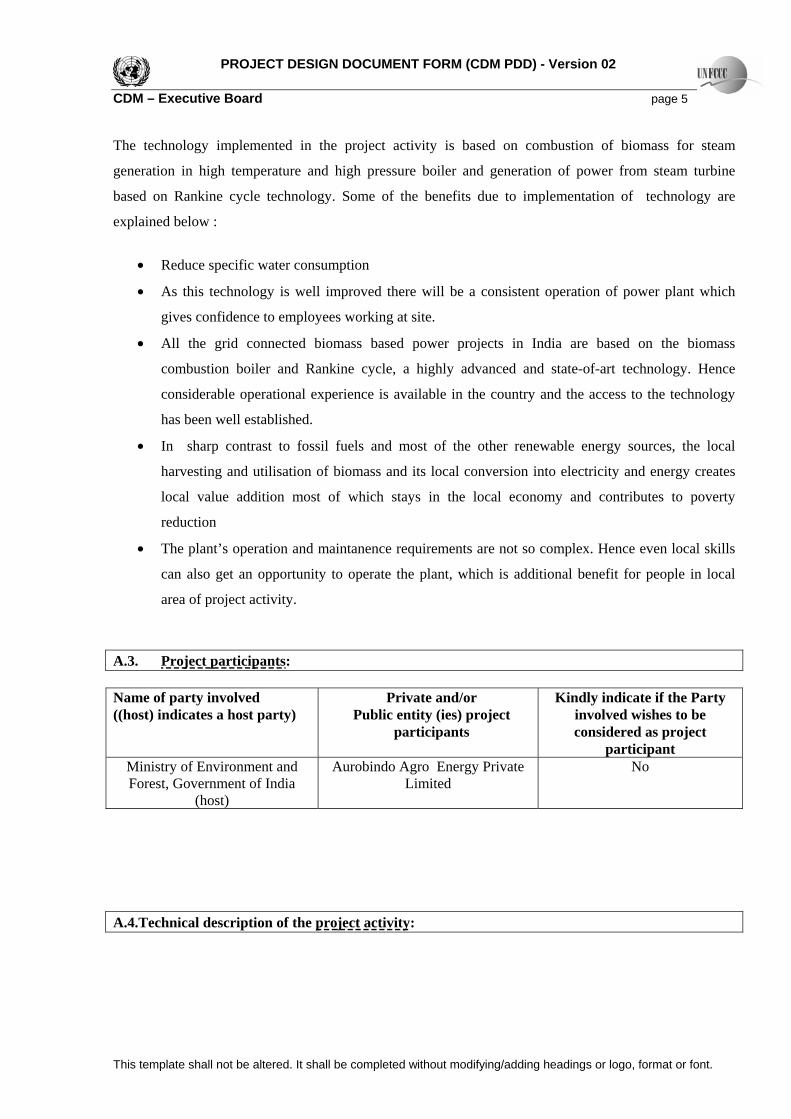
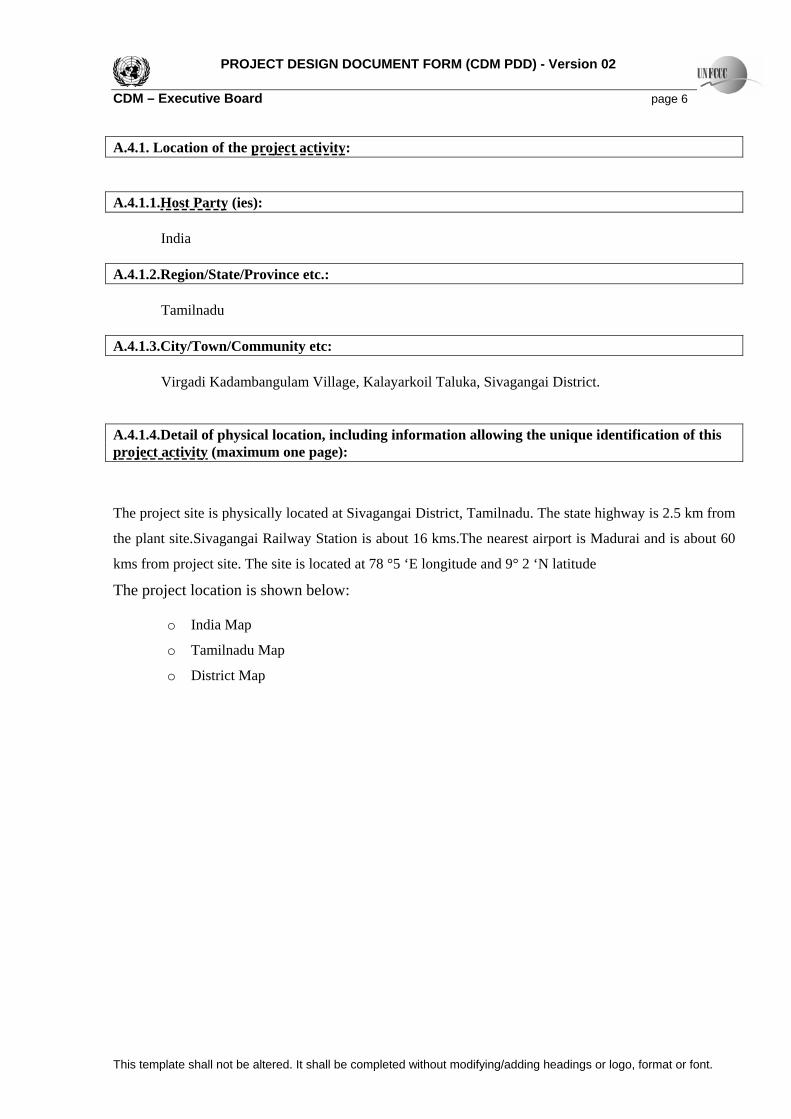
The project location is shown below:
o India Map
o Tamilnadu Map
o District Map
PROJECT DESIGN DOCUMENT FORM (CDM PDD) - Version 02 CDM – Executive Board page 7
This template shall not be altered. It shall be completed without modifying/adding headings or logo, format or font.
Tamilnadu
Sivagangai District
PROJECT DESIGN DOCUMENT FORM (CDM PDD) - Version 02 CDM – Executive Board page 8
This template shall not be altered. It shall be completed without modifying/adding headings or logo, format or font.
o District Map
Sivaganga Taluka
A.4.2. Type and Category (ies) of project activity: The project falls under the UNFCCC large scale CDM project activity categories under Approved
consolidated baseline methodology ACM0006, “Consolidated baseline methodology for grid-
connected electricity generation from biomass residues”. This is a grid connected biomass power
project of more than 15 MW and less than 60 MW capacity .The power generated by the project activity
is directly exported to the southern regional grid which is currently fed and dominated by fossil fuel based
power plants.
PROJECT DESIGN DOCUMENT FORM (CDM PDD) - Version 02 CDM – Executive Board page 9
This template shall not be altered. It shall be completed without modifying/adding headings or logo, format or font.
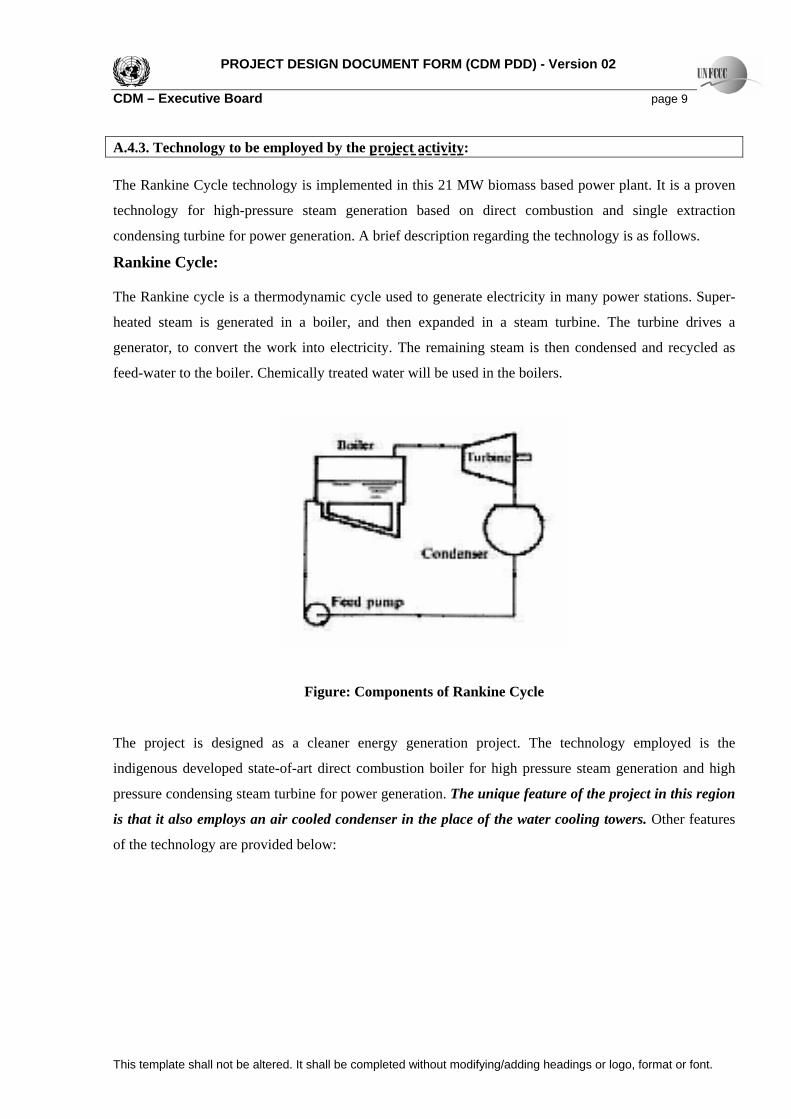
A.4.3. Technology to be employed by the project activity: The Rankine Cycle technology is implemented in this 21 MW biomass based power plant. It is a proven
technology for high-pressure steam generation based on direct combustion and single extraction
condensing turbine for power generation. A brief description regarding the technology is as follows.
Rank The Ran
heated turbine. The turbine drives a
gen
feed-wa
ine Cycle:
kine cycle is a thermodynamic cycle used to generate electricity in many power stations. Super-
steam is generated in a boiler, and then expanded in a steam
erator, to convert the work into electricity. The remaining steam is then condensed and recycled as
ter to the boiler. Chemically treated water will be used in the boilers.
Figure: Components of Rankine Cycle The project is designed as a cleaner energy generation project. The technology employed is the
indigenous developed state-of-art direct combustion boiler for high pressure steam generation and high
pressure condensing steam turbine for power generation. The unique feature of the project in this region
is that it also employs an air cooled condenser in the place of the water cooling towers. Other features
f the technology are provided below: o
PROJECT DESIGN DOCUMENT FORM (CDM PDD) - Version 02 CDM – Executive Board page 10
This template shall not be altered. It shall be completed without modifying/adding headings or logo, format or font.
The pro phase-I is 8.5 MW
whic consists o one 33 T W s e. T oning date
of Phase-I will be August 2006. The installed capacity of phase-II is 12.5 MW which consists of one
47.32 TPH steam generator with one 12.5 MW steam tu The co oning -II will be
March 2008.
The s enerator proposed u t will b ker fire ral circul o drum
balanced draft type and deliver super heated s 65 bar 485 °C supplied
with ter at a ure of .
Rene ass as a f trave e combustion steam generator to produce
high-pressure steam in urbine ate power
The urbine w of t omp enerat densing horizontally split
double casing machine with one uncontrolled extraction for feed heating in the deaerator.
T am at HP Turbine inlet will be at 0 °C a xhaust fro urbine is
0.180 a
thropogenic emissions of anthropogenic greenhouse gas
ject activity has been implemented in two phases. The installed capacity of
h f PH steam generator with one 8.5 M team turbin he commissi
date of Phaserbine. mmissi
team g for the ni e of sto d , natu ation ,tw
team at (a) and ,when
feed wa temperat 105 °C
wable biom is burnt uel in a lling grat
, which is then expanded a steam t to gener .
steam t ould be andem c ound, reg ive, con
he main ste 63 ata, 48 nd the e m the t
condensed in the air cooled condenser, which is maintained at a pressure ta
A.4.4. Brief explanation of how the an(G proposed CDM project activityHGs) by sources are to be reduced by the , including why the emission reductions would not occur in the absence of the proposed project activity, taking into account national and/or sectoral policies and circumstances: Biomass fuels such as Prosopis Juliflora and other agricultural residue like Eucalyptus Wood, Coconut
esidues, Chilly Stalks and Sugarcane Trash are utilised for power generation in the proposed power
moter selected biomass as fuel for their power
lant mainly due to its resultant neutral anthropogenic green house gas emissions. According to the
filling
ower demand. The power generation through thermal power plants by utilising fossil fuel results in CO2
DM project activity, the power
will result in generation of greenhouse gas
A.4.4.1.Estimated amount of emission reductions over the chosen crediting period
R
plant of Aurobindo Agro Energy Pvt Ltd. The project pro
p
current scenario in India the fossil fuel based thermal power plants are playing major role in ful
p
emission which leads to global warming. In the absence of proposed C
generated from the fossil fuel based southern regional grid
emissions.
:
PROJECT DESIGN DOCUMENT FORM (CDM PDD) - Version 02 CDM – Executive Board page 11
This template shall not be altered. It shall be completed without modifying/adding headings or logo, format or font.
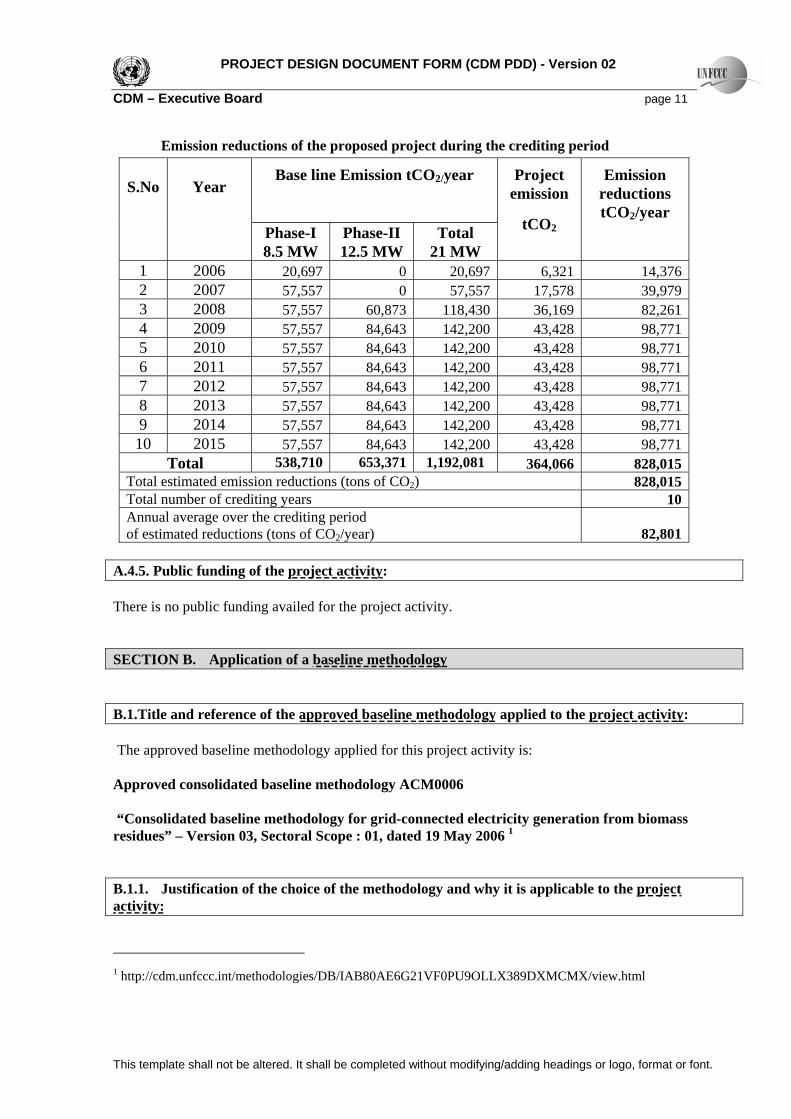
Emission reductions of the proposed project during the crediting period
Base line Emission tCO2/year
S.No
Year
Phase-I 8.5 MW
Phase-II 12.5 MW
Total 21 MW
Project emission
tCO2
Emission reductions tCO2/year
1 2006 20,697 0 20,697 6,321 14,3762 2007 57,557 0 57,557 17,578 39,9793 2008 57,557 60,873 118,430 36,169 82,2614 2009 57,557 84,643 142,200 43,428 98,7715 2010 57,557 84,643 142,200 43,428 98,7716 2011 57,557 84,643 142,200 43,428 98,7717 2012 57,557 84,643 142,200 43,428 98,7718 2013 57,557 84,643 142,200 43,428 98,7719 2014 57,557 84,643 142,200 43,428 98,77110 2015 57,557 84,643 142,200 98,77143,428
T 53 3,371 1,192,081 828,01otal 8,710 65 364,066 5Total estimated emission reductions (tons of CO2) 828, 015Tota credi 10l number of ting years Annual average over the crediting period of es ction timated redu s (tons of CO2/year) 82,801
A.4.5. Public funding of the project activity: There is no public fundin roject a
g availed for the p ctivity.
SECTION B. Application of a baseline methodology B.1.Title and reference of the approved baseline methodology applied to the project activity: The ap aseline m for th t activit Appro lidated y A “Consolidated baseline m biomass residues” – Version 03, Sectoral Scope : 01, dated 19 May 2006 B.1.1. Justification of the choice of the methodology and why it is applicable to the project
proved b
ved conso
ethodology applied
baseline methodolog
ethodology for grid-connected electricity generation from
is projec
CM0006
y is:
1
activity:
1 http://cdm.unfccc.int/methodologies/DB/IAB80AE6G21VF0PU9OLLX389DXMCMX/view.html
PROJECT DESIGN DOCUMENT FORM (CDM PDD) - Version 02 CDM – Executive Board page 12
This template shall not be altered. It shall be completed without modifying/adding headings or logo, format or font.
The project activity is implementation of a grid connected 21 MW biomass based power plan
nerated electricity is exported to the southern regional grid. The fuel used for this power plant is
t. The
ge CO2
eutral renewable biomass residues. The methodology used for this project activity is ACM0006,
generation project activities
is project activity is a Greenfield power project
n
“Consolidated baseline methodology for grid-connected electricity generation from biomass
residues” and this is the most appropriate methodology available in the UNFCCC for grid-connected
biomass residue fired electricity
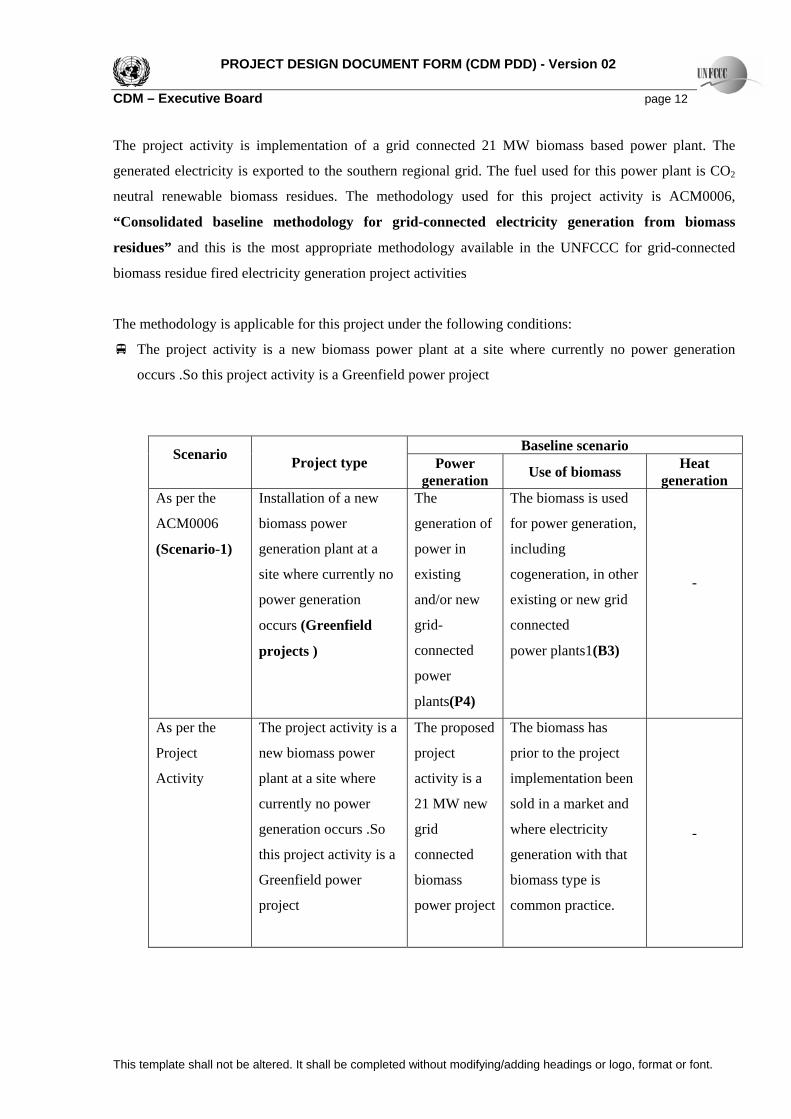
The methodology is applicable for this project under the following conditions:
The project activity is a new biomass power plant at a site where currently no power generation
occurs .So th
Baseline scenario Scenario Project type Power
generation Use of biomass Heat generation
As per the Installation of a new The The biomass is used
ACM0006 biomass power
ntly no
generation of
existing
power
for power generation,
cogeneration, in other
-
(Scenario-1) generation plant at a
site where curre
power in including
power generation
occurs (Greenfield
projects )
and/or new
grid-
connected
existing or new grid
connected
power plants1(B3)
plants(P4)
As per the
Project
The project activity is a The proposed The biomass has
Activity
new biomass power
plant at a site where
project
activity is a
prior to the project
implementation been
generation with that -
currently no power
generation occurs .So
this project activity is a
21 MW new
grid
connected
sold in a market and
where electricity
Greenfield power biomass biomass type is
project power project common practice.
PROJECT DESIGN DOCUMENT FORM (CDM PDD) - Version 02 CDM – Executive Board page 13
This template shall not be altered. It shall be completed without modifying/adding headings or logo, format or font.
• No other biomass types than biomass residues are used in the project plant and these biomass
r
The pre this project activity are prosopis juliflora from waste land and other
agri
coal.
For projects that use biomass residues from a production process (e.g. production of sugar or wood
pan
capacity of raw input (e.g. sugar, rice, logs, etc.) or in other substantial changes (e.g. product change)
in t
This Pr wer plant. The biomass residues used in this project
ctivity are prosopis juliflora and other agricultural residue coming from the nearby area and market.
The biomass used by the project facility should not be or mor
Biomass used for this pr l not be stored
for more than one year w
No sig gy q to prep e the
biomas r bu r pro iomass residues prior to
combustion (e.g.esterification of waste oils) are no der
The major biomass used Prosopis juliflora and other agricultural residues. There
is no significant energy portation of the biomass, are required to prepare this
biomass residues.
“Scen t invol s the
installa ew pow ower er
generated by the project
Description of how the methodology is applied in the context of the project activity
esidues are the predominant fuel used in the project plant (some fossil fuels may be co-fired);
dominant fuels used for
cultural residue (Annexure V) available in this region. The project will also co-fire fossil fuel namely
el boards), the implementation of the project shall not result in an increase of the processing
his process;
oject activity is an independent biomass po
a
stored f e than one year;
oject is available in this re
ithin the plant.
uantities, except from tran
gion through ou
sportation of the
ojects that
t eligible un
t the year. Biomass wil
biomass, are required
cess the b
nificant ener
s residues fo
ar
fuel com stion, i.e. p
this methodology.
for this project activity is
quantities, except from trans
ield Power Projects” has
er plant at a site where cu
activity is fed into the sout
ario 1-Green F
tion of a n
been applied fo
rrently no p
hern grid.
r the project activity tha
generation occurs. The pow
ve
B.2. : The project activity follows the Scenario 1- Green Field Power Projects of the Table 1 of methodology
ACM0006.
PROJECT DESIGN DOCUMENT FORM (CDM PDD) - Version 02 CDM – Executive Board page 14
This template shall not be altered. It shall be completed without modifying/adding headings or logo, format or font.
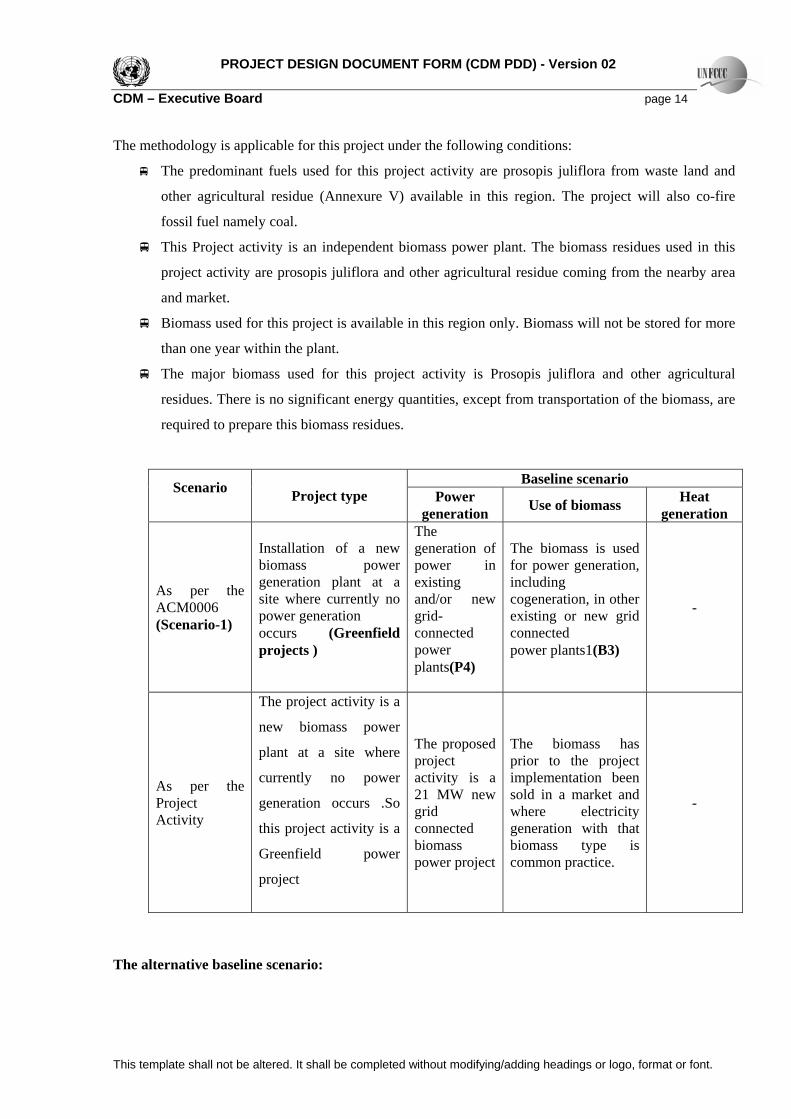
The methodology is applicable for this project under the following conditions:
from waste land and
roject will also co-fire
fossil fuel namely coal.
ass residues used in this
The major biomass used for this project activity is Prosopis juliflora and other agricultural
The alternative baseline scenario:
The predominant fuels used for this project activity are prosopis juliflora
other agricultural residue (Annexure V) available in this region. The p
This Project activity is an independent biomass power plant. The biom
project activity are prosopis juliflora and other agricultural residue coming from the nearby area
and market.
Biomass used for this project is available in this region only. Biomass will not be stored for more
than one year within the plant.
residues. There is no significant energy quantities, except from transportation of the biomass, are
required to prepare this biomass residues.
Baseline scenario Scenario Project type Power
generation Use of biomass Heat generation
As per ACM0006 (Scenario-1)
biomass power
power generation field
power in
grid-connected power plants(P4)
for power generation,
existing or new grid connected
ant
-
Installation of a new The generation of The biomass is used
the generation plant at a site where currently no
existing and/or new
including cogeneration, in other
occurs (Greenprojects )
power pl s1(B3)
AsProject
vity is a
power
ant at a site where
generation occurs .So
Greenfield power
The proposed project
ity is a 21 MW new
biomass power project
The biomass has the ect
implementation been sold in a market and
that
biomass type is common practice.
-
The project acti
new biomass
pl
per the currently no power activ
Activity this project activity is a grid connected
where electricitygeneration with
project
prior to proj
PROJECT DESIGN DOCUMENT FORM (CDM PDD) - Version 02 CDM – Executive Board page 15
This template shall not be altered. It shall be completed without modifying/adding headings or logo, format or font.
1. How power would be generated i
n the absence of the CDM project activity
2. What would happen to the biomass in the absence of the project activity;
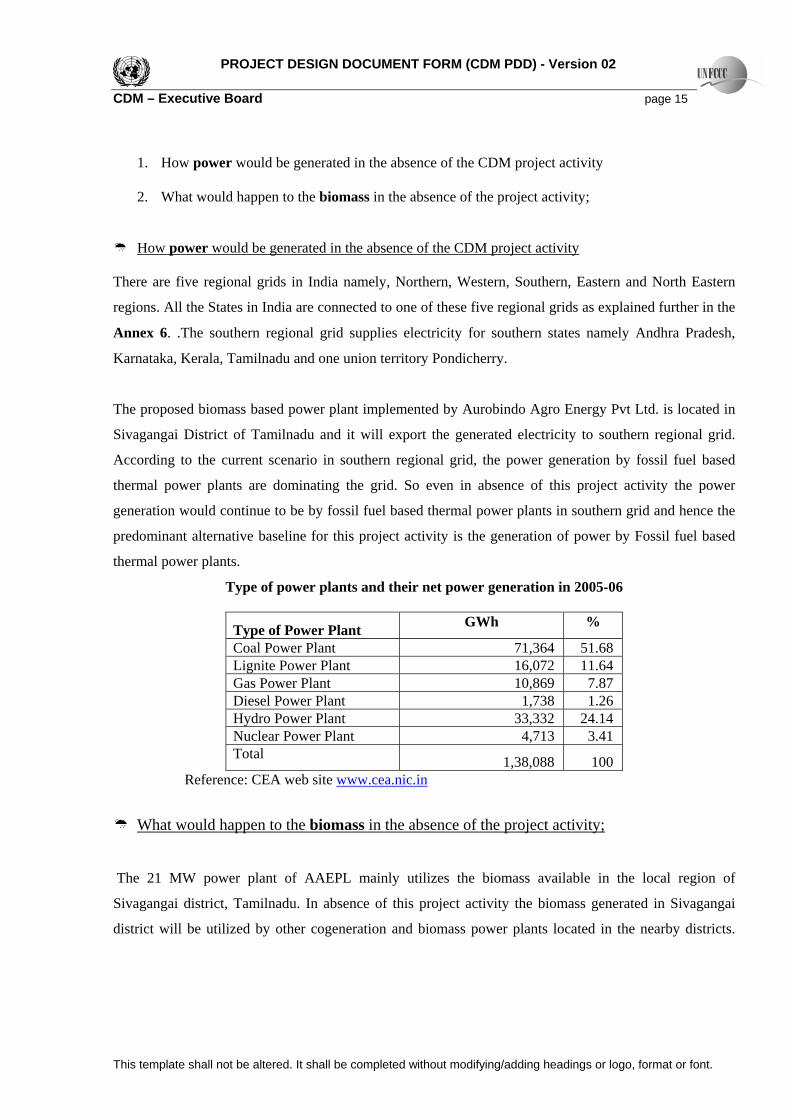
How power would be generated in the absence of the CDM project activity There are five regional grids in India namely, Northern, Western, Southern, Eastern and North Eastern
regions. All the States in India are connected to one of these five regional grids as explained further in the
6. .The southern regional grid supplies electricity for southern states namely Andhra Pradesh,
Karnataka, Kerala, Tamilnadu and one union territory Pondicherry.
The proposed b indo Agro Energy Pvt Ltd. is located in
Sivagangai Dist t of Ta ed electricity to southern regional grid.
According to the current scenario in southern regional grid, the power generation by fossil fuel based
thermal power ence of this project activity the power
tive baseline for this project activity is the generation of power by Fossil fuel based
Annex
iomass based power plant implemented by Aurob
ric milnadu and it will export the generat
plants are dominating the grid. So even in abs
generation would continue to be by fossil fuel based thermal power plants in southern grid and hence the
predominant alterna
thermal power plants.
Type of power plants and their net power generation in 2005-06
Type of Power Plant GWh %
Coal Power Plant 71,364 51.68 Lignite Power Plant 16,072 11.64 Gas Power Plant 10,869 7.87 D esi el Power Plant 1,738 1.26 Hydro Power Plant 33,332 24.14 Nuclear Power Plant 4,713 3.41 Total 1,38,088 100
Reference: CEA web site www.cea.nic.in
What would ass in the absence of the project activity;happen to the biom
The 21 MW po utilizes the biomass available in the local region of
Sivagangai district, Tamilnadu. In absence of this project activity the biomass generated in Sivagangai
district w ricts.
wer plant of AAEPL mainly
ill be utilized by other cogeneration and biomass power plants located in the nearby dist
PROJECT DESIGN DOCUMENT FORM (CDM PDD) - Version 02 CDM – Executive Board page 16
This template shall not be altered. It shall be completed without modifying/adding headings or logo, format or font.
Hence the biomass generated has prior to the project implementation been sold in a market and where
lectricity generation with thae t biomass.
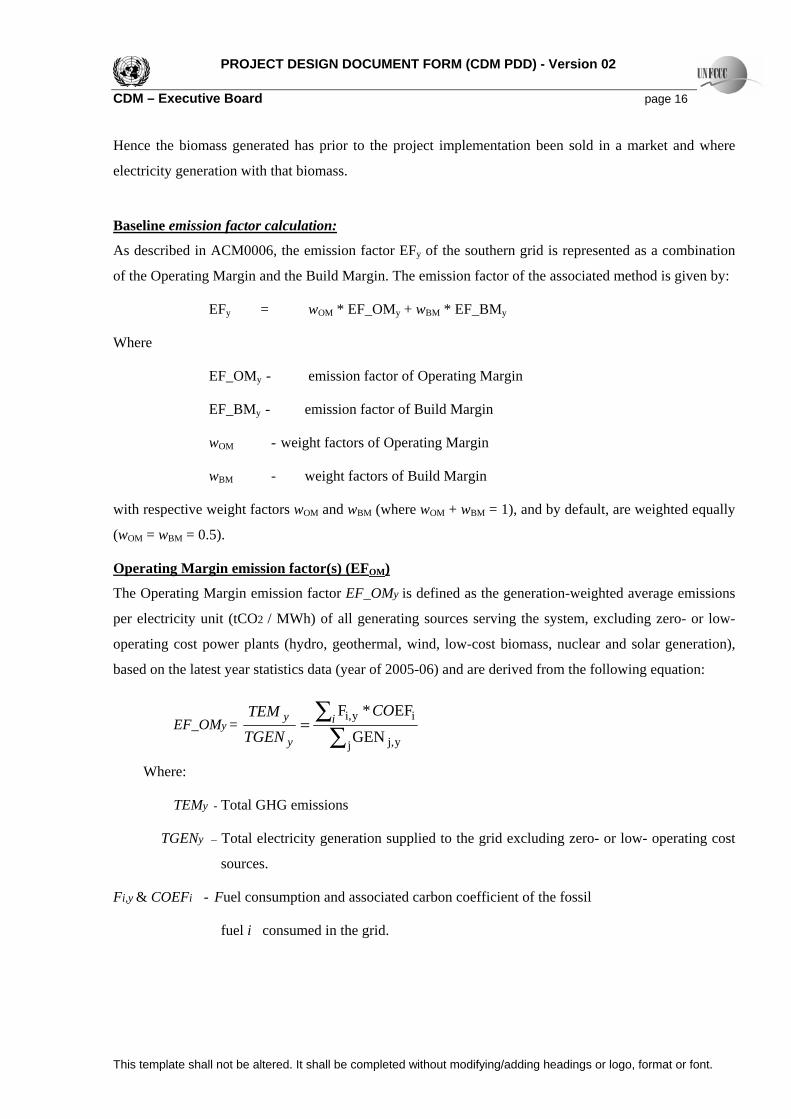
Baseline emission factor calculation: As described in ACM0006, the emission factor he southern grid sented as a combination
of the Operatin and the Build Margin. sion factor of the ted method is given by:
E = wOM * EF_OMy EF_BMy
Where
ion factor of O
ission factor of Build Margin
wOM - weight factors of Operating Margin
wBM - weight factors of Build Margin
Operating Margin emission factor(s) (EF
EFy of t is repre
g Margin The emis associa
Fy + w *BM
EF_OMy - emiss perating Margin
EF_BMy - em
with respective weight factors wOM and wBM (where wOM + wBM = 1), and by default, are weighted equally
(wOM = wBM = 0.5).
OM)
The Operating Margin emission factor EF_OMy is defined as the generation-weighted average emissions
it (tCO2 / MWh) of all generating sources serving the system, excluding zero- or low-
operating cost power plants (hydro, geothermal, wind, low-cost biomass, nuclear and solar generation),
per electricity un
based on the latest year statistics data (year of 2005-06) and are derived from the following equation:
EF_OMy = ∑
∑=j yj,
iyi,
GEN
EF*Fi
y
y CO
TGENTEM
Where:
TEMy - Total GHG emissions
TGENy – Total electricity generation supplied to the grid excluding zero- or low- operating cost
sources.
Fi,y & COEFi - Fuel consumption and associated carbon coefficient of the fossil
fuel i consumed in the grid.
PROJECT DESIGN DOCUMENT FORM (CDM PDD) - Version 02 CDM – Executive Board page 17
This template shall not be altered. It shall be completed without modifying/adding headings or logo, format or font.
GENj,y - rid excluding zero- o low-
operating cos
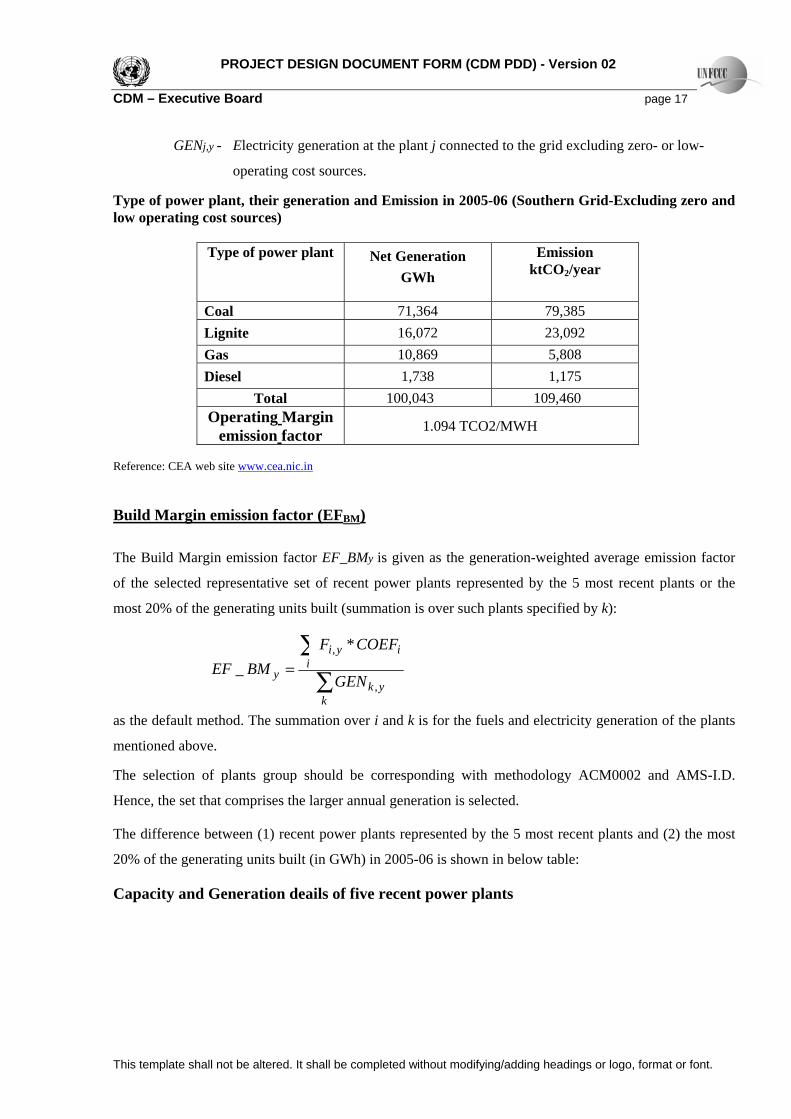
Type of power plant, their generation and Emission in 2005-06 (Southern Grid-Excluding zero and st sources)
ype of power pla Net Generation GWh
Emission ktCO2/year
Electricity generation at the plant j connected to the g r
t sources.
low operating co
T nt
Coal 71,364 79,385 Lignite 16,072 23,092 Gas 10,869 5,808 Diesel 1,738 1,175
Total 100,043 109,460 Operating Margin
emission factor 1.094 TCO2/MWH
Reference: CEA web site www.cea.nic.in
Build Margin emission factor (EFBM) The Build Margin emission factor EF_BMy is given as the generation-weighted average emission factor
of the selected representative set of recent power plants represented by the 5 most recent plants or the
most 20% of the generating units built (summation is over such plants specified by k):
∑
∑=
kykEN
ii
y G
FBMEF
,_
as t The summation ov d k is for the fuels and electricity generation of the plants
men
The of plants group should b esponding with metho CM0002 and A D.
Hen rger annual generation is selected.
The difference between (1) recent power plants represente e 5 m nt plants and (2) st
er plants
yi COEF, *
he default method. er i an
tioned above.
selection e corr dology A MS-I.
ce, the set that comprises the la
d by th ost rece the mo
20% of the generating units built (in GWh) in 2005-06 is shown in below table:
Capacity and Generation deails of five recent pow
PROJECT DESIGN DOCUMENT FORM (CDM PDD) - Version 02 CDM – Executive Board page 18
This template shall not be altered. It shall be completed without modifying/adding headings or logo, format or font.
.nic.in
Reference: CEA web site www.cea
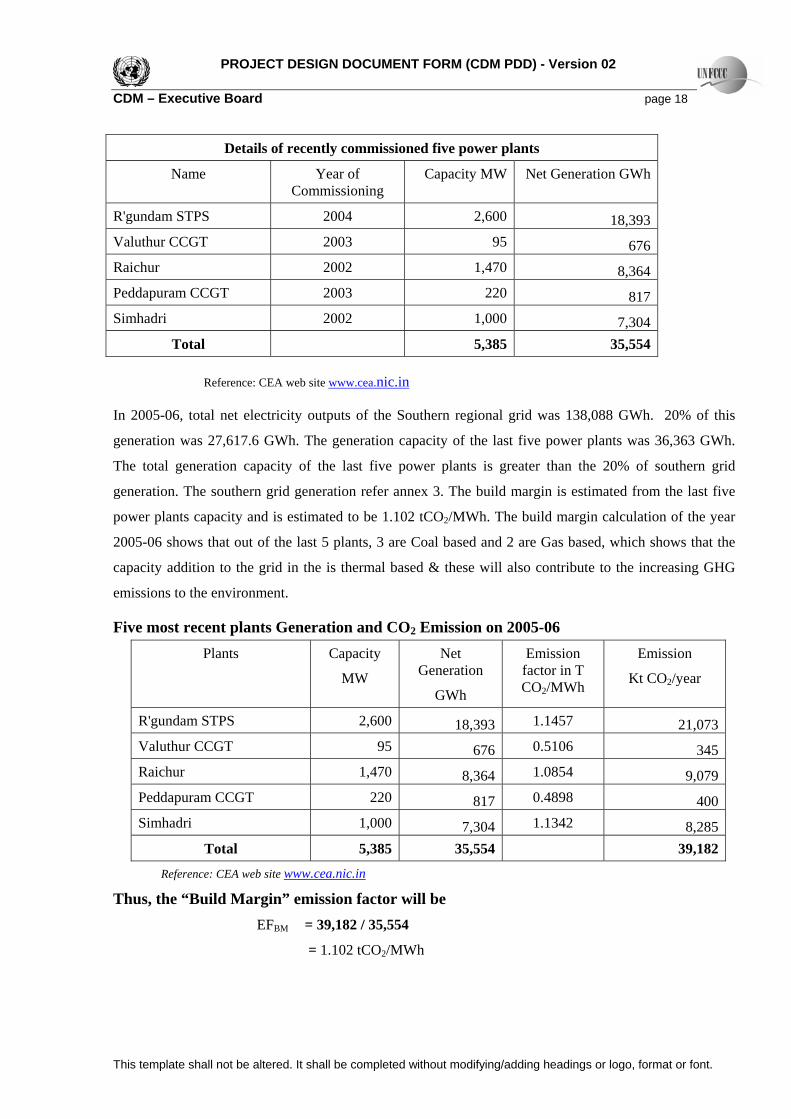
In 2005-06, et el thern regional grid was 138,088 GWh. 20% of this
generation was 27,617.6 GWh. The generation capacity of the last five power plants was 36,363 GWh.
The total generation capacity of the last five power plants is greater than the 20% of southern grid
enerati n. The her id g The build margin is estimated from the last five
of the year
005-06 shows that out of the last 5 plants, 3 are Coal based and 2 are Gas based, which shows that the
apacity addition to the grid in the is thermal based & these will also contribute to the increasing GHG
Plants Capacity Net Emission Emission
total n ectricity outputs of the Sou
g o sout n gr eneration refer annex 3.
power plants capacity and is estimated to be 1.102 tCO2/MWh. The build margin calculation
2
c
emissions to the environment.
Five most recent plants Generation and CO2 Emission on 2005-06
MW Generation
GWh
factor in T CO2/MWh Kt CO2/year
R'gundam STPS 2,600 18,393 1.1457 21,073Valuthur CCGT 95 676 0.5106 345Raichur 1,470 8,364 1.0854 9,079Peddapuram CCGT 220 817 0.4898 400Simhadri 1,000 7,304 1.1342 8,285
Total 5,385 35,554 39,182
Reference: CEA web site www.cea.nic.in
Thus, the “Build Margin” emission factor will be EFBM = 39,182 / 35,554
ed five power plants Details of recently commission
Name Year of Commissioning
Capacity MW Net Generation GWh
R'gundam STPS 2004 2,600 18,393 Valuthur CCGT 2003 95 676 Raichur 2002 1,470 8,364 Peddapuram CCGT 2003 220 817 Simh 2002 1,000 7,304 adri
Total 5,385 35,554
= 1.102 tCO2/MWh
PROJECT DESIGN DOCUMENT FORM (CDM PDD) - Version 02 CDM – Executive Board page 19
This template shall not be altered. It shall be completed without modifying/adding headings or logo, format or font.
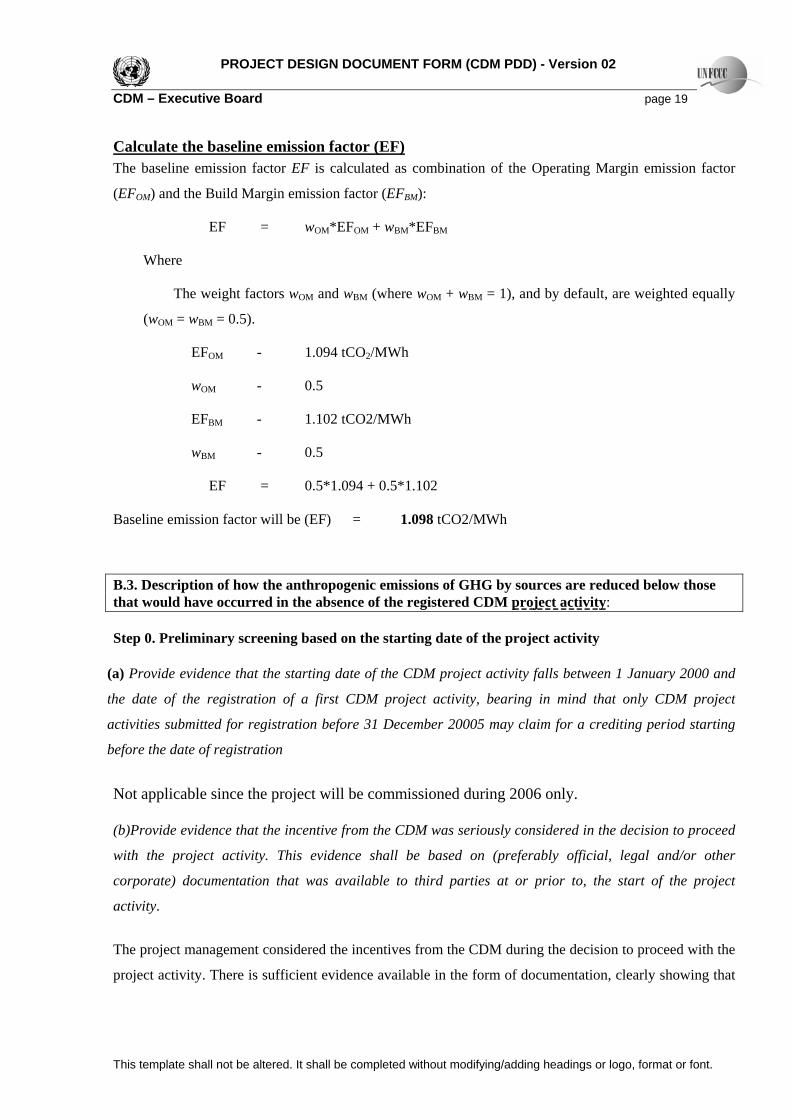
Calculate the baseline emission factor (EF) The baseline emission factor EF is calculated as combination of the Operating Margin emission factor
(EF ) and the Build Margin emission factor (EF ):
EF = w *EF + w *EF
OM BM
OM OM BM BM
Where
The weight factors wOM and wBM (where wOM + wBM = 1), and by default, are weighted equally
EF - 1.094 tCO /MWh
w - 0.5
- 0.5
d below those
(wOM = wBM = 0.5).
OM 2
OM
EFBM - 1.102 tCO2/MWh
wBM
EF = 0.5*1.094 + 0.5*1.102
Baseline emission factor will be (EF) = 1.098 tCO2/MWh
B.3. Description of how the anthropogenic emissions of GHG by sources are reducethat would have occurred in the absence of the registered CDM project activity: Step 0. Preliminary screening based on the starting date of the project activity a) Provide evidence that the starting date of the CDM project activity falls between 1 January 2000 and
he date of the registration of a first CDM project activity, bearing in mind that only CDM project
(
t
activities submitted for registration before 31 December 20005 may claim for a crediting period starting
before the date of registration
e incentive from the CDM was seriously considered in the decision to proceed
ior to, the start of the project
ctivity.
s sufficient evidence available in the form of documentation, clearly showing that
Not applicable since the project will be commissioned during 2006 only. (b)Provide evidence that th
with the project activity. This evidence shall be based on (preferably official, legal and/or other
corporate) documentation that was available to third parties at or pr
a
e project management considered the incentives from the CDM during the decision to proceed with the Th
project activity. There i
PROJECT DESIGN DOCUMENT FORM (CDM PDD) - Version 02 CDM – Executive Board page 20
This template shall not be altered. It shall be completed without modifying/adding headings or logo, format or font.
the CDM incentives played a role during the decision-making. Before the implementation of biomass
this project activity the biomass generated in Sivagangai
omass power plants located in the nearby districts.
implementation been sold in a market and where
power plant, the project proponent convened a board meeting to discuss about technical requirements,
various barriers, risks etc., involved in the implementation of project, ways and support needed to
overcome these barriers. At that time of Board meeting, the incentives from the CDM was seriously
considered. The minutes from the board meetings are available for evidence in the form of written
document.
Step 1: Identification of alternatives to the project activity consistent with current laws and regulations. Sub-step 1a :Define alternatives to the project activity: The realistic and credible alternatives identified for this project activity are
a. How power would be generated in the absence of the CDM project activity
The proposed biomass based power plant implemented by AAEPL is located in Sivagangai District of
Tamilnadu. The major sources of power generation in the southern region are based on coal, hydro, gas
and lignite. So even in the absence of this project activity the power generation would be continued by
fossil fuel based thermal power plants in this region.
b. What would happen to the biomass in the absence of the project activity
The 21 MW power plant of AAEPL mainly utilizes the biomass available in the local region of
Sivagangai district, Tamilnadu. In absence of
district will be utilized by other cogeneration and bi
ence the biomass generated has prior to the project H
electricity generation with that biomass.
Sub-step 1b: Enforcement of applicable laws and regulations Both alternatives are in compliance with relevant legal and regulatory requirements. Step 3: Barrier Analysis
The proposed project activity faces barriers that prevent the implementation of this type of project activity
and do not prevent the implementation of at least one of the alternatives.
Sub-step 3a: Identify barriers that would prevent the implementation of type of the proposed project . Technology barriers:
PROJECT DESIGN DOCUMENT FORM (CDM PDD) - Version 02 CDM – Executive Board page 21
This template shall not be altered. It shall be completed without modifying/adding headings or logo, format or font.
This is the first grid connected biomass power plant to be commissioned in the state of Tamilnadu of
higher installed capacity (21MW) on an Independent Power Producer basis with the steam parameters of
65 ata and 485oC and having employed a air-cooled condenser with a capacity of 21 MW. This would
save huge quantity of water used for a conventional water-cooled power plant and the water conserved
would be useful for irrigation purposes. The promoter have explored and analysed various biomass power
eneration technologies available in India, in terms of operability, economic and technical aspects and
l steam requirements at the turbine inlet and hence increased boiler rating. This has a spiralling
ffect leading to increased auxiliary power consumption, higher biomass consumption per MW and hence
R.3.15 per kWh based
g
decided to adopt Rankine Cycle technology (direct combustion based steam cycle). The Rankine cycle
technology with the conventional cooling towers requires huge quantity of water. Generally, for power
project capacity of 21 MW with conventional cooling systems, which is a common practice in India, it is
estimated that a very substantial quantity of water (The water required is about 100 m3/ hr for Phase-I &
Phase -II or 24, 00,000 litres /day) is required. Due to the water scarcity in the region surrounding the
project, implementing the project with conventional cooling tower is difficult. Hence as an alternative and
to reduce the ground water depletion, an air-cooled condenser (ACC) which is considered as a water
conservation equipment (as it reduces use of water only for service applications), was found essential for
the operation of the proposed plant. The cost of the air cooling system is about 3 to 4 times more than
conventional water cooling system. Further the ACC requires in additional power and thus results in
additiona
e
increased cost of generation. Thus, the addition of the air cooling system increases the capital investment
cost and the operational costs of the project.
Barrier due to prevailing practice: According to the Government Order (G.O) of TNEB, reference “Permanent B.P. (FB) No: 59, dated
11.4.2000”, the price of electricity for any financial year after 1.4.2000 was fixed at INR 2.73 /kWh with
5% annual escalation for a period of nine years up to the year 2010 and the price shall not exceed 90% of
the prevailing High Tension industrial tariff rate applicable for the industrial consumers which may get
revised from time to time. When this proposed 21 MW biomass power project signed the Power Purchase
Agreement with TNEB during the financial year 2003-04, the tariff was fixed at IN
on the second condition of the G.O referred above (i.e. 90% of the High Tension Industrial tariff). This
tariff (INR 3.15 per kWh) is 10 % lower than the tariff based on the 5 % annual escalation.
Thus the tariff policy for biomass power projects in Tamilnadu is a key risk for the investor, because of
two reasons, first one being that the H.T tariff has not increased since 2003-2004 and secondly the cost of
PROJECT DESIGN DOCUMENT FORM (CDM PDD) - Version 02 CDM – Executive Board page 22
This template shall not be altered. It shall be completed without modifying/adding headings or logo, format or font.
power generation will escalate more than 5% annually due to the increasing cost of biomass. Further it is
expected that this H.T industrial tariff set out by the TNEB will either remain same or will come down in
due course of time when the system will acquire new regime after implementation of Availability Based
Tariff (ABT) and free market for third party sale as per Indian Electricity Act 2003 as IPPs will be
allowed to sell electricity to High Tension consumers and addition of generation capacity as per the
planning of Government of India and State Government of Tamilnadu.
In addition, as per the Power Purchase Agreement (PPA) signed between the TNEB and the project
promoter, the clause 3 of PPA states that the project is bound by all the provisions of Indian Electricity
ct 2003, statutory amendments, state Government and TNEB orders made from time to time. This
significant barrier faced by the majority of the Renewable Energy based IPPs is the grid
conomically infeasible and industrially backward
dditional infrastructure for a small capacity project.
urther the small capacities associated with typical rural electricity transmission and distribution system
e of any conducive, exclusive, consistent power policy for
promotion of biomass power. These factors acted as a deterrent for the private sector to carryout their
A
overall blanket of conditions of amendments without any time limit places the project performance at a
higher risk level. While the TNERC is yet to finalise the tariff policy for biomass power projects in
Tamilnadu and hence subject to several modifications from the current practices, TNEB has a record of
altering the renewable energy power policies and the PPAs several times in the past. (e.g Tamilnadu wind
power policy). PPA also states that for the TNEB grid power to be drawn by the project for start-up
purposes will not only attract High tension tariff but also the monthly demand charges to be notified by
TNERC from time to time. This will also affect the overall cost of generation of power from the proposed
project.
One of the
interconnection with the state utility. For Renewable Energy projects located at a distance from the grid
due to access to Renewable Energy resources and in e
areas such as this proposed project, efforts in establishing the infrastructure for grid connection results in
an additional capital investment. While the project promoter is not comfortable in this co-investment, the
TNEB may not be comfortable in establishing a
F
(for the small electricity consumption of the rural areas) pose poor grid availability problems and stability
problems (for remote areas) leading to fluctuations and grid failure which will reduce the power
evacuated from the biomass power project and hence affect the plant load factor.
The major reasons for the lack of promotion of biomass power in Tamilnadu can be attributed to the fact
that the biomass assessment studies for estimating the biomass power potential were not available for the
State Government Agencies besides absenc
PROJECT DESIGN DOCUMENT FORM (CDM PDD) - Version 02 CDM – Executive Board page 23
This template shall not be altered. It shall be completed without modifying/adding headings or logo, format or font.
own independent biomass assessment study and implement the grid connected biomass power projects.
Tamilnadu also limits the biomass power plant promoters to either
lants for the southern regional
by coal, lignite based
ermal power plants as discussed in section B.2.
plementing Rankine cycle technology with conventional water cooled
The electricity policy of the state of
sell the power to TNEB or to put it to captive use, as third party sale is not allowed in the state. Only
recently, during the month of August 2005, the TNERC has passed the order2 that the third party sale is
allowed under the open access scheme as defined in the Indian Electricity Act 2003, within a time frame
covering projects with specific capacities. However the enforcement of this order is not expected soon
since TNEB has to now develop the framework for wheeling charges and other applicable charges for
third party sale for utilising their transmission and distribution network by the independent power
producers and obtain the approval of TNERC before implementation.
The analysis of the other least cost and financially attractive and feasible options for implementing grid
connected power plants and the Tamilnadu state grid augmentation plan in terms of recent and planned
implementation of power plants does not conclude in favour of implementation of grid connected biomass
power plants. Current investments in the power sector of the State of Tamilnadu portrays the fact that
majority of the power generation capacity has been added based on fossil fuels such as coal and gas
which are feasible options, leading to high emissions. Thus in the absence of the proposed grid connected
biomass power project activity, other and alternative investments would be made in coal or gas based
power plants in Tamilnadu resulting in high carbon intensity based power generation with more GHG
emissions.
Sub-step 3b: Show that the identified barriers would not prevent the implementation of atleast one of
the alternatives ( except the proposed project activity)
The alternative for this project is power generated by new thermal power p
grid. In southern regional grid the power generation will be always dominated
th
Such thermal power plants are im
condensing systems. In the conventional water cooling system auxiliary power consumption is low
compared to the air cooled system, so the efficiency of the plant is high. As the initial investment of water
cooling system is very low compared with air cooled condensing systems the thermal power plants are
following the conventional water cooling system to prevent the additional barriers. Hence the identified
barriers of the project activity would not prevent the implementation of this alternative viz., fossil fuel
based grid connected thermal power plants.
http://tnerc.tn.nic.in/regulation/OpenAccess2005.pdf2
PROJECT DESIGN DOCUMENT FORM (CDM PDD) - Version 02 CDM – Executive Board page 24
This template shall not be altered. It shall be completed without modifying/adding headings or logo, format or font.
Step 4: Common Practice analysis
For over a decade since 1994, grid connected biomass power projects have not been implemented
regularly in the state of Tamilnadu though the neighbouring state namely Andhra Pradesh implemented
em on an accelerated basis. The first grid connected biomass project to be commissioned in the state of
amilnadu was during 1997 with an installed capacity of 12 MW in Palayaseevaram (Kancheepuram
city of the
ely fuel wood based on Prosposis Juliflora.
Besides the switch in the type of biomass for the project, this project faced several hardships related to
tate utility due to less demand during the night period. Further the
roject promoter filed a petition with the Tamil Nadu Electricity Regulatory Commission (TNERC)
tart up of the plant at par with the conventional independent power producers (IPP). Though this was the
erall policy for promotion of such grid connected
iomass based power projects was not forthcoming from Tamil Nadu Energy Development Agency and
il Nadu Electricity Board. After a gap of several years, on nnected biomass power
projects with installed capacity of 18 MW and 7.5 MW been recently commissioned in Tamilnadu. These
cts have been developed under the CDM. Thus as mentioned previously, against the total
ated potential of 670 MW from biomass, the installed capacity as on date has been only to the tune
Though recently ass power projects totalling over 250 MW* has been
sanctioned by TEDA, onl plemented. Hence implementation of grid connected
r project is no on practice in the state of Tamilnadu.
ce: Minutes of of Biomass Power Projects as on 27/04/2004
ct of CDM Registra
21 MW biomass based grid connected power plant implemented by AAEPL in Sivagangai district is
e first higher capacity biomass power plant in Tamilnadu.This biomass based power plant generates
sidues available in this region. Due
im , the electricity generated by the southern regional grid
been displaced which reduces the anthropogenic GHG emission from the fossil fuel based power
th
T
District) based on the bagasse from the neighbouring sugar mill. However due to the pau
baggasse, this power plant switched to other fuels, nam
poor evacuation schedules by the s
p
requesting for waiver of monthly demand charges for drawing power from the grid for shorter time during
s
only power plant in the state of Tamilnadu then, an ov
b
Tam ly two grid co
two proje
estim
of 41.5 MW. licenses for biom
y a few are being im
biomass powe t a comm
*Referen Review
5: Impa tion
The
th
electricity from the waste land biomass (prosopis juliflora) and agro re
to this plementation of this CDM project activity
as h
generation supply to the grid.
PROJECT DESIGN DOCUMENT FORM (CDM PDD) - Version 02 CDM – Executive Board page 25
This template shall not be altered. It s
The successful registration of this project as a CDM project activity will provide CDM incentives viz.,
revenue from sale of certified emission reductions. This CDM incentive encourages the promoter to
overcome the barriers analyzed in the step 3a, which further support the project activity to provide a
consistent reduction thropogenic G ions.
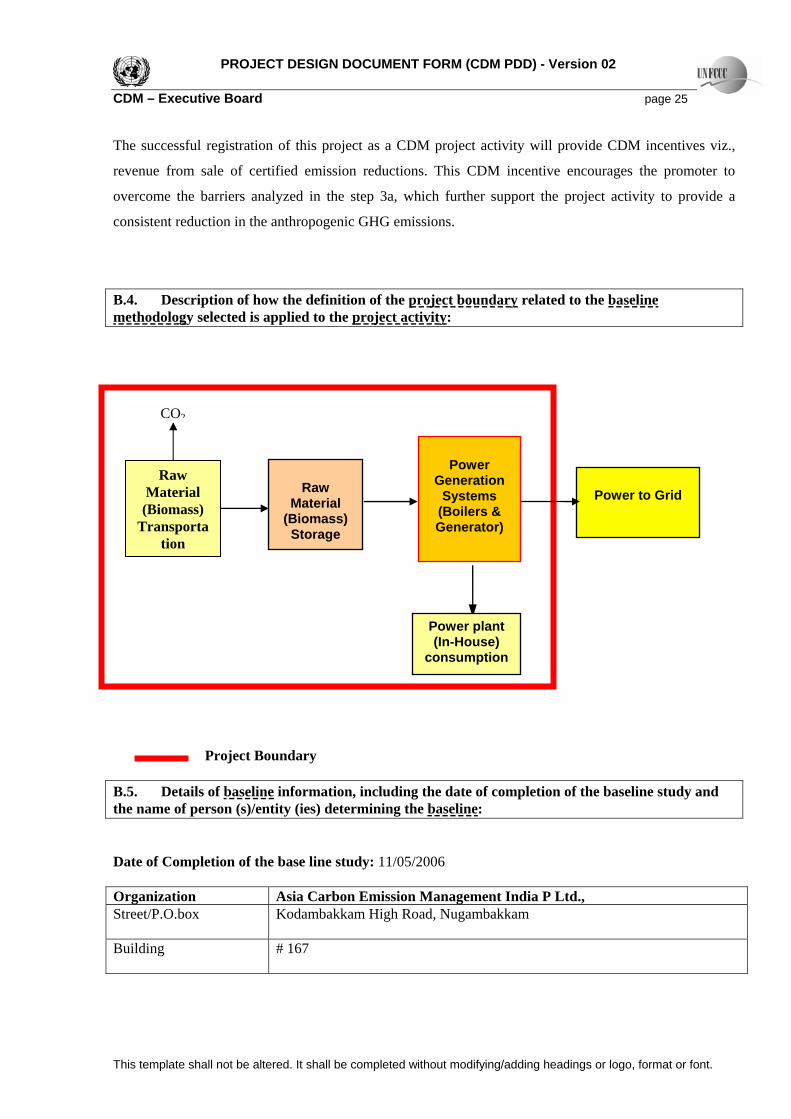
.4. Description of how the definition of the project boundary
in the an HG emiss
B related to the baseline m ologethod y selected is applied to the project activity:
Project Boundar
.5. Details of baseline
Power to Grid
Power
Generation Systems
(Boilers & Generator)
B informthe name of person (s)/entity (ie Date of Completion of the base Organization Asia CStreet/P.O.box Kodam
Building # 167
RMa
(Bio toS
M(B
Tr
aw terial mass)rage
CO2
Raw aterial iomass) ansportation
hall be completed without modifying/adding headings or logo, format or font.
y
Power plant (In-House)
consumption
ation, including the date of completion of the baseline study and s) determining the baseline:
line study: 11/05/2006
gement India P Ltd., arbon Emission Manabakkam High Road, Nugambakkam

PROJECT DESIGN DOCUMENT FORM (CDM PDD) - Version 02 CDM – Executive Board page 26
This template shall not be altered. It shall be completed without modifying/adding headings or logo, format or font.
City Chennai
State/ Region Tamilnadu
Post Fix/Zip 600 024
Country India
Telephone +91 44 39180501 Fax +91 44 39180505 E-Mail [email protected]
Url www.asiacarbon.com SECTION C. Duration of the project activity / Crediting period C.1 Duration of the project activity: oject activityC.1.1. Starting date of the pr :
t Activity
Capacity Starting Date
Projec
Phase-I 8.5 MW 31st August -2003
Phase-II 12.5 MW 1 September -2006 st
C.1.2. Expected operational lifetime of the project activity: 25 Years C.2 Choice of the crediting period and related information: C.2.1.Renewable crediting period C.2.1.1.Starting date of the first crediting period: C.2.1.2.Length of the first crediting period:
PROJECT DESIGN DOCUMENT FORM (CDM PDD) - Version 02 CDM – Executive Board page 27
This template shall not be altered. It shall be completed without modifying/adding headings or logo, format or font.
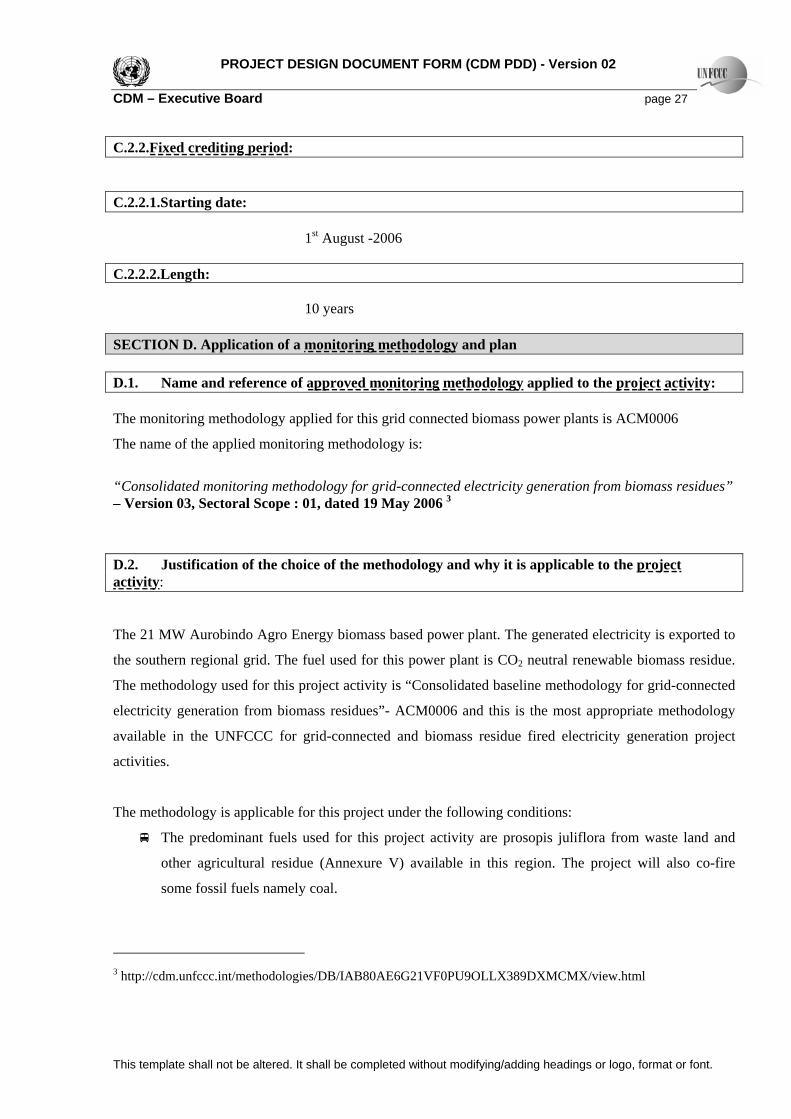
C.2.2.Fixed crediting period: C.2.2.1.Starting date: 1 st -2006 C.2.2.2
.Length:
st Augu
10 years
SECTION D. Applicat methodologyion of a monitoring and plan D.1. Name and reference of approved monitoring methodology applied to the project activity: The monitoring methodology applied for this grid connected biomass power plants is ACM0006
The name of the applied monitoring methodology is:
“Conso onitorin id-co electric iomass residues” – Vers ectoral S May
D.2. Justification of od and why i the pro ect
lidated mion 03, S
g methodology for grcope : 01, dated 19
the choice of the meth
nnected 2006
ity generation from b
t is applicable to
3
ology jactivity: The 21 MW Aurobindo Agro Energy ass based power plant. The generated electricity is exported to
the southern regional grid. fuel used for this power plant is CO2 ass residue.
The methodology used for this project activity is “Consolidated baseline methodology for grid-connected
generation from biomass residues”- ACM0006 and this is the most appropriate methodology
able in the NFCCC for grid-connected and biomass residue fired electricity generation project
ctivities.
The methodology is applicable for this project under the following conditions:
The predominant fuels used for this project activity are prosopis juliflora from waste land and
other agricultural residue (Annexure V) available in this region. The project will also co-fire
some fossil fuels namely coal.
biom
The neutral renewable biom
electricity
avail U
a
3 http://cdm.unfccc.int/methodologies/DB/IAB80AE6G21VF0PU9OLLX389DXMCMX/view.html
PROJECT DESIGN DOCUMENT FORM (CDM PDD) - Version 02 CDM – Executive Board page 28
This template shall not be altered. It shall be completed without modifying/adding headings or logo, format or font.
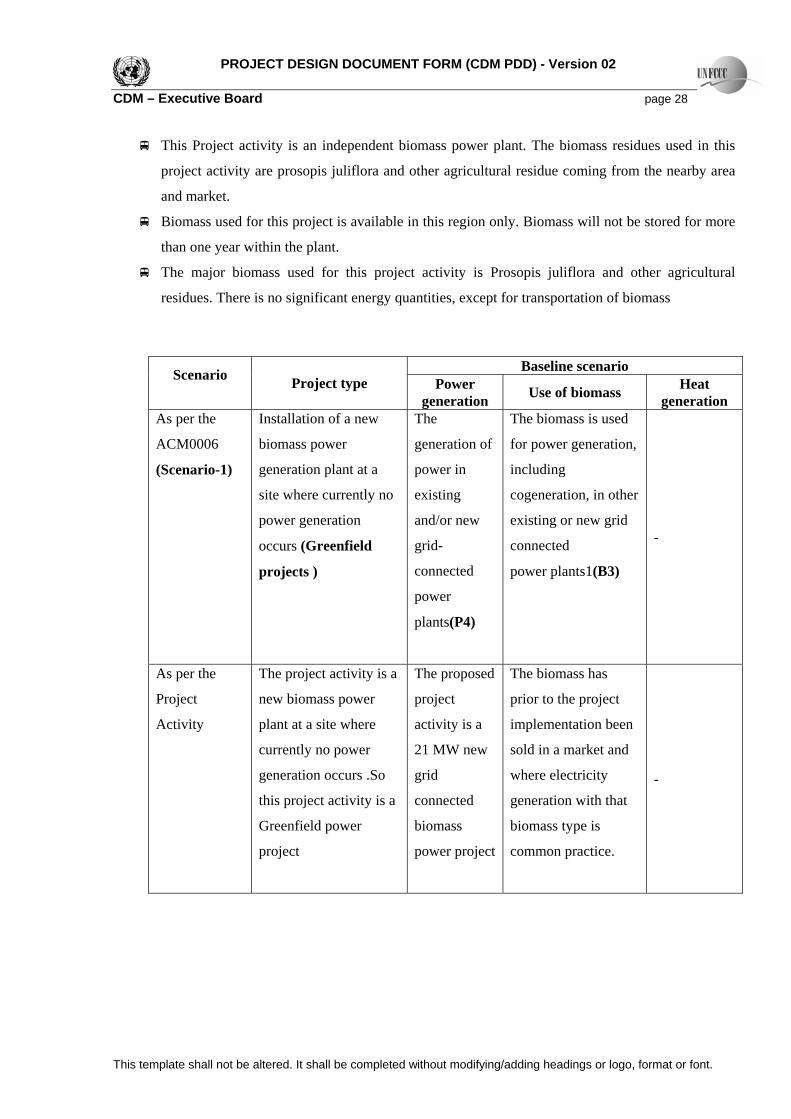
This Pr activity is an independent biomass ass residues used in this
project activity are prosopis juliflora and other ing from the nearby area
and market.
Biomass used for this project is available in this region only iom ill n e sto for more
than one y
The ma
residues. There is no significant energy
Baseline scenario
oject
ear within the plant.
jor biom
power plant. The biom
is Prosopis juliflora and other agricultural
agricultural residue com
. B ass w ot b
ass
red
ass used for this project activity
quantities, except for transportation of biom
Scenario
Project type Power ener ass g ation Use of biom Heat
generationAs per the
ACM0006
(Scenario-1)
Installation of a new
n
site where currently no
(Greenfield
projects )
The
nera of
connected
power
(P4)
The biomass is used
pow nera ,
cogeneration, in other
existing or new grid
power plants1(B3)
-
biomass power
generation pla t at a
power generation
occurs
ge
power in
tion
existing
and/or new
grid-
plants
for
including
er ge tion
connected
As per the
Project
Activity
ass power
no power
e pr ed
b as
r to roje
imp entation been
t
biomass ty
mon practice.
The project activity is a
new biom
plant at a site where
currently
generation occurs .So
this project activity is a
Greenfield power
project
Th
project
opos
activity
21 MW new
grid
connected
is a
iom
power project
s
The biom
prio
ass has
the p ct
lem
sold in a m
where electricity
generati
arke
on with t
and
hat -
pe is
com
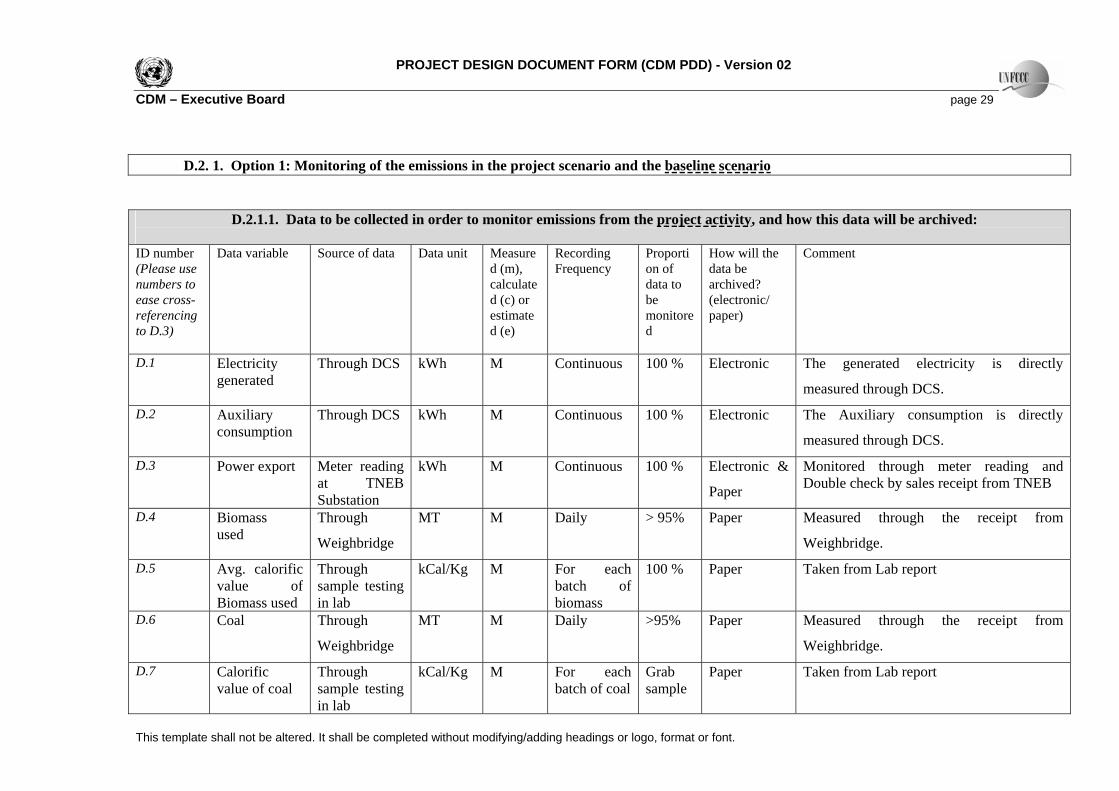
PROJECT DESIGN DOCUMENT FORM (CDM PDD) - Version 02 CDM – Executive Board page 29 D.2. 1. Option 1: Monitoring of the emissions in the project scenario and the baseline scenario a llected in order to monitor emissions from the project activityD.2.1.1. Dat to be co , and how this data will be archived: ID number Please use umbers to ase cross-eferencing o D.3)
Data variable Source of data Data unit
Measured (m), calculated (c) or estimated (e)
Recording Frequency
Proportion of data to be monitored
How will the data be archived? (electronic/ paper)
Comment (nert
D.1 Electricity generated
Through DCS kWh M Continuous 100 % Electronic The generated electricity is directly
measured through DCS.
D.2 Auxiliary consumption
Through DCS kWh M Continuous 100 % Electronic The Auxiliary consumption is directly
measured through DCS.
D.3 Power export Meter reading at TNEB Substation
kWh M Continuous 100 % Electronic &
Paper
Monitored through meter reading and Double check by sales receipt from TNEB
D.4 Biomass used
Through
Weighbridge
MT M Daily > 95% Paper Measured through the receipt from
Weighbridge.
D.5 Avg. calorific value of Biomass used
Through sample testing in lab
kCal/Kg M For each batch of biomass
100 % Paper Taken from Lab report
D.6 Coal Through
Weighbridge
MT M Daily >95% Paper Measured through the receipt from
Weighbridge.
D.7 Calorific value of coal
Through sample testing in lab
kCal/Kg M For each batch of coal
Grab sample
Paper Taken from Lab report
This template shall not be altered. It shall be completed without modifying/adding headings or logo, format or font.
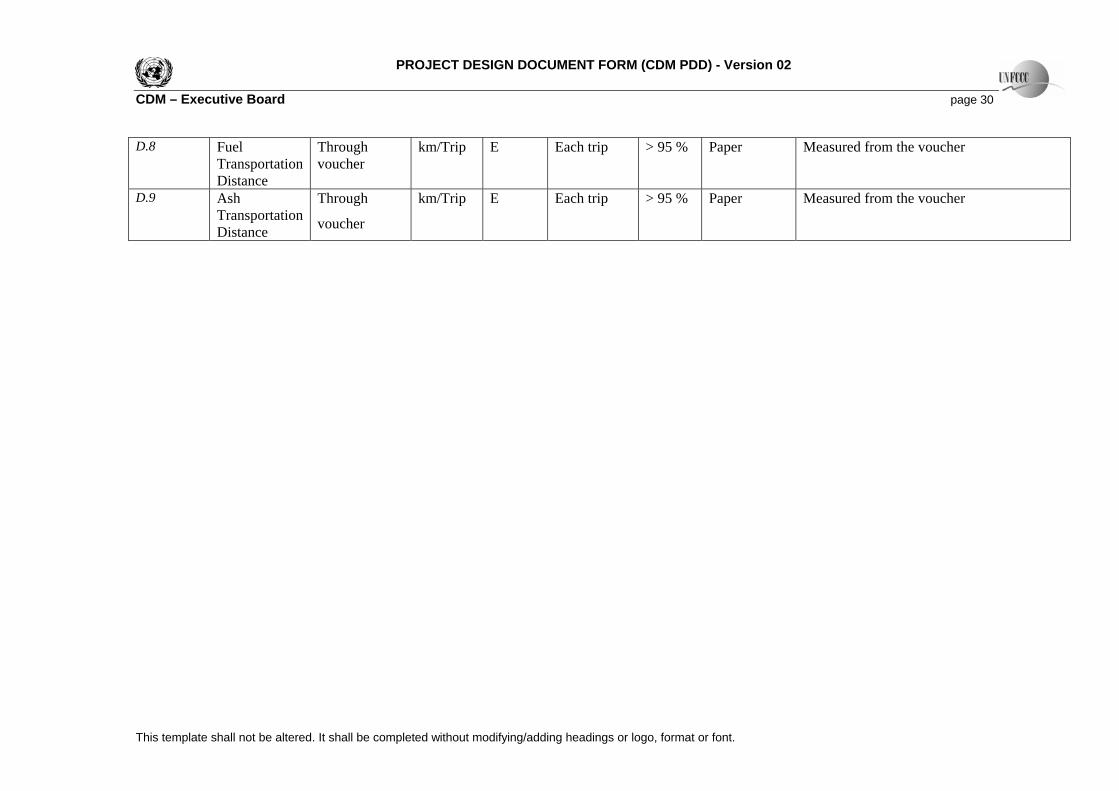
PROJECT DESIGN DOCUMENT FORM (CDM PDD) - Version 02 CDM – Executive Board page 30 D.8 Fuel
Transportation Through voucher
km/Trip E Each trip > 95 % Paper Measured from the voucher
Distance D.9 Ash Through km/Trip E Each trip > 95 % Paper Measured from the voucher
Transportation Distance voucher
This template shall not be altered. It shall be completed without modifying/adding headings or logo, format or font.
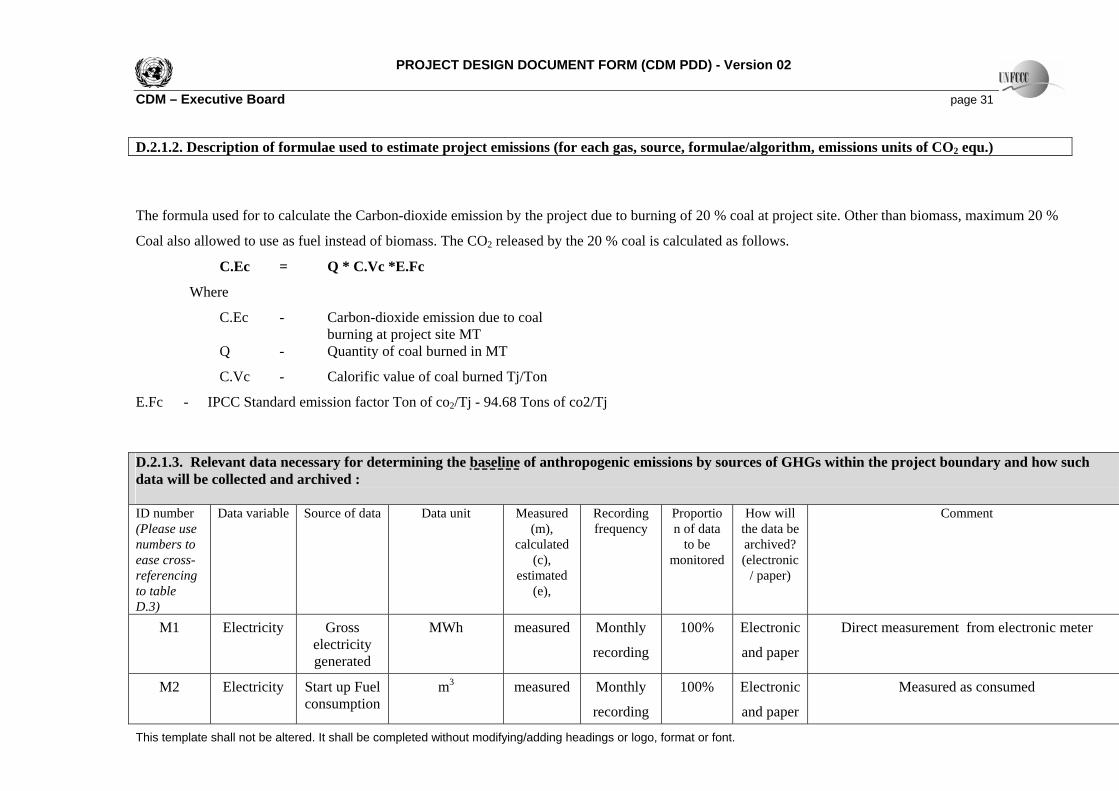
PROJECT DESIGN DOCUMENT FORM (CDM PDD) - Version 02 CDM – Executive Board page 31 D.2.1.2. eD scr rm o estima ect emi ea urce ula m, emissioniption of fo ulae used t te proj ssions (for ch gas, so , form e/algorith s units of CO2 equ.) The form ission by the project due to burning of 20 % coal at project site. Other than biomass, maximum 20 %
Coal also allowed to use as fu f biomass. The CO2 released by the 20 % coal is calculated as follows.
C.Ec = Q * C.Vc *E.Fc
Where
C.Ec - oxide emission due to coal t project site MT
Q ity
C. - c value of coal burned Tj/Ton
IPCC Standard em or Ton of co2/Tj - 94.68 Tons of co2/Tj
ula used for to calculate the Carbon-dioxide em
el instead o
Carbon-diburning a
-
Vc
Quant of coal burned in MT
Calorifi
E.Fc - ission fact
D.2.1.3. Relevant data necessary for determining the baseline of anthropogenic emissions by sources of GHGs within the project boundary and how such data will be co d arcllected an hived : ID number (Please use numbers to ease cross-referencing to table D.3)
Dat e a Data unit Measured (m),
calculated (c),
estimated (e),
Recording frequency
Proportion of data
to be monitored
How will the data be archived? (electronic
/ paper)
a variabl Source of dat Comment
M1
recording
and paper
Electricity Gross electricity generated
MWh measured Monthly 100% Electronic Direct measurement from electronic meter
M2 Electricity consumption
m3 measured Monthly
recording
100% Electronic
and paper
Measured as consumed Start up Fuel
This template shall not be altered. It shall be completed without modifying/adding headings or logo, format or font.
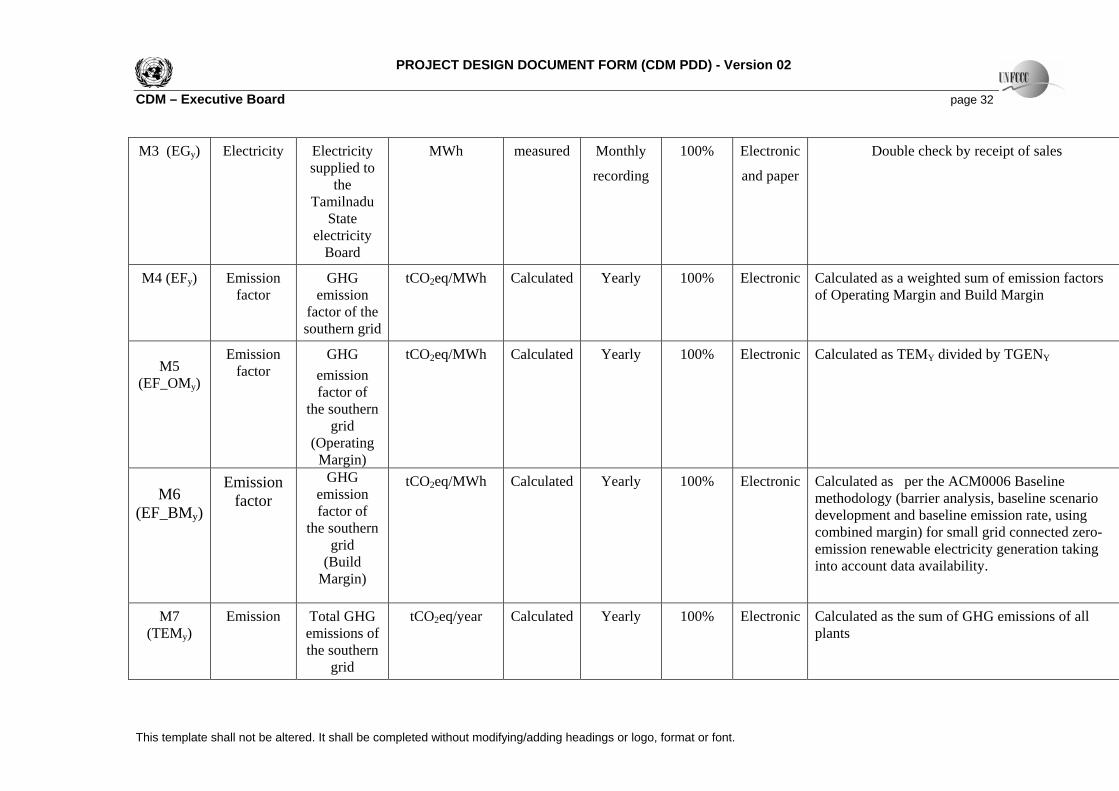
PROJECT DESIGN DOCUMENT FORM (CDM PDD) - Version 02 CDM – Executive Board page 32 M3 (EGy)
recording
by receipt of sales Electricity Electricitysupplied to
the Tamilnadu
State electricity
Board
MWh measured Monthly 100% Electronic Double check
and paper
M4 (EFy) Emission factor
tCO2eq/MWh Calculated Yearly 100% Electronic eighted sum of emission factors nd Build Margin
GHG emission
factor of the southern grid
Calculated as a wof Operating Margin a
M5 (EF_OMy)
Emission tCO eq/MWh Calculated Yearly 100% Electronic Calculated as TEM divided by TGENfactor
GHG emission factor of
the southern grid
(Operating Margin)
2 Y Y
M6 (EF_BMy)
Emission e
tCO eq/MWh Calculated Yearly 100% Electronic Calculated as per the ACM0006 Baseline , baseline scenario
development and baseline emission rate, using combined margin) for small grid connected zero-emission renewable electricity generation taking
factor GHG mission
factor of the southern
grid (Build
Margin)
2methodology (barrier analysis
into account data availability.
M7 ( )
Emission Total em
tCO2eq/year Calculated Yearly 100% Electronic alculated as the sum of GHG emissions of all TEMy
GHG issions of
the southern grid
Cplants
This template shall not be altered. It shall be completed without modifying/adding headings or logo, format or font.
PROJECT DESIGN DOCUMENT FORM (CDM PDD) - Version 02 CDM – Executive Board page 33
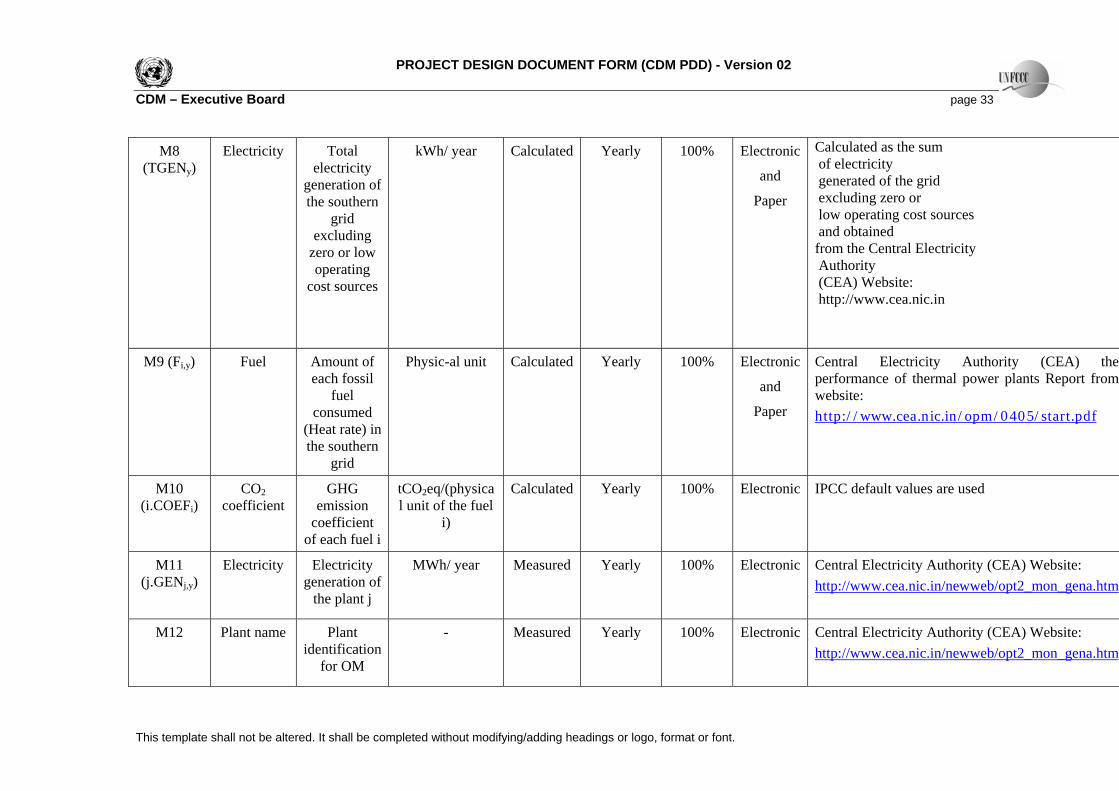
M8 (TGENy)
kWh/ year
and
Paper xcluding zero or
from the Central Electricity Authority
http://www.cea.nic.in
Electricity Totalelectricity
generation of the southern
grid excluding
zero or low operating
cost sources
Calculated Yearly 100% Electronic Calculated as the sum of electricity generated of the grid e low operating cost sources and obtained
(CEA) Website:
M9 (Fi,y) Fuel
fuel consumed
(Heat rate) in the southern
grid
Physic-al unit Calculated
and
Paper
Central Electricity Authority (CEA) the performance of thermal power plants Report from website: http://www.cea.nic.in/opm/0405/start.pdf
Amount ofeach fossil
Yearly 100% Electronic
M10 (i.COEFi)
CO2 coefficient
GHG emission
coefficient of each fuel i
tCO2eq/(physical unit of the fuel
i)
Calculated Yearly 100% Electronic IPCC default values are used
M11 (j.GENj,y)
Electricity Electricity generation of
the plant j
MWh/ year Measured Yearly 100% Electronic Central Electricity Authority (CEA) Website: http://www.cea.nic.in/newweb/opt2_mon_gena.htm
M12 Plant name Plant - Measured Yearly 100% Electronic Central Electricity Authorityidentification
for OM
(CEA) Website: http://www.cea.nic.in/newweb/opt2_mon_gena.htm
This template shall not be altered. It shall be completed without modifying/adding headings or logo, format or font.
PROJECT DESIGN DOCUMENT FORM (CDM PDD) - Version 02 CDM – Executive Board page 34
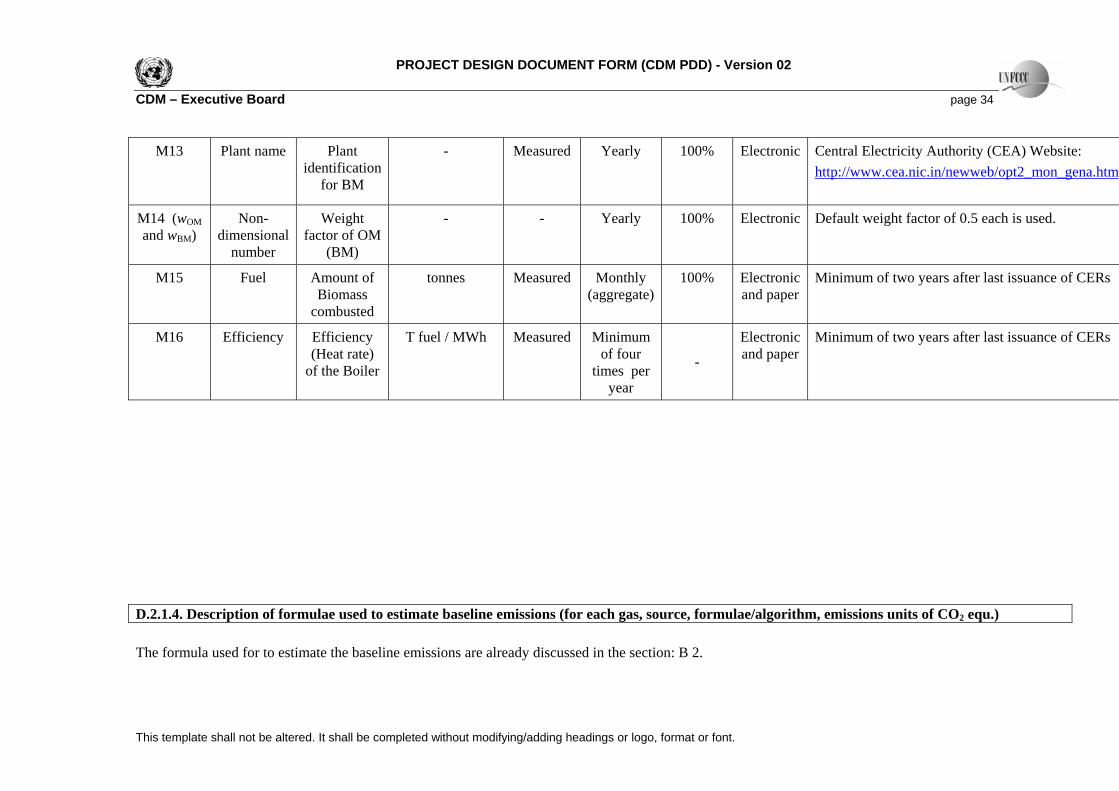
M13 Plan Plant identification
- ed Y 100% nic Central Electricity Authority (CEA) Website: http://www.cea.nic.in/newweb/opt2_mon_gena.htm
t name
for BM
Measur early Electro
M14 (wOM and wBM)
Non-dimensional
number
100% Default weight factor of 0.5 each is used. Weight factor of OM
(BM)
- - Yearly Electronic
M15 Fu tonnes Measured Monthly (aggregate)
100% Electronic per
Minimum of two years after last issuance of CERs el Amount ofBiomass
combusted and pa
M16 Efficiency T fuel / MWh Measured Minim of four
times per
-
Electronic and paper
Minimum of two years after last issuance of CERs Efficiency (Heat rate)
of the Boiler
um
year
)
D.2.1.4. Description of formulae used to estimate baseline emissions (for each gas, source, formulae/algorithm, emissions units of CO2 equ. The formula used for to estimate the baseline emissions are already discussed in the section: B 2.
This template shall not be altered. It shall be completed without modifying/adding headings or logo, format or font.
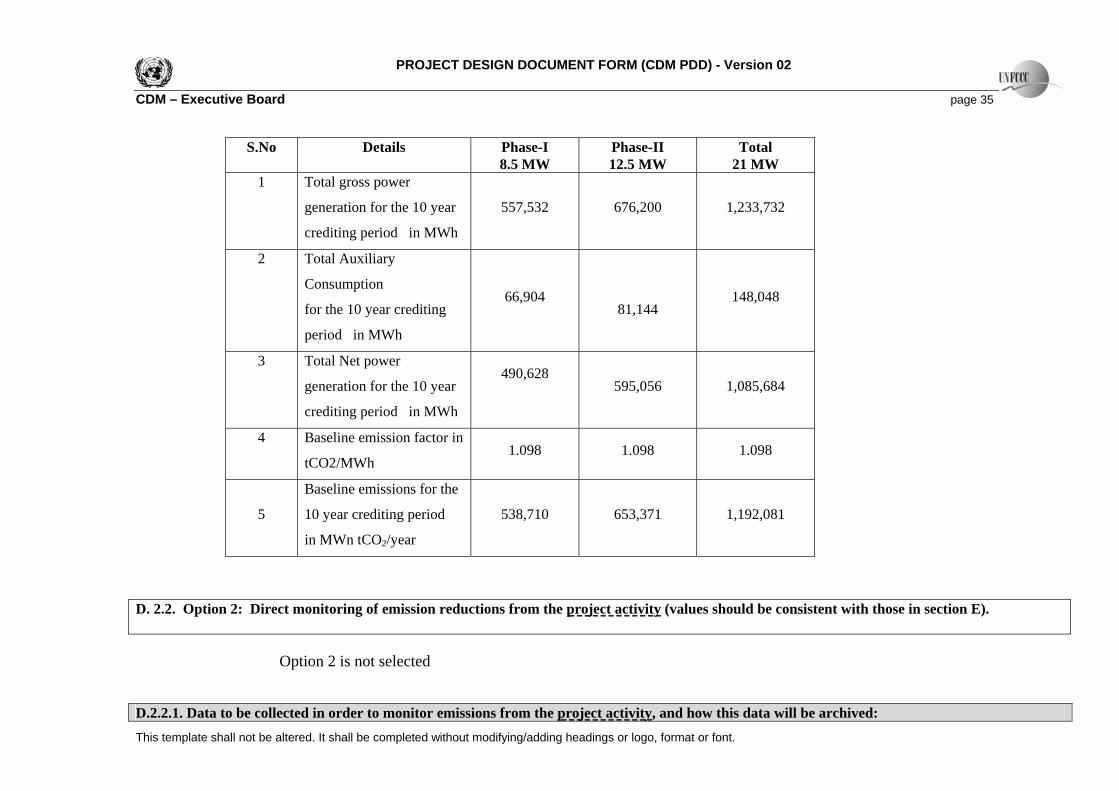
PROJECT DESIGN DOCUMENT FORM (CDM PDD) - Version 02 CDM – Executive Board page 35
S.No Details Phase-I 8
Phase-II W
Total MW .5 MW 12.5 M 21
1 Total gros er
generation for the 10
crediting period i
557,532 200 33,732
s pow
year
n MWh
676, 1,2
2 Total Auxiliary
Consumption
for the 10 year crediting 66,904
81,144 148,048
period in MWh
3 Total Net power
crediting period in MWh
1,085,684 generation for the 10 year 490,628
595,056
4 Baseline emission factor in
tCO2/MWh 1.098 1.098 1.098
5
Baseline emissions for the
10 y
in MWn tCO2/year
538,710 3 081 ear crediting period
,371
65 1,192,
D. 2.2. Option 2: Direct monitoring of emission reductions from the project activity (values should be consistent with those in section E). Option 2 is not selected D.2.2.1. Data to be collected in order to monitor emissions from the project activity, and how this ill be rchived: data w aThis template shall not be altered. It shall be completed without modifying/adding headings or logo, format or font.
PROJECT DESIGN DOCUMENT FORM (CDM PDD) - Version 02
e Board page 36
his template shall not be altered. It shall be completed without modifying/adding headings or logo, format or font.
CDM – Executiv
T
(Please use ID number
numbers to ease cross-
D.3)
Data variable
S ata unit
Measured (m),
calculated (c),
ted
Recording frequency
Proportion of data
to be monitored
How will the data be
archived? (electronic/
paper) referencing to table
ource of data
D
estima (e),
Comment
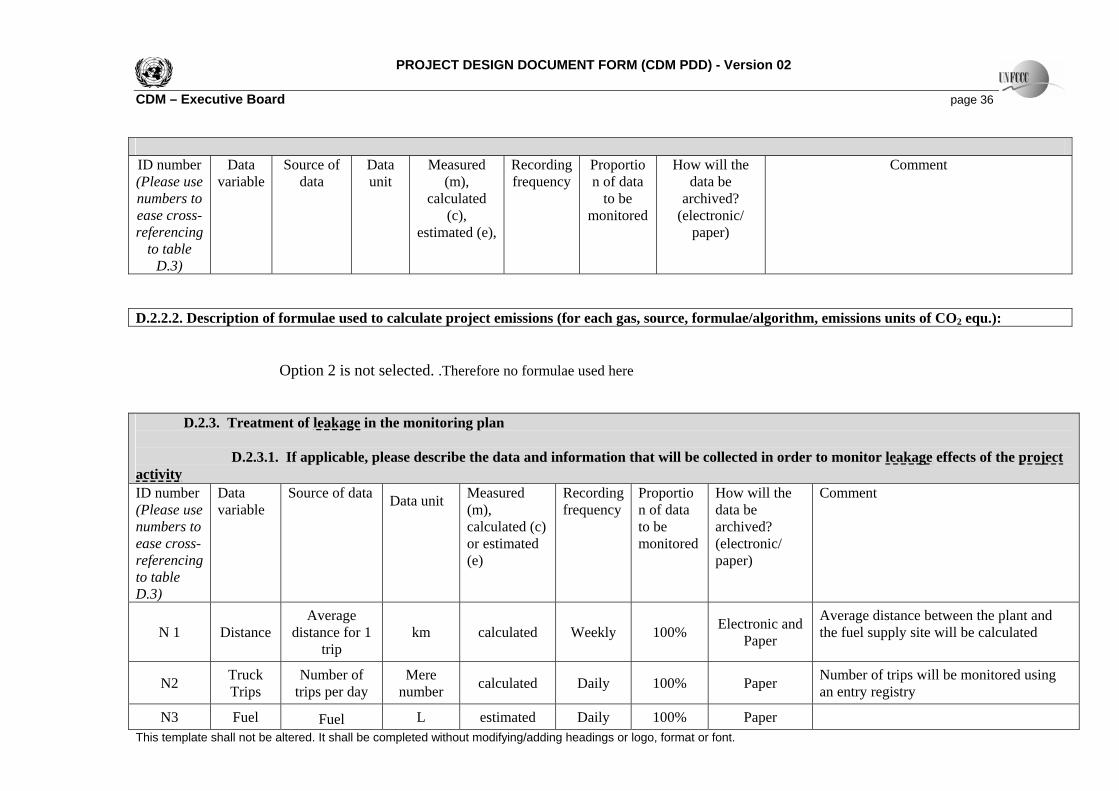
D.2.2.2. Description of formulae used to calculate project emissions (for each gas, source, formulae/algorithm, emissions units of CO2 equ.): Option 2 is not selected. .Therefore no formulae used here D.2.3. Treatment of leakage in the monitoring plan D.2.3.1. If applicable, please describe the data and information that will be collected in order to monitor leakage effects of the project activity ID number(Please use numbers to ease cross-referencing to table D.3)
Data variable
Source of data Data unit Measured (m), calculated (c) or estimated (e)
Recording frequency
Proportion of data to be monitored
How will the data be archived? (electronic/ paper)
Comment
N 1 Distance Average
distance for 1 trip
km calculated Weekly 100% Electronic and Paper
Average distance between the plant and the fuel supply site will be calculated
N2 Truck Trips
Number of trips per day
Mere number calculated Daily 100% Paper Number of trips will be monitored using
an entry registry
N3 Fuel Fuel L estimated Daily 100% Paper

PROJECT DESIGN DOCUMENT FORM (CDM PDD) - Version 02
e Board page 37
This template shall not be altered. It shall be completed without modifying/adding headings or logo, format or font.
Consumer tr
tr
ption p uck per
ip
y ed. Estimated b the fuel consum
N4 Em
Fissiacto
on r
ission of the sed for ortation
tCO2eq/ An p
t va e used
er
IPCC defaul
Pa100% nually atedcalculm3
Emactoruel uansp
ff
tr
lues ar
CDM – Executiv
PROJECT DESIGN DOCUMENT FORM (CDM PDD) - Version 02 CDM – Executive Board
This template shall not be altered. It shall be completed without modifying/adding headings or logo, format or font.
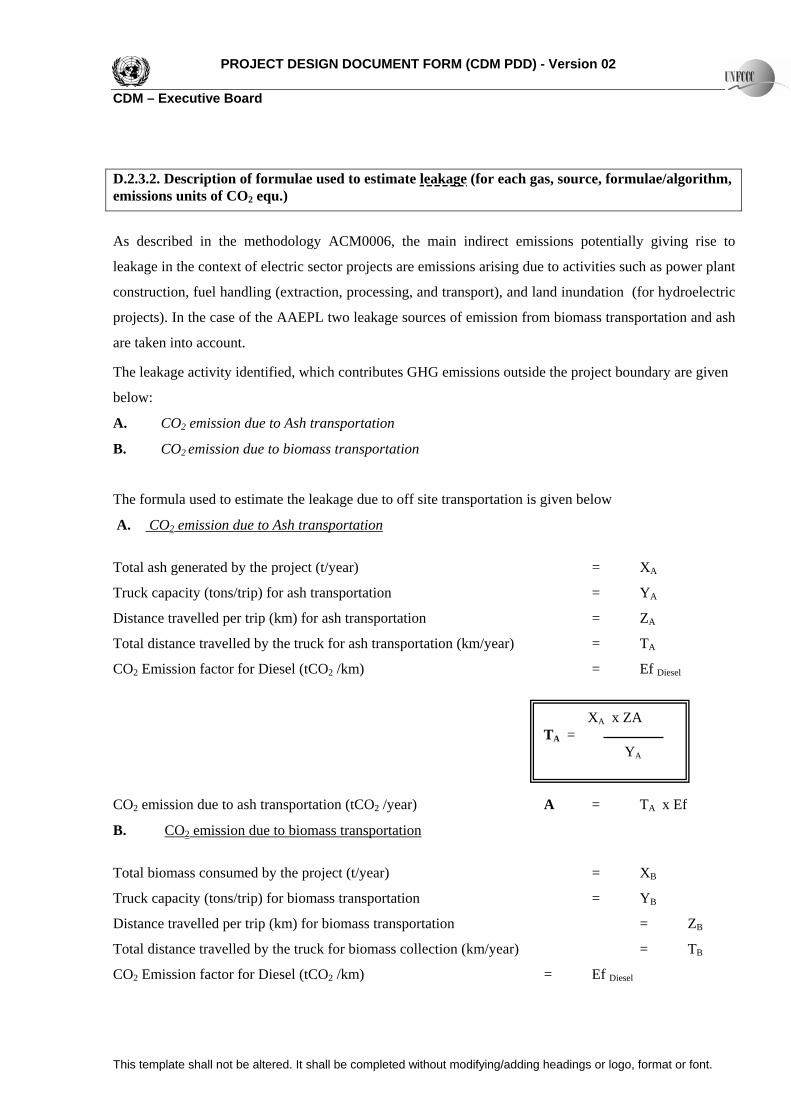
.2.3.2. Description of formulae used to estimate leakageD (for each gas, source, formulae/algorithm, missions units of CO2 equ.) e
As described in the methodology ACM0006, the main indirect emissions potentially giving rise to
ons ari e as power plant
onstruction, fuel handling (extraction, processing, and transport), and land inundation (for hydroelectric
f emis on fro omass transportation and ash
he leakage activity identified, which contributes GHG emissions outside the project boundary are given
. CO2 emission due to Ash transportation
leakage in the context of electric sector projects are emissi sing due to activiti s such
c
projects). In the case of the AAEPL two leakage sources o si m bi
are taken into account.
T
below:
A
B. CO2 emission due to biomass transportation
The formula used to estimate the leakage due to off site transportation is given below
A. CO2 emission due to Ash transpo tatr ion
ear) Total ash generated by the project (t/y
Truck capacity (tons/trip) for ash transportation
= XA
= YA
for ash transportation = ZA
otal distance travelled by the truck for ash transportation (km/year) = TA
( 2 /k
TA x Ef
Distance travelled per trip (km)
T
CO2 Emission factor for Diesel tCO m) = Ef Diesel
XA x ZA T =
A
YA
CO2 emission due to ash transportation (tCO2 /year) A =
B. CO2 emission due to biomass transportation
Total biomass consumed by the project (t/year) = XB
B
Distance travelled per trip (km) for biomass transportatio = ZB
uck for biomass collection (km/year) = TB
O2 Emission factor for Diesel (tCO2 /km) = Ef Diesel
Truck capacity (tons/trip) for biomass transportation = Y
n
Total distance travelled by the tr
C
PROJECT DESIGN DOCUMENT FORM (CDM PDD) - Version 02 CDM – Executive Board
This template shall not be altered. It shall be completed without modifying/adding headings or logo, format or font.
CO emission due to biom2 ass transportation (tCO
ue to off site t rtation (tCO
(Ash and Biomass transportation)
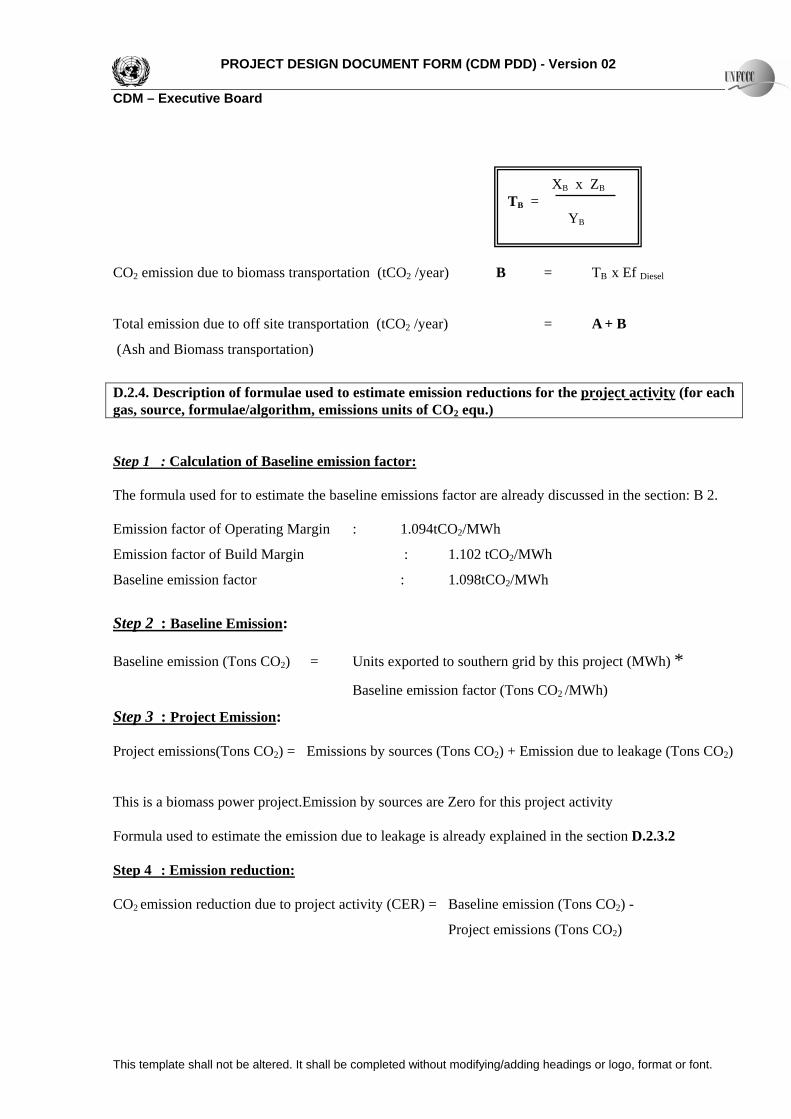
D.2.4. Description of formula to estimate
2 /year) B = TB x Ef Diesel
Total emission d ranspo 2 /year) = A + B
e used emission reductions for the project activity (fo
ts of COr each
gas, source, formulae/algorith issions unim, em 2 equ.)
X x ZB B
TB = YB
Step 1 : Calculation of Baseline emission factor: The formula used for to estim
ate th issions factor are alr
of Operating M :
of Build Marg
:
e Emission
e baseline em eady discussed in the section: B 2.
Emission factor argin 1.094tCO2/MWh
Emission factor in : 1.102 tCO2/MWh
Baseline emission factor
1.098tCO2/MWh
Step 2 : Baselin :
2) Units exported to southern grid by
Baseline em
t Emission
Baseline emission (Tons CO = this project (MWh) * ission factor (Tons CO /MWh) 2
Step 3 : Projec :
2) = Emissions by sources (Tons CO 2)
This is a biomass power project.Emission by sour
estimate the e n due to leak Step 4 : Emission reduction:
Project emissions(Tons CO
2) + Emission due to leakage (Tons CO
ces are Zero for this project activity
Formula used to missio age is already explained in the section D.2.3.2
CO2 emission reduction due to project activity (C
ER) = Baseline emission (Tons CO2) -
Project emissions (Tons CO2)
PROJECT DESIGN DOCUMENT FORM (CDM PDD) - Version 02 CDM – Executive Board
This template shall not be altered. It shall be completed without modifying/adding headings or logo, format or font.
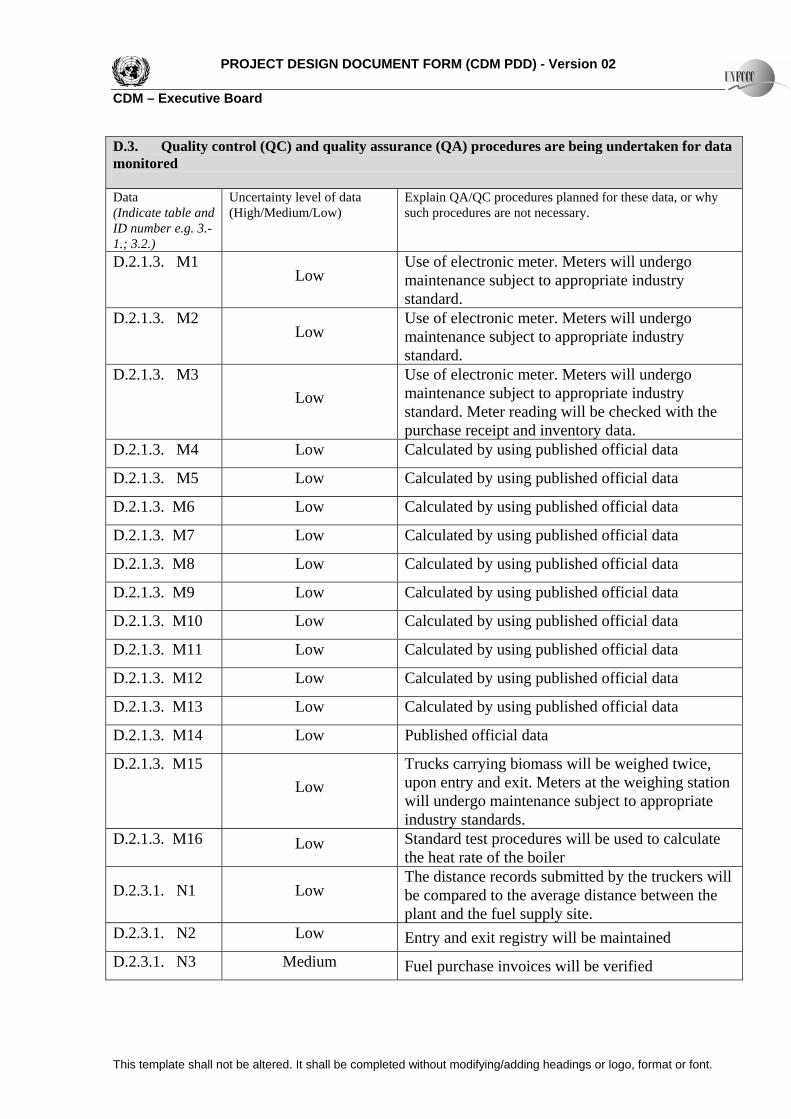
D.3. Quality control (QC) uality assur ata and q ance (QA) procedures are being undertaken for dmonitored Data
ndicate table and Uncertainty level of data (High/Medium/Low)
Explain QA/QC procedures planned for these data, or why such procedures are not necessary. (I
ID number e.g. 3.-1.; 3.2.) D.2.1.3. M1 Use of electronic meter. Meters will undergo
Low maintenance subject to appropriate industry standard.
D.2.1.3. M2 Low
Use of electronic meter. Meters will undergo maintenance subject to appropriate industry standard.
D.2.1.3. M3 Low
Use of electronic meter. Meters will undergo maintenance subject to appropriate industry standard. Meter reading will be checked with the purchase receipt and inventory data.
D.2.1.3. M4 Low Calculated by using published official data
D.2.1.3. M5 Low Calculated by using published official data
D.2.1.3. M6 Low Calculated by using published official data
D.2.1.3. M7 Low Calculated by using published official data
D.2.1.3. M8 Low Calculated by using published official data
D.2.1.3. M9 Low Calculated by using published official data
D.2.1.3. M10 Low Calculated by using published official data
D.2.1.3. M11 Low Calculated by using published official data
D.2.1.3. M12 Low Calculated by using published official data
D.2.1.3. M13 Low Calculated by using published official data
D.2.1.3. M14 Low Published official data
D.2.1.3. M15 Low
Trucks carrying biomass will be weighed twice, upon entry and exit. Meters at the weighing station will undergo maintenance subject to appropriate industry standards.
D.2.1.3. M16 Low Standard test procedures will be used to calculate the heat rate of the boiler
D.2.3.1. N1 Low be compared to the average distance between the plant and the fuel supply site.
The distance records submitted by the truckers will
D.2.3.1. N2 Low Entry and exit registry will be maintained D.2.3.1. N3 Medium Fuel purchase invoices will be verified
PROJECT DESIGN DOCUMENT FORM (CDM PDD) - Version 02 CDM – Executive Board D.2.3.1. N4 Low Use of officially published data and laboratory
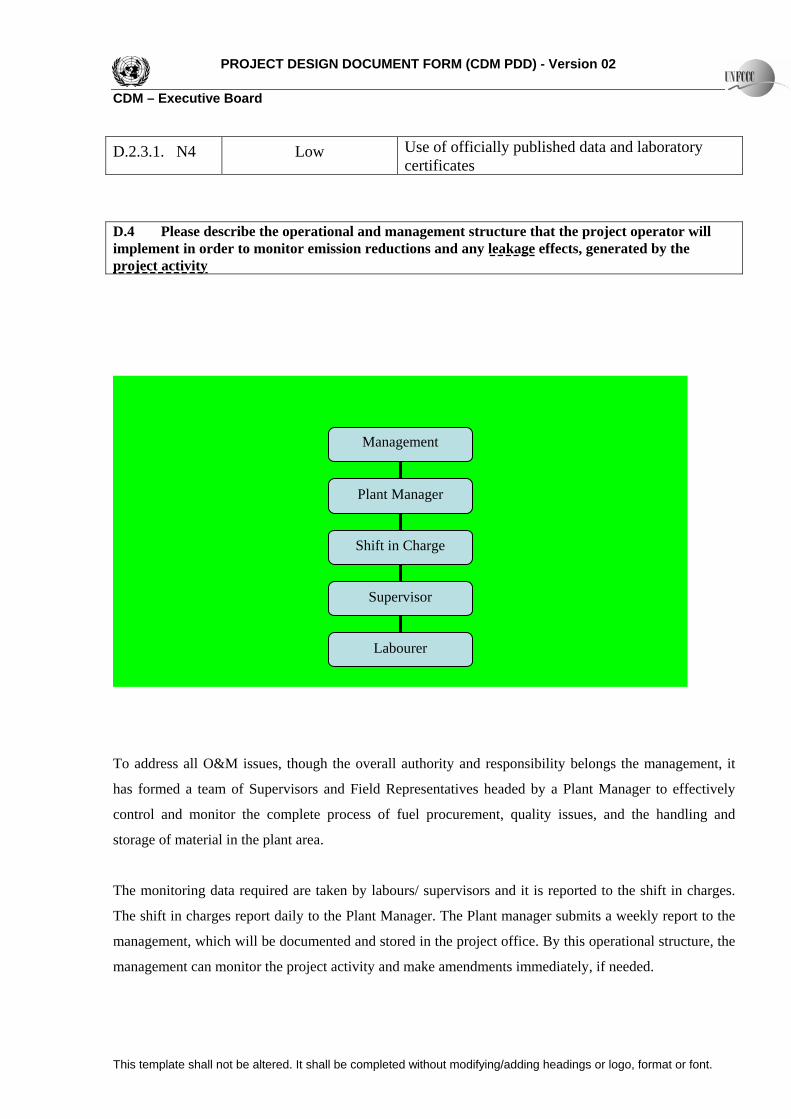
certificates D.4 Please describe the operational and management structure that the project operator will implement in order to monitor emission reductions and any leakage effects, generated by the project activity
To address all O&M issues, though the overall authority and responsibility belongs the management, it
has formed a team of Supervisors and Field Representatives headed by a Plant Manager to effectively
control and monitor the complete process of fuel procurement, quality issues, and the handling and
storage of material in the plant area.
The monitoring data required are taken by labours/ supervisors and it is reported to the shift in charges.
The shift in charges report daily to the Plant Manager. The Plant manager submits a weekly report to the
management, which will be documented and stored in the project office. By this operational structure, the
management can monitor the project activity and make amendments immediately, if needed.
Management
Plant Manager
Shift in Charge
Supervisor
Labourer
This template shall not be altered. It shall be completed without modifying/adding headings or logo, format or font.
PROJECT DESIGN DOCUMENT FORM (CDM PDD) - Version 02 CDM – Executive Board No additional CDM related training is required at any level as the monitoring data required for the
verification are taken from the regular digital meters and manual logs.
The monitored parameters have low level of uncertainty. Therefore the possible monitoring data
a
Reported e previous results and data and will be thoroughly
checked for any
D
djustments are not envisaged for the project.
results and data will be compared with th
inconsistency.
.5 Name of person/entity determining the monitoring methodology:
Organization: Asia Carbon International B V Street/P.O.Box: Kodambakkam high Road, Nungambakkam Building: 167 City: Chennai State/Region: Tamilnadu Postfix/ZIP: 600 024 Country: In a diTelephone: + 44 3991 180501 FAX: +91 44 39180505 E-Mail: di sh@ane siacarbon.com URL: w .asiaww carbon.com
This template shall not be altered. It shall be completed without modifying/adding headings or logo, format or font.
PROJECT DESIGN DOCUMENT FORM (CDM PDD) - Version 02 CDM – Executive Board
.
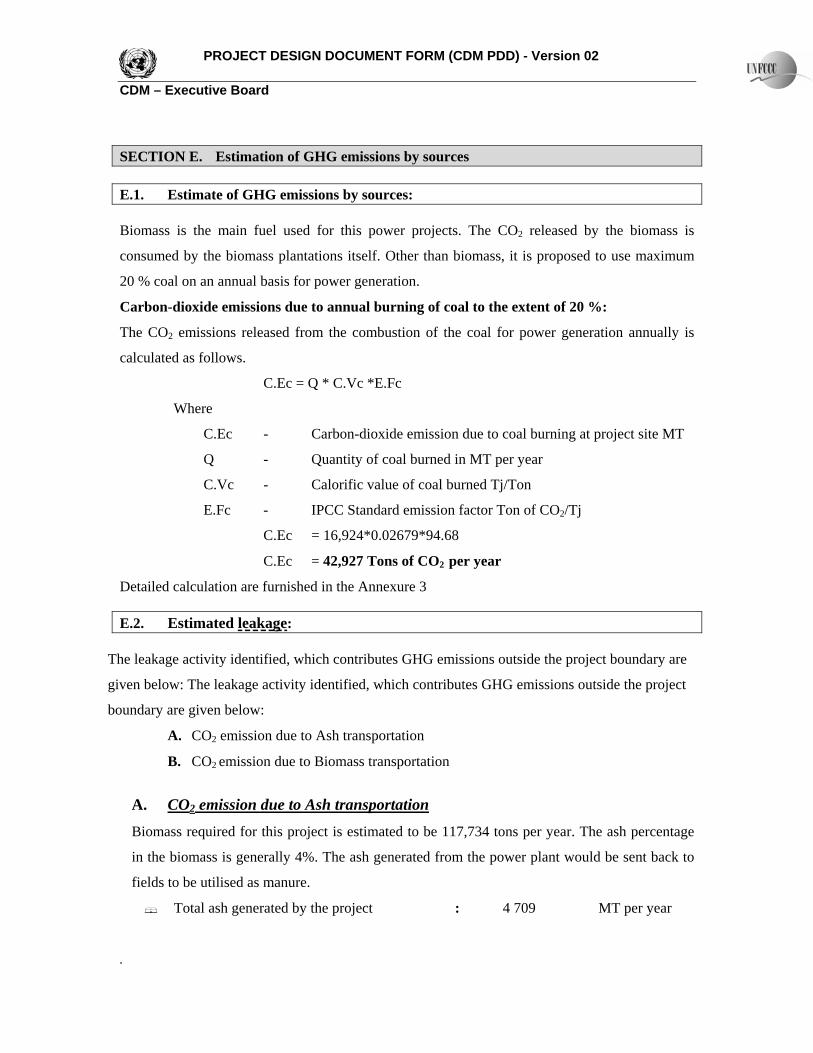
SECTION E. Estimation of GHG emissions by sources E.1 . Estimate of GHG emissions by sources: Biom cts. The CO2 released by the biomass is
con lf. Other than biomass posed ximum
20 % coal on an annual basis for power generation.
Carbon-dioxide emissions due to annual burning of coal to the extent of 20 %:
The CO2 emissions released from the combustion of the coal for power generation annually is
Detailed calculation are furnished in the Annexure 3 E.2. Estimated leakage
ass is the main fuel used for this power proje
sumed by the biomass plantations itse , it is pro to use ma
calculated as follows.
C.Ec = Q * C.Vc *E.Fc
Where
C.Ec - Carbon-dioxide emission due to coal burning at project site MT
Q - Quantity of coal burned in MT per year
C.Vc - Calorific value of coal burned Tj/Ton
E.Fc - IPCC Standard emission factor Ton of CO2/Tj
C.Ec = 16,924*0.02679*94.68
C.Ec = 42,927 Tons of CO2 per year
:
The leakage activity ntifi tes GHG emissions outside the project boundary are
given below: The lea ge ac hich contributes sions outside the project
boundary are given below:
A. CO2 e sion nsportation
B. CO2 e sion nsportation
A. CO
ide ed, which contribu
ka tivity identified, w GHG emis
mis due to Ash tra
mis due to Biomass tra
2 emission due to Ash transportation
Biomass required for this project is estimated to be 117,734 tons per year. The ash percentage
in the biomass is generally 4%. The ash generated from the power plant would be sent back to
fields to be utilised as manure.
Total ash generated by the project : 4 709 MT per year
PROJECT DESIGN DOCUMENT FORM (CDM PDD) - Version 02 CDM – Executive Board
.
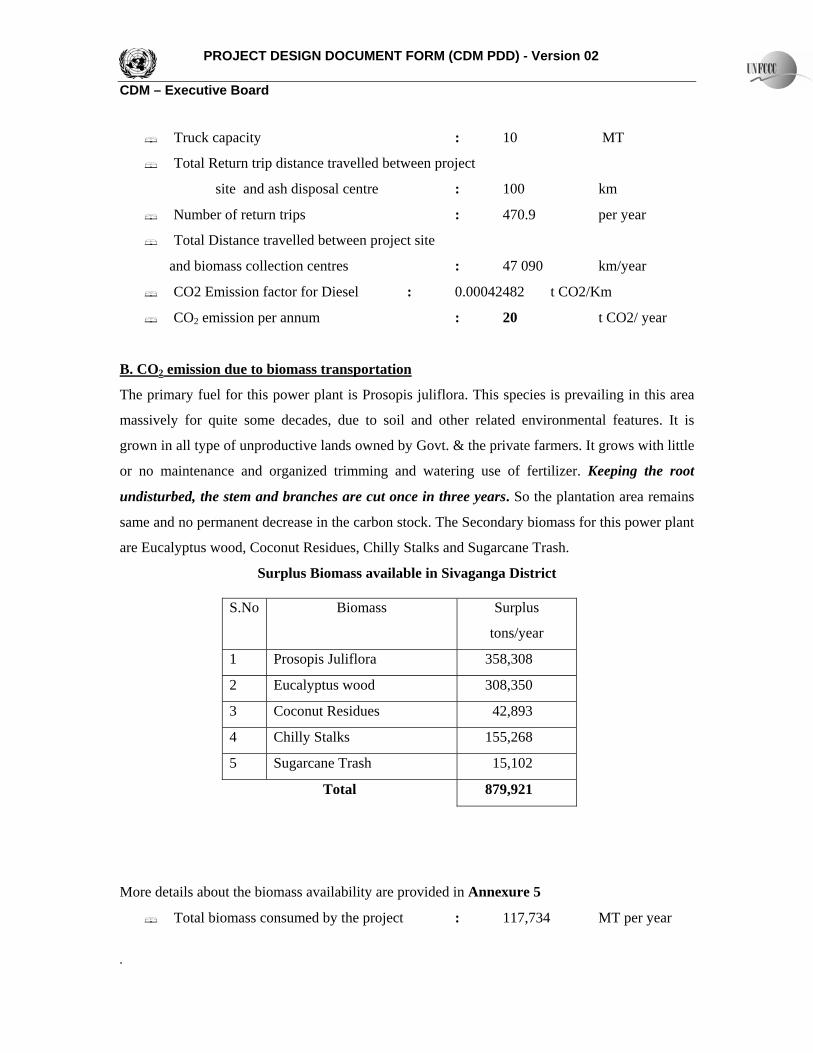
Truck capacity : 10 MT
Total Return trip distance travelled between project
/year
CO2 emission per annum : 20 t CO2/ year
. CO
site and ash disposal centre : 100 km
Number of return trips : 470.9 per year
Total Distance travelled between t projec site
and biomass collection centres : 47 090 km
CO2 Emission factor for Diesel : 0.00042482 t CO2/Km
B 2 emission due to biomass transportation
The primary fuel for this power plant is Prosopis julif s cies a
assively for quite some decades, due to soil and other related environmental features. It is
rs. It grows with little
r no maintenance and organized trimming and watering use of fertilizer. Keeping the root
n n e years. So the plantation area remains
ondary biomass for this power plant
re Euc yptus w od, C nut R ugarcane Trash.
lora. Thi spe is prevailing in this are
m
grown in all type of unproductive lands owned by Govt. & the private farme
o
undisturbed, the stem and bra ches are cut o ce in thre
same and no permanent decrease in the carbon stock. The Sec
a al o oco esidues, Chilly Stalks and S
Surplus Biomass available in Sivaganga District
S.No Biomass Surplus
tons/year
1 Prosopis Juliflora 358,308
2 Eucalyptus wood 308,350
3 ocon 42,893 C ut Residues
4 C Stalks 155,268 hilly
5 Sugarcane Trash 15,102
Total 879,921
More details about the biomass availability are provided in Annexure 5
Total biomass consumed by the project : 117,734 MT per year
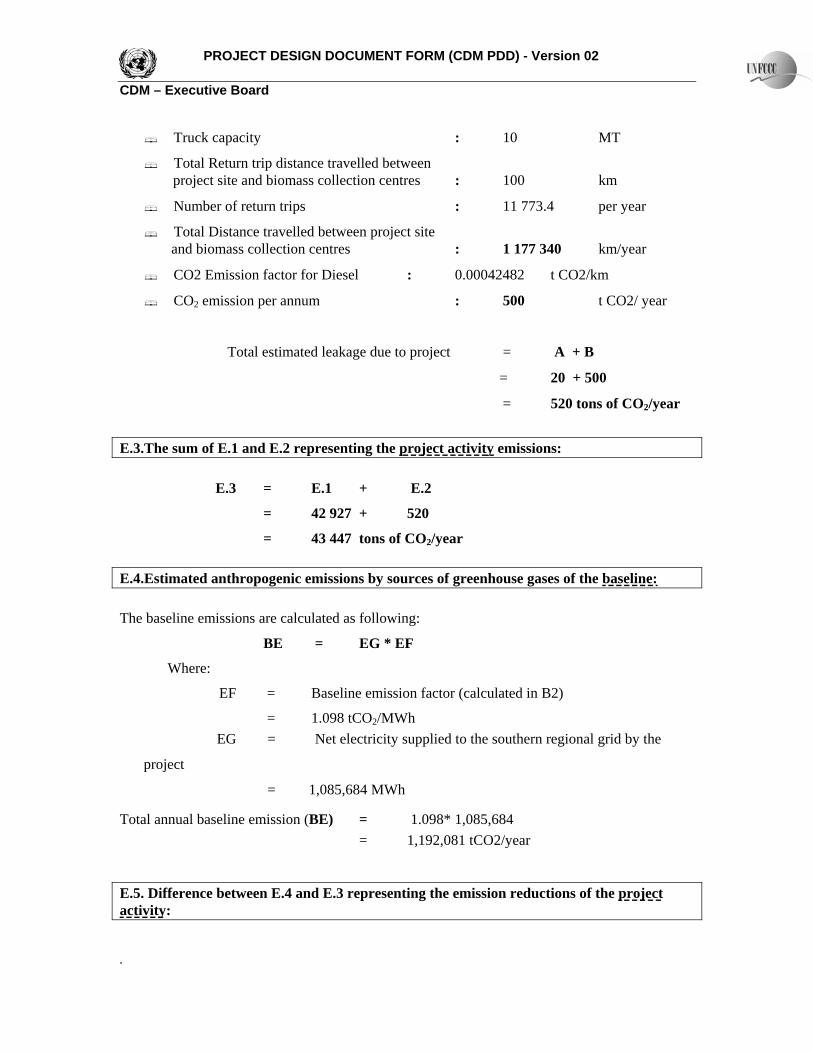
PROJECT DESIGN DOCUMENT FORM (CDM PDD) - Version 02 CDM – Executive Board
.
Truck capacity : 10 MT
: 100 km
Number of return trips : 11 773.4 per year
To stance en pro and biomass collection centres : 1 177 340 km
CO2 Emission factor for Diesel 0.00042482 t CO2/km
CO ssion per an 5 t CO2
Total estim age due t = + B
= 0 + 500
= 20 tons of C
E.3.The sum of E.1 and E.2 representing the project activity
Total Return trip distance travelled between project site and biomass collection centres
ta il D travelled betwe ject site
:
/year
2 emi num : 00 / year
ated leak o project A
2
5 O2/year
emissions:
42 927 + 520
ns of CO2/year
.4.Estimated anthropogenic emissions by sources of greenhouse gases of the baseline:
E.3 = + E.1 E.2
=
= 43 447 to E
he b line emissions are calculated as following: T ase
Where:
EF seline emission factor (calculated in B2)
= 1.098 tCO2/MWh EG = Net electricity supplied to the southern regional grid by
1,085,684 MWh
Total n 1.098* 1,0 = 1,192,081 t E.5. D the emission reductions of the p
BE = EG * EF
= Ba
the
project
=
an ual baseline emission (BE) = 85,684 CO2/year
ifference between E.4 and E.3 representing roject activity:
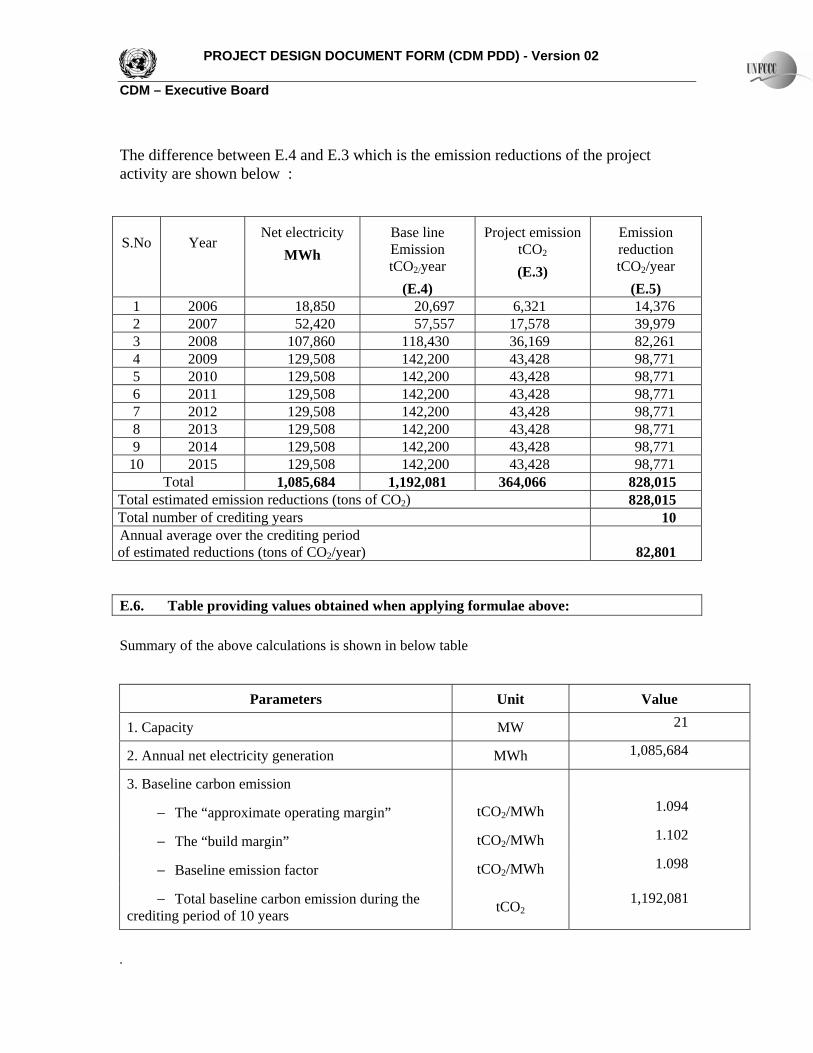
PROJECT DESIGN DOCUMENT FORM (CDM PDD) - Version 02 CDM – Executive Board
.
The difference between E.4 and E.3 which is the emission reductions of the project activity are shown below :
Sse line
Emission tCO2/year
(E.4) (E.3)
EmredtCO2/year
(E.5)
.No
Year
Net electricity MWh
Ba Project emission tCO2
ission uction
1 2006 18,850 20,697 6,321 14,376 2 2007 52,420 57,557 17,578 39,979 3 2008 107,860 118,430 36,169 82,261 4 2009 129,508 142,200 43,428 98,771 5 2010 129,508 142,200 43,428 98,771 6 2011 129,508 142,200 43,428 98,771 7 2012 129,508 142,200 43,428 98,771 8 2013 129,508 142,200 43,428 98,771 9 2014 129,508 142,200 43,428 98,771
10 2015 129,508 142,200 43,428 98,771 Total 1,085,684 1,192,081 364,066 828,015
Total estimated emission reductions (tons of CO2) 828,015 10 Total number of crediting years Annual average over the crediting period
of estimated reductions (tons of CO2/year) 82,801 E.6. Table providing values obtained when applying formulae above: Summary of the above calculations is shown in below table
s Unit Value Parameter
1. Capacit MW 21 y
2. Annual net electricity generation MWh 1,085,684
3. e Bas line carbon emission
− The “approximate operating margin” tCO2/MWh 1.094
− The “build margin” tCO2/MWh 1.102
− Ba tCO2/MWh 1.098 seline emission factor
− Total baseline carbon emcrediting period of 10 years tCO2
1,192,081
ission during the
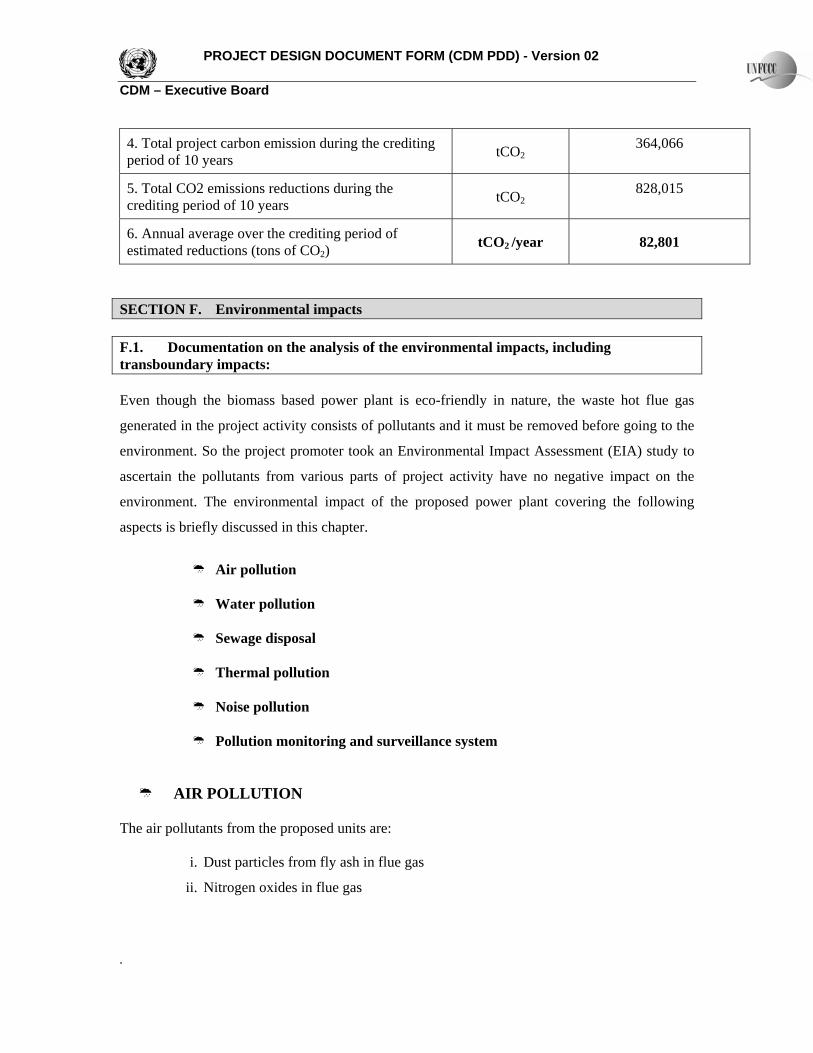
PROJECT DESIGN DOCUMENT FORM (CDM PDD) - Version 02 CDM – Executive Board
.
4. Total project carbon emission during the crediting period of 10 years tCO2
364,066
5. Total CO2 emissions reductions during the crediting period of 10 years tCO2
828,015
6. Annual average over the crediting period of estimated reductions (tons of CO2)
tCO2 /year 82,801
SECTION F. Environmental impacts F.1. Documentation on the analysis of the environmental impacts, including transboundary impacts:
ven though the biomasE s based power plant is eco-friendly in nature, the waste hot flue gas
A) study to
scertain the pollutants from various parts of project activity have no negative impact on the
e impact of the proposed power plant covering the following
Sewage disposal
T
i. Dust particles from fly ash in flue gas
gas
generated in the project activity consists of pollutants and it must be removed before going to the
environment. So the project promoter took an Environmental Impact Assessment (EI
a
nvironment. The environmental
aspects is briefly discussed in this chapter.
Air pollution
Water pollution
Thermal pollution
Noise pollution
Pollution monitoring and surveillance system
AIR POLLUTION
he air pollutants from the proposed units are:
ii. Nitrogen oxides in flue
PROJECT DESIGN DOCUMENT FORM (CDM PDD) - Version 02 CDM – Executive Board
.
For thermal power stations, the Central Pollution Control Board stipulate the limits for particulate
atter emission. 150 mg/Nmm
l
m mitted to
atmosphere and will be designed such that the outlet dust concentration meets the CPCB /
T Board stipulation of 115mg/Nm3.
S
f
x &
el is negligible, therefore, SOx and NOx emissions to atmosphere is not envisaged.
nerator blow down water
i) Effluent from water tre
The DM water requirement of the plant is only 1m3/hr, however, the DM plant is sized for 3 m3/
hr considering regeneration and th this plant is ve w. Hydrochloric acid and
caustic soda would be used as regeneration in the proposed water treatment plant. The acid and
alkali generated during the regeneration process of the ion exchangers would be drained into a
neutralising pit. The effluent would be neutralised by the addition of either acid or alkali to
achieve the required pH before disposing off for dust suppression or for horticultural purpose.
3 for protected area and 350 mg/ Nm3 for other areas and the same
imits are followed by all State Pollution Control Board. The electrostatic precipitator will remove
ost of the fly ash from the flue gas; thereby limiting the quantity of fly ash e
amilNadu State Pollution Control
tack height of minimum 4 m will be provided considering the fuel characteristics, to disperse the
lue gas into atmosphere.
NO SO2 Emissions Since biomass is used as fuel in this project activity the fuel bound nitrogen or sulphur content in
fu
WATER POLLUTION The water pollutants from the proposed units are
i. Effluent from water treatment plant
ii. Steam ge
iii. Cooling tower blow down
atment plant
e effluent from ry lo
ii) Steam Generator Blow down
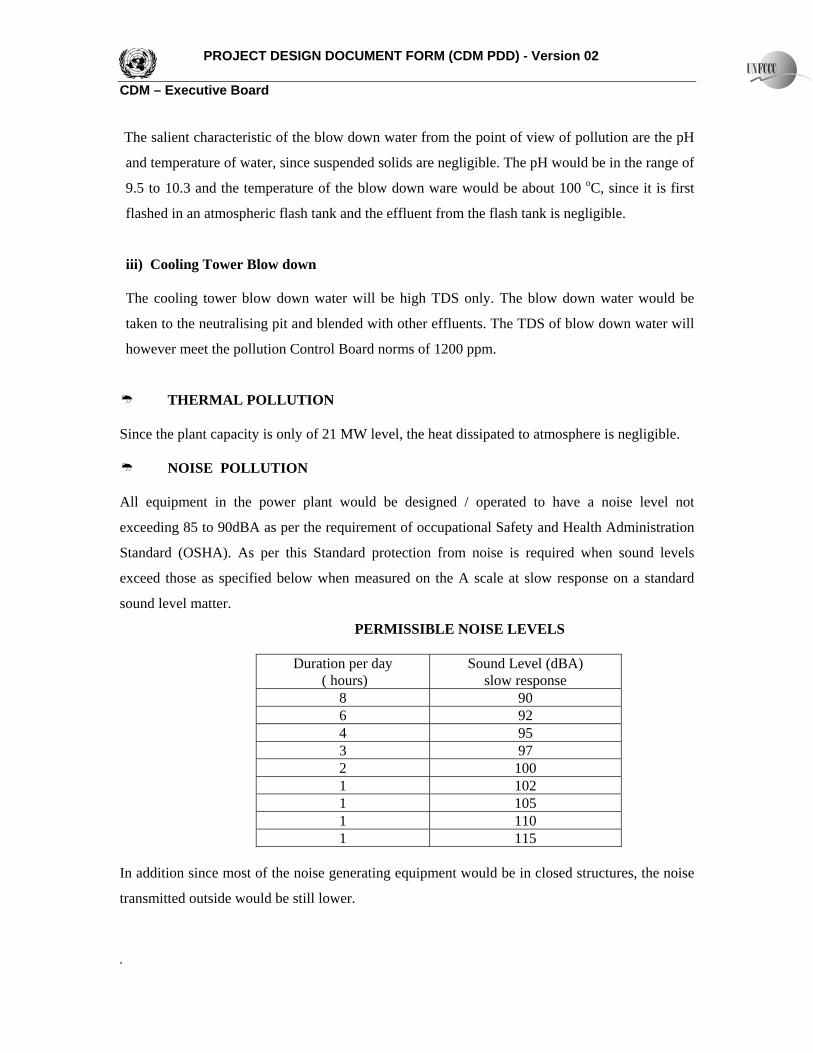
PROJECT DESIGN DOCUMENT FORM (CDM PDD) - Version 02 CDM – Executive Board
.
The sal lution are the pH
wn water will
however meet the pollution Control Board norms of 1200 ppm.
THERMAL POLLUTION
e heat dissipated to atmosphere is negligible.
ll equipment in the power plant would be designed / operated to have a noise level not
edi Administration
Duration per day
( hours) Sound Level (dBA)
slow response
ient characteristic of the blow down water from the point of view of pol
and temperature of water, since suspended solids are negligible. The pH would be in the range of
9.5 to 10.3 and the temperature of the blow down ware would be about 100 oC, since it is first
flashed in an atmospheric flash tank and the effluent from the flash tank is negligible.
iii) Cooling Tower Blow down
The cooling tower blow down water will be high TDS only. The blow down water would be
taken to the neutralising pit and blended with other effluents. The TDS of blow do
Since the plant capacity is only of 21 MW level, th
NOISE POLLUTION A
exce ng 85 to 90dBA as per the requirement of occupational Safety and Health
Standard (OSHA). As per this Standard protection from noise is required when sound levels
exceed those as specified below when measured on the A scale at slow response on a standard
sound level matter.
PERMISSIBLE NOISE LEVELS
8 90 6 92 4 95 3 97 2 100 1 102 1 105 1 110 1 115
In addition since most of the noise generating equipment would be in closed structures, the nois
transmitted outside would be still lower.
e
PROJECT DESIGN DOCUMENT FORM (CDM PDD) - Version 02 CDM – Executive Board
.
POLLUTION MONITORING AND SURVEILLANCE SYSTEMS For thermal power stations, the CPCB / TNPCB stipulate the limits of 115 mg/ NM3 for
ater quality- monitoring programme
various sources will be monitored regularly and
ualified persons would be in charge of monitoring the parameters by using suitable instruments.
IMPACT OF POLLUTION / ENVIRONMENTAL DISTURBANCE
n the emission levels of dust particles,
e and nitrogen oxide within the permissible limits would be taken and necessary
water quality
this project activity green belt of minimum 25 metre width will be provided all around the
resi d for the
reen belt. The area to be occupied is an uninhabited dry agricultural land. Hence there is no
If environmental impacts are considered significant by the project participants or
particulate matter emission and minimum stack heights to be maintained for keeping the sulphur
dioxide and nitrogen dioxides levels in the ambient within the air quality standards. The
characteristics of the effluent from the plant would be maintained so as to meet the requirements
of the state pollution Control Board and the minimum National standards for Thermal Power
plants stipulated by the Central Board for Prevention and Control of Water Pollution. The air
quality will be periodically monitored and reported by using adequate instruments.
W The quality of the effluent generated fromcorrective action will be taken. Q
Since all necessary pollution control measure to maintai
sulphur dioxid
treatment of effluents would be carried out, there would be no adverse impact on either air or
in and around the power station site on account of installation of the proposed plant.
GREEN BELT In
plant boundary limits. In addition, avenue trees will be planted all along the roads. Droughts
stant trees (Babul, Neem or Date Palms) suitable for the local climate will be selecte
g
displacement and resettlement of population.
F.2. the host Party, please provide conclusions and all references to support documentation of an
PROJECT DESIGN DOCUMENT FORM (CDM PDD) - Version 02 CDM – Executive Board
.
environmental impact assessment undertaken in accordance with the procedures as required by the host Party:
he biomass based grid connected power plant implemented by Aurobindo Agro Energy Pvt.ltd
asse
asse Aurobindo Agro Energy Pvt.ltd, is according to the
pol lementing this project and
as received relevant clearnces for the same from the Tamilnadu Pollution Control Board
T
is an environmental friendly project .As mentioned in section F.1, as per environmental impact
ssment studies, the project activity has no remarkable effect in the atmosphere. The
ssment studies undertaken by the
pollution control board norms. The Green House Gas emissions, thermal pollution and dust
lution will be reduced by Aurobindo Agro Energy Pvt.Ltd by imp
h
(TNPCB).
SECTION G. Stakeholders’ comments G.1. Brief description how comments by local stakeholders have been invited and compiled: The following Statutory bodies have examined and studied about all the aspects of the project and
e issued necessary clearances to establish the project:
al Body:
hav
Loc
Village Panchayat, an elected body of representatives administrating the local area by the
Electricity
Board (TNEB), Lr.No. SE/SEDC/SVGA /DFC/F.Agreement /2003 Dt. 17/06/2003.
TamilNadu Fire Service has issued a Fire Service License (under Section 13 of the Tamilnadu
ilizing biomass as a fuel. Licence No. 29/2003 Dated 28/08/2003
•
local people, has issued the plant layout approval for the Biomass Power Project.
State Government of TamilNadu:
• The project proponent has signed Power Purchase Agreement with TamilNadu
•
Fire Service Act 1985 and with Tamilnadu Services Rules 1990 – Apendix – III) License for
power plant by ut
PROJECT DESIGN DOCUMENT FORM (CDM PDD) - Version 02 CDM – Executive Board
.
• District Collector of Sivaganga District (Highest Administrative officer in the District) has
03.
Tamil Nadu Pollution Control Board (TNPCB) has issued the consent for establishment of
the biomass power project, Consent order No: 2825 Proceedings No.
T11/TNPCB/F.838/SVG/W/2004.
• Tamil Nadu Forest Department has issued a No Objection Certificate for setting up Biomass
based Thermal power project C.No 2327/2003 D dated 3/06/2003
• The public Works Department has issued a Ground Water Clearance Certificate for drawal of
02.40 lakhs lpd of ground water for the proposed Biomass Power plant at Virgadi
Kadambankulam village ( Hamlet of Sevavoorani), Kalayarkoil Block, Sivagangai District –
Permission granted – reg.
Government of India:
• Airport Authority of India, New Delhi’s has issued the No Objection Certificate for
Chimney’s height clearance, vide letter No.AAI/20012/1162/2003-ARI (NOC) dated
11/02/04
The project proponent has conducted discussions with members of the local population. The local
populations welcome the project due to various benefits, such as development of infrastructure in
the area, increase of income due to the supply of biomass and improvement in their standards for
living. The project proponent has already established good relationship with local people who
ensure co-operation for the successful and continuous operation of the power plant.
G.2. Summary of the comments received:
issued the No Objection Certificate D.Dis/D4/43088/2003 dated 14/11/20
•
The project proponent received no negative comments from the public as well as from
government bodies.
G.3. Report on how due account was taken of any comments received:

PROJECT DESIGN DOCUMENT FORM (CDM PDD) - Version 02 CDM – Executive Board
.
The comments were carefully reviewed. All of them are positive comments.
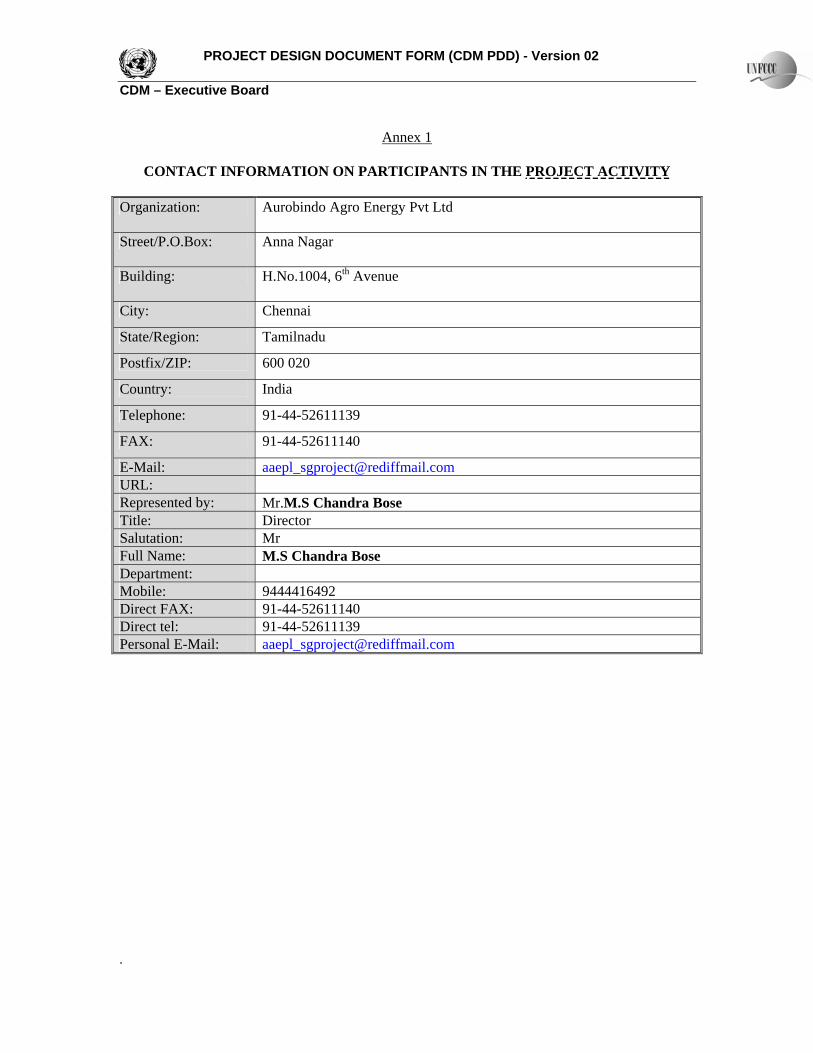
PROJECT DESIGN DOCUMENT FORM (CDM PDD) - Version 02 CDM – Executive Board
.
Annex 1
CONTACT INFORMATION ON PARTICIPANTS IN THE PROJECT ACTIVITY Organization: Au
robindo Agro Energy Pvt Ltd
Street/P.O.Box: Anna Nagar
Building: H.No.1004, 6th Avenue
City: Chennai
State/Region: Tamilnadu
Postfix/ZIP: 600 020
Country: India
Telephone: 91-44-52611139
FAX: 91-44-52611140
E-Mail: [email protected]: Represented by: Mr.M.S Chandra Bose Title: Director Salutation: Mr Full Name: M.S Chandra Bose Department: Mobile: 9444416492 Direct FAX: 91-44-52611140 Direct tel: 91-44-52611139 Personal E-Mail: aaepl_sgproject@rediffm ail.com
PROJECT DESIGN DOCUMENT FORM (CDM PDD) - Version 02 CDM – Executive Board
.
Annex 2
INFORMATION REGARDING PUBLIC FUNDING
There is no public funding for this Project
ANNEX 3
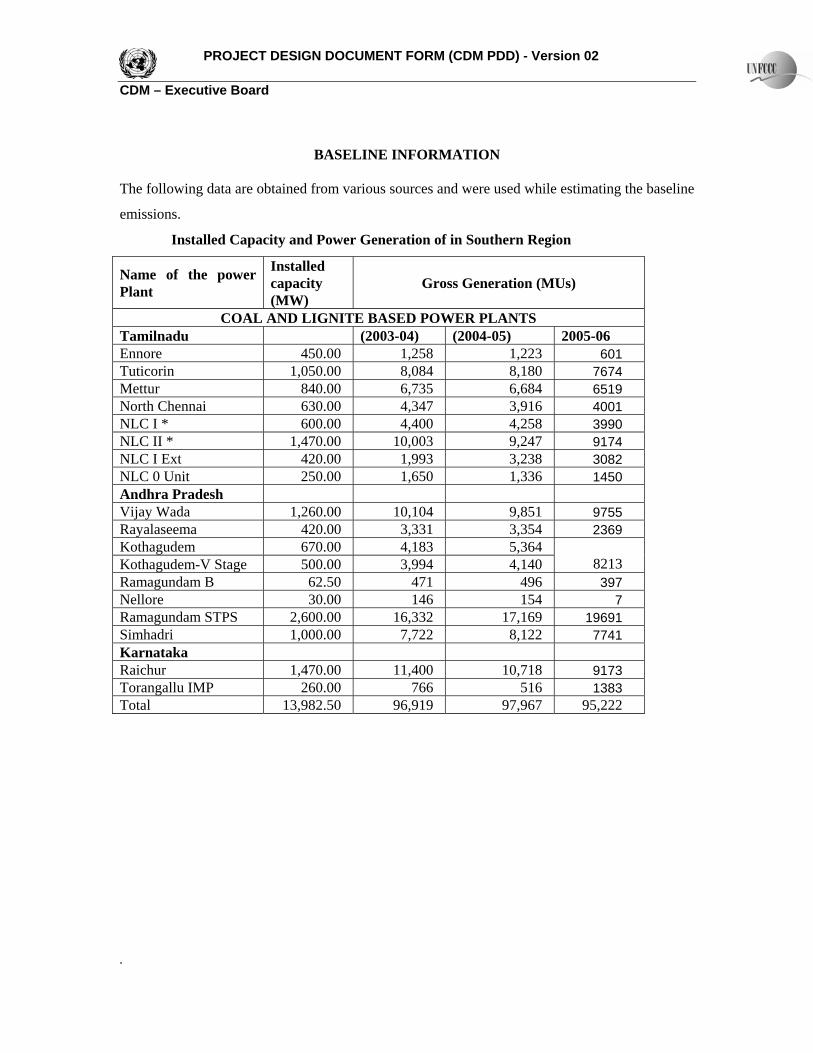
PROJECT DESIGN DOCUMENT FORM (CDM PDD) - Version 02 CDM – Executive Board
.
EL
BAS INE INFORMATION
T wing data are obta various sources and were used while estimating the baseline he follo ined from
emissions.
d Capacity a r G o R
Name of the power P
Instacapa(MW
Gross Generation (MUs)
Installe nd Powe ener natio f in Southern egion
lant
lled city )
COAL AND LIGNITE BASED POWER PLANTS T (2003-04) (2004-05) 20 amilnadu 05-06Ennore 450.00 8 223 1 1,25 1, 60Tuticorin 1,050.00 4 180 4 8,08 8, 767Mettur 840.00 6,735 684 6519 6,N 30.00 4,347 3,916 1 orth Chennai 6 400N 0 258 LC I * 600.00 4,40 4, 3990 N 1 3 247 4 LC II * ,470.00 10,00 9, 917N 3 238 2 LC I Ext 420.00 1,99 3, 308N 0 336 0 LC 0 Unit 250.00 1,65 1, 145Andhra Pradesh V 1,260.00 10,104 851 9755 ijay Wada 9,R 3,331 3,354 9 ayalaseema 420.00 236Kothagudem 3 364 670.00 4,18 5,Kothagudem-V Stage 500.00 3,994 140 8213 4,R am B 1 496 7 amagund 62.50 47 39Nellore 30.00 6 154 7 14R TPS 2,600.00 16,332 17,169 19691 amagundam SSimhadri 1,000.00 7,722 8,122 1 774K arnataka Raichur 0 718 3 1,470.00 11,40 10, 917Torangallu IMP 260.00 766 516 1383 Total 13,982.50 96,919 97,967 95,222
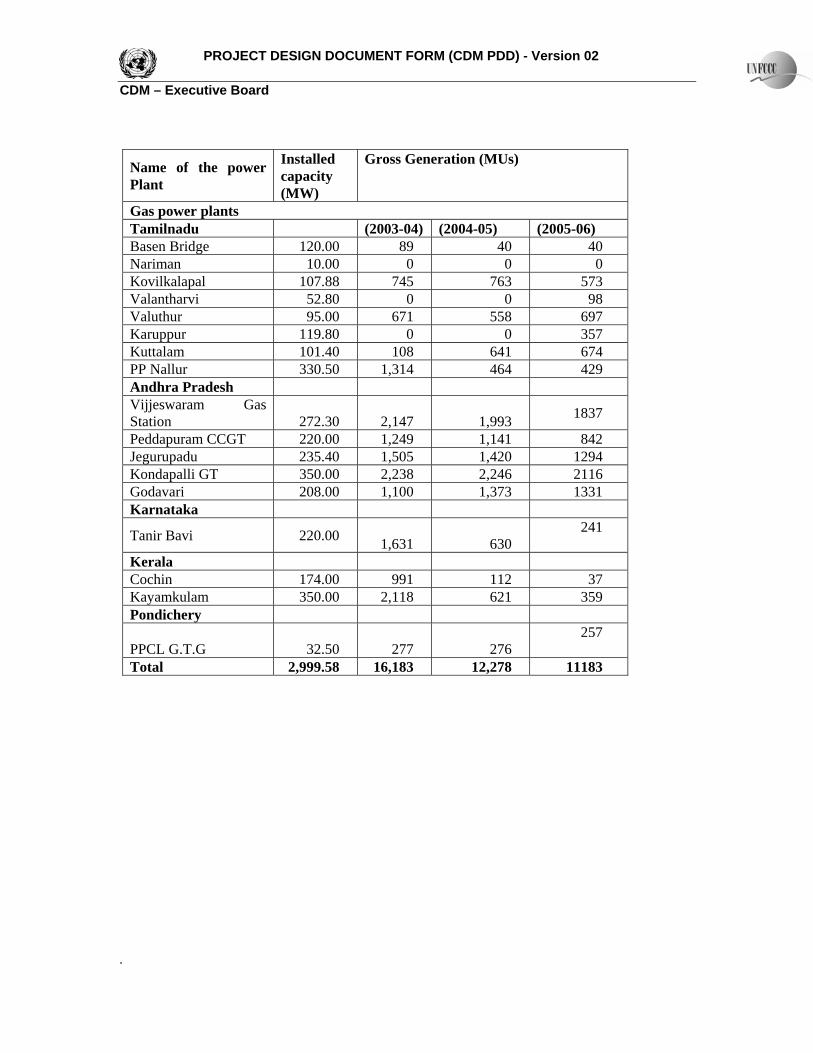
PROJECT DESIGN DOCUMENT FORM (CDM PDD) - Version 02 CDM – Executive Board
.
Name
of the power ity
(MW)
Gross Generation (MUs) InstalledcapacPlant
Gas power plants Tamilnadu (2003-04) (2004-05) (2005-06) Basen Bridge 120.00 89 40 40 Nariman 10.00 0 0 0 Kovilkalapal 107 7 763 573 .88 45Valantharvi 52.80 0 0 98 Valuthur 95 671 5 697 .00 58Karuppur 119.80 0 0 357 Kuttalam 101.40 108 641 674 PP Nallur 1,314 330.50 464 429 Andhra Pradesh Vijjeswaram Gas
2,147 1,993 1837 Station 272.30 Peddapuram CCGT 1,249 1,141 842 220.00 Jegurupadu 235.40 1,505 1,420 1294 Kondapalli GT 350.00 2,238 2,246 2116 Godavari 208.00 1,100 1,373 1331 Karnataka
Tanir B 1,631 630 241
avi 220.00
Kerala Cochin 174.00 991 112 37 Kayamkulam 2,1 359 350.00 18 621 Pondichery
PPCL G.T.G 22
32.50 77 276 57
Total 2, 16,183 12,278 11183 999.58
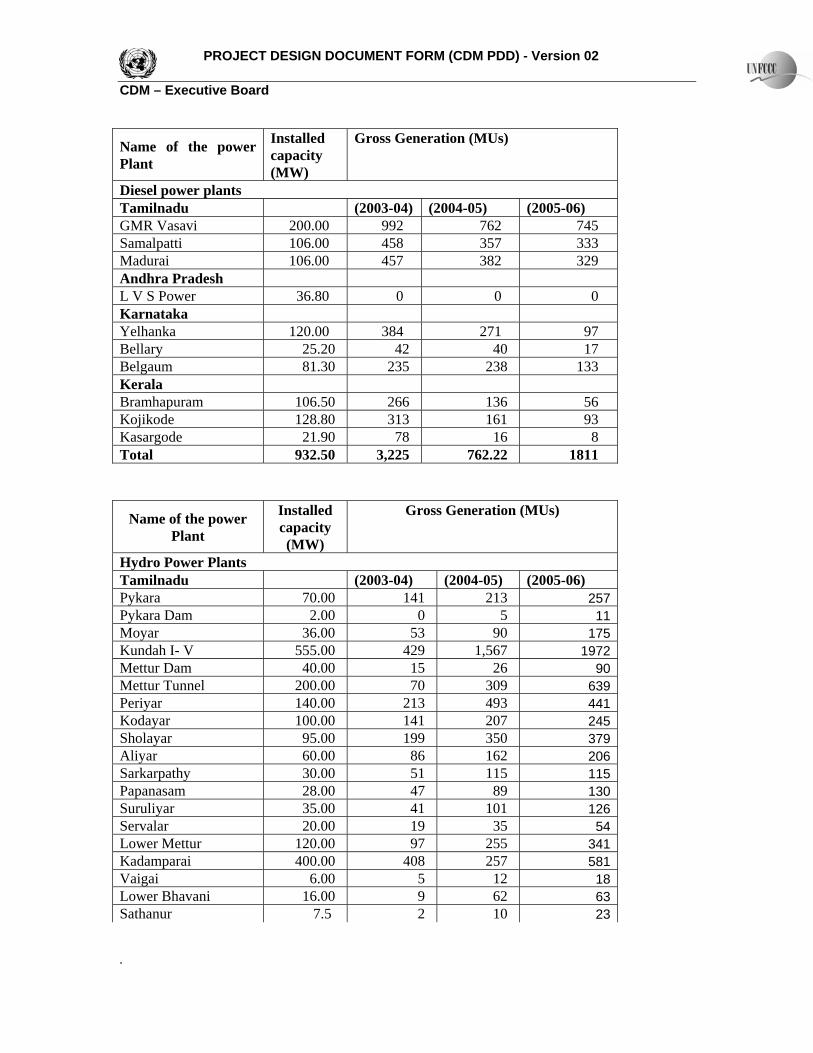
PROJECT DESIGN DOCUMENT FORM (CDM PDD) - Version 02 CDM – Executive Board
.
he power nt
Inca(M
s Gen (MUs)
Name of tPla
stalled pacity
W)
Gros eration
Hydro Power Plants Tamilnadu (2003-04) (2004-05) (2005-06) Pykara 70.00 141 213 257 Pykara Dam 2.00 0 5 11 Moyar 36.00 53 90 175 Kundah I- V 5 1 155.00 429 ,567 972 Mettur Dam 40.00 15 26 90 Mettur Tunnel 200.00 70 309 639 Periyar 1 213 493 440.00 41 Kodayar 100.00 141 207 245 Sholayar 95.00 199 350 379 Aliyar 6 86 162 20.00 06 Sarkarpathy 30.00 51 115 1 15 Papanasam 28.00 47 89 13 0 Suruliyar 3 41 101 125.00 6 Servalar 2 19 35 0.00 54 Lower Mettur 1 2 320.00 97 55 41 Kadamparai 4 408 200.00 57 581 Vaigai 6.00 5 12 18 Lower Bhavani 16.00 9 62 63 Sathanur 7.5 2 10 23
Name of the power Instacap(MW)
Gross G ation (MU
Plant
lled acity
ener s)
Diesel power plants Tamilnadu (2003-0 2004-05 (2005-06)4) ( ) GMR Vasavi 2 99200.00 762 745 Samalpatti 10 458 3 333 6.00 57 Madurai 10 457 382 326.00 9 Andhra Pradesh L V S Power 3 0 6.80 0 0 Karnataka Yelhanka 12 384 20.00 71 97 Bellary 25.20 42 40 17 Belgaum 81.30 235 238 133 Kerala Bramhapuram 1 266 13 56 06.50 6 Kojikode 1 313 161 93 28.80 Kasargode 78 1 8 21.90 6 Total 9 3,225 762.22 1811 32.50

PROJECT DESIGN DOCUMENT FORM (CDM PDD) - Version 02 CDM – Executive Board
.
Parsons Valley 30.00 18 56 53 Pykara ULT 1 150.00 0 0 89 Andhra Pradesh Machkund 114.70 529 901 628 Upper Sileru 240.00 401 544 473 Lower Sileru 460.00 977 1,171 1037 T.B.Dam 36.00 102 148 168 Hampi 36.00 0 0 58 Nagarjunasagar 1810.00 369 502 560 NS Right Canal 290.00 0 48 74 NS Left Canal 60.00 0 5 121 Donkarayi 2 111 132 15.00 15 Srisailam Right 77 30 94 1490.00 9 1 0 Srisailam Left 1 2900.00 328 ,412 233 Pochampad 27.00 64 2 112 Nizamsagar 10.00 6 0 10 Penna Ahobilam 20.00 0 0 10 Singur 15.00 6 1 9 Mini Hydro 30.00 8 6 25 Kerala Kuttiadi 125.00 259 371 516 Idukki 780.00 1,246 2,003 2699 Sabarigiri 300.00 1469 698 1,225 Idamalayar 75.00 155 338 375 Kakkad .00 126 210 249 50Sholayar 54.00 202 263 290 Sengulam 48.00 128 167 189 Narimanglam 45.00 196 232 245 Pallivasal 37.50 93 3 1 22 238 Poringalkuttu 32.00 142 182 165 Poringalkuttu l 6.00 88 108 105 1Panniar 30.00 76 160 142 Kallada 36 64 15.00 77 Lower periyar 63 2 631 180.00 3 51Malankara 0 3 20 10.50Chembukadavu 6.50 0 6 11 Urumi 6.20 0 1 13 Peppara 3.00 1 6 6 Madhupatty 2.00 8 4 5 Other hydro 5.00 0 0 41 Maniyar 10.00 21 34 48 Kuthungal 21.00 19 36 516 Karnataka Jog 174 238 120.00 160 Si rum 192 vasamund 42.00 79 261
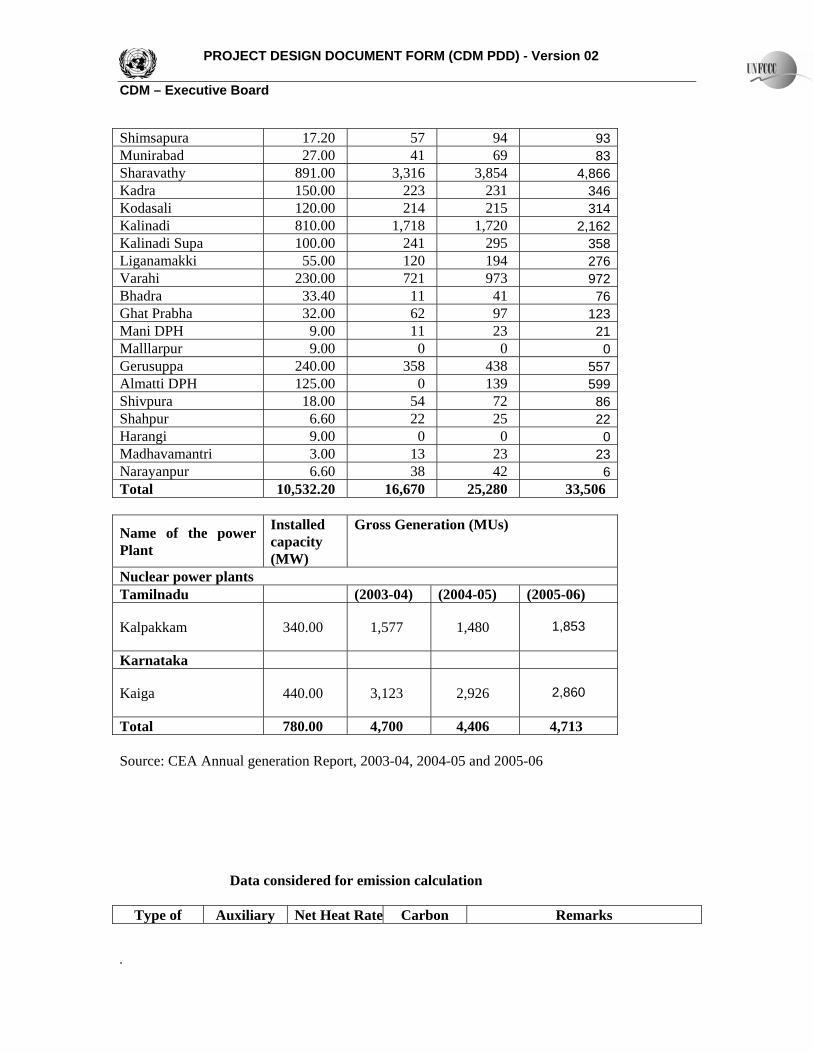
PROJECT DESIGN DOCUMENT FORM (CDM PDD) - Version 02 CDM – Executiv
.
e Board
Shimsapura 17.20 57 94 93 Munirabad 27.00 69 83 41 Sharavathy 891.00 3,316 3,854 4,866 Kadra 150.00 223 231 346 Kodasali 120.00 214 215 314 Kalinadi 810.00 1,718 1,720 2,162 Kalinadi Supa 100.00 241 295 358 Liganamakki 55.00 120 194 276 Varahi 230.00 721 973 972 Bhadra 33.40 11 41 76 Ghat Prabha 32.00 62 97 123 Mani DPH 9.00 11 23 21 Malllarpur 9.00 0 0 0 Gerusuppa 240.00 358 438 557 Almatti DPH 125.00 0 139 599 Shivpura 18.00 54 72 86 Shahpur 6.60 22 25 22 Harangi 9.00 0 0 0 Mad mantri 3.00 13 hava 23 23 Narayanpur 6.60 38 42 6 Total 10,532.20 16,670 25,280 33,506
Name of the power Plant
Installed capacity (MW)
Gross Generation (MUs)
Nuclear power plants Tamilnadu (2003-04) (2004-05) (2005-06)
Ka 340.00 1,577 1,480 lpakkam
1,853
Karnataka
Kaiga 440.00 3,123 2,926
2,860
Total 780.00 4,700 4,406 4,713 Source: CEA Annual generation Report, 2003-04, 2004-05 and 2005-06
Data considered for emission calculation
Type of Auxiliary Net Heat Rate Carbon Remarks
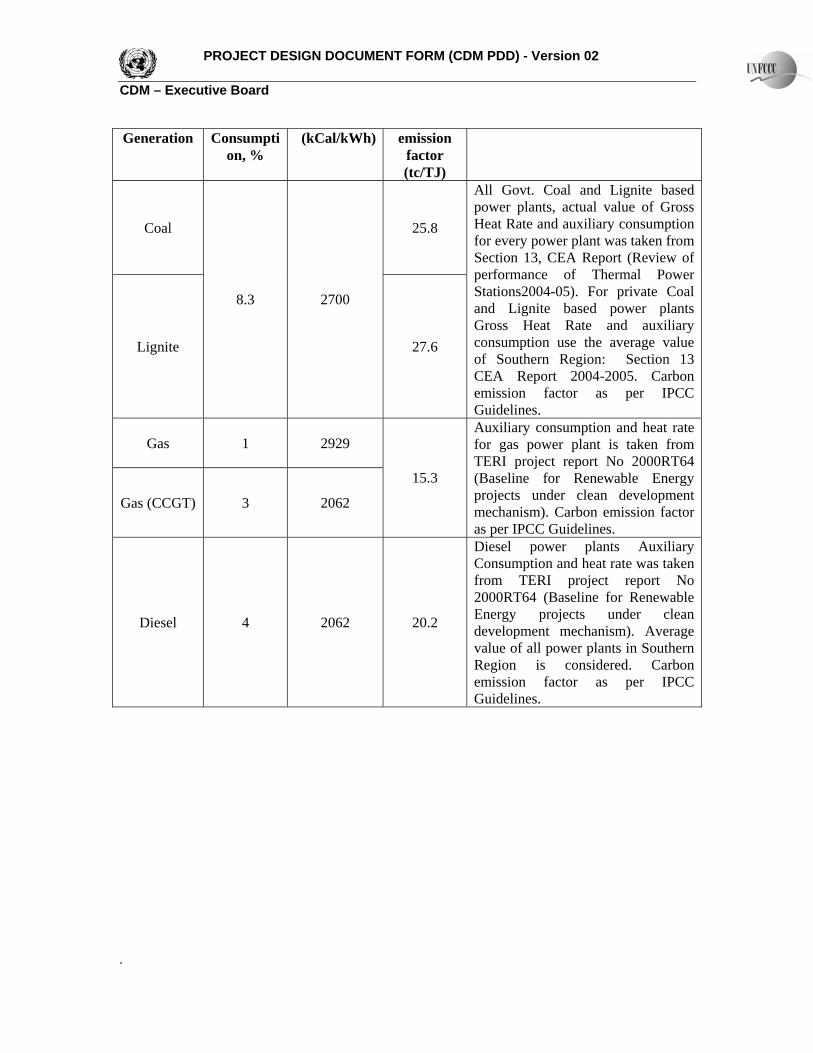
PROJECT DESIGN DOCUMENT FORM (CDM PDD) - Version 02 CDM – Executiv
.
e Board
Generation Consumption, %
kCal/kW emission ( h)factor (tc/TJ)
Coal 825.
Lignite
8.3
6
All Govt. Coal and Lignite based w la , al lu r
consumption for every power plant was taken from Section 13, CEA Report (Review of
n m Po
Gross Heat Rate and auxiliary va
h o tion CEA Report 2004-2005. Carbon emission factor as per IPCC
2700
27.
poHeat Rate and auxiliary
er p nts actu va e of G oss
performStations2004-05). For private Coal and Lignite based power plants
a ce of Ther al wer
consumof
ption use the average Sout
lue 13 ern Regi n: Sec
Guidelines.
Gas 1 2929
Gas (CCGT) 3
x y t a eat for gas power plant is taken from
(Baseline projects under clean development mechanism). Carbon emission factor as per IPCC Guidelines.
2062
15.3
Au iliar consump ion nd h rate
TERI project report No 2000RT64 for Renewable Energy
Diesel 4
ption and from TERI project report No 2000RT64 (Baseline for Renewable
echanism . Average a of all power plants in Southern
Region is considered. Carbon ission factor as IPid e
2062 20.2
Diesel power plants AuxiliaryConsum
heat rate was taken
Edevelopmv
nergy
lue
pent m
rojects under )
clean
emGu
per CC elin s.
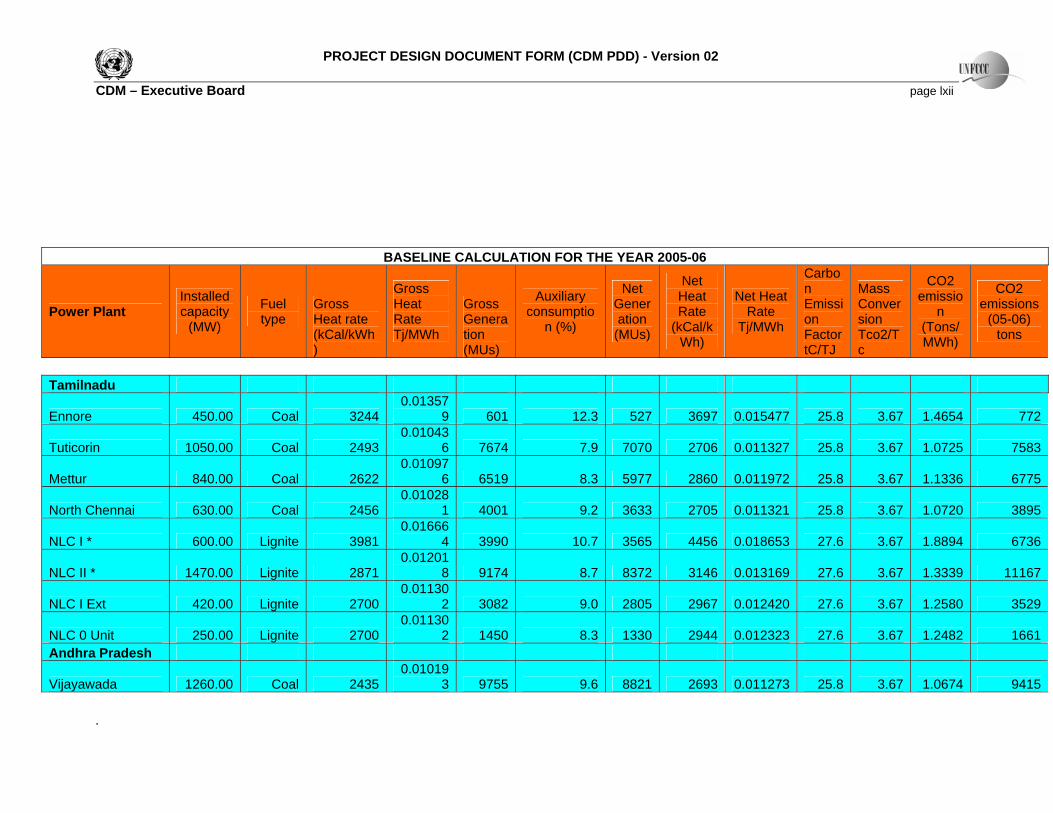
PROJECT DESIGN DOCUMENT FORM (CDM PDD) - Version 02 CDM – Executive Board page lxii
BASELINE CALCULATION FOR THE YEAR 2005-06
Power Plant Installed capacity
(MW)
Fuel type
Gross Heat rate (kCal/kWh)
Gross Heat Rate Tj/MWh
Gross Generation (MUs)
Auxiliary consumptio
n (%)
Net Generation
(MUs)
Net Heat Rate
(kCal/kWh)
Carbo
Net Heat Rate
Tj/MWh
n Emission Factor tC/TJ
Mass Conversion Tco2/Tc
CO2 emissio
n (Tons/MWh)
CO2 emissions
(05-06) tons
Tamilnadu
450.00 Coal 32440.01357
9Ennore 601 12.3 527 3697 0.015477 25.8 3.67 1.4654 772
1050.00 Coal 24930.01043
6 7674 7.9 7070 2706 0.011327 25.8 3.67 1.0725 75Tuticorin 83
Mettur 840.00 Coal 26220.01097
6 6519 8.3 5977 2860 0.011972 25.8 3.67 1.1336 6775
North Chennai 630.00 Coal 2450.01028
1 4001 9.2 3633 2705 0.011321 25.8 3.67 1.0720 386 95
NLC I * 600.00 Lignite 39810.01666
3990 10.7 3565 4456 0.018653 27.6 3.67 1.8894 64 736
NLC II * 1470.00 Li 28710.01201
8 9174 8.7 8372 3146 0.013169 27.6 3.67 1.3339 11167 gnite
NLC I Ext 420.00 Li 27000.01130
gnite 2 3082 9.0 2805 2967 0.012420 27.6 3.67 1.2580 3529
NLC 0 Unit 250.0 0 Lignite 2700.01130
2 1450 8.3 1330 2944 0.012323 27.6 3.67 1.2482 10 661 Andhra Pradesh
Vijayawada 1260.00 Coal 24350.01019
3 9755 9.6 8821 2693 0.011273 25.8 3.67 1.0674 9415 .
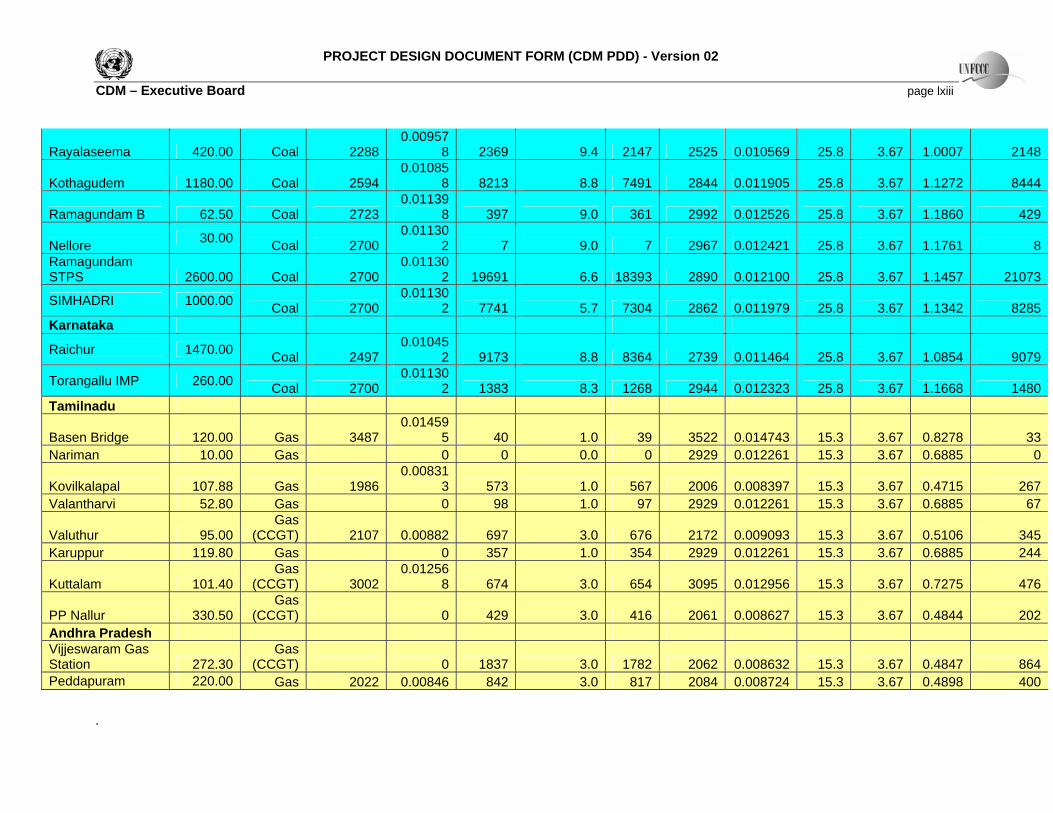
PROJECT DESIGN DOCUMENT FORM (CDM PDD) - Version 02 CDM – Executive Board page lxiii
Rayalaseema 420.00 22880.00957
8Coal 2369 9.4 2147 2525 0.010569 25.8 3.67 1.0007 2148
Kothagudem 1180.00 Coal 25940.01085
8 8213 8.8 7491 2844 0.011905 25.8 3.67 1.1272 8444
Ramagundam B 62.50 Coal 27230.01139
8 397 9.0 361 2992 0.012526 25.8 3.67 1.1860 429
Nellore 30.00 Coal 27000.01130
2 7 9.0 7 2967 0.012421 25.8 3.67 1.1761 8 Ramagundam STPS 2600.00 Coal 2700
0.011302 19691 6.6 18393 2890 0.012100 25.8 3.67 1.1457 21073
SIMHADRI 1000.00 Coal 2700.01130
2 774 5. 730 286 0.01197 25. 3.6 1.134 8280 1 7 4 2 9 8 7 2 5 Karnataka
Raichur 1470.00 Coal 24970.01045
2 9173 8.8 8364 2739 0.011464 25.8 3.67 1.0854 9079
Torangallu IMP 260.00 Coal 27000.01130
2 1383 8.3 1268 2944 0.012323 25.8 3.67 1.1668 1480 Tamilnadu
Basen Bridge 120.00 Gas 34870.01459
5 40 1.0 39 3522 0.014743 15.3 3.67 0.8278 33 Nariman 10.00 Gas 0 0 0.0 2929 0.012261 15.3 3.67 0.68850 0
Kovilkalapal 107.88 Gas 19860.00831
3 573 1.0 567 2006 0.008397 15.3 3.67 0.4715 267 Valantharvi 52.80 Gas 0 98 1.0 97 2929 0.012261 15.3 3.67 0.6885 67
Valuthur 95.00 Gas
(CCGT) 2107 0.00882 697 3.0 676 2172 0.009093 15.3 3.67 0.5106 345 Karuppur 119.80 Gas 0 357 1.0 354 2929 0.012261 15.3 3.67 0.6885 244
Kuttalam 101.40 Gas
(CCGT) 3000.01256
8 674 3.0 654 3095 0.012956 15.3 3.67 0.7275 472 6
PP Nallur 330.50 Gas
(CCGT) 0 42 3. 41 206 0.00862 15. 3.6 0.484 209 0 6 1 7 3 7 4 2 Andhra Pradesh Vijjeswaram Gas Station 272.30
Gas (CCGT) 0 1837 3.0 1782 2062 0.008632 15.3 3.67 0.4847 864
Peddapuram 220.00 Gas 2022 0.00846 842 3.0 817 2084 0.008724 15.3 3.67 0.4898 400
.
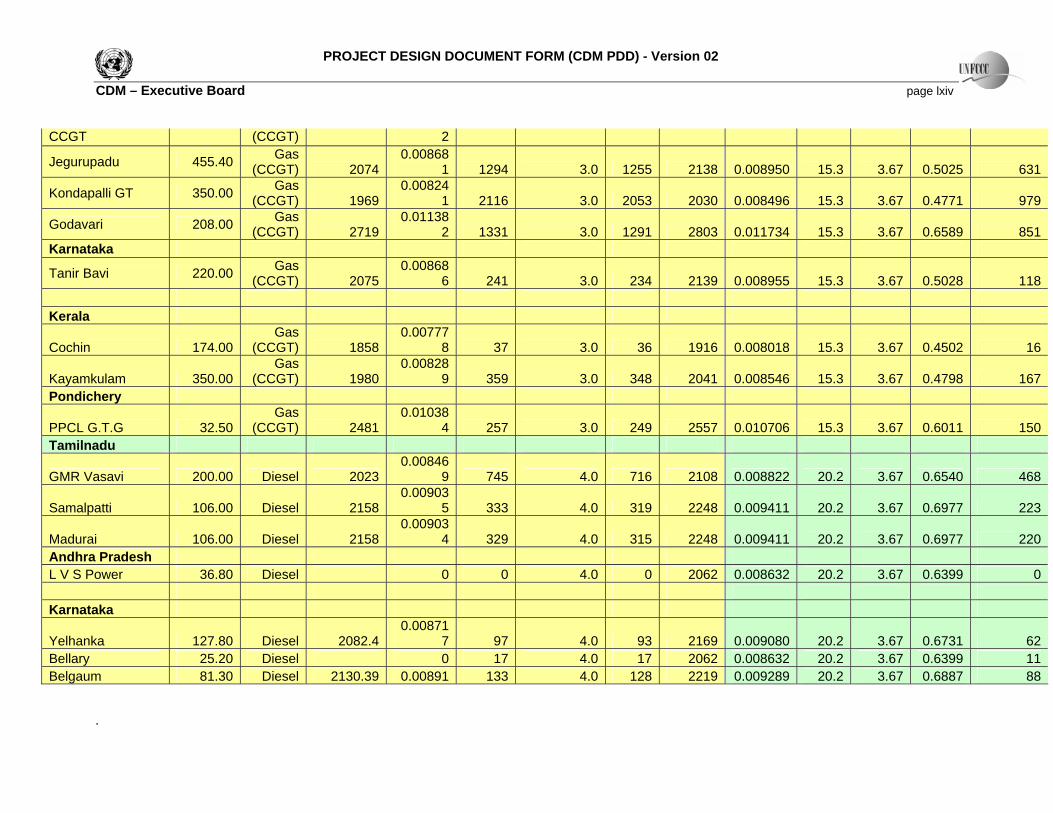
PROJECT DESIGN DOCUMENT FORM (CDM PDD) - Version 02 CDM – Executive Board page lxiv
CCGT (CCGT) 2
Jegurupadu 455.40 Gas (CCGT) 2074
0.008681 1294 3.0 1255 2138 0.008950 15.3 3.67 0.5025 631
Kondapalli GT 350.00 Gas (CCGT) 1969
0.008241 2116 3.0 2053 2030 0.008496 15.3 3.67 0.4771 979
Godavari 208.00 Gas (CCGT) 2719
0.011382 1331 3.0 1291 2803 0.011734 15.3 3.67 0.6589 851
Karnataka
Tanir Bavi 220.00 Gas 2075
0.008686 241 3.0 234 (CCGT) 2139 0.008955 15.3 3.67 0.5028 118
Kerala
Cochin 174.00 Gas
(CCGT) 18580.00777
8 37 3.0 36 1916 0.008018 15.3 3.67 0.4502 16
Kayamkulam 350.00 Gas
(CCGT) 19800.00828
9 359 3.0 348 2041 0.008546 15.3 3.67 0.4798 167 Pondichery
PPCL G.T.G 32.50 Gas
( 2480.01038
4 257 3.0 249 255 0.01070 15. 3.6 0.601 15CCGT) 1 7 6 3 7 1 0 Tamilnadu
GMR Vasavi 200.00 Diesel 2020.00846
9 745 4.0 716 210 0.00882 20. 3.6 0.654 463 8 2 2 7 0 8
Samalpatti 106.00 Diesel 21580.00903
5 333 4.0 319 2248 0.009411 20.2 3.67 0.6977 223
Madurai 106.00 2150.00903
4 329 4.0 315 224 0.00941 20. 3.6 0.697 22Diesel 8 8 1 2 7 7 0 Andhra Pradesh L V S Power 36.80 Diesel 0 0 4.0 0 206 0.00863 20. 3.6 0.6392 2 2 7 9 0 Karnataka
Yelhanka 127.80 2082.0.00871
7 97 4.0 93 216 0.00908 20. 3.6 0.673 6Diesel 4 9 0 2 7 1 2 Bellary 25.20 Diesel 0 17 4.0 17 2062 0.008632 20.2 3.67 0.6399 11 Belgaum 81.30 2130.3 0.00891 133 4.0 128 221 0.00928 20. 3.6 0.688 8Diesel 9 9 9 2 7 7 8
.
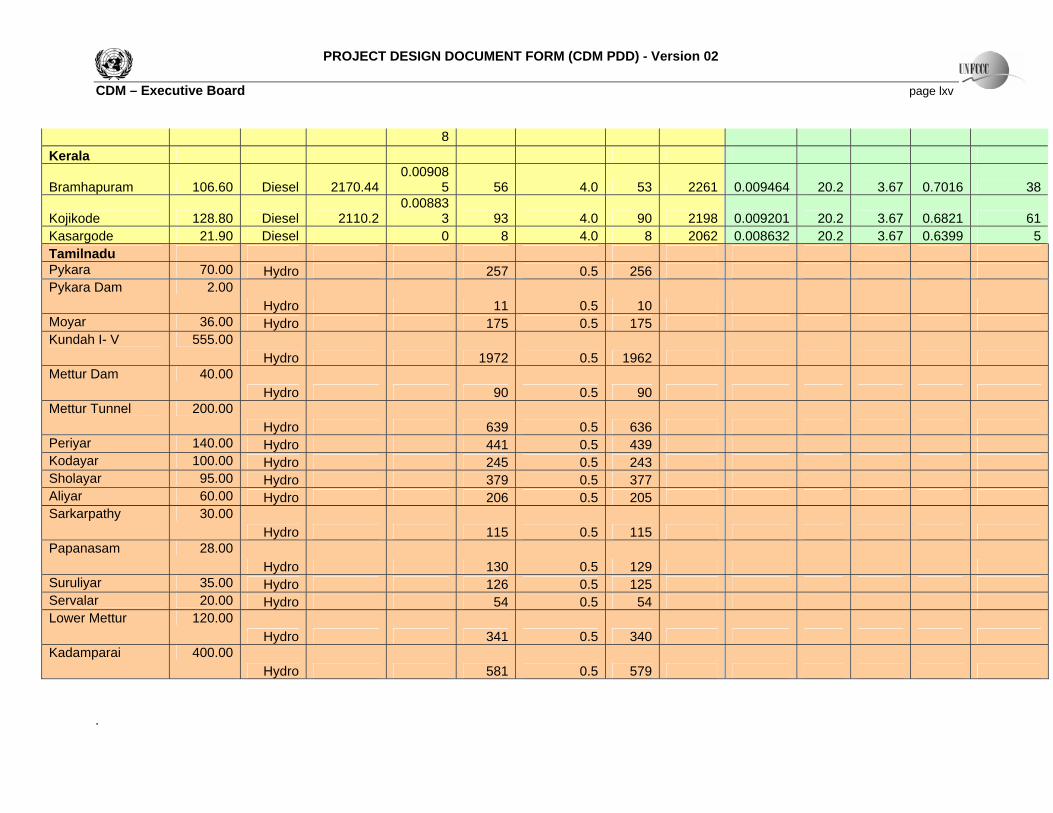
PROJECT DESIGN DOCUMENT FORM (CDM PDD) - Version 02 CDM – Executive Board page lxv
8Kerala
Bramhapuram 10 6.60 Diesel 2170.40.00908
5 56 4.0 53 226 0.00946 20. 3.6 0.701 34 1 4 2 7 6 8
Kojikode 128.80 Diesel 2110.20.00883
3 93 4.0 90 2198 0.009201 20.2 3.67 0.6821 61 Kasargode 21.90 Diesel 0 8 4.0 8 2062 0.008632 20.2 3.67 0.6399 5 Tamilnadu Pykara 70.00 Hydro 257 0.5 256 Pykara Dam 2.00
Hydro 11 0.5 10 Moyar 36.00 Hydro 175 0.5 175 Kundah I- V 555.00
Hydro 1972 0.5 1962 Mettur Dam 40.00
Hydro 90 0.5 90 Mettur Tunnel 200.00
Hydro 639 0.5 636 Periyar 140.00 Hydro 441 0.5 439 Kodayar 100.00 Hydro 245 0.5 243 Sholayar 95.00 Hydro 379 0.5 377 Aliyar 60.00 Hydro 206 0.5 205 Sarkarpathy 30.00
Hydro 115 0.5 115 Papanasam 28.00
Hydro 130 0.5 129 Suruliyar 35.00 Hydro 12 0. 126 5 5 Servalar 20.00 Hydro 54 0.5 54 Lower Mettur 120.00
Hydro 341 0.5 340 Kadamparai 400.00
Hydro 581 0.5 579
.
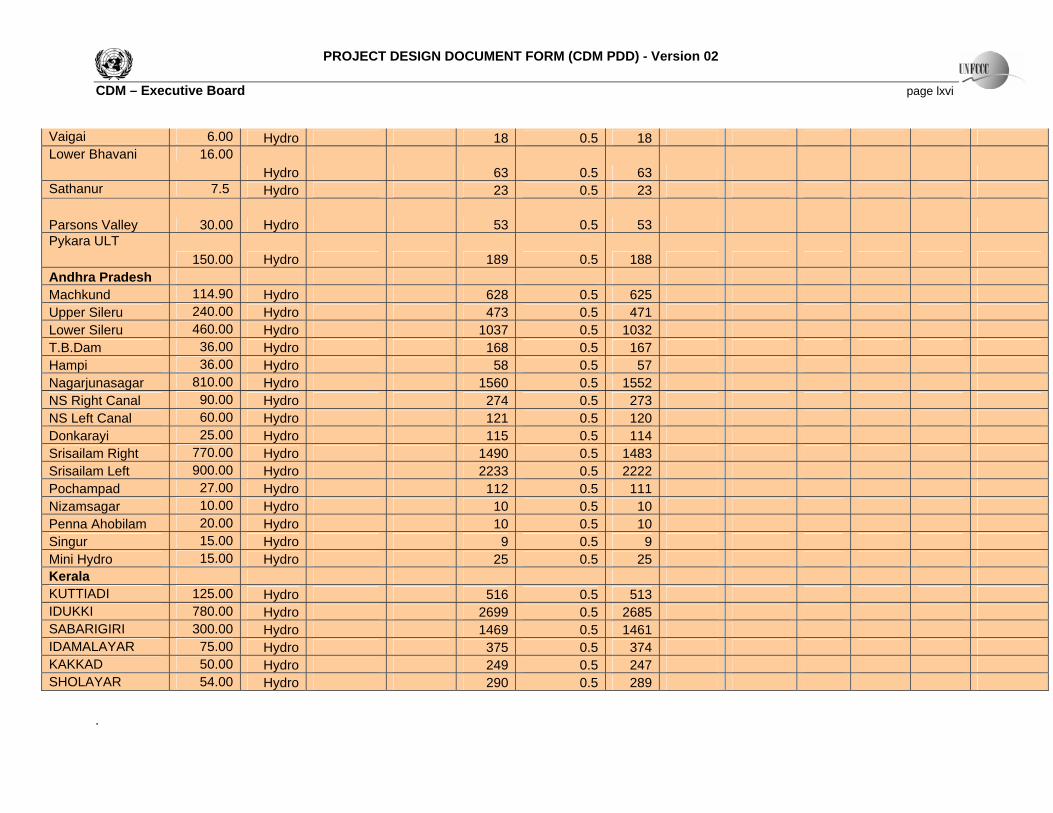
PROJECT DESIGN DOCUMENT FORM (CDM PDD) - Version 02 CDM – Executive Board page lxvi
Vaigai 6.00 Hydro 18 0.5 18 Lower Bhavani 16.00
Hydro 63 0.5 63 Sathanur 7.5 Hydro 23 0.5 23
Parsons Valley 30.00 Hydro 53 0.5 53 Pykara ULT
150.00 Hydro 189 0.5 188 Andhra Pradesh Machkund 114.90 Hydro 628 0.5 625 Upper Sileru 240.00 Hydro 473 0.5 471 Lower Sileru 460.00 Hydro 1037 0.5 1032 T.B.Dam 36.00 Hydro 168 0.5 167 Hampi 36.00 Hydro 58 0.5 57 Nagarjunasagar 810.00 Hydro 1560 0.5 1552 NS Right Canal 90.00 Hydro 274 0.5 273 NS Left Canal 60.00 Hydro 121 0.5 120 Donkarayi 25.00 Hydro 11 0. 115 5 4 Srisailam Right 770.00 Hydro 1490 0.5 1483 Srisailam Left 900.00 Hydro 2233 0.5 2222 Pochampad 27.00 Hydro 112 0.5 111 Nizamsagar 10.00 Hydro 10 10 0.5 Penna Ahobilam 20.00 Hydro 10 0.5 10
15.00 Hydro 9 9 Singur 0.5 Mini Hydro 15.00 Hydro 25 0.5 25
Kerala KUTTIADI 125.00 Hydro 516 0.5 513
780.00 Hydro 2 2685 IDUKKI 699 0.5 SABARIGIRI 300.00 Hydro 1469 0.5 1461 IDAMALAYAR 75.00 Hydro 3 374 75 0.5 KAKKAD 50.00 Hydro 249 0.5 247 SHOLAYAR 54.00 Hydro 2 289 90 0.5
.
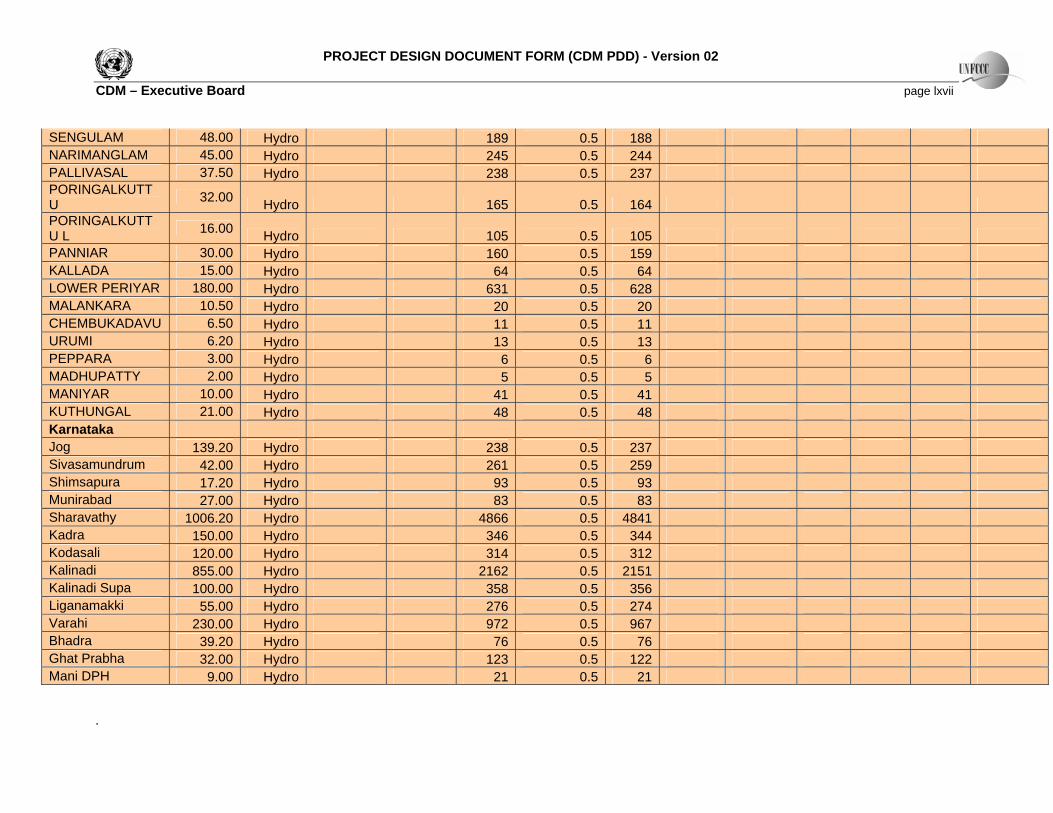
PROJECT DESIGN DOCUMENT FORM (CDM PDD) - Version 02
e Board page lxvii
SENGULAM 48.00 Hydro 189 0.5 188 NARIMANGLAM 45.00 Hydro 245 0.5 244 PALLIVASAL 37.50 Hydro 238 0.5 237 PORINGALKUTTU 32.00 Hydro 165 0.5 164 PORINGALKUTTU L 16.00 Hydro 105 0.5 105 PANNIAR 30.00 Hydro 160 0.5 159 KALLADA 15.00 Hydro 64 0.5 64 LOWER PERIYAR 180.00 Hydro 631 0.5 628 MALANKARA 10.50 Hydro 20 0.5 20 CHEMBUKADAVU 6.50 Hydro 11 0.5 11 URUMI 6.20 Hydro 13 0.5 13 PEPPARA 3.00 Hydro 6 0.5 6 MADHUPATTY 2.00 Hydro 5 0.5 5 MANIYAR 10.00 Hydro 41 0.5 41 KUTHUNGAL 21.00 Hydro 48 0.5 48 Karnataka Jog 139.20 Hydro 238 0.5 237 Sivasamundrum 42.00 Hydro 261 0.5 259 Shimsapura 17.20 Hydro 93 0.5 93 Munirabad 27.00 Hydro 83 0.5 83 Sharavathy 1006.20 Hydro 4866 0.5 4841 Kadra 150.00 Hydro 346 0.5 344 Kodasali 120.00 Hydro 314 0.5 312 Kalinadi 855.00 Hydro 2162 0.5 2151 Kalinadi Supa 100.00 Hydro 358 0.5 356 Liganamakki 55.00 Hydro 276 0.5 274
CDM – Executiv
.
Varahi 230.00 Hydro 972 0.5 967 Bhadra 39.20 Hydro 76 0.5 76 Ghat Prabha 32.00 Hydro 123 0.5 122 Mani DPH 9.00 Hydro 21 0.5 21
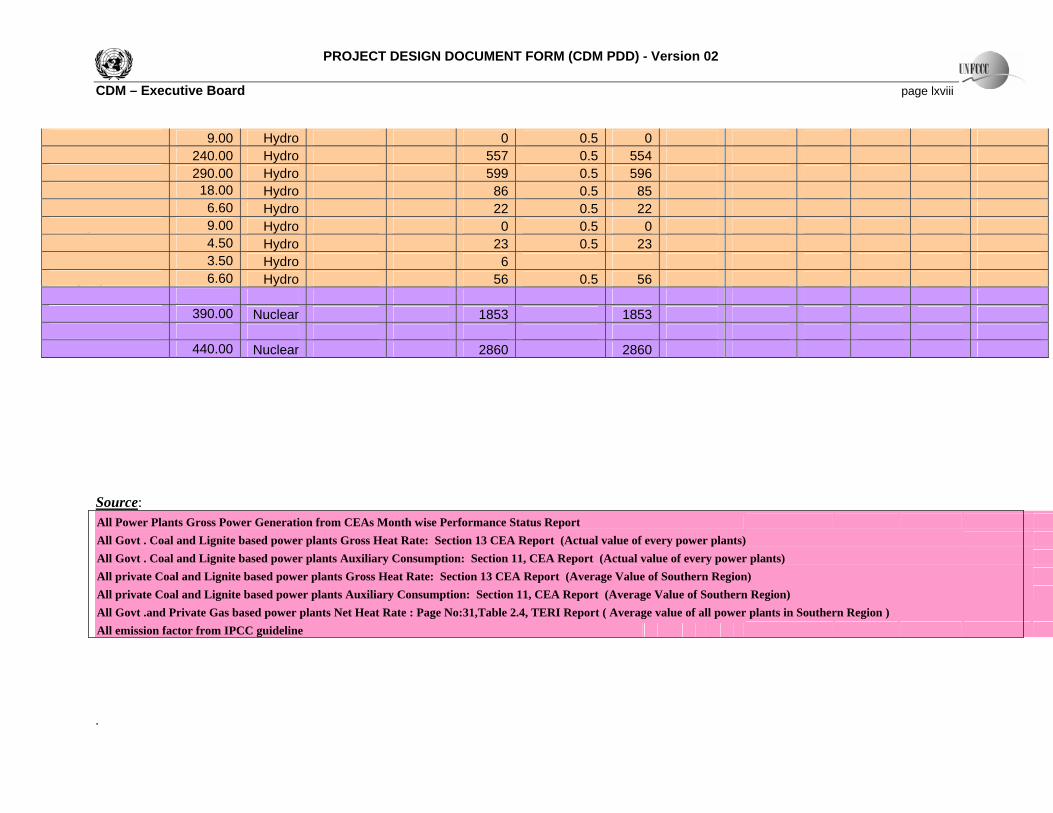
PROJECT DESIGN DOCUMENT FORM (CDM PDD) - Version 02
CDM – Executiv
.
Malllarpur Gerusuppa Almatti DPH Shivpura Shahpur Harangi Madhavamantri Mandagere Narayanpur Tamilnadu Kalpakkam Karnataka Kaiga
e Board page lxviii
9.00 Hydro 0 0.5 0 240.00 Hydro 557 0.5 554 290.00 Hydro 599 0.5 596
18.00 Hydro 86 0.5 85 6.60 Hydro 22 0.5 22 9.00 Hydro 0 0.5 0 4.50 Hydro 23 0.5 23 3.50 Hydro 6 6.60 Hydro 56 0.5 56
390.00 Nuclear 1853 1853
440.00 Nuclear 2860 2860
Source: All Power Plants Gross Power Generation from CEAs Month wise Performance Status Report All Govt . Coal and Lignite based power plants Gross Heat Rate: Section 13 CEA Report (Actual value of every power plants) All Govt . Coal and Lignite based power plants Auxiliary Consumption: Section 11, CEA Report (Actual value of every power plants) All private Coal and Lignite based power plants Gross Heat Rate: Section 13 CEA Report (Average Value of Southern Region) All private Coal and Lignite based power plants Auxiliary Consumption: Section 11, CEA Report (Average Value of Southern Region) All Govt .and Private Gas based power plants Net Heat Rate : Page No:31,Table 2.4, TERI Report ( Average value of all power plants in Southern Region ) All emission factor from IPCC guideline
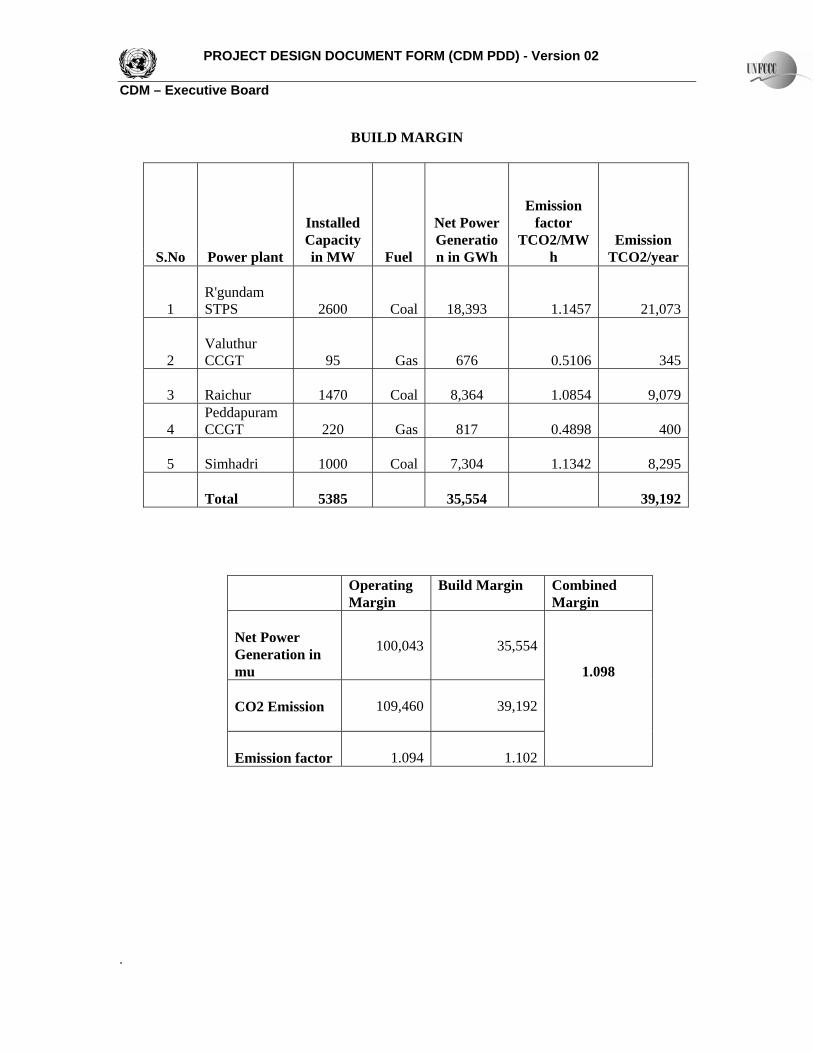
PROJECT DESIGN DOCUMENT FORM (CDM PDD) - Version 02 CDM – Executive Board
.
BUILD MARGIN
S.No Power plant
Installed Capacity in MW Fuel
Net Power Generation in GWh
Emission factor
TCO2/MWh
Emission TCO2/year
1
R'gundam STPS 2600 Coal 18,393 1.1457 21,073
2
Valuthur CCGT 95 Gas 676 0.5106 345
3 Raichur 1470 Coal 8,364 1.0854 9,079
4 Peddapuram CCGT 220 Gas 817 0.4898 400
5 Simhadri 1000 Coal 7,304 1.1342 8,295
Total 5385 35,554 39,192
Operating Margin
Build Margin Combined Margin
Net Power Generation in mu
100,043 35,554
CO2 Emission 109,460
39,192
Emission factor
1.094
1.102
1.098
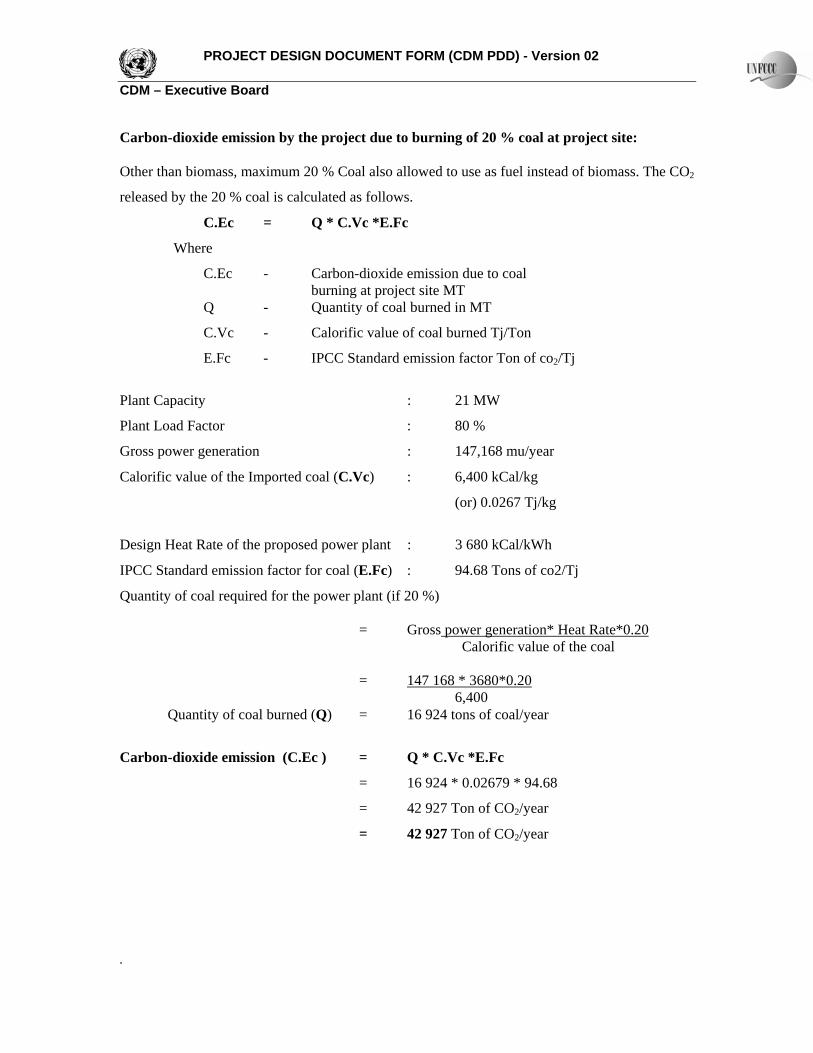
PROJECT DESIGN DOCUMENT FORM (CDM PDD) - Version 02 CDM – Executive Board
.
Carbon-dioxide emission by the project due to burning of 20 % coal at project site: Other than biomass, maximum 20 % Coal also allowed to use as fuel instead of biomass. The CO2
released by the 20 % coal is calculated as follows.
C.Ec = Q * C.Vc *E.Fc
Where
C.Ec - Carbon-dioxide emission due to coal burning at project site MT
Q - Quantity of coal burned in MT
C.Vc - Calorific value of coal burned Tj/Ton
E.Fc - IPCC Standard emission factor Ton of co2/Tj
Plant Capacity : 21 MW
Plant Load Factor : 80 %
Gross power generation : 147,168 mu/year
Calorific value of the Imported coal (C.Vc) : 6,400 kCal/kg
(or) 0.0267 Tj/kg
Design Heat Rate of the proposed power plant : 3 680 kCal/kWh
IPCC Standard emission factor for coal (E.Fc) : 94.68 Tons of co2/Tj
Quantity of coal required for the power plant (if 20 %) = Gross power generation* Heat Rate*0.20 Calorific value of the coal = 147 168 * 3680*0.20 6,400 Quantity of coal burned (Q) = 16 924 tons of coal/year
Carbon-dioxide emission (C.Ec ) = Q * C.Vc *E.Fc
= 16 924 * 0.02679 * 94.68
= 42 927 Ton of CO2/year
= 42 927 Ton of CO2/year
PROJECT DESIGN DOCUMENT FORM (CDM PDD) - Version 02 CDM – Executive Board
.
Annex 4
MONITORING PLAN
Please refer to section D of this PDD.
Annex 5
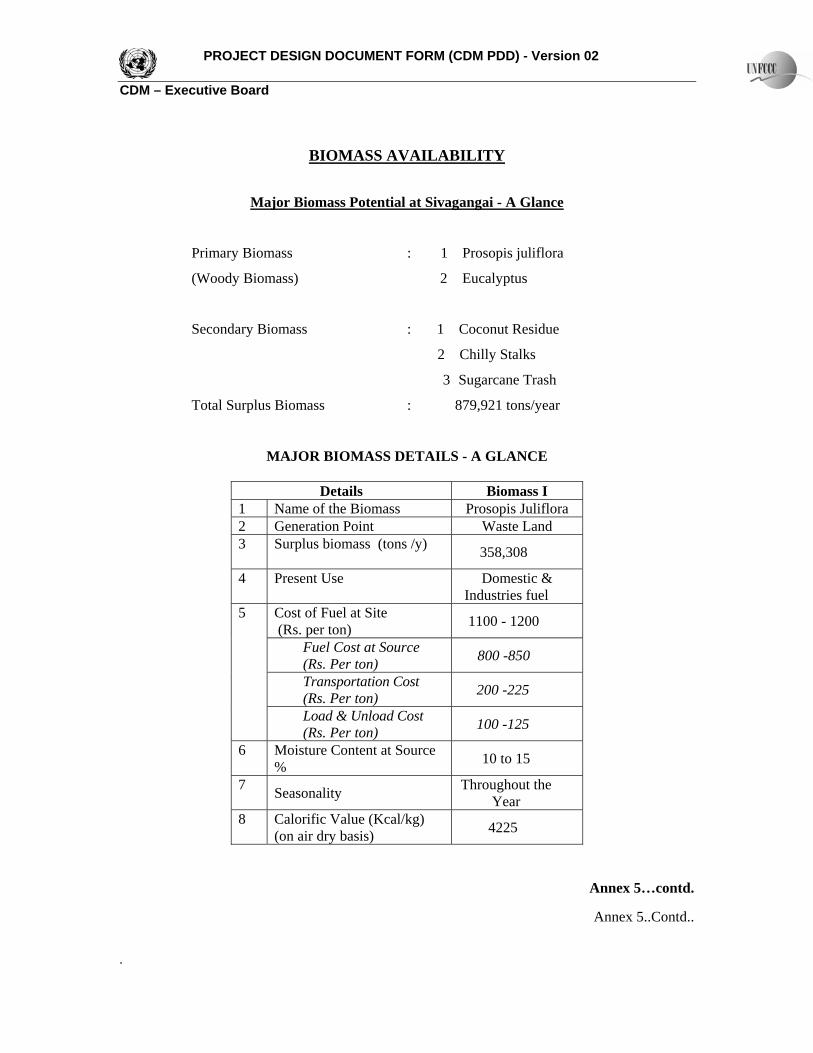
PROJECT DESIGN DOCUMENT FORM (CDM PDD) - Version 02 CDM – Executive Board
.
BIOMASS AVAILABILITY
Major Biomass Potential at Sivagangai - A Glance
Primary Biomass : 1 Prosopis juliflora
(Woody Biomass) 2 Eucalyptus
Secondary Biomass : 1 Coconut Residue
2 Chilly Stalks
3 Sugarcane Trash
Total Surplus Biomass : 879,921 tons/year
MAJOR BIOMASS DETAILS - A GLANCE
Details Biomass I 1 Name of the Biomass Prosopis Juliflora 2 Generation Point Waste Land 3 Surplus biomass (tons /y)
358,308
4 Present Use Domestic & Industries fuel
Cost of Fuel at Site (Rs. per ton) 1100 - 1200
Fuel Cost at Source (Rs. Per ton) 800 -850
Transportation Cost (Rs. Per ton) 200 -225
5
Load & Unload Cost (Rs. Per ton) 100 -125
6 Moisture Content at Source % 10 to 15
7 Seasonality Throughout the Year
8 Calorific Value (Kcal/kg) (on air dry basis) 4225
Annex 5…contd.
Annex 5..Contd..
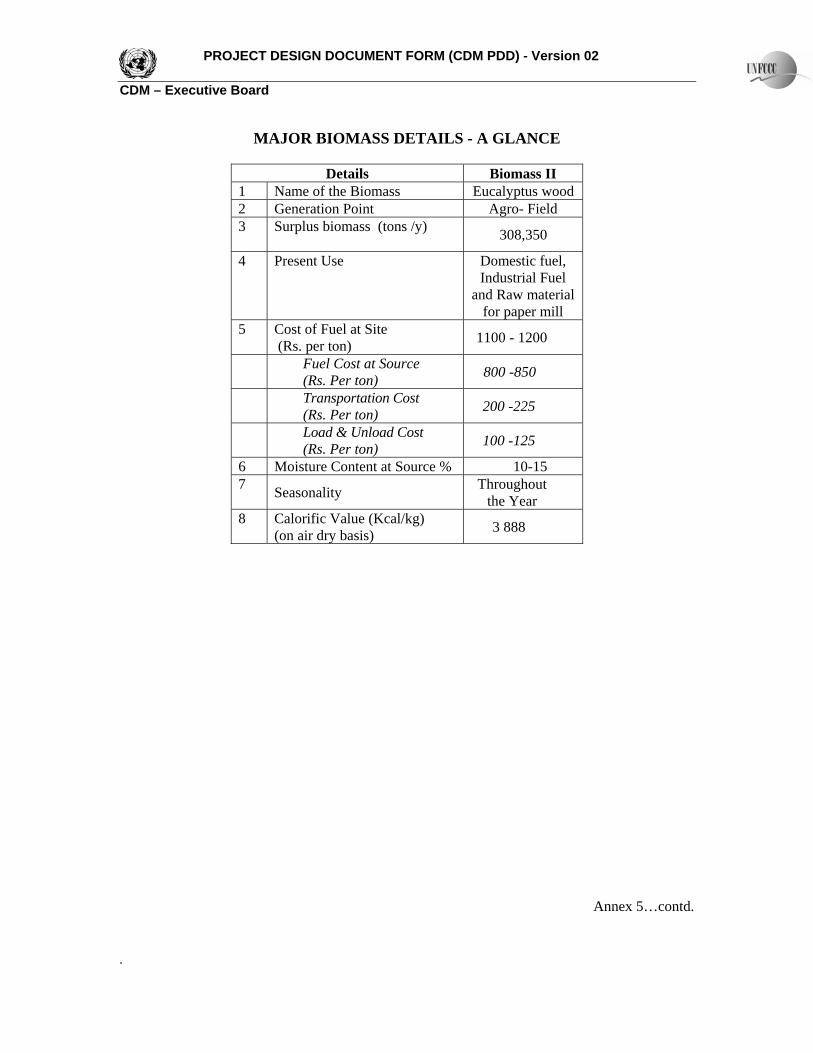
PROJECT DESIGN DOCUMENT FORM (CDM PDD) - Version 02 CDM – Executive Board
.
MAJOR BIOMASS DETAILS - A GLANCE
Details Biomass II 1 Name of the Biomass Eucalyptus wood 2 Generation Point Agro- Field 3 Surplus biomass (tons /y)
308,350
4 Present Use Domestic fuel, Industrial Fuel
and Raw material for paper mill
5 Cost of Fuel at Site (Rs. per ton) 1100 - 1200
Fuel Cost at Source (Rs. Per ton) 800 -850
Transportation Cost (Rs. Per ton) 200 -225
Load & Unload Cost (Rs. Per ton) 100 -125
6 Moisture Content at Source % 10-15 7 Seasonality Throughout
the Year 8 Calorific Value (Kcal/kg)
(on air dry basis) 3 888
Annex 5…contd.
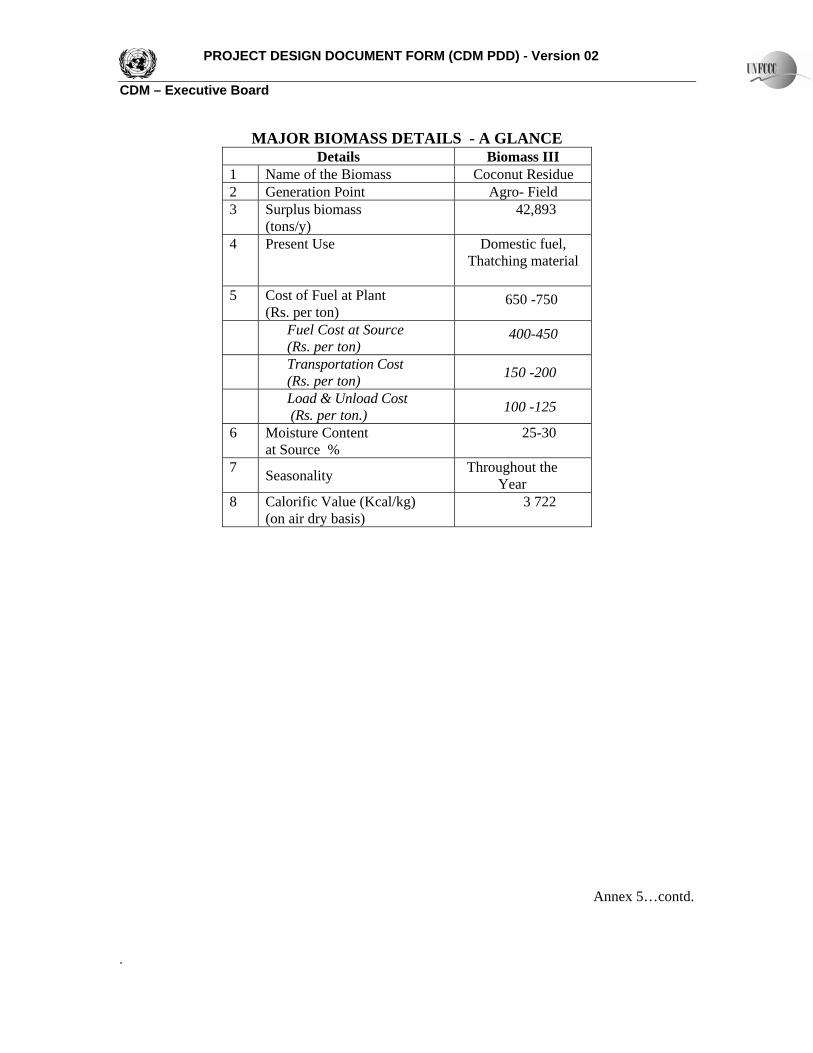
PROJECT DESIGN DOCUMENT FORM (CDM PDD) - Version 02 CDM – Executive Board
.
MAJOR BIOMASS DETAILS - A GLANCE Details Biomass III
1 Name of the Biomass Coconut Residue 2 Generation Point Agro- Field 3 Surplus biomass
(tons/y) 42,893
4 Present Use Domestic fuel, Thatching material
5 Cost of Fuel at Plant
(Rs. per ton) 650 -750
Fuel Cost at Source (Rs. per ton)
400-450
Transportation Cost (Rs. per ton) 150 -200
Load & Unload Cost (Rs. per ton.) 100 -125
6 Moisture Content at Source %
25-30
7 Seasonality Throughout the Year
8 Calorific Value (Kcal/kg) (on air dry basis)
3 722
Annex 5…contd.
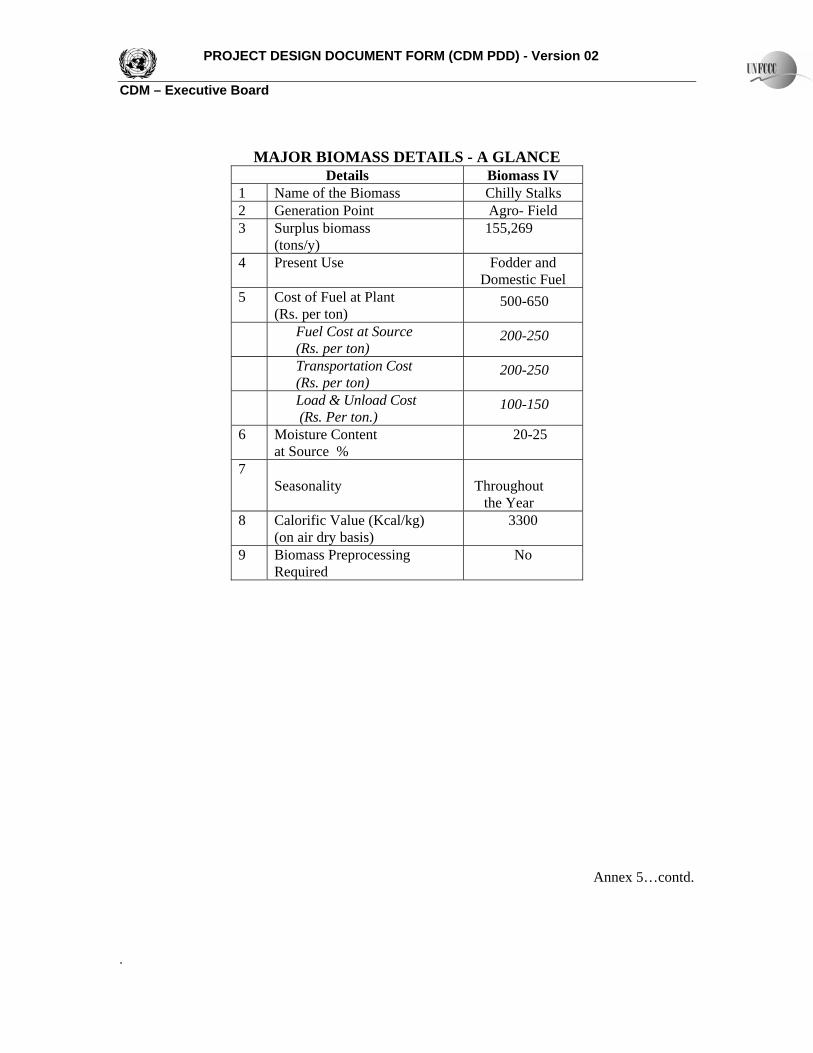
PROJECT DESIGN DOCUMENT FORM (CDM PDD) - Version 02 CDM – Executive Board
.
MAJOR BIOMASS DETAILS - A GLANCE
Details Biomass IV 1 Name of the Biomass Chilly Stalks 2 Generation Point Agro- Field 3 Surplus biomass
(tons/y) 155,269
4 Present Use Fodder and Domestic Fuel
5 Cost of Fuel at Plant (Rs. per ton)
500-650
Fuel Cost at Source (Rs. per ton)
200-250
Transportation Cost (Rs. per ton)
200-250
Load & Unload Cost (Rs. Per ton.)
100-150
6 Moisture Content at Source %
20-25
7 Seasonality
Throughout
the Year 8 Calorific Value (Kcal/kg)
(on air dry basis) 3300
9 Biomass Preprocessing Required
No
Annex 5…contd.
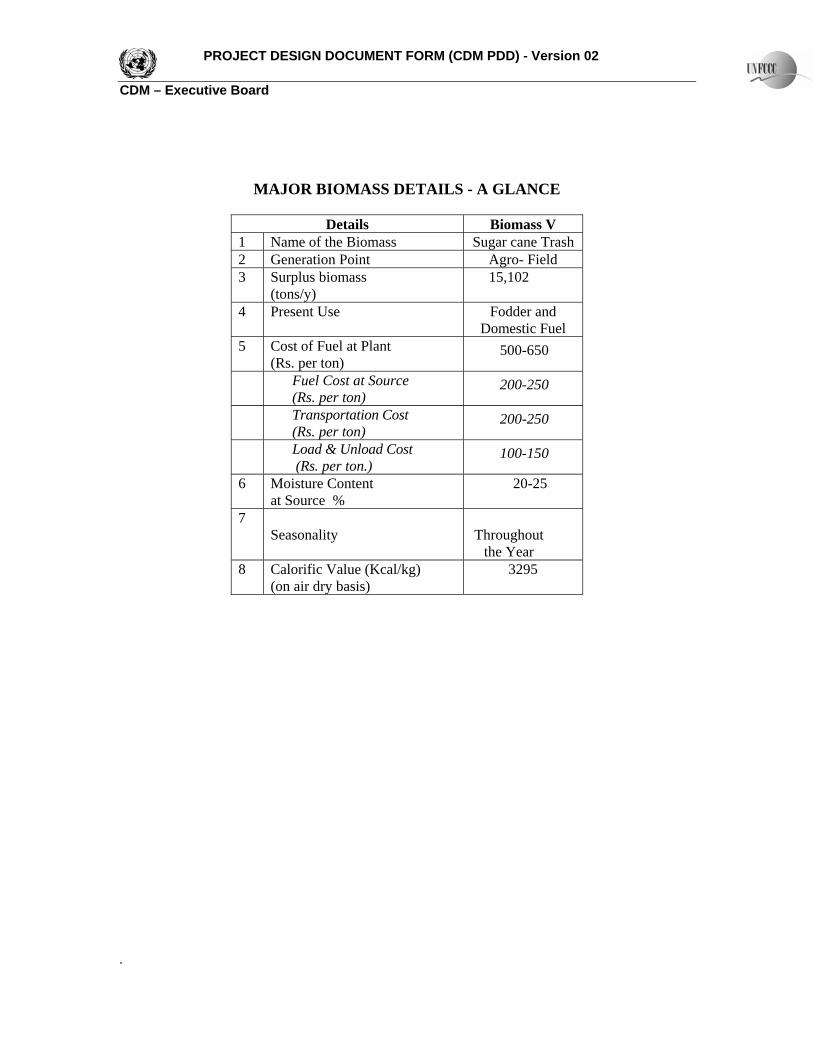
PROJECT DESIGN DOCUMENT FORM (CDM PDD) - Version 02 CDM – Executive Board
.
MAJOR BIOMASS DETAILS - A GLANCE
Details Biomass V 1 Name of the Biomass Sugar cane Trash 2 Generation Point Agro- Field 3 Surplus biomass
(tons/y) 15,102
4 Present Use Fodder and Domestic Fuel
5 Cost of Fuel at Plant (Rs. per ton)
500-650
Fuel Cost at Source (Rs. per ton)
200-250
Transportation Cost (Rs. per ton)
200-250
Load & Unload Cost (Rs. per ton.)
100-150
6 Moisture Content at Source %
20-25
7 Seasonality
Throughout
the Year 8 Calorific Value (Kcal/kg)
(on air dry basis) 3295
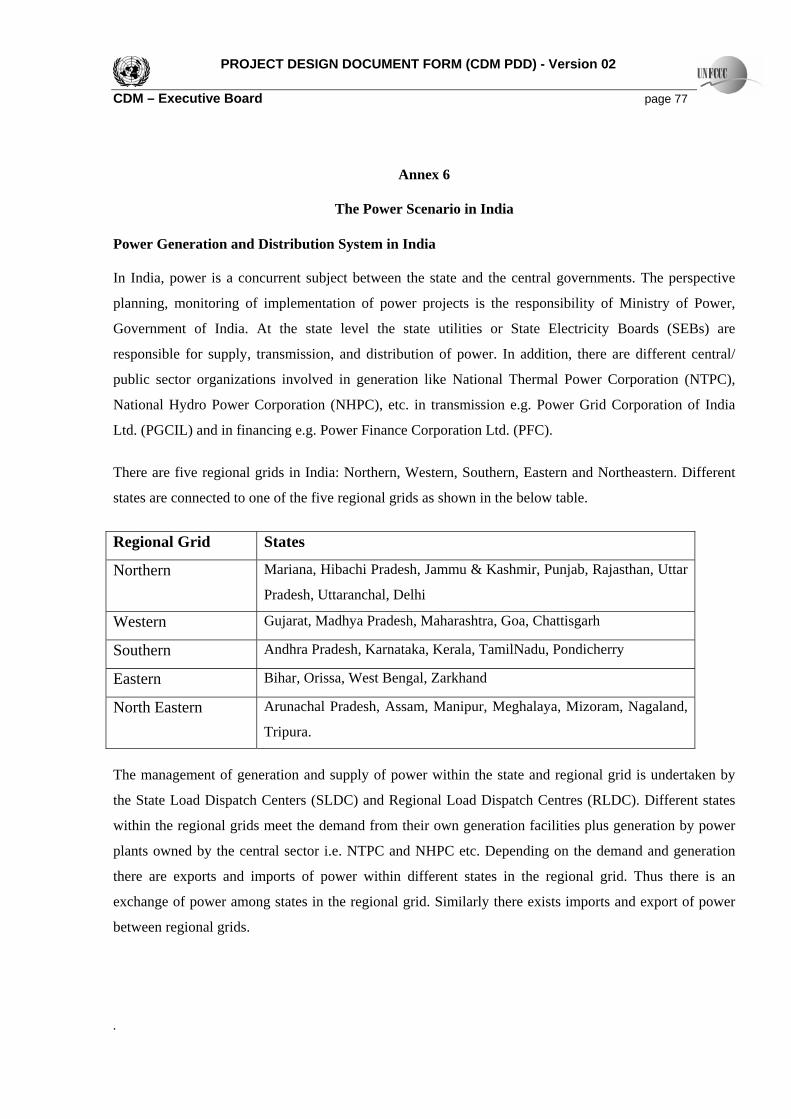
PROJECT DESIGN DOCUMENT FORM (CDM PDD) - Version 02 CDM – Executive Board page 77
.
Annex 6
The Power Scenario in India
Power Generation and Distribution System in India In India, power is a concurrent subject between the state and the central governments. The perspective
planning, monitoring of implementation of power projects is the responsibility of Ministry of Power,
Government of India. At the state level the state utilities or State Electricity Boards (SEBs) are
responsible for supply, transmission, and distribution of power. In addition, there are different central/
public sector organizations involved in generation like National Thermal Power Corporation (NTPC),
National Hydro Power Corporation (NHPC), etc. in transmission e.g. Power Grid Corporation of India
Ltd. (PGCIL) and in financing e.g. Power Finance Corporation Ltd. (PFC).
There are five regional grids in India: Northern, Western, Southern, Eastern and Northeastern. Different
states are connected to one of the five regional grids as shown in the below table.
Regional Grid States
Northern Mariana, Hibachi Pradesh, Jammu & Kashmir, Punjab, Rajasthan, Uttar
Pradesh, Uttaranchal, Delhi
Western Gujarat, Madhya Pradesh, Maharashtra, Goa, Chattisgarh
Southern Andhra Pradesh, Karnataka, Kerala, TamilNadu, Pondicherry
Eastern Bihar, Orissa, West Bengal, Zarkhand
North Eastern Arunachal Pradesh, Assam, Manipur, Meghalaya, Mizoram, Nagaland,
Tripura.
The management of generation and supply of power within the state and regional grid is undertaken by
the State Load Dispatch Centers (SLDC) and Regional Load Dispatch Centres (RLDC). Different states
within the regional grids meet the demand from their own generation facilities plus generation by power
plants owned by the central sector i.e. NTPC and NHPC etc. Depending on the demand and generation
there are exports and imports of power within different states in the regional grid. Thus there is an
exchange of power among states in the regional grid. Similarly there exists imports and export of power
between regional grids.
PROJECT DESIGN DOCUMENT FORM (CDM PDD) - Version 02 CDM – Executive Board page 78
.
Power Generation and Distribution System in Southern Region The project is located in the state of Tamilnadu and connected to the Southern Grid. The southern grid is
common to the four southern states viz. Tamilnadu, Karnataka, Andhra Pradesh and Kerala and one
Union territory, Pondicherry. There is also a common load dispatch centre, namely the “Southern Region
Load Dispatch Centre’ (SRLDC). The four states covered by the southern grid – Andhra Pradesh,
Karnataka, Kerala, Tamilnadu and Pondicherry, have different generation mix.
Promotion of Renewable Energy India’s search for alternative fuels that would ensure sustainable development on the one hand and energy
security on the other began in 1970 itself. Consequently, new and renewable sources of energy have
emerged as an option. Thus India has established policy to tap the potential for renewable energy sources
such as solar, wind, biomass, and small hydro, irrespective of capacity. The Indian scientific
establishment has been working on the development of various renewable energy systems. In 1981, the
Government of India established a Commission for Additional Sources of Energy (CASE) in the
Department of Science and Technology, on the lines of the Space and Atomic Energy Commissions. The
mandate of CASE is to promote R & D activities in the field of renewable energy. CASE was
incorporated in 1982, in the newly created Department of Non-conventional Energy Sources (DNES). In
1992 DNES became the Ministry for Non-conventional Energy Sources.
Renewable Energy Technologies (RETs) hold a lot of promise for India for meeting the burgeoning
electricity requirement and providing energy in rural areas. At present 46 percent of the total energy
consumption is met from various biomass resources i.e. agricultural residues, animal dung, forest wastes,
firewood, etc. India produces a huge quantity of agricultural residues, which can be converted into
energy. The share of renewable in the total power generation capacity of the country have started bearing
fruit.
After persistent pursuance of MNES with the state governments/utilities for implementing a uniform
Renewable Energy power purchase policy since 1992-93, so far 15 of 26 states have announced policies
for grid-connected Renewable energy power projects; still these policies are in varying degrees as
compared to those recommended by MNES.
Though the Electricity Act 2003 contains several provisions to promote accelerated development of
power generation from Renewable energy, the timely intervention and the extent of implementation of
such provisions it yet to be witnessed.
PROJECT DESIGN DOCUMENT FORM (CDM PDD) - Version 02 CDM – Executive Board page 79
.
There has been a shift in policy away from investment- based to performance based fiscal and financial
incentives and even phasing out of subsidies in few sectors.
What the sector requires now is a synergy between central and state policies towards attracting private
investment in Renewable energy sector, enhanced access to financing and acceleration of indigenous
R&D activities.
In case of renewable energy, there is a strong need for:
Preparation of “private investment plan” for the (high) potential renewable energy sectors based on the consolidation of updated RERA data by the state governments
Accelerate indigenous research and development in developing state-of-art technologies utilizing
renewable energy resources and showcase such technologies through demonstration projects.
Provide easy access to financing renewable energy projects.
Sensitisation of State Electricity Regulatory Commissions (SERCs) in enhancing use of renewable energy based power using Electricity Act 2003 as a promoting tool.
Involve Corporate Sector in propagating renewable energy by implementing few renewable
energy projects both at urban and at rural levels. Promotion of Biomass Energy The promotion of biomass based power generation in the country is being encouraged through conductive policies at the Central and the State levels. A number of policy initiatives have been introduced for encouragement to commercial exploitation of biomass power potential since 1993. Incentives include sales tax and excise duty exemption, reduced customs duty, accelerated depreciation, etc. Electricity Regulatory Commissions set up in the States of Tamilnadu, Andhra Pradesh, Karnataka & Maharashtra have also noted the relevance of these technologies and hence announced policies for purchase/wheeling/banking of power generated from biomass power/co-generation projects.
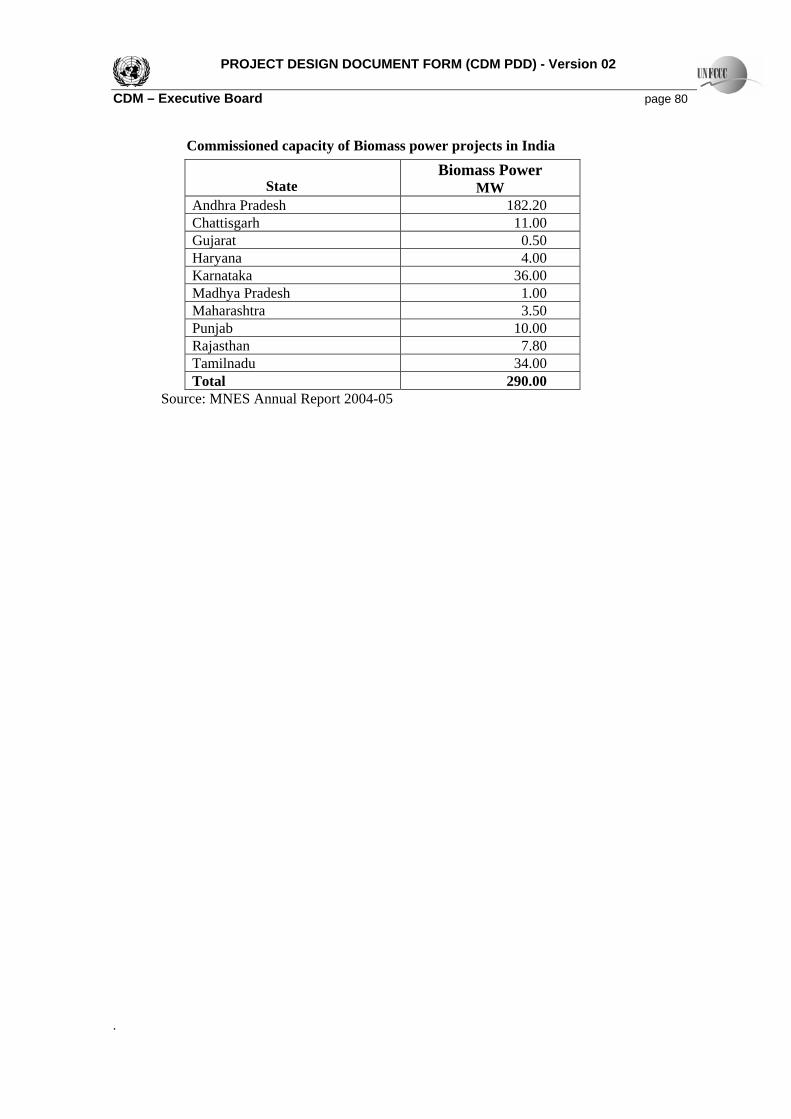
PROJECT DESIGN DOCUMENT FORM (CDM PDD) - Version 02 CDM – Executive Board page 80
.
Commissioned capacity of Biomass power projects in India State
Biomass Power MW
Andhra Pradesh 182.20 Chattisgarh 11.00 Gujarat 0.50 Haryana 4.00 Karnataka 36.00 Madhya Pradesh 1.00 Maharashtra 3.50 Punjab 10.00 Rajasthan 7.80 Tamilnadu 34.00 Total 290.00
Source: MNES Annual Report 2004-05
PROJECT DESIGN DOCUMENT FORM (CDM PDD) - Version 02 CDM – Executive Board page 81
.
REFERENCES
1 Kyoto Protocol to the United Nations Framework Convention on Climate Change (UNFCCC)
2 Website of United Nations Framework Convention on Climate Change, http://unfccc.int
3 UNFCCC decision 17/CP.7: Modalities and procedures for a clean development mechanism as defined in article 12 of the Kyoto Protocol
4 UNFCCC, Clean Development Mechanism, Project Design Document (CDM-PDD)
5 UNFCCC document: Approved consolidated baseline methodology ACM0006.“Consolidated baseline methodology for grid-connected electricity generation from biomass residues”
6 Detailed project report on 21 MW Biomass based power project – Aurobindo Agro Energy Limited
7 Baseline for Renewable energy projects under clean development mechanism-TERI Report No 2000RT64
8 Biomass Resource Assessment study for sivagangai district
9 Website of Central Electric Authority (CEA), Ministry of Power, Govt. of India- www.cea.nic.in
10 Website of Ministry Non-Conventional Energy Sources (MNES), Government of India, www.mnes.nic.in
11 Website of Indian Renewable Energy Development Agency (IREDA), www.ireda.nic.in
12 Website of TNERC www.tnerc.tn.nic.in
13 Website of Kerala Electricity Board www.kseboard.com
14 Website of Karnataka Power Transmission Corporation Limited www.kptcl.com
15 Website of Anthrapradesh Power Generation Company www.apgenco.com
16 Website of TamilNadu Electricity Board www.tneb.org
PROJECT DESIGN DOCUMENT FORM (CDM PDD) - Version 02 CDM – Executive Board page 82
.
Appendix A Abbreviations
AAEPL Aurobindo Agro Energy Pvt,Ltd. CDM Clean Development Mechanism CEA Central Electricity Authority CER Certified Emission Reductions cm Centimetre CO2 Carbon dioxide DPR Detailed Project Report GHG Greenhouse Gas IPCC Intra governmental Panel for Climate Change IPP Independent Power Producers kCal Kilo Calories kg Kilogram Km Kilometre KP Kyoto Protocol Ksca Kilogram Square Centimetre absolute kv Kilo voltage kW Kilowatt kWh Kilowatt hour LP Low Pressure MNES Ministry of Non-Conventional Energy Sources MT Metric Tons MU Million Units MW Megawatt NGO Non Government Organizations NOC No Objection Certificate PDD Project Design Document PIN Project Idea Note PLF Plant Load Factor PPA Power Purchase Agreement QA Quality Assurance QC Quality Control SIPCOT State Industrial Promotion Corporation of
TamilNadu TEDA TamilNadu Energy Development Agency TNEB TamilNadu Electricity Board TNERC TamilNadu Electricity Regulatory Commission