Embed Size (px)
Citation preview
Aus der Poliklinik für Zahnerhaltung und Parodontologie
der Ludwig-Maximilians-Universität München
Direktor: Prof. Dr. Reinhard Hickel
MICRO-COMPUTED TOMOGRAPHY IN CARIES RESEARCH
Dissertation
zum Erwerb des Doktorgrades der Zahnheilkunde
an der Medizinischen Fakultät der
Ludwig-Maximilians-Universität zu München
Vorgelegt von
TATIANA NOGUEIRA ROCHA CLEMENTINO LUEDEMANN
aus
Brasília, Brasilien
2007
Mit Genehmigung der medizinischen Fakultät
der Universität München
Berichterstatter: Prof. Dr. K.-H. Kunzelmann
Mitberichterstatter: Priv. Doz. Dr. U.-G. Müller-Lisse
Prof. Dr. D. Edelhoff
Dekan: Prof. Dr. med. D. Reinhardt
Tag der mündlichen Prüfung: 07.03.2007

To my husband Gustavo and my son João Pedro
Table of Contents
INTRODUCTION 1
PART I. X-RAY MICRO-COMPUTED TOMOGRAPHY: BASIC CONCEPTS
1 X-ray Micro-computed Tomography 5
1.1 Introduction 5
1.2 Principles 6
1.3 X-ray Source 9
1.4 Detectors 10
1.5 Systems 10
1.6 Synchrotron Radiation (SR) 17
2 Micro-CT in Caries Research 19
2.1 A Chronological Review 19
3 Aim of the Study 27
4 Mineral Concentration of Natural Human Teeth by a Commercial Micro-CT 29
4.1 Abstract 29
4.2 Introduction 30
4.3 Materials and Methods 31
4.3.1 X-ray microtomography system 32
4.3.2 Specimen preparation 33
4.3.3 Mineral concentration evaluation by micro-CT 34
4.3.4 Statistical analysis 37
4.4. Results 37
4.5 Discussion 41
PART II. µCT vs. TMR: A VALIDATION STUDY
5 Measurement of Natural Caries Lesion by Quantitative Microradiography
and Micro-Computed Tomography: A Correlation Study 46
5.1 Abstract 46
5.2 Introduction 47
5.3 Materials and Methods 49
5.3.1 Preparation procedure for enamel specimens 49
5.3.2 Transverse Microradiography 50
5.3.3 Preparation of sample holder for micro-CT measurements 51
5.3.4 Micro-Computed Tomography 52
5.3.5 Statistical Analysis 57
5.4 Results 58
5.5 Discussion 62
PART III. MICRO-CT AND DENTIN STUDY: A THREE-DIMENSIONAL
EVALUATION OF CARIES
6 Micro-computed tomographic evaluation of a new enzyme solution for caries
removal in deciduous teeth 68
6.1 Abstract 68
6.2 Introduction 69
6.3 Materials and Methods 72
6.3.1 Sample preparation and treatment 72
6.3.2. Micro-computed Tomography scans 73
6.3.3 Data Evaluation 74
6.3.3.1 Mineral concentration evaluation 74
6.3.3.2 Volume analysis 74
6.3.3.3 Thickness measurements 76
6.3.3.4 Calculation of Mineral Loss (∆Z) 78
6.3.3.5 Calculation of the mineral concentration at the surface
of treated samples (IMC) 78
6.3.4 FE-SEM Analysis 78
6.3.5 Statistical Analysis 79
6.4 Results 79
6.5 Discussion 85
6.6 Conclusion 88
SUMMARY 90
ZUSAMMENFASSUNG 93
REFERENCES 96
ACKNOWLEDGMENTS 105
1
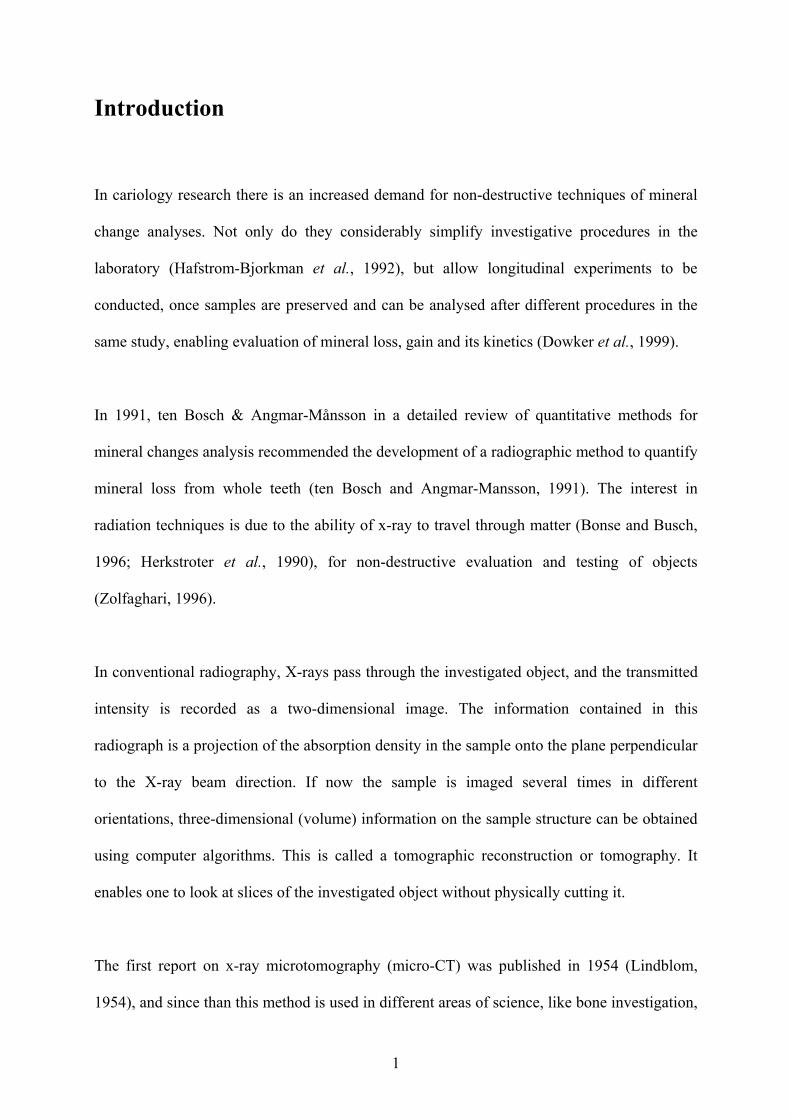
Introduction
In cariology research there is an increased demand for non-destructive techniques of mineral
change analyses. Not only do they considerably simplify investigative procedures in the
laboratory (Hafstrom-Bjorkman et al., 1992), but allow longitudinal experiments to be
conducted, once samples are preserved and can be analysed after different procedures in the
same study, enabling evaluation of mineral loss, gain and its kinetics (Dowker et al., 1999).
In 1991, ten Bosch & Angmar-Månsson in a detailed review of quantitative methods for
mineral changes analysis recommended the development of a radiographic method to quantify
mineral loss from whole teeth (ten Bosch and Angmar-Mansson, 1991). The interest in
radiation techniques is due to the ability of x-ray to travel through matter (Bonse and Busch,
1996; Herkstroter et al., 1990), for non-destructive evaluation and testing of objects
(Zolfaghari, 1996).
In conventional radiography, X-rays pass through the investigated object, and the transmitted
intensity is recorded as a two-dimensional image. The information contained in this
radiograph is a projection of the absorption density in the sample onto the plane perpendicular
to the X-ray beam direction. If now the sample is imaged several times in different
orientations, three-dimensional (volume) information on the sample structure can be obtained
using computer algorithms. This is called a tomographic reconstruction or tomography. It
enables one to look at slices of the investigated object without physically cutting it.
The first report on x-ray microtomography (micro-CT) was published in 1954 (Lindblom,
1954), and since than this method is used in different areas of science, like bone investigation,
INTRODUCTION
2
mineralogy, biology, material sciences, engineering sciences, paleobiology and others (Elhila
et al., 1996; Kalukin et al., 2000; Rossi et al., 2004). At the end of the 80’s the first research
on micro-CT was published in the dental field, but only in the last few years it is gaining
importance in dental research.
Micro-CT is a variation of x-ray attenuation methods, which has been used to study
demineralized lesions. Attenuation means the graduate diminution of radiation flux through a
particular feature due to the process of scattering and absorption of the radiation. In both
processes, the X-ray photon interacts with the atoms of the material. In scattering, the X-ray
photon continues with a change in direction with or without a loss in energy. In absorption,
the energy of the X-ray photon is completely transferred to the atoms of the material. The
fundamental law of attenuation, also called, Beer-Bouguer-Lambert law, states that the
attenuation process is linear in the intensity of radiation and amount of matter, provided that
the physical state (i.e., composition) is held constant. The attenuation coefficient is an
inherent property, dependent on the atomic number of the object, its density and on the
intensity of the X-ray energy, thus allowing quantitative classifications to be made (Davis and
Wong, 1996a).
Micro-CT is derived from the Computed Axial Tomography (CAT), but mostly applied for
laboratory purpose, which makes your use possible in higher order of energy and finer
resolution. It is a non-destructive technique, which allows high spatial resolution of inner
structures to be recorded (Anderson et al., 1996; Rhodes et al., 1999; Stock et al., 2002).
Depending on the x-ray source and the scanner design, the linear resolution for micro-CT is
about 2-100 µm (Wong et al., 2000). The data can be registered both in two or three
dimensions and used for qualitative or quantitative analyses (Dowker et al., 1997; Mercer et
al., 2003; Oi et al., 2004; Peters et al., 2003; Rhodes et al., 1999; Rhodes et al., 2000).
INTRODUCTION
3
The current work has been divided into three parts: I. X-ray Micro-Computed Tomography:
Basic Concepts, II. Validation of micro-CT for Enamel Caries Research and III. Micro-CT
and Dentin Study: A Three-Dimensional Evaluation of Caries. The first part includes an
introduction to the basic concepts of X-ray micro-computed tomography (chapter 1). A
chronological review of micro-CT in the present caries research is pointed out in the second
chapter. In chapter 3 we evaluate a commercial micro-CT equipment and discuss its
feasibility to measure quantitatively the mineral content of whole tooth and the relevant
conditions related to the limitation of the system.
In the second part we applied X-ray micro-CT to the study of the natural enamel caries lesion.
As an important step for the validation of the method, a correlation was determined between
the new technology and a gold-standard. Transverse microradiography (TMR) was the elected
method for this study because it is the analytical method which yields the most detailed
quantitative information of mineral content, mineral changes, and mineral distributions of
tooth samples (Arends and ten Bosch, 1992).
A practical application of the method for three-dimensional studies is related on the third part.
The ability of a prototype enzymatic solution to remove dentin caries was for the first time
evaluated. A mathematical model was used to access the thickness of the remained
demineralized tissue and threshold image analysis was applied for the determination of the
volume of removed carious tissue.
Part I
X-ray Micro-computed Tomography:
Basic Concepts
5
Chapter 1
X-ray Micro-computed Tomography
1.1 Introduction
After the x-ray computed tomography invention, in 1972, by Hounsfield and Cormark, the
diagnostic medicine has gained in resolution, accuracy and speed, once images of internal
features, based on x-ray attenuation coefficients, became feasible.
Micro-CT is a miniature sort of the original clinical CAT scanners. Two main technical
differences between both make it possible to obtain a much better resolution. First, the
different projections in medical computer tomography are made by rotating the X-ray source
and detector around the object (patient), causing mechanical vibrations. For the study of
materials, it is possible to rotate the object, thereby reducing the vibration and enhancing the
resolution. The second difference is the size of the X-ray source which is 5-10 µm in micro-
focus computer tomography compared with a millimetre in medical applications. The smaller
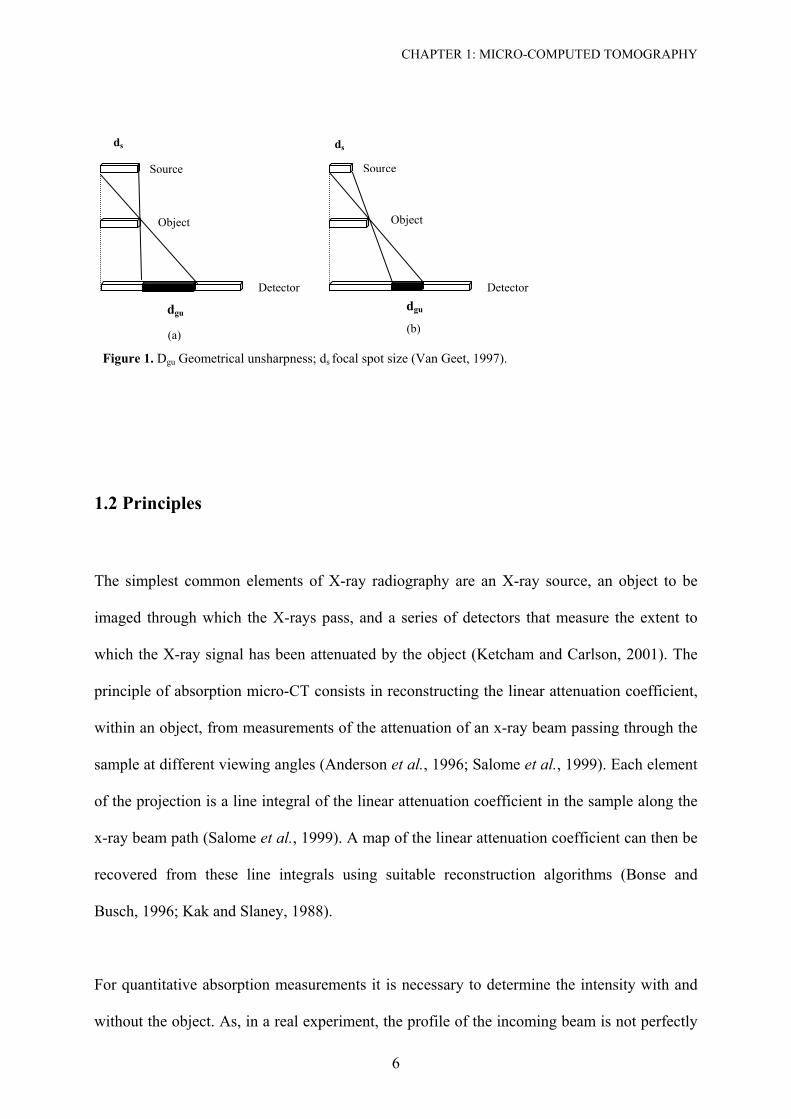
source increases the sharpness of the projection by reducing the penumbra (Figure 1). This
makes it possible to put the object near the X-ray-source and to increase the primary
enlargement of the object, which again enhances the resolution (Van Geet, 1997)
CHAPTER 1: MICRO-COMPUTED TOMOGRAPHY
6
1.2 Principles
The simplest common elements of X-ray radiography are an X-ray source, an object to be
imaged through which the X-rays pass, and a series of detectors that measure the extent to
which the X-ray signal has been attenuated by the object (Ketcham and Carlson, 2001). The
principle of absorption micro-CT consists in reconstructing the linear attenuation coefficient,
within an object, from measurements of the attenuation of an x-ray beam passing through the
sample at different viewing angles (Anderson et al., 1996; Salome et al., 1999). Each element
of the projection is a line integral of the linear attenuation coefficient in the sample along the
x-ray beam path (Salome et al., 1999). A map of the linear attenuation coefficient can then be
recovered from these line integrals using suitable reconstruction algorithms (Bonse and
Busch, 1996; Kak and Slaney, 1988).
For quantitative absorption measurements it is necessary to determine the intensity with and
without the object. As, in a real experiment, the profile of the incoming beam is not perfectly
Object
Detector
Figure 1. Dgu Geometrical unsharpness; ds focal spot size (Van Geet, 1997).
Source
ds
dgu
Source
Object
Detector
ds
dgu
(a) (b)
CHAPTER 1: MICRO-COMPUTED TOMOGRAPHY
7
uniform (neither in the direction perpendicular nor in the one parallel to the beam) and as it
varies slowly with time, it is important to take both images within a few minutes and without
moving the detector (i.e. the incoming intensity is determined by moving the object out of the
beam path) (Wolfgang, 2001).
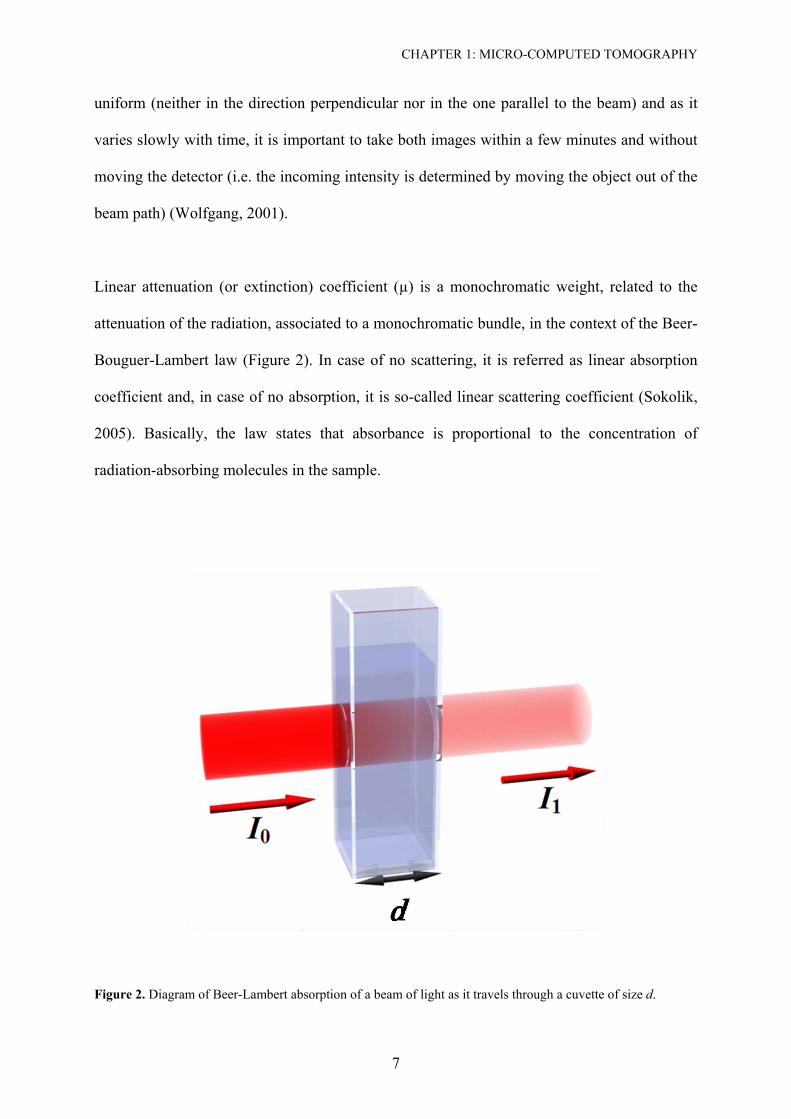
Linear attenuation (or extinction) coefficient (µ) is a monochromatic weight, related to the
attenuation of the radiation, associated to a monochromatic bundle, in the context of the Beer-
Bouguer-Lambert law (Figure 2). In case of no scattering, it is referred as linear absorption
coefficient and, in case of no absorption, it is so-called linear scattering coefficient (Sokolik,
2005). Basically, the law states that absorbance is proportional to the concentration of
radiation-absorbing molecules in the sample.
Figure 2. Diagram of Beer-Lambert absorption of a beam of light as it travels through a cuvette of size d.
CHAPTER 1: MICRO-COMPUTED TOMOGRAPHY
8
Thus, the linear attenuation coefficient (µ) is the probability that an X-ray or gamma-ray
photon will interact with the material it is traversing, per unit path length travelled. It is
usually reported in units of cm-1 and depends on the photon energy, chemical composition and
physical density of the material. For monoenergetic X-rays, the fraction of incident X-rays
expected to penetrate through a thickness d without interacting with the material is:
d
0e
II µ−= (1)
Another way to express the linear attenuation coefficient is by the mass attenuation coefficient
(MAC) [cm2/g] multiplied by the density ρ [g/cm3] (2).
ρρµρµ ×=×= MAC (2)
The advantage of expressing the linear attenuation coefficient in this way is that the mass
attenuation coefficient is independent of density and can be computed from the mass
attenuation coefficients of the constituent elements. For any material, the mass attenuation
coefficient (µmass) is a weighted sum of the mass attenuation coefficients of the component
elements.
nmass xcba µµµµµ ...321 ++= [cm2/g] (3)
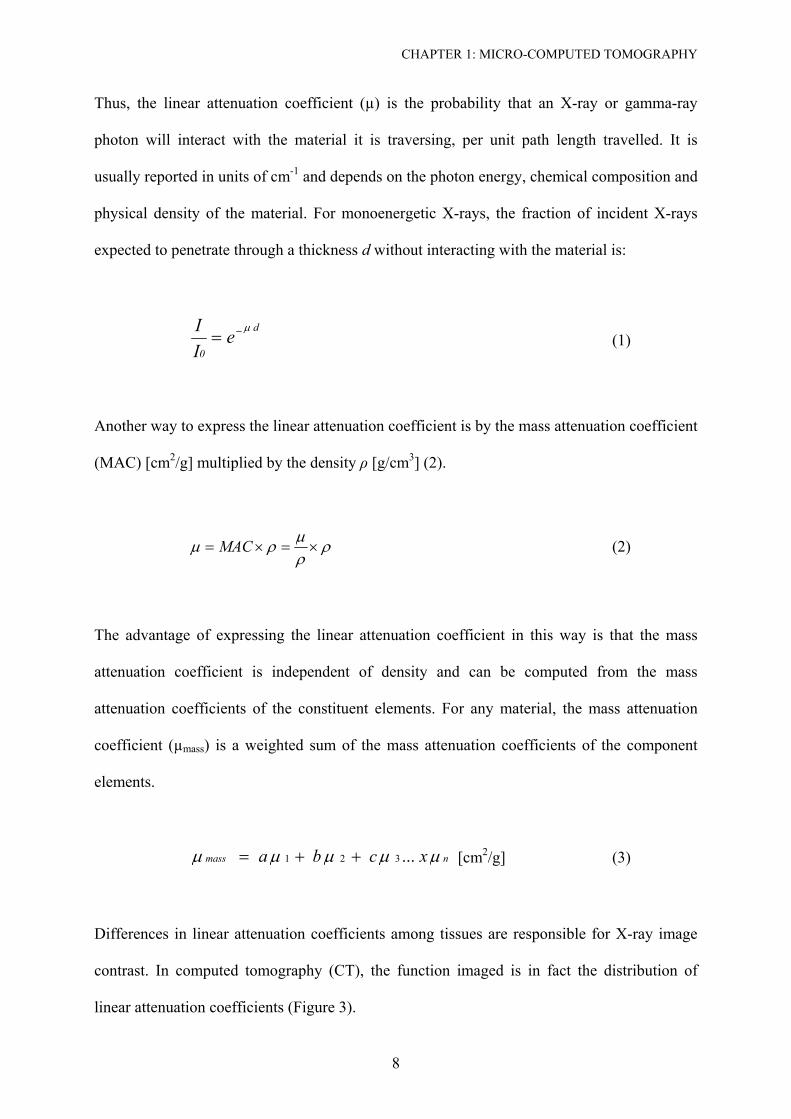
Differences in linear attenuation coefficients among tissues are responsible for X-ray image
contrast. In computed tomography (CT), the function imaged is in fact the distribution of
linear attenuation coefficients (Figure 3).
CHAPTER 1: MICRO-COMPUTED TOMOGRAPHY
9
Figure 3. A: The value of the linear attenuation coefficient increases as the x-ray energy decreases. B: The
subject contrast is shown as a function of the x-ray energy. Lowering the x-ray energy, increases the value of µ,
this increases the subject contrast of the sample (Bushberg, 1994).
1.3 X-ray Source
In X-ray tubes, X-rays are generated by stopping fast electrons in a target material inside an
evacuated glass tube. The energy of the X-ray photons is of the order of the electron energy.
The electrons' acceleration voltage determines the upper limit of emitted X-ray energy. X-rays
produced by this principle are called Bremsstrahlung with a white continuum spectrum
(Bonse and Busch, 1996).
Three variables concern with effectiveness of the x-ray source: focus-size, energy spectrum
and intensity. The focus-size is very closely related with the linear resolution of the micro-CT.
One can find equipments with dual spot-size. A smaller, which allows more details to be
recorded, but at a cost of intensity, and a larger, which can be used intending to improve
counting statistics with a little cost in linear resolution. The energy spectrum is related with
the penetrability of an X-ray. Higher energy penetrates more efficiently, but can be less
sensitive to changes in material density and composition. The energy spectrum generated is
usually described in terms of the peak X-ray energy (kVp), but actually consists of a
CHAPTER 1: MICRO-COMPUTED TOMOGRAPHY
10
continuum in which the level with maximum intensity is typically less than half of the peak
(keV). The X-ray intensity directly affects the signal-to-noise ratio and thus image clarity.
Higher intensities improve the underlying counting statistics, but often require a larger focal
spot (Ketcham and Carlson, 2001).
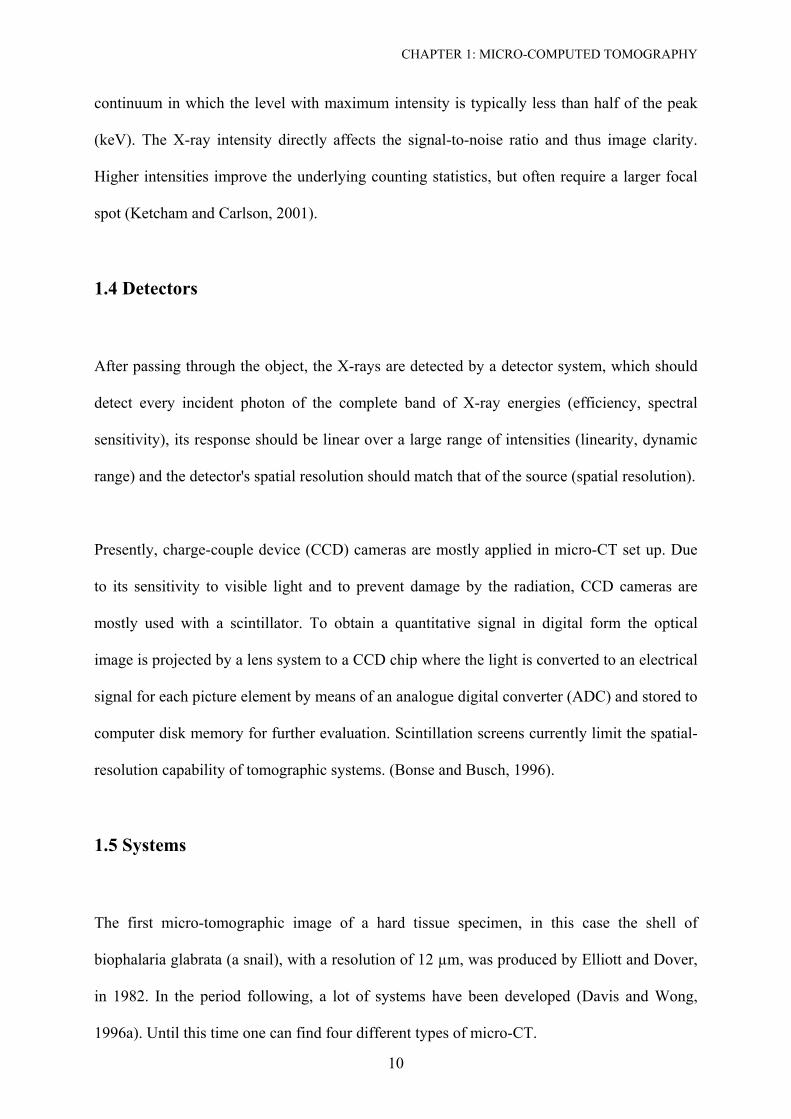
1.4 Detectors
After passing through the object, the X-rays are detected by a detector system, which should
detect every incident photon of the complete band of X-ray energies (efficiency, spectral
sensitivity), its response should be linear over a large range of intensities (linearity, dynamic
range) and the detector's spatial resolution should match that of the source (spatial resolution).
Presently, charge-couple device (CCD) cameras are mostly applied in micro-CT set up. Due
to its sensitivity to visible light and to prevent damage by the radiation, CCD cameras are
mostly used with a scintillator. To obtain a quantitative signal in digital form the optical
image is projected by a lens system to a CCD chip where the light is converted to an electrical
signal for each picture element by means of an analogue digital converter (ADC) and stored to
computer disk memory for further evaluation. Scintillation screens currently limit the spatial-
resolution capability of tomographic systems. (Bonse and Busch, 1996).
1.5 Systems
The first micro-tomographic image of a hard tissue specimen, in this case the shell of
biophalaria glabrata (a snail), with a resolution of 12 µm, was produced by Elliott and Dover,
in 1982. In the period following, a lot of systems have been developed (Davis and Wong,
1996a). Until this time one can find four different types of micro-CT.
CHAPTER 1: MICRO-COMPUTED TOMOGRAPHY
11
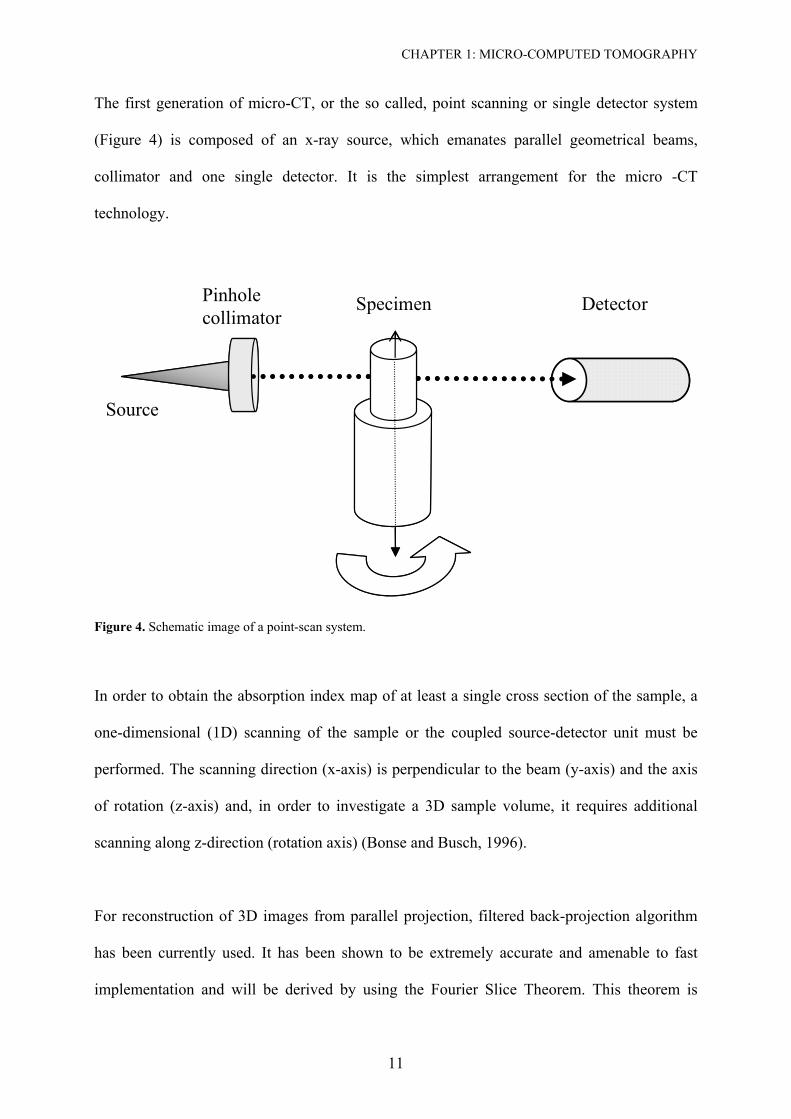
The first generation of micro-CT, or the so called, point scanning or single detector system
(Figure 4) is composed of an x-ray source, which emanates parallel geometrical beams,
collimator and one single detector. It is the simplest arrangement for the micro -CT
technology.
Source
Pinholecollimator
Specimen Detector
Source
Pinholecollimator
Specimen Detector
Figure 4. Schematic image of a point-scan system.
In order to obtain the absorption index map of at least a single cross section of the sample, a
one-dimensional (1D) scanning of the sample or the coupled source-detector unit must be
performed. The scanning direction (x-axis) is perpendicular to the beam (y-axis) and the axis
of rotation (z-axis) and, in order to investigate a 3D sample volume, it requires additional
scanning along z-direction (rotation axis) (Bonse and Busch, 1996).
For reconstruction of 3D images from parallel projection, filtered back-projection algorithm
has been currently used. It has been shown to be extremely accurate and amenable to fast
implementation and will be derived by using the Fourier Slice Theorem. This theorem is
CHAPTER 1: MICRO-COMPUTED TOMOGRAPHY
12
brought into play by rewriting the inverse Fourier transform in polar coordinates and
rearranging the limits of the integration therein (Kak and Slaney, 1988).
The advantages of point scanning apparatus are: (a) its reasonable price, comparing with the
next versions; (b) the possibility of using energy detector resolving, which allows
monocromatization of radiation, avoiding beam-hardening artefacts (see later) (Bonse and
Busch, 1996; Wong et al., 2000). Thus, the local mass concentration can be determined from
the measured linear attenuation coefficient, when the composition is known (Davis and
Wong, 1996a; Wong et al., 2000). Wong et al. (Wong et al., 1995) showed that the system
was sufficiently sensitive to detect an increase in the mean cross-sectional mineral
concentration of ~ 1.3 to ~ 1.5 g/cm3 from the distal metaphysic to the proximal end of the
femur, respectively. (c) The lack of blurring effects caused by scattering (Davis and Wong,
1996a), because detection of scattered radiation can easily be made negligible by an
appropriate collimator arrangement (Endo et al., 2001). In this sense, contribution of scattered
radiation to the detector signal can, with good collimation, be <1% (Carlsson, 1999). (d) All
pixels are generated from signals from the same detector, which means that detector artefacts,
as ring artefacts are avoided (Carlsson, 1999).
Disadvantages would be: (a) the long time required for scanning (Anderson et al., 1996), (b) it
is not useful, if high resolution is necessary, because by reducing of aperture diameter and use
of smaller step sizes, one consequently looses of intensity, too (Bonse and Busch, 1996).
However, according to Carlsson, C.A. (1999), a detector can be large enough to get maximal
efficiency (Carlsson, 1999). Also, the capabilities of their first generation system constrained
practicable measurement to a small number of slices through lesions formed in cut blocks
with a 2 x 2.5 mm2 cross-section.
CHAPTER 1: MICRO-COMPUTED TOMOGRAPHY
13
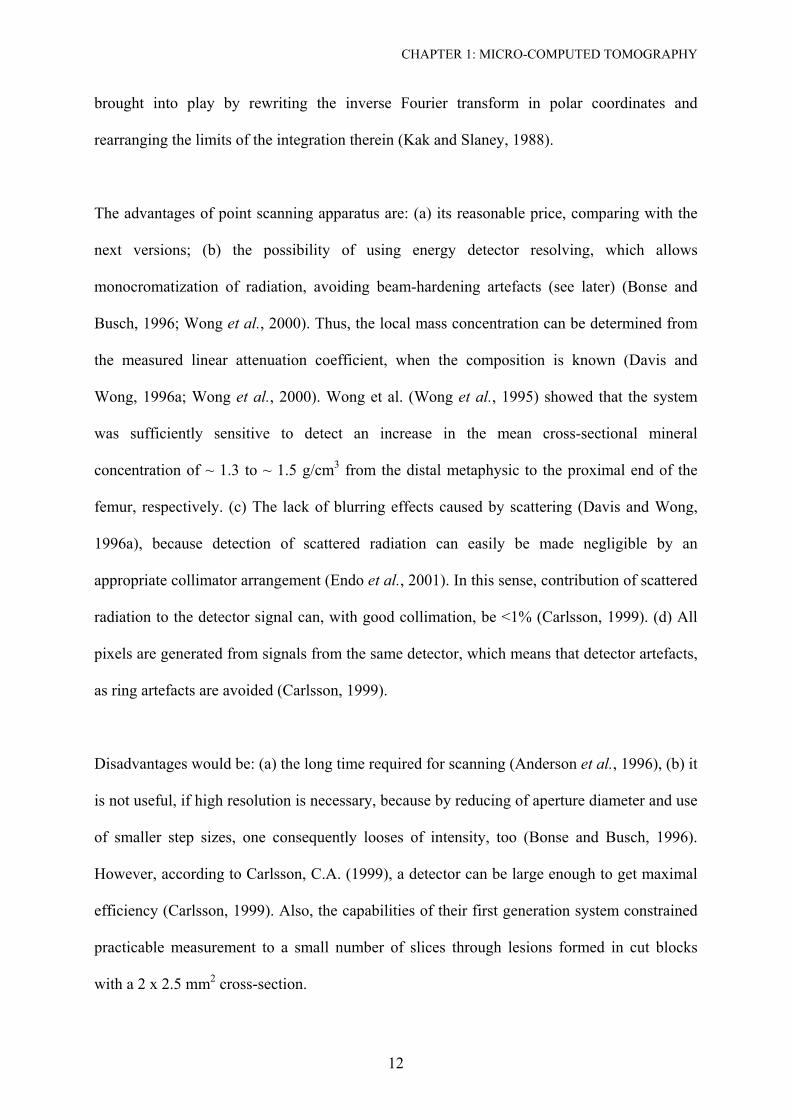
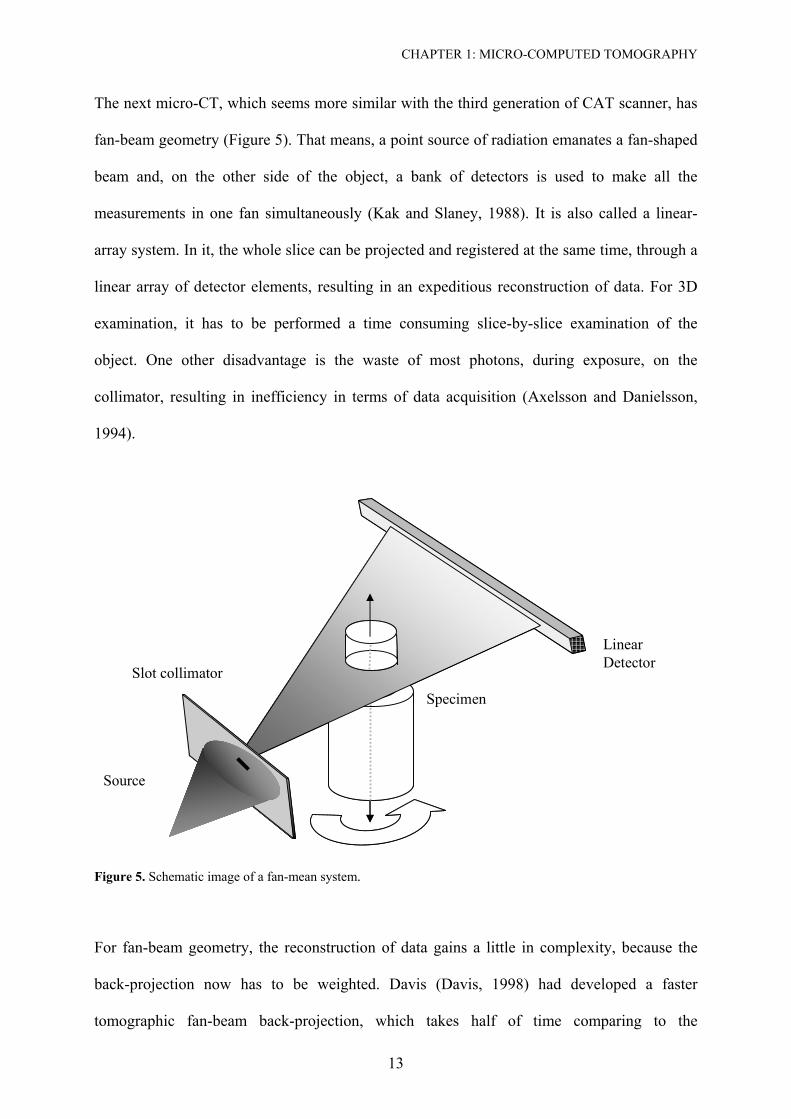
The next micro-CT, which seems more similar with the third generation of CAT scanner, has
fan-beam geometry (Figure 5). That means, a point source of radiation emanates a fan-shaped
beam and, on the other side of the object, a bank of detectors is used to make all the
measurements in one fan simultaneously (Kak and Slaney, 1988). It is also called a linear-
array system. In it, the whole slice can be projected and registered at the same time, through a
linear array of detector elements, resulting in an expeditious reconstruction of data. For 3D
examination, it has to be performed a time consuming slice-by-slice examination of the
object. One other disadvantage is the waste of most photons, during exposure, on the
collimator, resulting in inefficiency in terms of data acquisition (Axelsson and Danielsson,
1994).
Linear Detector
Source
Slot collimator
Specimen
Linear Detector
Source
Slot collimator
Specimen
Figure 5. Schematic image of a fan-mean system.
For fan-beam geometry, the reconstruction of data gains a little in complexity, because the
back-projection now has to be weighted. Davis (Davis, 1998) had developed a faster
tomographic fan-beam back-projection, which takes half of time comparing to the
CHAPTER 1: MICRO-COMPUTED TOMOGRAPHY
14
conventional fan beam back projection algorithm, without sacrificing accuracy. According to
Davis & Elliott (Davis and Wong, 1996a), there are no advantages of this system over the
next one to be presented. This geometry is used in the µCT 20 (SCANCO Medical AG,
Bassersdorf, Switzerland) that will be studied in the chapter 4 of the current work.
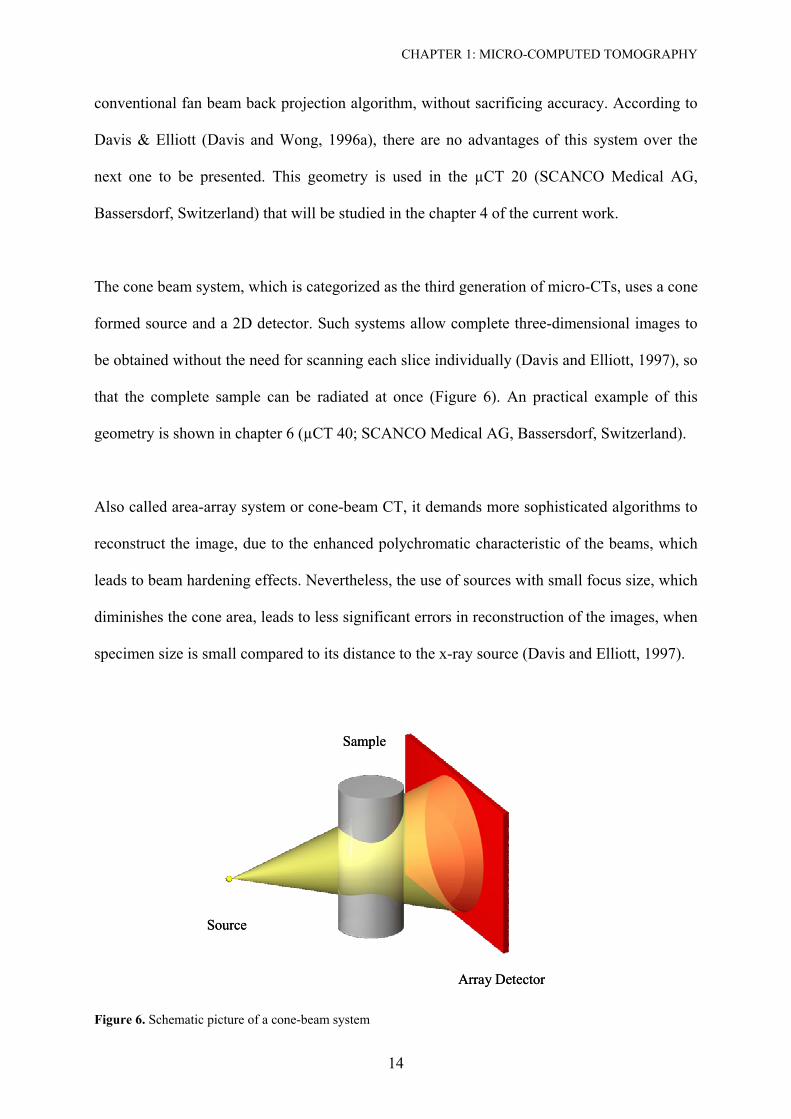
The cone beam system, which is categorized as the third generation of micro-CTs, uses a cone
formed source and a 2D detector. Such systems allow complete three-dimensional images to
be obtained without the need for scanning each slice individually (Davis and Elliott, 1997), so
that the complete sample can be radiated at once (Figure 6). An practical example of this
geometry is shown in chapter 6 (µCT 40; SCANCO Medical AG, Bassersdorf, Switzerland).
Also called area-array system or cone-beam CT, it demands more sophisticated algorithms to
reconstruct the image, due to the enhanced polychromatic characteristic of the beams, which
leads to beam hardening effects. Nevertheless, the use of sources with small focus size, which
diminishes the cone area, leads to less significant errors in reconstruction of the images, when
specimen size is small compared to its distance to the x-ray source (Davis and Elliott, 1997).
Source
Sample
Array Detector
Source
Sample
Array Detector
Figure 6. Schematic picture of a cone-beam system
CHAPTER 1: MICRO-COMPUTED TOMOGRAPHY
15
It is well known that most material preferentially absorbs low energy x-rays photons more
than high-energy (Hsieh et al., 2000). Beam hardening is the phenomenon that a
polychromatic X-ray beam becomes more penetrating, or harder, as it traverses through
matter. The X-ray beams used in medical imaging are polychromatic with a moderately broad
energy spectrum. The attenuation processes in matter are energy dependent. Non-uniform
attenuation of different energies results in the preferential depletion of X-rays in energy
ranges with higher attenuation coefficients. In general, X-rays in energy ranges that are more
easily attenuated are referred to as soft X-rays while those in ranges that are more penetrating
are referred to as hard X-rays. Thus, beam hardening is the process of selective removal of
soft X-rays from the X-ray beam. As these X-rays are removed, the remaining beams are
progressively harder or more penetrating. The amount of beam hardening depends on the
initial X-ray spectrum as well as on the composition of the material or tissue traversed.
However, for any fixed initial X-ray spectrum and tissue type, the process of beam hardening
represents a monotonic increase in beam hardness as a function of tissue thickness traversed
(Pettersson et al., 1998).
As a result of beam hardening, the effective attenuation coefficient of a material depends on
the thickness of material traversed. This effect causes so-called beam hardening artefacts in
CT images. If uncorrected, beam hardening artefacts appear as cupping, or a reduction of the
reconstructed attenuation coefficient toward the centre of a large object (Pettersson et al.,
1998). According to Dowker et al. (Dowker et al., 2003) this phenomenon could be
minimised by careful calibration.
According to Endo et al. (Endo et al., 2001), its major disadvantage is the scattered radiation,
which can not be avoided and may enhance the noise in reconstructed images, and thus affect
CHAPTER 1: MICRO-COMPUTED TOMOGRAPHY
16
low-contrast detect ability. Nevertheless, the use of a crystal collimator between the sample
and the detector can significantly depress this factor (Takeda et al., 1994).
The fourth generation of micro-CT was built to overcome the problems with ring artefacts,
common in the cone-beam scanners. A ring artefact is a phenomenon which occurs whenever
a 'curve' with sharp edges is subject to Fourier analysis. Representation of the profiles
measured with a limited number of Fourier harmonics is imperfect, resulting in high-
frequency oscillations at the edges, and the image can therefore exhibit some noticeable
spatial signal intensity variations at intensity boundaries: the Gibbs phenomenon, overshoot
artefacts or "ringing" (Davis and Elliott, 1997). The artefacts can be suppressed by filtering
the images. However, filtering can in turn reduce spatial resolution (Pettersson et al., 1998).
This new system employees the method of time delay integration (TDI), which is a technique
originally designed for increasing the allowable exposure (or integration) time (and hence
signal-to-noise ratio) in the acquisition of linearly moving images. TDI uses a two-
dimensional CCD which is scanned in such a way, synchronised with the movement of the
specimen, so as not to introduce motion blurring (Davis and Elliott, 1997). According to
Dowker et al. (Dowker et al., 1997), an advantage of this system is that the sensitivity of each
pixel within a single vertical column of the scanned image is identical, so that only one
calibration per column, rather than per pixel is necessary (Davis and Elliott, 1997; Dowker et
al., 1997). A physical description for the construction of this system is found in Davis &
Elliott (Davis and Wong, 1996a). According to them, the use of TDI scanning in
microtomography will also have the advantages of improving the accuracy with which
features in the specimen can be quantified and enabling to scan specimens which are larger
than the CCD imaging area or the X-ray beam. This latter feature would be of particular
significance when using a synchrotron source (Davis and Elliott, 1997). Also, high spatial
CHAPTER 1: MICRO-COMPUTED TOMOGRAPHY
17
resolution (5 µm), high dynamic range and high signal-to-noise ratio are here present, which
results in high contrast resolution and excellent discrimination of very small differences in
attenuation coefficient (< 1% depending on the specimen). The disadvantage of this system is
the greater complexity in constructing the equipment and the necessity of longer exposure
time.
1.6 Synchrotron Radiation (SR)
A revolution in micro-CT images, according to resolution and quality of image was achieved
after the use of synchrotron sources. Synchrotron radiation refers to the electromagnetic
radiation emitted by ultra relativistic electrons (energies of several GeV), circulating in
storage rings, where they are accelerated by a magnetic field (Cloetens et al., 2001). Its large
flux of photons and better collimation provides more x-rays per unit area on the sample,
allowing for better spatial resolution (Dowker et al., 2003; Landis et al.), which can be near to
1 µm (Bonse and Busch, 1996). The higher flux and continuous spectrum allow researchers to
choose a monochromatic beam with a small band pass, which greatly improves the sensitivity
of microtomography to smaller x-ray absorption variations within the sample. The high
degree of monochromaticity also mitigates the problem of beam hardening (Cloetens and
Baruchel, 2002; Landis et al., ; Spanne, 1989). According to Davis and Wong (Davis and
Wong, 1996a), SR can be used in all categories of microcomputed tomographic equipment.
The advantages of synchrotron radiation (SR) over X-rays from X-rays tubes are: high
intensity (Cloetens et al., 2001; Morton et al., 1990) and/or brilliance, collimation, tuneability
over a wide wavelength spectrum (infra-red through visible and ultra-violet), linear or
elliptical polarized radiation (Bonse and Busch, 1996). The beam energy can be tuned over a
broad range, allowing the optimum x-ray absorption to be chosen for each sample, depending
CHAPTER 1: MICRO-COMPUTED TOMOGRAPHY
18
on size and/or composition. Thus it is possible to construct compositional maps of objects
(Landis et al., ; Spanne, 1989).
According to Morton et al. (Nuzzo et al., 2002) the use of SR micro-CT as compared with
standard micro-CT offers the opportunity of an accurate investigation of local bone mineral
content in addition to microarchitectural analysis. Moreover, the use of a high resolution CCD
based two-dimensional detector allows the finer spatial resolution of x-ray microtomography
to be realized, while keeping the sample scanning time to a minimum (Landis et al.).
However, at the current time, one can find difficulties to work with SR due to its high cost
and sample size limitations (Dowker et al., 2003). Specimens can not be larger than few
millimetres.
19
Chapter 2
Micro-CT in Caries Research
2.1 A Chronological Review
The use of microtomographic technique in dentistry dates only two decades. The method is
thus new and has to be tested and discussed. In this field, a few numbers of schools have been
giving effort, testing the technology, contributing to enhancement of physical properties, as
resolution and reduction of artefacts, implementation of image analysis techniques to achieve
common purposes as the higher quality, sensitivity and accuracy of the results.
One of the most expressive potential of the micro-CT for dentistry is for evaluation of mineral
content and changes in dental hard tissue. As the results from scanning procedures are
expressed as attenuation coefficient, the equivalence of this value to mineral content should
be known, after a prudent calibration.
However quantification of mineral changes have started in early 90’s, when Gao et al. (Gao et
al., 1993) used tomographic technique, together with microradiography, to the study of
mineral distribution in tooth rods before and after demineralization, and after
remineralization. In this experiment, first generation tomographic equipment was used with
10 µm linear resolutions to scan physically cut teeth (2 x 2.5 mm2 cross-sections).
CHAPTER 2: MICRO-CT IN CARIES RESEARCH
20
Demineralization results throughout the depth of the lesion showed good agreement with
earlier results. According to the authors, micro-CT can give new insights into the process of
remineralization of early carious lesions. As suggestion from the authors, micro-CT should
also be used in investigations of chemical reaction, including those at extremes of
temperature, in which the microscopic spatial distribution of the x-ray absorption changes on
the timescale of a few minutes or to a few weeks.
Anderson et al. (Anderson et al., 1996) compared the mineral content of enamel and dentine
in human premolar rods (2 x 2.5 mm2) and enamel pearls, using a first generation
microtomographic apparatus at 40 kV and 2 mA. The system was periodically calibrated with
a flux-grown crystal of fluorapatite, whose linear absorption coefficient could be calculated
from its density, chemical composition and published elemental-mass absorption coefficients.
It insured that systematic errors in the determined linear absorption coefficient were
minimized. Aluminium wire was also used in some slices to check the measured linear
absorption coefficient. Analysing selected regions of interest, Anderson et al. (Anderson et
al., 1996) also showed agreement of mineral distribution in the premolars with earlier
microradiographic studies and density measurements. For the pearl of enamel the findings
were again consistent with earlier results. Interestingly, however, is the finding on the mineral
gradient in dentin slices, which were higher at deeper dentin than in the dentin close to the
amelo-dentinal junction. As the porous volume and water content at deeper dentin increases in
comparison to the superficial dentin (Garberoglio and Brannstrom, 1976; Pashley et al.,
1991), one could expect a lower linear attenuation coefficient of the inner part, as showed by
Wakabayashi et al, in 2005 (Wakabayashi et al., 2005)
In 2000, Wong & Elliott (Wong et al., 2000) quantified the mineral concentration and its
gradient by studying the pattern of mineralization in rat incisors. In this study, measurements
CHAPTER 2: MICRO-CT IN CARIES RESEARCH
21
of mean linear absorption coefficient for enamel from micro-CT slices were determined. A
first generation AgKα micro-CT, with 10 µm Pt aperture was used. An energy dispersive Si
(Li) detector was used, connected to two single channel analysers, in parallel, one with a
narrow (for calibration) and the other with a wide electronic energy window, to maintain
effective monochromatism for the images reconstructed with the higher count rate wide
window. To facilitate separation of enamel to dentin (boundaries), projections with 640 points
were generated by linear interpolation and back-projected onto a 640 x 640 grid. Each incisor
was mounted so that the axis that most closely followed the length of them coincided with the
rotation axis of the micro-CT. Internal calibration was provided by a 0.5 mm diameter pure
aluminium wire attached by varnish alongside the incisor. The data collection time was about
18 h for each slice. The boundary was established by drawing a polygon at the amelodentinal
junction (ADJ) and external enamel surface. At similar linear absorption coefficient (LAC),
between enamel and dentin, the ADJ was approximated by using adjacent slices as reference.
Within the polygon, all the pixels, above 3 cm-1, were set to 1 (enamel boundary), and the rest
to 0. The only region where it could happen of lower value for enamel was along the edges.
This was reduced by resetting all the 1 pixels, adjacent to the 0 pixel, to 0 to create a new
binary image. This procedure was then repeated and the final image was used as a mask to
select enamel pixels for the determination of the mean and distribution of the LACs. Also,
isodensity surfaces were computer generated in this study. According to them, micro-CT has
the advantage to be used in different studies of mineral pattern, without necessity of stains.
In 2001 a quantitative study of the effect of pumicing and etching on the remineralization of
enamel opacities was made by Peariasamy et al. (Pearisamy and Anderson, 2000). The
method included micro-CT, contact microradiography (CMR) and infrared reflectance. For
the micro-CT study, a linear resolution of 15-30 µm was achieved in cut specimens of 2.0 x
2.0 mm cross section. Also here, aluminium wire was used to check the system. The results
CHAPTER 2: MICRO-CT IN CARIES RESEARCH
22
from micro-CT showed similarity with the ones from CMR and the formation of surface was
visible for the treated regions.
The first experiment conducted in whole teeth was published in 2003. Therefore, a
longitudinal study of subsurface enamel lesions during in vitro demineralization was made by
Dowker et al. (Dowker et al., 2003). Three third molars were fixed by epoxy putty to a
kinematical mount, which could be removed and accurately repositioned on the micro-CT
rotation stage. A fourth-generation micro-CT system was operated at 90 kV, 0.26 mA and a
0.5 mm Al filter was employed. Each whole tooth was scanned as a ~3-mm-wide transverse
block, requiring 17h, for 15 µm voxel size. Raw data were reconstructed using a cone beam
version of the cartesian axes pre-projection algorithm (Davis, 1998). Volume rendering and
visualisation of slices were used to control the progress of demineralization. In this study,
precise delimitation of the interface tooth/air was not possible due to the contribution of both
surfaces for voxels at this area. Superimposition of series of data sets was also variable in few
voxels. The results from this study are consistent with previous studies and finding derived
from previous microanalysis of calcium and phosphorus concentrations, microradiograms and
scanning electron microscopy.
Also in the domain of the small wavelength, the microtomography has been used to study
laser ablation. Mercer et al. (Mercer et al., 2003) measured the progression of crater growth
during repeated sequential application of a commercial dental Er:YAG laser to human enamel
and dentin. Here tooth rods of 2 mm x 2 mm were used, which could be located and relocated
onto a rotation axis of the micro-CT scanner. A 1 cm polymethyl-methacrylate jacket with a
closed end was placed around the specimen. This assembly could be attached to the upper
surface of an aluminium disc, which contained on the underside three balls fixed in an
equilateral triangle format. These balls were than, for measurements, located into a three brass
CHAPTER 2: MICRO-CT IN CARIES RESEARCH
23
‘V’ blocks on a mounting plate positioned on the central location axis of the scanner, with
accuracy of 0.02 µm in reposition processes. A fourth generation system was set to 50 kV and
1.6 mA with the use of a 2 mm Al filter. Image detector was calibrated using an Al step
wedge of known dimensions. Each data set took 10 h to be collected and reconstructions were
made with standard filtered fan beam algorithm. The final resolution achieved was of 38.66
µm. Isosurfaces were calculated from complete 3D data sets and a threshold value of mineral
concentration was selected at about half the value for that of dentin. This was suggested by
Davis and Wong (Davis and Wong, 1996a) for boundary in bones research. They suggested
setting a threshold halfway between the attenuation coefficient, or density, of bone and non-
bone. All pixels above this threshold are considered to be bone and all below are non-bone.
This gives a good approximation to the true bone to non-bone interface when there is a
substantial volume of bone adjacent to a large space, but in cases where the trabecular
thickness approaches the resolution of the scanner this threshold is too high. However,
according to Mercer et al (Mercer et al., 2003), where there is a sharp boundary, like in the
case of enamel, dentine and air, this does not present problems. Crater volume measurement,
after laser firing, were take through subtraction of voxels, from 3D images. The 2D grey scale
sections, which are similar to microradiographs of thinly cut sections, were used for
calculation of the depth of the crater. Results from this study confirm previous findings which
have used vertical scanning interferometry.
Fearne et al. (Fearne et al., 2004) measured the extent and the distribution of mineral
concentration in first permanent molars with idiopathic enamel hypoplasia through an micro-
CT experiment. The response of the transmitted X-ray image capture system was pre
calibrated with a 10-step aluminium step wedge. Drying artefacts were avoided by
maintaining the samples immersed in fluid and, to prevent motion of the specimens, each
tooth was located inside a plastic syringe, filled with deionised water, and kept firmly in place
CHAPTER 2: MICRO-CT IN CARIES RESEARCH
24
by depressing the plunger lighly in contact with the top of the tooth, before mounted onto the
rotation axis of the micro-CT stage. In this study, whole uncut teeth specimens were analysed
in terms of mineral concentration with a resolution of 15 µm. Images were available as slice
data, similar to the contact microradiography, where mineral profiles could be obtained. Also
3D operations were performed like surface rendering, in which all adjacent voxels with the
same mineral concentration are joined by a surface. A reduction of 5% of mineral content
could be detected in the affected tooth, compared to the sound control, which could
demonstrate the ability of the equipment to distinguish minimal changes in mineralization of
enamel tissues.
As the grown interest for biomaterials development reach the research laboratories, sintered
hydroxyapatite, as a good compatible representative for bones and teeth, has also gained in
importance. Itoh et al. (Itoh et al., 2004) had investigated CO3Ap-collagen sponges with lunge
spores, in which osteoblasts can both easily invade and remain. The study was carried out in a
microCT device, which worked at 80 kV and 100 µA, to reach a detection of 2 µm as linear
resolution. According to the authors, soft x-ray high-resolution micro-CT was successful to
construct 3D images of these organic porous sponges.
Microtomographic technique was used also by Hahn et al. (Hahn et al., 2004) to access the
effectiveness of chemo-mechanical removal of carious dentin. Ten carious human molars
were imaged by an 80 kV and 100 µA micro-CT unit, which offered an average pixel size of
12.4 µm and increments of 26.3 µm, before and after removal procedures. The results of this
study showed a dentin statistically less dense after treatment than it was found in sound
dentin. On account of this, Hahn et al. brought two concerns to be considerate. One is that
there are no established standards for microtomographic density values for caries
determination and second, the surfaces, after chemo-mechanical caries removal, are more
CHAPTER 2: MICRO-CT IN CARIES RESEARCH
25
irregular than after bur and therefore the density can be lower even tough it could be caries-
free, representing a possible limitation of the system for these analyses.
The determination of mineral concentration in deciduous teeth and its pattern was studied by
Wong et al. (Wong et al., 2004) through a first generation micro-CT, set at 21.1 keV. Tooth
rod of 2 x 2 mm2 was cut and analysed together with a 0.5 mm Al wire. Effective
monochromatization was achieved by a setting photon counter in a window range between
4% (narrow) and 40% (wide). The data from the narrow window was used to calibrate the
data in the wide window by fitting a 7th order polynomial in order to avoid artefact from
polychromatic beams, and to improve signal-to-noise ratio in the final back-projection
reconstruction. A binary image was obtained by setting all voxels as described in Wong and
Elliott (Wong et al., 2000). LAC values were calibrated using the measured mean LAC of the
pure aluminium wire and its published value of 6.87 cm-1 at 22.1 keV. Wong et al. have used
an aluminium wire to calibrate the detector. In this case, the transformation of data was made
assuming that hydroxiapatite as the only content in tooth, with a density of 3.15 g/cm3. LAC
(µ) was converted to mineral concentration (Ce) by:
mhapal
pubaleeC
µµµµ××
=)( [g/cm3] (4)
Where µe is the measure LAC of enamel, µat(pub) the LAC of aluminium wire for a known
energy in keV and µmhap the mass attenuation coefficient of hidroxiapatite (4.82 cm2/g at 22.1
keV) (Wong et al., 2004). It was confirmed, in this study, the great variance in mineral
concentration and gradients between surfaces among deciduous molars from different
individuals.
CHAPTER 2: MICRO-CT IN CARIES RESEARCH
26
Further work to evaluate the potential of micro-CT in the study of mineral concentration in
enamel was published in 2004. Dowker et al. (Dowker et al., 2004) evaluated the ability of a
synchrotron source to measure the linear attenuation coefficient of sound and carious enamel.
At linear resolution of 1.9 µm, a mapping of mineralization of one single tooth could be done,
including analysis and evaluation of the Retzius striaes in enamel. A flux-grown fluorapatite
crystal was scanned together with the samples for the standardization of the linear attenuation
coefficient. Although uncertainties and variations in the composition of sound and carious
enamel limit the accuracy of the determination of mineral concentration from linear
attenuation coefficient, results were expressed as g/cm3, for a better comparison of the results
with other works. In this study the variation of the results was shown for nine different models
of inorganic and organic composition of enamel. Dowker et al. compared the effect of the
chosen model upon the parameter derived from linear attenuation coefficient, i.e. mineral
concentration or mineral volume fraction. For both parameters, assumptions have to be made
and the results showed to have more influence of the model of choice when the linear
attenuation coefficient is lower and therefore a greater effect of the organic component is
present. Nevertheless, there was a greater uncertainty in the estimation of the mineral volume
fraction than the mineral concentration, because not only the chemical composition seems to
be the main factor influencing the results, as it is for the determination of mineral
concentration, but also the density chosen greatly influenced the results.
27
Chapter 3
Aim of the Study
So far researches have shown a good agreement between micro-computed tomographic results
with other methods. However, no direct comparison with a gold standard was ever done.
Transverse microradiography has been the most used diagnostic method as gold standard in
cariology. Because a direct relationship is provided between radiographic techniques and
mineral content, this is a suitable method to be used (Huysmans and Longbottom, 2004).
According to Dowker et al. (Dowker et al., 2003) the mineral concentration observed in slices
and line profiles extracted from micro-CT volume data sets will always differ from those
measured by microradiography in physically cut section of tooth carious enamel. This lack of
comparison studies was the concern of this study, which aims to establish a direct correlation
coefficient between micro-CT and microradiography, facing the great difference between both
methods and with a cost of the ideal measurement condition of the micro-CT. Therefore,
TMR prepared slices will be also scanned with a commercial micro-CT equipment in a
simulation set up of whole tooth measurements.
The necessity of cutting samples for the TMR analysis and the fact of limiting the
representation of the dynamic of the caries lesion to one single micrometric slice provides a
CHAPTER 3. AIM OF THE STUDY
28
clear necessity to find a method which is not-destructive and enables longitudinal studies to
be done. A search for a new gold-standard with these characteristics seems to be essential.
The purpose of this study was:
To evaluate the advantages and limitations of micro-CT for mineral concentration
evaluations of sound tooth samples.
To evaluate and correlate the integrated mineral loss and lesion depth of tooth slices
with natural caries in enamel by TMR and micro-CT.
To establish a three-dimensional method of evaluation of caries excavation methods
29
Chapter 4
Mineral Concentration of Natural Human Teeth by
a Commercial Micro-CT
4.1 Abstract
This study aimed to evaluate a commercial micro-CT system (µCT 20) for quantitative
analysis of mineral concentration in human enamel and dentin using different methodologies,
and thereby compare the obtained results with established data from published literature. A
micro-CT device set at 50 kVp (160 µA) was used to scan five whole molars (G1) and five
molars ground to 6-mm thickness (G2), as well as to evaluate the mineral concentration of the
samples. Mean mineral contents for enamel and dentin were 2.57 (± 0.12) and 1.53 (± 0.12)
g/cm3 for G1, and 2.76 (± 0.03) and 1.45 (± 0.02) g/cm3 for G2. Difference between the
groups was significant for enamel. For dentin, there was a clear although not significant
tendency towards higher values with G1. The equipment could identify and differentiate a
higher mineral content of the tooth enamel and dentin from the external to the inner tissue.
Further, the absolute mean values of mineral concentration were lower in whole tooth samples
than in sectioned samples due to beam hardening. In conclusion, the equipment is well suited
for quantifying the mineral content of teeth. However, it is necessary to consider the limited
acceleration voltage of the µCT 20 system and to limit sample evaluation to 6-mm thickness.
CHAPTER 4. MINERAL CONCENTRATION OF TEETH BY MICRO-CT
30
4.2 Introduction
A developing research field in medicine and dentistry is the inspection of specimens by means
of non-invasive and non-destructive 3D analytical techniques. These new, innovative
techniques boast of a few advantages. First, they do not require the time-consuming
preparation of serial sections which means that these new approaches help to save time.
Secondly, they do not require specific staining of the object which can affect the organization
of the investigated structure. Amongst this array of non-invasive imaging tools, micro-
computer tomography (micro-CT) emerges as a potential key tool especially in in vitro caries
research. This is because it allows image recording of inner structures with high spatial
resolution three-dimensionally and without destruction of samples (Lin and Miller, 1996).
Micro-CT is a miniaturized form of CT scanning. It was developed in the beginning of the
1980s predominantly for laboratory purposes on small samples or material experiments, and
used frequently in the studies of trabecular bone structure and mineral analysis (Anderson et
al., 1996; Davis and Wong, 1996b; Dowker et al., 2004). The principle of absorption of
micro-CT consists in reconstructing the linear attenuation coefficient, within an object, from
the attenuation measurements of an X-ray beam passing through the sample at different
viewing angles. Differences in linear attenuation coefficient among tissues are responsible for
X-ray image contrast, which allows quantitative analyses to be made (Davis and Wong,
1996b).
Due to its small size and high X-ray intensity demand, micro-CT is utilized only in
laboratorial experiments. Nevertheless, there are new systems of digital volume tomography
for dental clinical diagnostics. However, the image quality and resolution of the existing
digital dental systems is inferior to that of micro-CT.
CHAPTER 4. MINERAL CONCENTRATION OF TEETH BY MICRO-CT
31
To date, commercial micro-CT devices have been used successfully in dental research for
qualitative analysis and three-dimensional evaluation of materials as well as in dental
treatment procedures (Bergmans et al., 2001; Peters et al., 2003; Sohmura et al., 2004;
Wakabayashi et al., 2005). To our knowledge, quantitative evaluation of the mineral
concentration (MC) of dental tissues has not yet been investigated on a commercial device.
The aim of this study was to evaluate a commercial micro-CT system for the quantitative
analysis of MC at human enamel and dentin using different methodologies, and then compare
the obtained results with established data from published literature. In addition, this study
tested the null hypothesis that the equipment was sensitive enough to evaluate image data
without the need of any specimen preparation, such as the physical cutting of specimens into
thin sections. Our second hypothesis was that the equipment was sensitive enough to measure
the MCs of enamel and dentin after cutting the samples to 6-mm dentin thickness which
according to a published report was the critical thickness for radiographic evaluations at an
acceleration voltage of 32 keV (Dowker et al., 2003).
4.3 Materials and Methods
A total of 10 extracted third molars, extracted for orthodontic reasons, were selected from a
pool of teeth stored in thymol 0.1%. They were divided into two experimental groups: G1
(five whole permanent molars) and G2 (five permanent molars which were cut and ground to
6-mm dentin thickness (Leco VP100, LECO, Kirchheim, Germany). Enamel tissue from
vestibular and buccal sides was equally eliminated to reduce the very dense areas and to allow
better X-ray absorption through the samples.
CHAPTER 4. MINERAL CONCENTRATION OF TEETH BY MICRO-CT
32
4.3.1 X-ray microtomography system
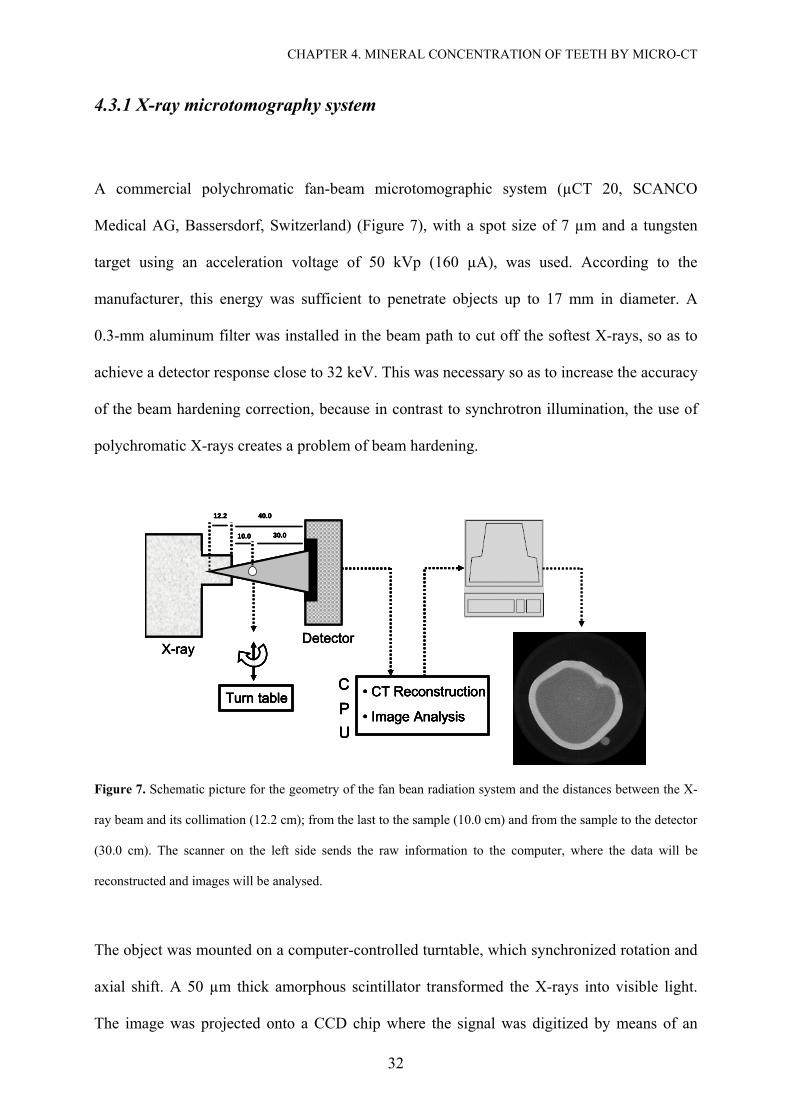
A commercial polychromatic fan-beam microtomographic system (µCT 20, SCANCO
Medical AG, Bassersdorf, Switzerland) (Figure 7), with a spot size of 7 µm and a tungsten
target using an acceleration voltage of 50 kVp (160 µA), was used. According to the
manufacturer, this energy was sufficient to penetrate objects up to 17 mm in diameter. A
0.3-mm aluminum filter was installed in the beam path to cut off the softest X-rays, so as to
achieve a detector response close to 32 keV. This was necessary so as to increase the accuracy
of the beam hardening correction, because in contrast to synchrotron illumination, the use of
polychromatic X-rays creates a problem of beam hardening.
X-rayDetector
12.2 40.0
30.010.0
• CT Reconstruction
• Image Analysis Turn table
CPU
X-rayDetector
12.2 40.0
30.010.0
• CT Reconstruction
• Image Analysis Turn table
CPU
X-rayDetector
12.2 40.0
30.010.0
• CT Reconstruction
• Image Analysis
• CT Reconstruction
• Image Analysis Turn tableTurn table
CPU
CPU
Figure 7. Schematic picture for the geometry of the fan bean radiation system and the distances between the X-
ray beam and its collimation (12.2 cm); from the last to the sample (10.0 cm) and from the sample to the detector
(30.0 cm). The scanner on the left side sends the raw information to the computer, where the data will be
reconstructed and images will be analysed.
The object was mounted on a computer-controlled turntable, which synchronized rotation and
axial shift. A 50 µm thick amorphous scintillator transformed the X-rays into visible light.
The image was projected onto a CCD chip where the signal was digitized by means of an
CHAPTER 4. MINERAL CONCENTRATION OF TEETH BY MICRO-CT
33
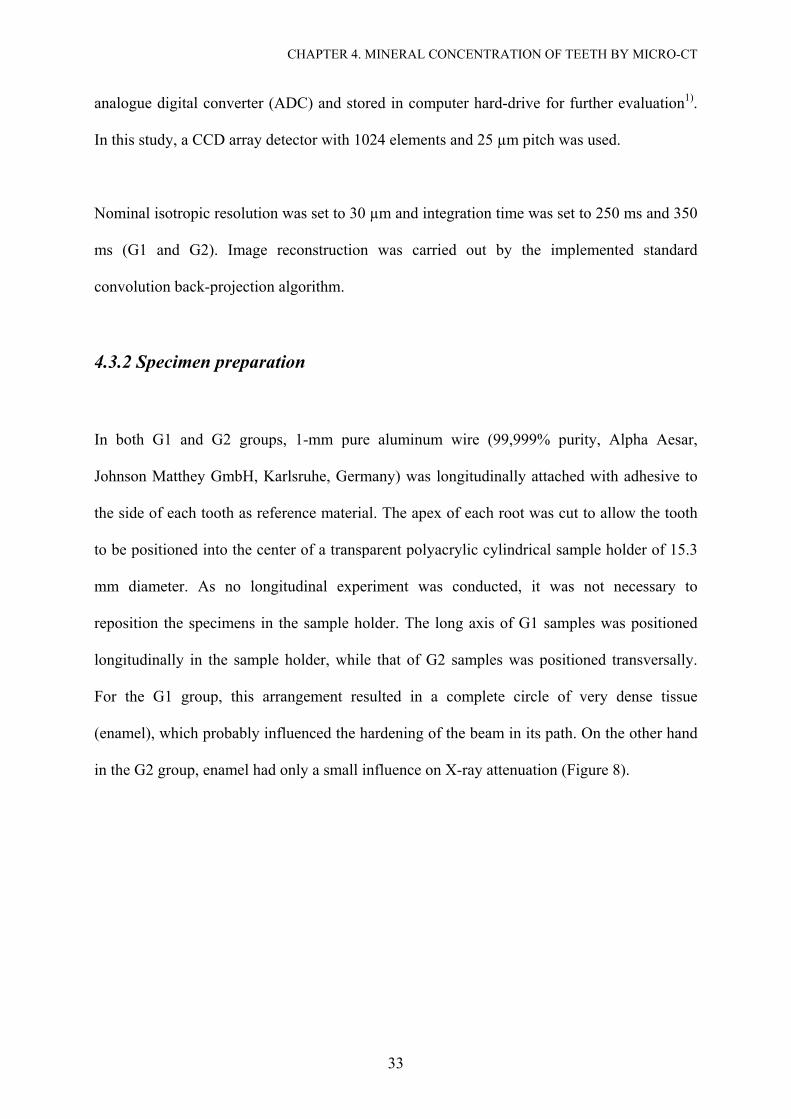
analogue digital converter (ADC) and stored in computer hard-drive for further evaluation1).
In this study, a CCD array detector with 1024 elements and 25 µm pitch was used.
Nominal isotropic resolution was set to 30 µm and integration time was set to 250 ms and 350
ms (G1 and G2). Image reconstruction was carried out by the implemented standard
convolution back-projection algorithm.
4.3.2 Specimen preparation
In both G1 and G2 groups, 1-mm pure aluminum wire (99,999% purity, Alpha Aesar,
Johnson Matthey GmbH, Karlsruhe, Germany) was longitudinally attached with adhesive to
the side of each tooth as reference material. The apex of each root was cut to allow the tooth
to be positioned into the center of a transparent polyacrylic cylindrical sample holder of 15.3
mm diameter. As no longitudinal experiment was conducted, it was not necessary to
reposition the specimens in the sample holder. The long axis of G1 samples was positioned
longitudinally in the sample holder, while that of G2 samples was positioned transversally.
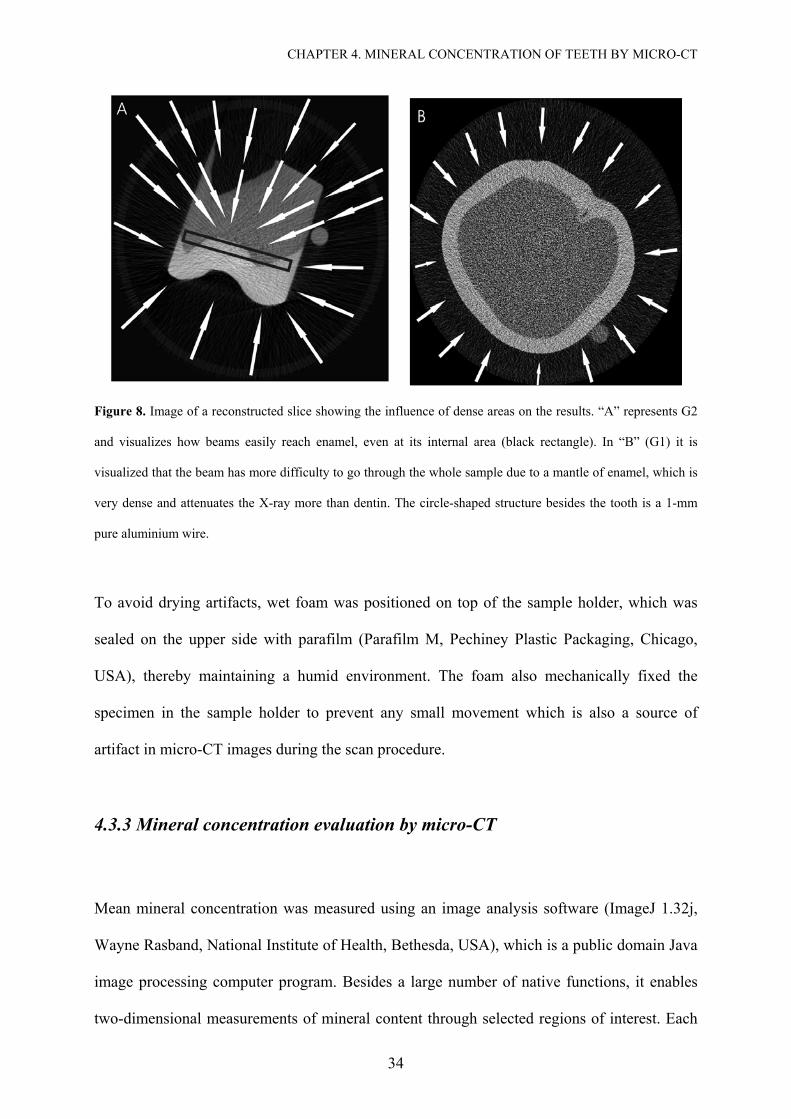
For the G1 group, this arrangement resulted in a complete circle of very dense tissue
(enamel), which probably influenced the hardening of the beam in its path. On the other hand
in the G2 group, enamel had only a small influence on X-ray attenuation (Figure 8).
CHAPTER 4. MINERAL CONCENTRATION OF TEETH BY MICRO-CT
34
Figure 8. Image of a reconstructed slice showing the influence of dense areas on the results. “A” represents G2
and visualizes how beams easily reach enamel, even at its internal area (black rectangle). In “B” (G1) it is
visualized that the beam has more difficulty to go through the whole sample due to a mantle of enamel, which is
very dense and attenuates the X-ray more than dentin. The circle-shaped structure besides the tooth is a 1-mm
pure aluminium wire.
To avoid drying artifacts, wet foam was positioned on top of the sample holder, which was
sealed on the upper side with parafilm (Parafilm M, Pechiney Plastic Packaging, Chicago,
USA), thereby maintaining a humid environment. The foam also mechanically fixed the
specimen in the sample holder to prevent any small movement which is also a source of
artifact in micro-CT images during the scan procedure.
4.3.3 Mineral concentration evaluation by micro-CT
Mean mineral concentration was measured using an image analysis software (ImageJ 1.32j,
Wayne Rasband, National Institute of Health, Bethesda, USA), which is a public domain Java
image processing computer program. Besides a large number of native functions, it enables
two-dimensional measurements of mineral content through selected regions of interest. Each
CHAPTER 4. MINERAL CONCENTRATION OF TEETH BY MICRO-CT
35
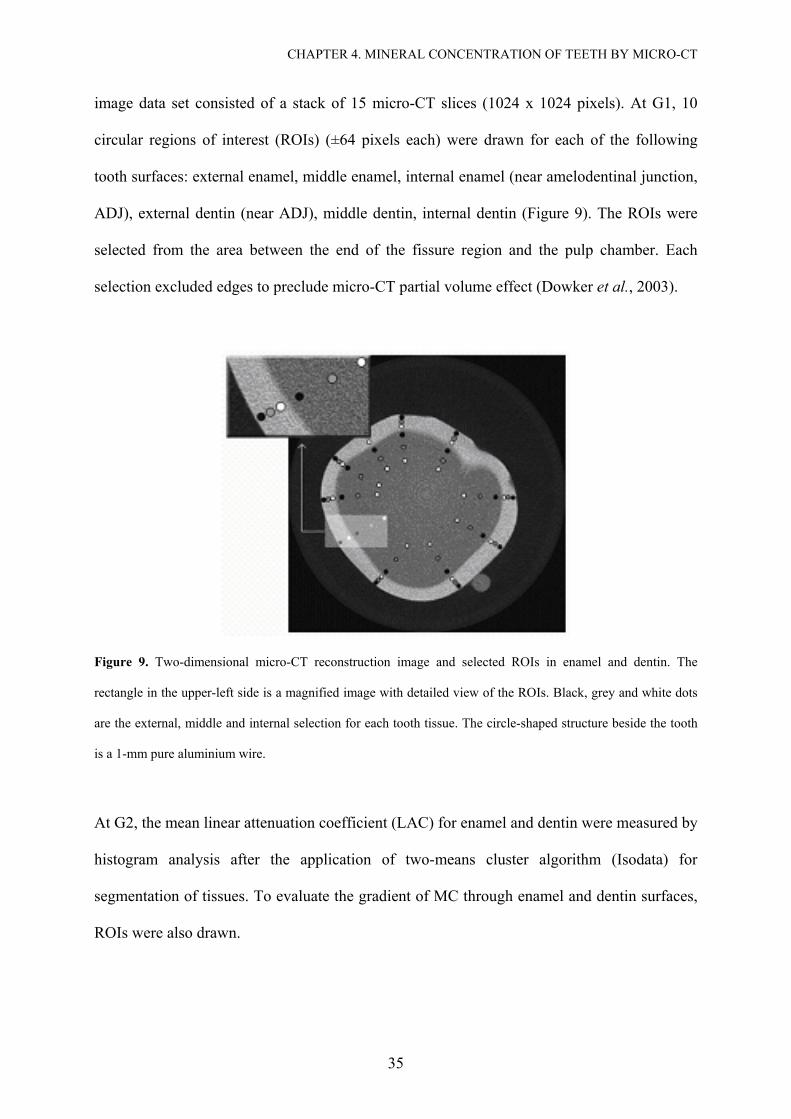
image data set consisted of a stack of 15 micro-CT slices (1024 x 1024 pixels). At G1, 10
circular regions of interest (ROIs) (±64 pixels each) were drawn for each of the following
tooth surfaces: external enamel, middle enamel, internal enamel (near amelodentinal junction,
ADJ), external dentin (near ADJ), middle dentin, internal dentin (Figure 9). The ROIs were
selected from the area between the end of the fissure region and the pulp chamber. Each
selection excluded edges to preclude micro-CT partial volume effect (Dowker et al., 2003).
Figure 9. Two-dimensional micro-CT reconstruction image and selected ROIs in enamel and dentin. The
rectangle in the upper-left side is a magnified image with detailed view of the ROIs. Black, grey and white dots
are the external, middle and internal selection for each tooth tissue. The circle-shaped structure beside the tooth
is a 1-mm pure aluminium wire.
At G2, the mean linear attenuation coefficient (LAC) for enamel and dentin were measured by
histogram analysis after the application of two-means cluster algorithm (Isodata) for
segmentation of tissues. To evaluate the gradient of MC through enamel and dentin surfaces,
ROIs were also drawn.
CHAPTER 4. MINERAL CONCENTRATION OF TEETH BY MICRO-CT
36
Through first order calibration, LAC corrections were made based on published values for
pure aluminum, which were obtained from the XCOM Photon Cross-Section database
program (National Institute of Standards and Technology, Gaithersburg, USA) (Berger,
1999).
Assuming the mineral content in enamel to be pure hydroxyapatite with a density of
3.15 g/cm3 (Angmar et al., 1963), measured LAC for enamel (LACe) was converted to MC
(Ce) (Wong et al., 2004) by the following formula:
mhapal
pubalmeC
µµµµ××
=)(
(4)
where µm is the LAC of mineral tissue, µ(pub) the LAC of aluminum wire from published data,
µal the measured LAC of the aluminum wire, and µmhap the mass LAC of hydroxyapatite (1.74
cm2/g at 32 keV) from published data.
Since the images were previously calibrated and that published data and measured data for
aluminum wire were the same, equation (4) can be simplified to:
mhap
meC
µµ
= (5)
CHAPTER 4. MINERAL CONCENTRATION OF TEETH BY MICRO-CT
37
4.3.4 Statistical analysis
After the mean (± standard deviation, SD) MC value for every surface of the tooth was
determined, one-way analysis of variance followed by Tukey’s multiple comparison post hoc
test were used to calculate the differences between the measuring sites. Overall significance
level was set at P<0.05. Student’s t-test was used to evaluate the significance of the MC
differences in enamel and dentin between G1 and G2. All statistical tests were performed with
SPSS version 12.0.1 (SPSS Inc. Headquarters, Chicago, Illinois, USA).
4.4. Results
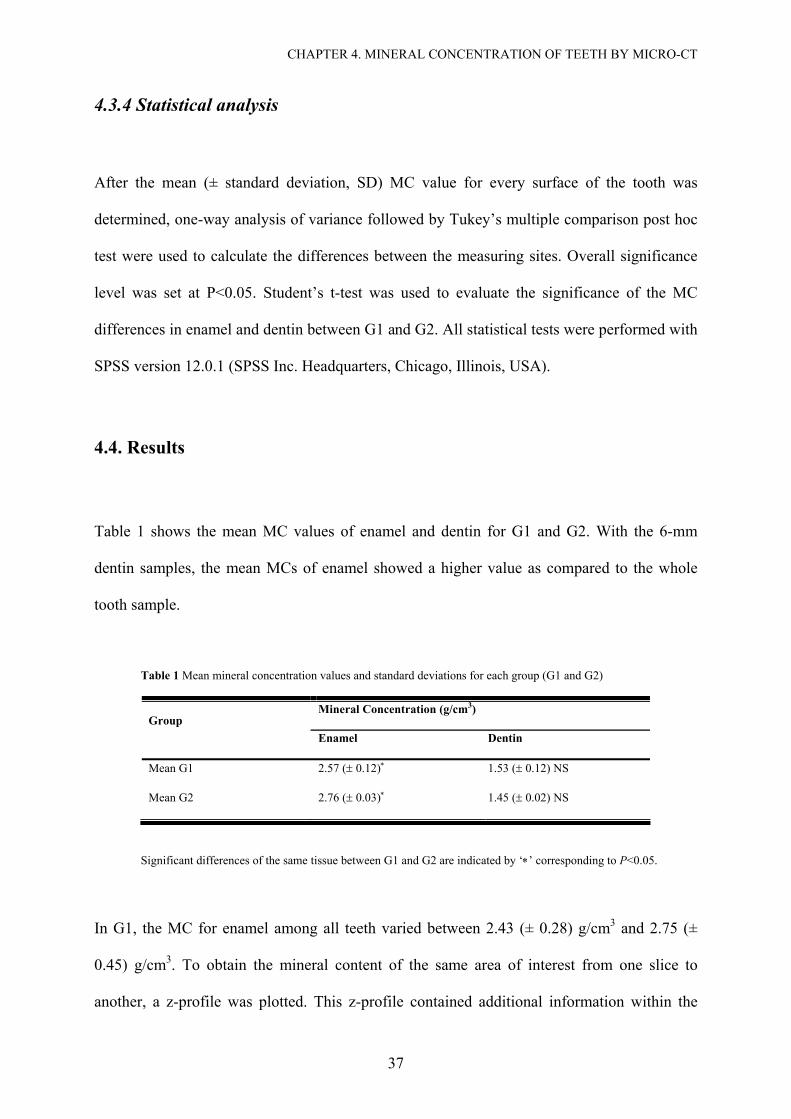
Table 1 shows the mean MC values of enamel and dentin for G1 and G2. With the 6-mm
dentin samples, the mean MCs of enamel showed a higher value as compared to the whole
tooth sample.
Table 1 Mean mineral concentration values and standard deviations for each group (G1 and G2)
Mineral Concentration (g/cm3) Group
Enamel Dentin
Mean G1 2.57 (± 0.12)∗ 1.53 (± 0.12) NS
Mean G2 2.76 (± 0.03)∗ 1.45 (± 0.02) NS
Significant differences of the same tissue between G1 and G2 are indicated by ‘∗’ corresponding to P<0.05.
In G1, the MC for enamel among all teeth varied between 2.43 (± 0.28) g/cm3 and 2.75 (±
0.45) g/cm3. To obtain the mineral content of the same area of interest from one slice to
another, a z-profile was plotted. This z-profile contained additional information within the
CHAPTER 4. MINERAL CONCENTRATION OF TEETH BY MICRO-CT
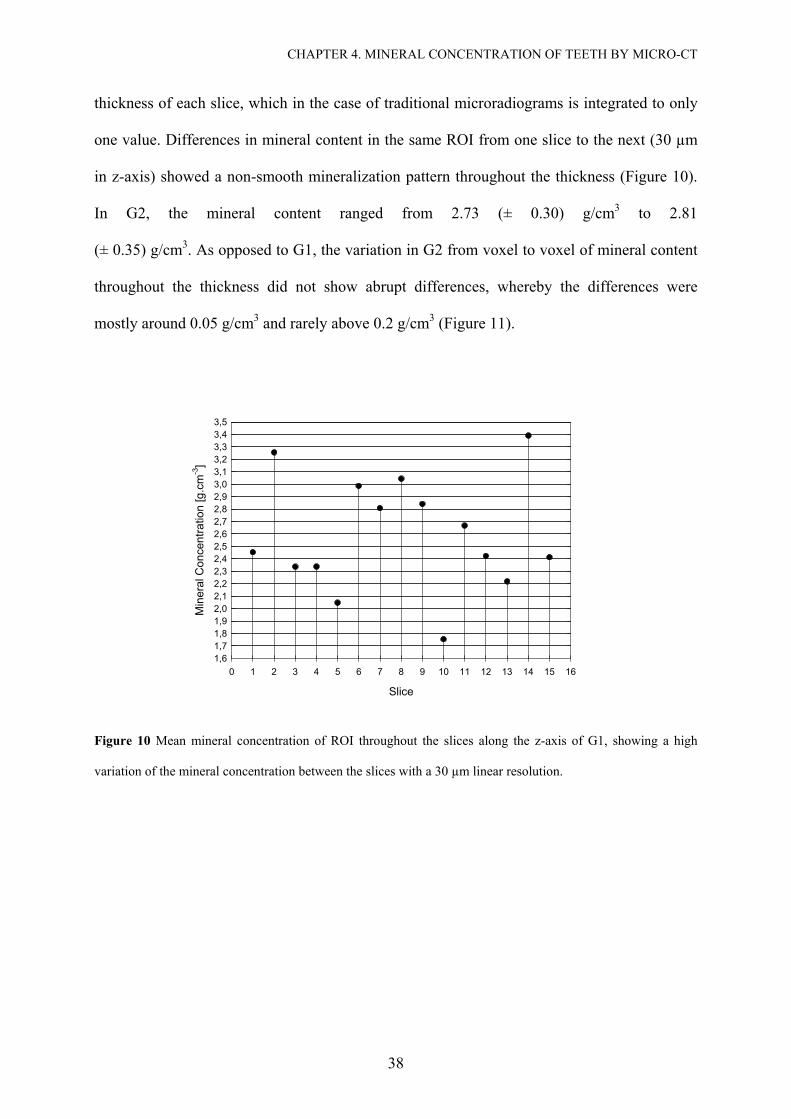
38
thickness of each slice, which in the case of traditional microradiograms is integrated to only
one value. Differences in mineral content in the same ROI from one slice to the next (30 µm
in z-axis) showed a non-smooth mineralization pattern throughout the thickness (Figure 10).
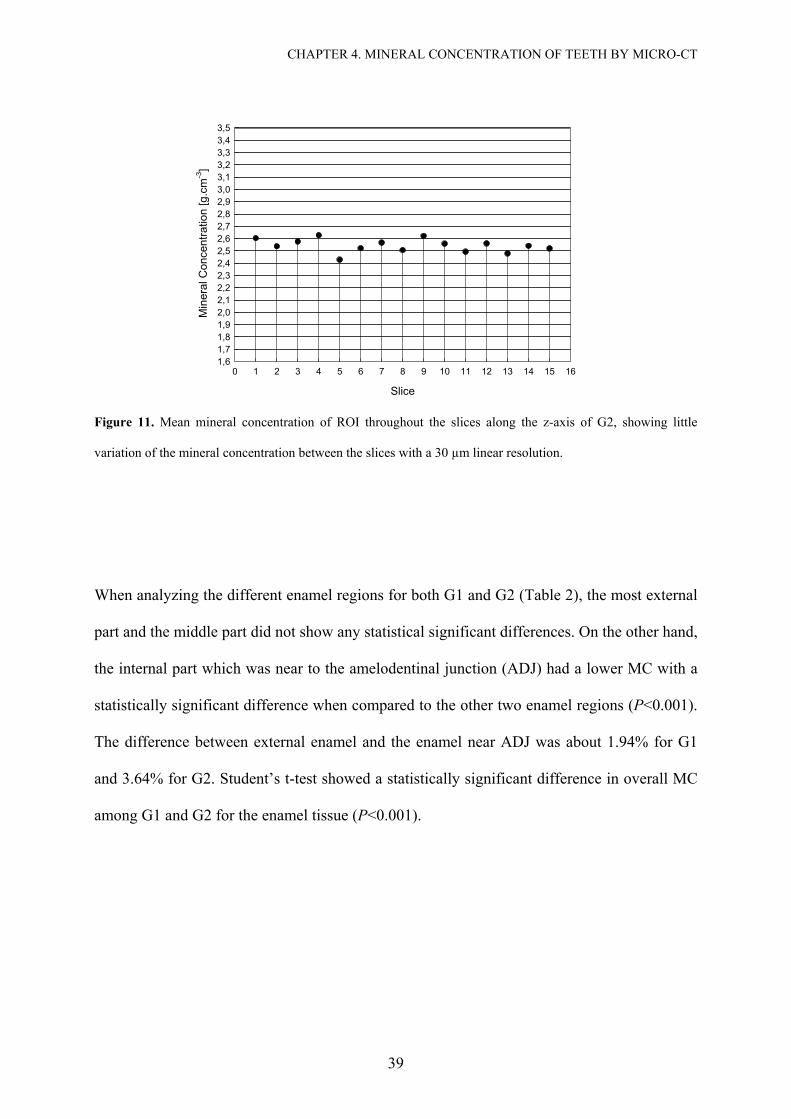
In G2, the mineral content ranged from 2.73 (± 0.30) g/cm3 to 2.81
(± 0.35) g/cm3. As opposed to G1, the variation in G2 from voxel to voxel of mineral content
throughout the thickness did not show abrupt differences, whereby the differences were
mostly around 0.05 g/cm3 and rarely above 0.2 g/cm3 (Figure 11).
Slice
0 1 2 3 4 5 6 7 8 9 10 11 12 13 14 15 16
Min
eral
Con
cent
ratio
n [g
.cm
-3]
1,61,71,81,92,02,12,22,32,42,52,62,72,82,93,03,13,23,33,43,5
Figure 10 Mean mineral concentration of ROI throughout the slices along the z-axis of G1, showing a high
variation of the mineral concentration between the slices with a 30 µm linear resolution.
CHAPTER 4. MINERAL CONCENTRATION OF TEETH BY MICRO-CT
39
Slice
0 1 2 3 4 5 6 7 8 9 10 11 12 13 14 15 16
Min
eral
Con
cent
ratio
n [g
.cm
-3]
1,61,71,81,92,02,12,22,32,42,52,62,72,82,93,03,13,23,33,43,5
Figure 11. Mean mineral concentration of ROI throughout the slices along the z-axis of G2, showing little
variation of the mineral concentration between the slices with a 30 µm linear resolution.
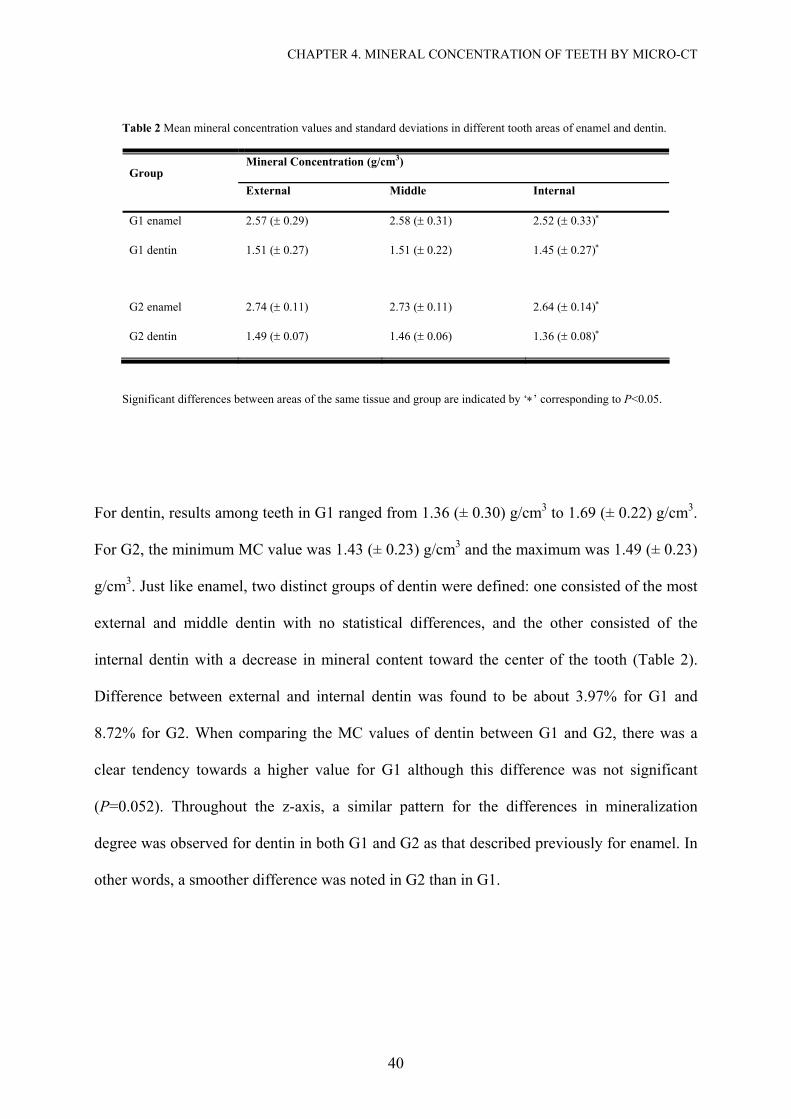
When analyzing the different enamel regions for both G1 and G2 (Table 2), the most external
part and the middle part did not show any statistical significant differences. On the other hand,
the internal part which was near to the amelodentinal junction (ADJ) had a lower MC with a
statistically significant difference when compared to the other two enamel regions (P<0.001).
The difference between external enamel and the enamel near ADJ was about 1.94% for G1
and 3.64% for G2. Student’s t-test showed a statistically significant difference in overall MC
among G1 and G2 for the enamel tissue (P<0.001).
CHAPTER 4. MINERAL CONCENTRATION OF TEETH BY MICRO-CT
40
Table 2 Mean mineral concentration values and standard deviations in different tooth areas of enamel and dentin.
Mineral Concentration (g/cm3) Group
External Middle Internal
G1 enamel 2.57 (± 0.29) 2.58 (± 0.31) 2.52 (± 0.33)∗
G1 dentin 1.51 (± 0.27) 1.51 (± 0.22) 1.45 (± 0.27)∗
G2 enamel 2.74 (± 0.11) 2.73 (± 0.11) 2.64 (± 0.14)∗
G2 dentin 1.49 (± 0.07) 1.46 (± 0.06) 1.36 (± 0.08)∗
Significant differences between areas of the same tissue and group are indicated by ‘∗’ corresponding to P<0.05.
For dentin, results among teeth in G1 ranged from 1.36 (± 0.30) g/cm3 to 1.69 (± 0.22) g/cm3.
For G2, the minimum MC value was 1.43 (± 0.23) g/cm3 and the maximum was 1.49 (± 0.23)
g/cm3. Just like enamel, two distinct groups of dentin were defined: one consisted of the most
external and middle dentin with no statistical differences, and the other consisted of the
internal dentin with a decrease in mineral content toward the center of the tooth (Table 2).
Difference between external and internal dentin was found to be about 3.97% for G1 and
8.72% for G2. When comparing the MC values of dentin between G1 and G2, there was a
clear tendency towards a higher value for G1 although this difference was not significant
(P=0.052). Throughout the z-axis, a similar pattern for the differences in mineralization
degree was observed for dentin in both G1 and G2 as that described previously for enamel. In
other words, a smoother difference was noted in G2 than in G1.
CHAPTER 4. MINERAL CONCENTRATION OF TEETH BY MICRO-CT
41
4.5 Discussion
In 1991, ten Bosch and Angmar-Månsson (ten Bosch and Angmar-Mansson, 1991) in a
detailed review of quantitative methods to determine mineral changes recommended the use
of radiographic methods to quantify mineral loss in whole teeth. The interest in radiation
techniques is due to the ability of X-rays to travel through matter without destroying the
specimens.
Currently, transverse microradiography (TMR) is considered as the ‘gold standard’ for the
determination of mineral loss in experimentally induced incipient lesions. The method has
been used for the comparison and validation of other newly developed caries diagnostic
techniques (Damen et al., 1997). A key disadvantage of microradiography lies in its
superimposition effect, such that any non-uniformities detected in the direction of the X-ray
beam are lost due to this effect. In addition, specimens need to be physically cut into thin
sections which are rather difficult and definitely destructive. This is especially so for brittle
materials or sections which include hard and soft regions such as caries lesions (Gao et al.,
1993). It has been reported that micro-CT requires no preparation of cut cross-sections
(Bergmans et al., 2001; Hahn et al., 2004), and that it enables longitudinal experiments to be
conducted in three-dimensional studies thereby overcoming the disadvantages of
microradiography. The aim of this study was to test a commercial micro-CT device for the
quantification of mineral content in tissues of a whole tooth or
6 mm-thick samples.
Our findings demonstrated that use of different methodologies led to different quantification
values of mineral content. In G2, mineral concentration values of enamel were in agreement
with past studies (Anderson et al., 1996; Angmar et al., 1963; Bergman and Lind, 1966;
CHAPTER 4. MINERAL CONCENTRATION OF TEETH BY MICRO-CT
42
Dowker et al., 2003; Dowker et al., 2004; Theuns et al., 1986; Wilson and Beynon, 1989); in
G1, statistically significant lower values were observed. The authors speculated that a few
factors had caused the observed differences in results: a higher exposure time, the positioning
of sample in the sample holder which can either facilitate or make it more difficult for the
beam to pass through the sample, and in particular the reduction of sample size by eliminating
the dense areas of enamel. Though we could not conclusively pinpoint which given factor
influenced the results most, it was thought to be more related to the size of the sample as it
highly affects the signal-to-noise ratio (Bonse and Busch, 1996; Wolfgang, 2001).
For the commercial device used in this study, it was recommended by the manufacturer to use
samples up to 17 mm in diameter. However, these recommended instructions are usually more
appropriate for bone studies. Recommendations for micro-CT analysis should be adjusted
accordingly to the porosity or density of the specimen itself. In this study, the tooth specimen
was an extreme compact mineral mass, thus attempt should be made to reduce the specimen
size. This was done in line with the general rule of thumb where the energy of
X-rays must be higher if the sample were thicker or denser (Bonse and Busch, 1996).
With regard to the analysis of different areas through the same tissue, neither Group G1 nor
G2 yielded a consistent, smooth gradient from the external layer for both enamel and dentin in
disagreement with that which was shown for enamel by Weatherell et al. (Weathere.Ja and
Weidmann, 1967). Robinson et al. (Robinson et al., 1971) showed that calcium and
phosphorus concentrations were relatively high in the middle layers of enamel, which may
explain the higher MC in this area for both groups in our experiment. A second possibility
could be the incapability of the device to clearly define the gradient through tooth tissues.
Nevertheless, lower values of mineralization were found in the innermost part of enamel, near
to ADJ, which was consistent with past experiments (Angmar et al., 1963; Dowker et al.,
CHAPTER 4. MINERAL CONCENTRATION OF TEETH BY MICRO-CT
43
2003; Wilson and Beynon, 1989). Many factors were associated with this gradient: variation
in calcium and phosphorus contents, organic matter, water, and possibly variation in porosity.
When analyzing the MC values of enamel in G1, abrupt variation from one slice to the next
(30 µm in z-axis) were seen throughout the thickness (Figure 10). These abrupt variations
could be attributed to the high coefficient of variation and noise artifacts associated with the
G1 settings. Hence, these abrupt changes were not observed in G2 (Figure 11) instead, the
changes along the z-axis of 6-mm samples were smoother and rarely abrupt.
For dentin, the internal layer also appeared to have a lower degree of mineralization. The
decrease in mineral content was already expected due to the following factors: greater amount
and diameter of the dentinal tubules, as well as higher portion of water and organic phase.
These factors clearly reduced the attenuation of X-rays from the ADJ to the internal layers of
dentin. Similar results were already observed with micro-CT by Hayakawa et al. (Hayakawa
et al., 2000). However, these results disagreed with those of Anderson et al. (Anderson et al.,
1996), whereby a lower mineralization degree was indicated at the ADJ (1.42 g/cm3) and a
higher degree in deeper dentin (1.50 g/cm3) using a non-commercial micro-CT device.
With the first-generation micro-CT system, practicable measurements of mineral content were
limited to a small number of ‘slices’ through lesions formed in cut blocks with a 2x2.5 mm2
cross-section (Dowker et al., 2003). This need to physically cut specimens in order to measure
mineral concentration ran contrary to one of the greatest advantages of the micro-CT system.
In the present study which used a commercial, second-generation micro-CT device, it was
once again shown that whole teeth are not recommended for quantification of mineral content.
Thus, it is strongly recommended to consider the limited acceleration voltage of the µCT 20
system and to limit sample evaluation to 6-mm thickness which is already an advantage over
CHAPTER 4. MINERAL CONCENTRATION OF TEETH BY MICRO-CT
44
other analytic approaches which require the preparation of very thin, micrometric-sized
samples. Concerning the accuracy of this device for longitudinal studies to quantify mineral
changes, validation studies should be performed in order to provide the important
supplementary information about the dynamics of treatment.
Part II
µCT vs. TMR:
A Validation Study
46
Chapter 5
Measurement of Natural Caries Lesion by
Quantitative Microradiography and Micro-
Computed Tomography:
A Correlation Study
5.1 Abstract
The aim of the current study was to investigate the correlation between micro-computed
tomography and transverse microradiography. Therefore lesion depth and mineral loss of 13
natural enamel carious lesions were evaluated by both methods. In order to measure exactly
the same slice in both methods, a special sample holder was prepared. For the TMR analysis
start of lesion was defined as 20 vol%. However, for the micro-CT analysis four parameters
were tested and compared for the start of the lesion; 0 vol% (G1), 20 vol% (G2), 25 vol%
(G3) and 30 vol% (G4). After single factor analyses of variance (ANOVA), no significant
statistical differences were found between the micro-CT groups; however, higher standard
deviation was seen in G1. A strong Pearson correlation was found between micro-CT and
TMR measurements. The following correlation coefficients were obtained for each group;
mineral loss: 0.898, 0.928, 0.925, 0.917; lesion depth: 0.874, 0.854, 0.864, 0.879. It is
CHAPTER 5: TMR X MICRO-CT: A CORRELATION STUDY
47
concluded that micro-CT can be used to measure mineral profiles through natural enamel
carious lesions and a normalization of the start of the lesion at 20 vol% is meanfull for micro-
CT evaluations.
5.2 Introduction
Over the past years there have been attempts to improve the development of techniques for
caries detection and quantification. Ideally a method should be non-destructive in order to
provide an insight into the dynamics of the procedure of interest, allowing longitudinal studies
to be applied. Respective to the definition of caries as a non-static process, with
disequilibrium of the de/remineralization balance, which leads to a mineral loss, the use of
techniques that enable the tracking of mineral changes is desirable. The use of hardness
measurements, polarizing light microscopy and conventional microradiography seems to be
unsuitable for this purpose (Herkstroter et al., 1990).
The direct relationship of radiographic methods to mineral loss and the feasibility to evaluate
a large volume of data, including three-dimensional information, have increased the interest in
micro-computed tomography (micro-CT). Further, because sectioning of samples seems to be
a factor of variation and because of the increased demand of non-destructive methods, which
enables measurements in whole tooth samples (ten Bosch and Angmar-Mansson, 1991), X-
ray micro-computed tomography was considered for a future method of choice in validation
studies (Huysmans and Longbottom, 2004).
The principle of micro-CT consists in reconstructing the linear attenuation coefficient, within
an object, from measurements of the attenuation of an x-ray beam passing through the sample
CHAPTER 5: TMR X MICRO-CT: A CORRELATION STUDY
48
at different viewing angles (Anderson et al., 1996; Salome et al., 1999). Each element of the
projection is a line integral of the linear attenuation coefficient in the sample along the x-ray
beam path (Salome et al., 1999). A map of the linear attenuation coefficient can then be
recovered from these line integrals using suitable reconstruction algorithms (Bonse and
Busch, 1996; Kak and Slaney, 1988). Differences in linear attenuation coefficients among
tissues are responsible for the X-ray image contrast.
Transverse microradiography (TMR) is, in these days, the most widely used method for
validation of diagnostic methods (Huysmans and Longbottom, 2004). A few studies have
been performed to evaluate enamel lesions by micro-CT and TMR (Dowker et al., 2003;
Dowker et al., 2004; Gao et al., 1993). Although these studies agree on the potential of micro-
CT to give new insights into the demineralization process, according to Dowker et al. (2003),
the mineral distribution observed from TMR line profiles will differ from those evaluated by
micro-CT due to the differences of spatial resolution between both methods.
Considering both methods (Table 3), micro-CT works with higher energy, which allows
scanning thicker samples, compared to TMR. Border artifacts and beam hardening, however
represent some challenge in micro-CT analysis. As also recommended in TMR studies, a
threshold at the beginning of the lesion could be necessary in order to meet a standard of the
analysis, specially concerning to evaluations of lesion depth. Damen et al. (1997) have shown
that a TMR image should be normalized by setting a threshold of 20 V% for the beginning of
the lesion.
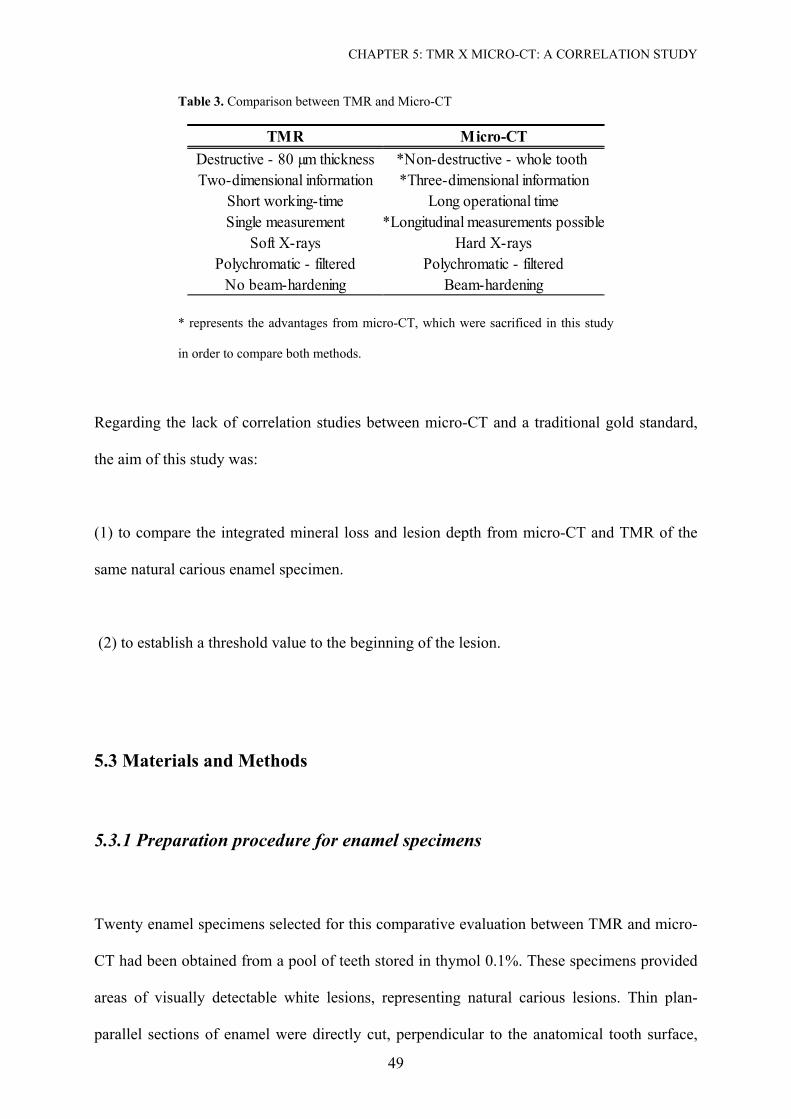
CHAPTER 5: TMR X MICRO-CT: A CORRELATION STUDY
49
Table 3. Comparison between TMR and Micro-CT
TMR Micro-CTDestructive - 80 µm thickness *Non-destructive - whole tooth Two-dimensional information *Three-dimensional information
Short working-time Long operational timeSingle measurement *Longitudinal measurements possible
Soft X-rays Hard X-raysPolychromatic - filtered Polychromatic - filtered
No beam-hardening Beam-hardening
* represents the advantages from micro-CT, which were sacrificed in this study
in order to compare both methods.
Regarding the lack of correlation studies between micro-CT and a traditional gold standard,
the aim of this study was:
(1) to compare the integrated mineral loss and lesion depth from micro-CT and TMR of the
same natural carious enamel specimen.
(2) to establish a threshold value to the beginning of the lesion.
5.3 Materials and Methods
5.3.1 Preparation procedure for enamel specimens
Twenty enamel specimens selected for this comparative evaluation between TMR and micro-
CT had been obtained from a pool of teeth stored in thymol 0.1%. These specimens provided
areas of visually detectable white lesions, representing natural carious lesions. Thin plan-
parallel sections of enamel were directly cut, perpendicular to the anatomical tooth surface,
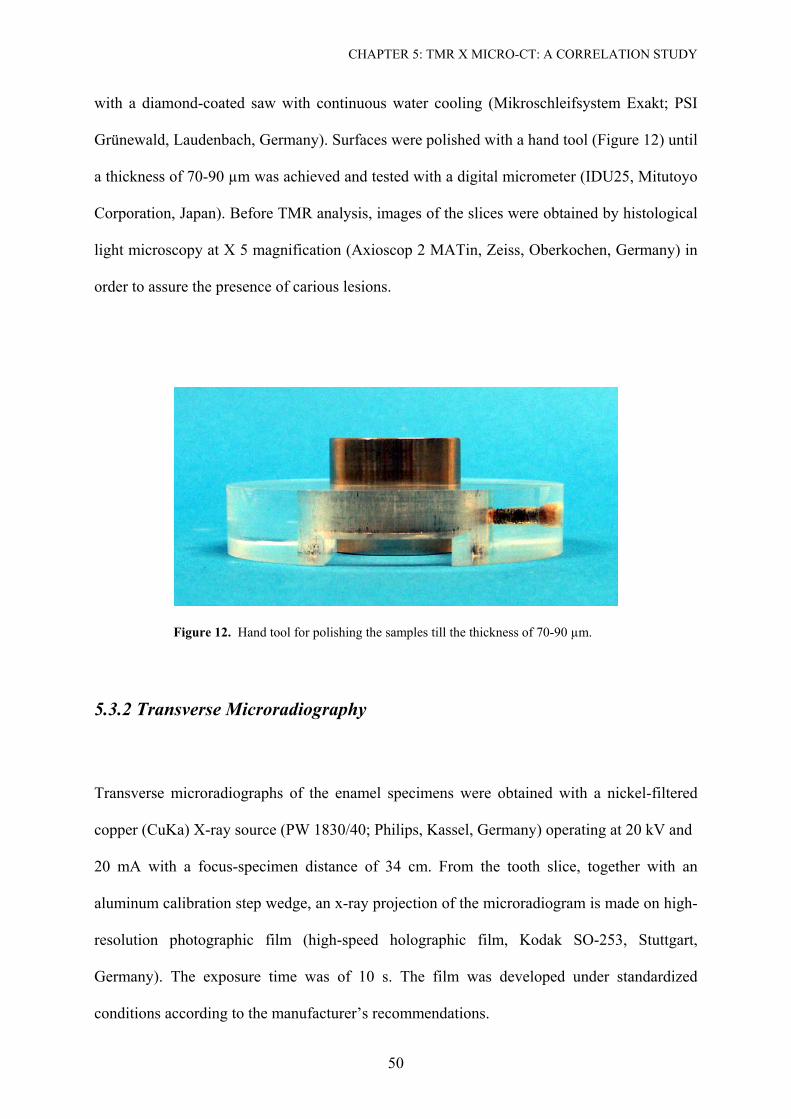
CHAPTER 5: TMR X MICRO-CT: A CORRELATION STUDY
50
with a diamond-coated saw with continuous water cooling (Mikroschleifsystem Exakt; PSI
Grünewald, Laudenbach, Germany). Surfaces were polished with a hand tool (Figure 12) until
a thickness of 70-90 µm was achieved and tested with a digital micrometer (IDU25, Mitutoyo
Corporation, Japan). Before TMR analysis, images of the slices were obtained by histological
light microscopy at X 5 magnification (Axioscop 2 MATin, Zeiss, Oberkochen, Germany) in
order to assure the presence of carious lesions.
Figure 12. Hand tool for polishing the samples till the thickness of 70-90 µm.
5.3.2 Transverse Microradiography
Transverse microradiographs of the enamel specimens were obtained with a nickel-filtered
copper (CuKa) X-ray source (PW 1830/40; Philips, Kassel, Germany) operating at 20 kV and
20 mA with a focus-specimen distance of 34 cm. From the tooth slice, together with an
aluminum calibration step wedge, an x-ray projection of the microradiogram is made on high-
resolution photographic film (high-speed holographic film, Kodak SO-253, Stuttgart,
Germany). The exposure time was of 10 s. The film was developed under standardized
conditions according to the manufacturer’s recommendations.
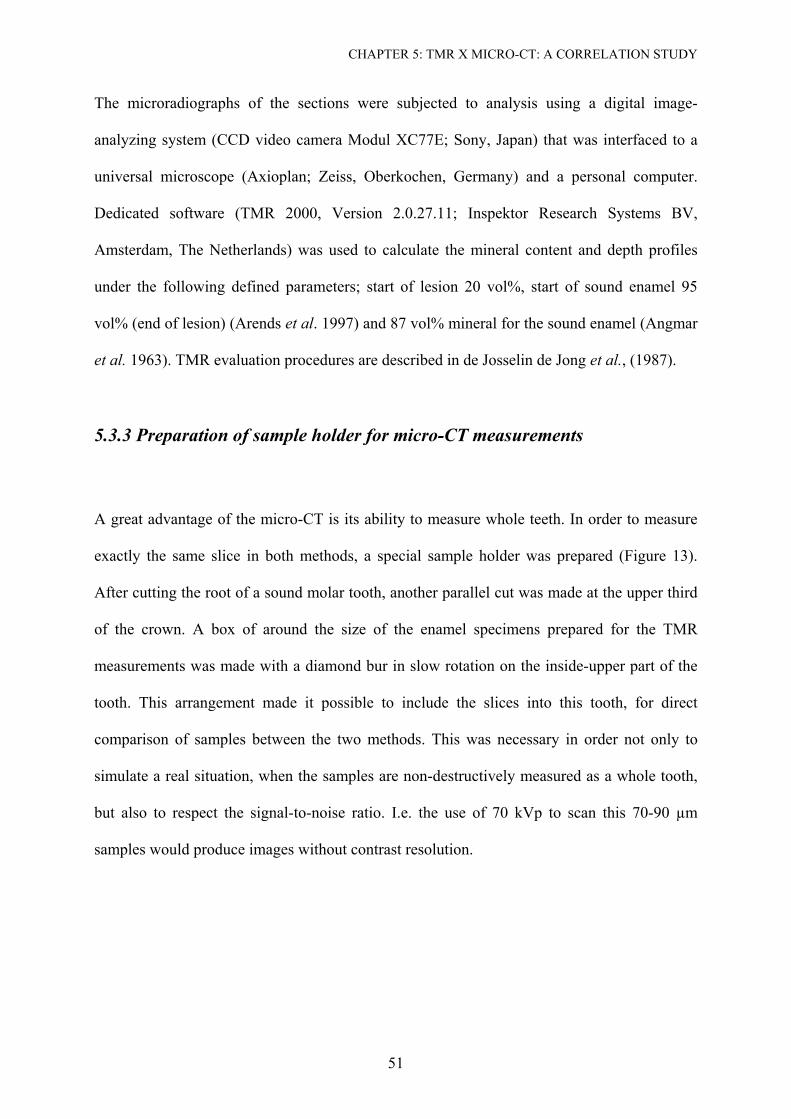
CHAPTER 5: TMR X MICRO-CT: A CORRELATION STUDY
51
The microradiographs of the sections were subjected to analysis using a digital image-
analyzing system (CCD video camera Modul XC77E; Sony, Japan) that was interfaced to a
universal microscope (Axioplan; Zeiss, Oberkochen, Germany) and a personal computer.
Dedicated software (TMR 2000, Version 2.0.27.11; Inspektor Research Systems BV,
Amsterdam, The Netherlands) was used to calculate the mineral content and depth profiles
under the following defined parameters; start of lesion 20 vol%, start of sound enamel 95
vol% (end of lesion) (Arends et al. 1997) and 87 vol% mineral for the sound enamel (Angmar
et al. 1963). TMR evaluation procedures are described in de Josselin de Jong et al., (1987).
5.3.3 Preparation of sample holder for micro-CT measurements
A great advantage of the micro-CT is its ability to measure whole teeth. In order to measure
exactly the same slice in both methods, a special sample holder was prepared (Figure 13).
After cutting the root of a sound molar tooth, another parallel cut was made at the upper third
of the crown. A box of around the size of the enamel specimens prepared for the TMR
measurements was made with a diamond bur in slow rotation on the inside-upper part of the
tooth. This arrangement made it possible to include the slices into this tooth, for direct
comparison of samples between the two methods. This was necessary in order not only to
simulate a real situation, when the samples are non-destructively measured as a whole tooth,
but also to respect the signal-to-noise ratio. I.e. the use of 70 kVp to scan this 70-90 µm
samples would produce images without contrast resolution.
CHAPTER 5: TMR X MICRO-CT: A CORRELATION STUDY
52
TMR sampleTMR sample
X-ray beam
TMR sampleTMR sample
X-ray beam
Figure 13. Schematic of the tooth used to position the samples to be scanned by micro-CT,
which were prepared for TMR measurement This procedure simulated a situation of whole
tooth measurements by micro-CT and enabled comparison of exactly the same slice in both
method (TMR x micro-CT).
5.3.4 Micro-Computed Tomography
Samples were scanned with a small-angle-cone-beam micro-CT (µCT 40; Scanco Medical
AG, Bassersdorf, Switzerland) at 70 kVp and 114 µA, at a linear isotropic resolution of 8 µm.
A 0.5mm aluminum filter was installed in the beam path to cut off the softest x-rays resulting
in a detector response close to 31 keV. This was necessary to increase the accuracy of the
beam-hardening correction, because in contrast to a synchrotron illumination, the use of
polychromatic x-rays creates the problem of beam hardening.
The equipment used in this experiment offers some modalities of beam-hardening correction,
through linearization technique by adding polynomial correction values to the measured
projections. After pre-experiments, these correction values were best determined by scanning
a homogeneous hydroxyapatite wedge of known density of 1200 mg HA cm-3. The scanned
wedge projection was compared to an ideal (monochromatic) projection (straight line for a
wedge), and the difference between measured wedge projection and ideal projection was
CHAPTER 5: TMR X MICRO-CT: A CORRELATION STUDY
53
fitted with a third order polynomial. This polynomial was used as the beam hardening
correction function for subsequent tooth scans.
A hydroxyapatite phantom was also used to check the calibration of the system. Five different
known densities were used (0, 100, 200, 400 and 800 mg/cm3). Analyses of their attenuation
coefficient and density values as well as their standard deviation were checked weekly to
assure the stability of the X-ray tube.
For the scanning procedures each specimen was positioned into a transparent polyacrylic
cylindrical sample holder of 16.4 mm diameter and mounted on a computer-controlled
turntable, which synchronized rotation and axial shift. At an integration time of 3 s, 1000
projections were taken over 180°. Therefore 200 slices were selected, positioning the area of
interest in the center of the stack (Figure 13). This procedure insured that the most
perpendicular beams were achieving the sample. A 50 µm thick amorphous scintillator
transformed the X-rays into visible-light. The image was projected onto a CCD-array-detector
(2048 x 252 elements and 24 µm pitches) where the signal was digitized by means of an
analogue digital converter (ADC) and stored to computer hard-drive for further evaluation.
Reconstructions of the images were carried out by cone-beam algorithms in 2048 x 2048
pixels matrixes.
From the micro-CT stack, one slice of 8 µm z-axis resolution from each specimen was
selected for the comparison purpose. The whole sample could not be evaluated by integration
of all slices due to the tilting of the sample into the sample holder and consequent formation
of artifacts, represented by shadows for one slice to the other in different areas of the images
(Figure 14).
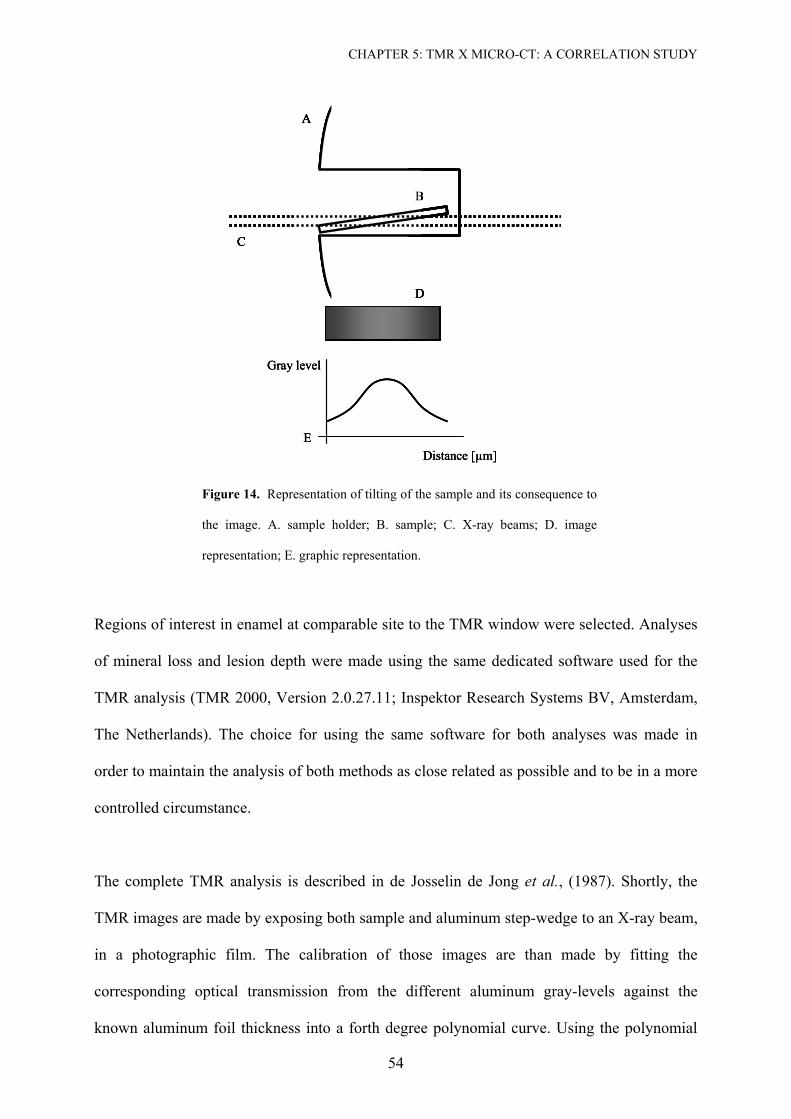
CHAPTER 5: TMR X MICRO-CT: A CORRELATION STUDY
54
A
B
C
D
Distance [µm]
Gray level
E
A
B
C
D
A
B
C
A
B
C
DD
Distance [µm]
Gray level
EDistance [µm]
Gray level
E
Figure 14. Representation of tilting of the sample and its consequence to
the image. A. sample holder; B. sample; C. X-ray beams; D. image
representation; E. graphic representation.
Regions of interest in enamel at comparable site to the TMR window were selected. Analyses
of mineral loss and lesion depth were made using the same dedicated software used for the
TMR analysis (TMR 2000, Version 2.0.27.11; Inspektor Research Systems BV, Amsterdam,
The Netherlands). The choice for using the same software for both analyses was made in
order to maintain the analysis of both methods as close related as possible and to be in a more
controlled circumstance.
The complete TMR analysis is described in de Josselin de Jong et al., (1987). Shortly, the
TMR images are made by exposing both sample and aluminum step-wedge to an X-ray beam,
in a photographic film. The calibration of those images are than made by fitting the
corresponding optical transmission from the different aluminum gray-levels against the
known aluminum foil thickness into a forth degree polynomial curve. Using the polynomial
CHAPTER 5: TMR X MICRO-CT: A CORRELATION STUDY
55
function – p(T) – it is calculated the corresponding thickness aluminum thickness – tAl, slice (x)
– for all values of optical film transmission and subsequently the thickness of the slice –
Tslice(x) – for the position x of the tooth slice.
[ ](x)Tp(x),t slicesliceAl = [m] ( 5)
Later, the absorbance of the tooth slice – An, slice(x) – at each position (x) can be calculated
according to the equation:
(x)t(x)A slice Al, slice n, Alµ= (6 )
Where µAl = 13.13 x 10+3 (m-1) at monochromatic CuKα X-ray radiation (λ = 0.154 nm). (Int.
Tables for X-ray crystallography, 1962).
The mineral volume percentage (V%) at position x is then calculated using the formula from
Angmar et al. (1963):
⎟⎟⎠
⎞⎜⎜⎝
⎛−
−=
om
oslicen txAxVµµ
µ/)(100)( , [vol %] ( 7)
Where t is the slice thickness; µm is the linear attenuation coefficient of mineral (26.6x10+3
m-1, from crystallographic data of Young and Brown, 1983 and Int. Tables for X-ray
crystallography, 1962), which is assumed to be pure hydroxyapatite [Ca10(PO4)6(OH)2]; µo is
the linear attenuation coefficient of organic material with water inside the tooth (1.13x10+3 m-
1, from Angmar et al. 1963) at monochromatic CuKα X-ray radiation (λ = 0.154 nm).
CHAPTER 5: TMR X MICRO-CT: A CORRELATION STUDY
56
As no step wedge calibration was used simultaneously within the micro-CT scans and this is
mandatory for the evaluations in the software used in this study, it was necessary to simulate
an aluminum step-wedge. Therefore, four grades of gray levels were conceded by the
software manufacture and adapted for this analysis purpose. Also the resolution of the micro-
CT could not be adjusted into the evaluation software. This resulted in relative values for our
micro-CT analysis, which do not agree to the TMR evaluation values, but it is enough to
answer the question of this study, if both equipments have or not any correlation, before
further efforts are made in order to calibrate the system for this purpose.
The effect from border artifacts was tested by selecting four different parameters as thresholds
points for the micro-CT evaluation (Figure 15):
Group 1. Start of lesion 0 vol%, start of sound enamel 95 vol% (end of lesion) and 87
vol% mineral for the sound enamel.
Group 2. Start of lesion 20 vol%, start of sound enamel 95 vol% (end of lesion) and 87
vol% mineral for the sound enamel.
Group 3. Start of lesion 25 vol%, start of sound enamel 95 vol% (end of lesion) and 87
vol% mineral for the sound enamel.
Group 4. Start of lesion 30 vol%, start of sound enamel 95 vol% (end of lesion) and 87
vol% mineral for the sound enamel.
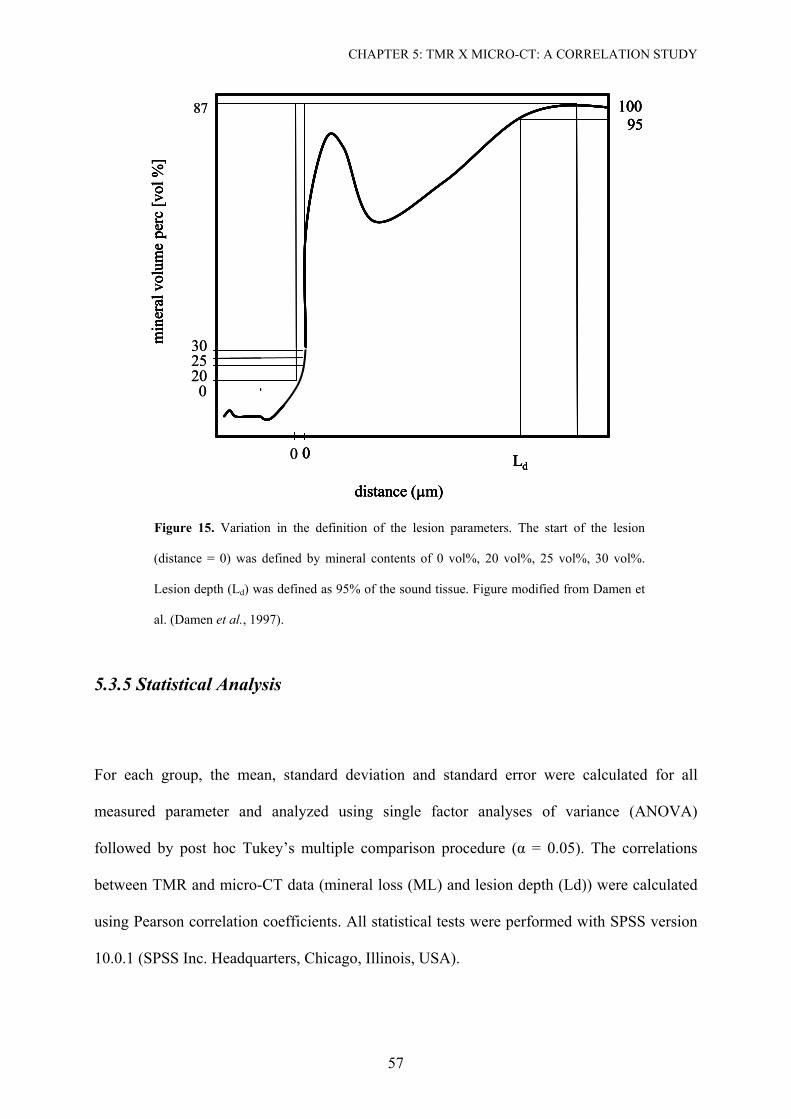
CHAPTER 5: TMR X MICRO-CT: A CORRELATION STUDY
57
0
distance (µm)
30
10095
min
eral
vol
ume
perc
[vol
%]
Ld0
distance (µm)
0
2520
10095
min
eral
vol
ume
perc
[vol
%]
Ld
87
0 0
distance (µm)
30
10095
min
eral
vol
ume
perc
[vol
%]
Ld0
distance (µm)
0
2520
10095
min
eral
vol
ume
perc
[vol
%]
Ld
87
0
Figure 15. Variation in the definition of the lesion parameters. The start of the lesion
(distance = 0) was defined by mineral contents of 0 vol%, 20 vol%, 25 vol%, 30 vol%.
Lesion depth (Ld) was defined as 95% of the sound tissue. Figure modified from Damen et
al. (Damen et al., 1997).
5.3.5 Statistical Analysis
For each group, the mean, standard deviation and standard error were calculated for all
measured parameter and analyzed using single factor analyses of variance (ANOVA)
followed by post hoc Tukey’s multiple comparison procedure (α = 0.05). The correlations
between TMR and micro-CT data (mineral loss (ML) and lesion depth (Ld)) were calculated
using Pearson correlation coefficients. All statistical tests were performed with SPSS version
10.0.1 (SPSS Inc. Headquarters, Chicago, Illinois, USA).
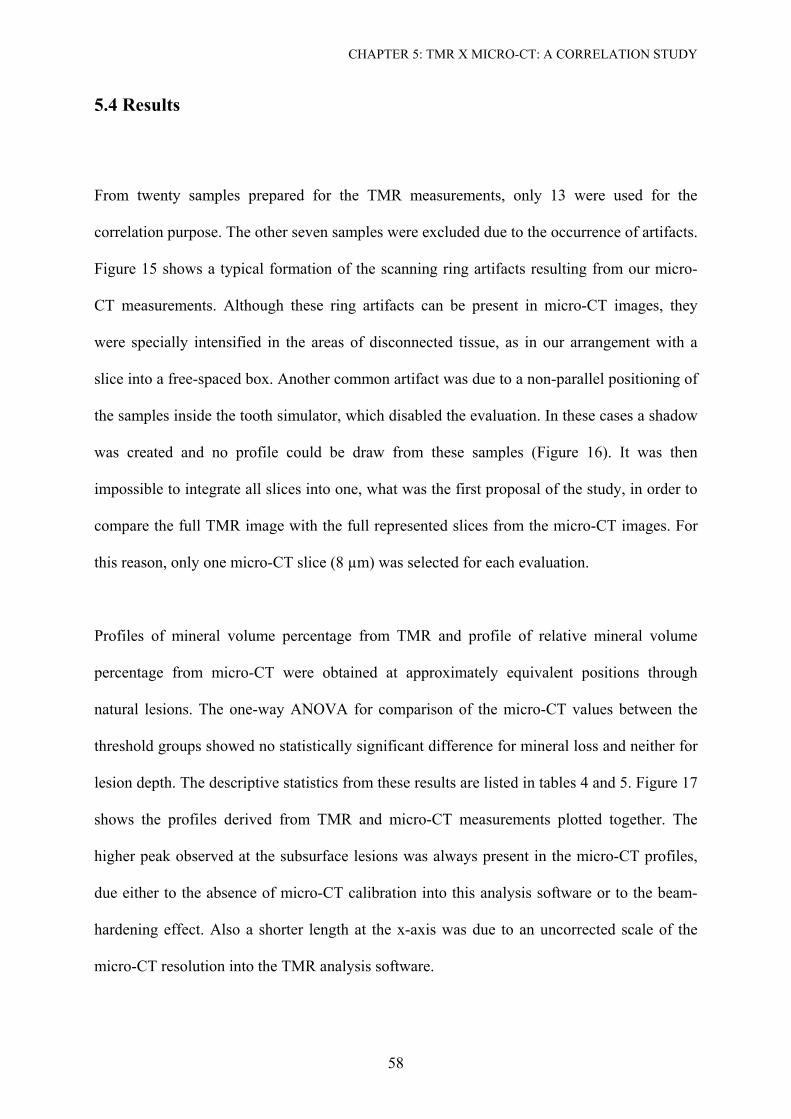
CHAPTER 5: TMR X MICRO-CT: A CORRELATION STUDY
58
5.4 Results
From twenty samples prepared for the TMR measurements, only 13 were used for the
correlation purpose. The other seven samples were excluded due to the occurrence of artifacts.
Figure 15 shows a typical formation of the scanning ring artifacts resulting from our micro-
CT measurements. Although these ring artifacts can be present in micro-CT images, they
were specially intensified in the areas of disconnected tissue, as in our arrangement with a
slice into a free-spaced box. Another common artifact was due to a non-parallel positioning of
the samples inside the tooth simulator, which disabled the evaluation. In these cases a shadow
was created and no profile could be draw from these samples (Figure 16). It was then
impossible to integrate all slices into one, what was the first proposal of the study, in order to
compare the full TMR image with the full represented slices from the micro-CT images. For
this reason, only one micro-CT slice (8 µm) was selected for each evaluation.
Profiles of mineral volume percentage from TMR and profile of relative mineral volume
percentage from micro-CT were obtained at approximately equivalent positions through
natural lesions. The one-way ANOVA for comparison of the micro-CT values between the
threshold groups showed no statistically significant difference for mineral loss and neither for
lesion depth. The descriptive statistics from these results are listed in tables 4 and 5. Figure 17
shows the profiles derived from TMR and micro-CT measurements plotted together. The
higher peak observed at the subsurface lesions was always present in the micro-CT profiles,
due either to the absence of micro-CT calibration into this analysis software or to the beam-
hardening effect. Also a shorter length at the x-axis was due to an uncorrected scale of the
micro-CT resolution into the TMR analysis software.
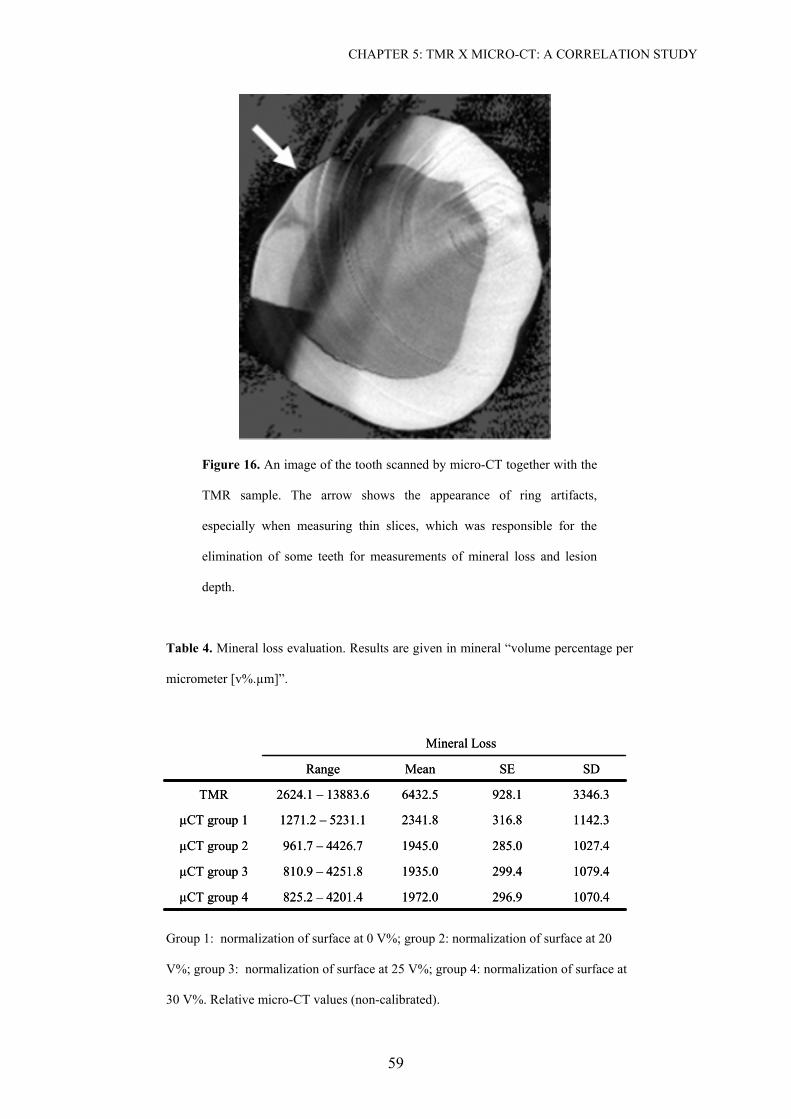
CHAPTER 5: TMR X MICRO-CT: A CORRELATION STUDY
59
Figure 16. An image of the tooth scanned by micro-CT together with the
TMR sample. The arrow shows the appearance of ring artifacts,
especially when measuring thin slices, which was responsible for the
elimination of some teeth for measurements of mineral loss and lesion
depth.
Table 4. Mineral loss evaluation. Results are given in mineral “volume percentage per
micrometer [v%.µm]”.
1142.3316.82341.81271.2 – 5231.1µCT group 1
1070.4296.91972.0825.2 – 4201.4µCT group 4
1079.4299.41935.0810.9 – 4251.8µCT group 3
1027.4285.01945.0961.7 – 4426.7µCT group 2
3346.3928.16432.52624.1 – 13883.6TMR
SDSEMeanRange
Mineral Loss
1142.3316.82341.81271.2 – 5231.1µCT group 1
1070.4296.91972.0825.2 – 4201.4µCT group 4
1079.4299.41935.0810.9 – 4251.8µCT group 3
1027.4285.01945.0961.7 – 4426.7µCT group 2
3346.3928.16432.52624.1 – 13883.6TMR
SDSEMeanRange
Mineral Loss
Group 1: normalization of surface at 0 V%; group 2: normalization of surface at 20
V%; group 3: normalization of surface at 25 V%; group 4: normalization of surface at
30 V%. Relative micro-CT values (non-calibrated).
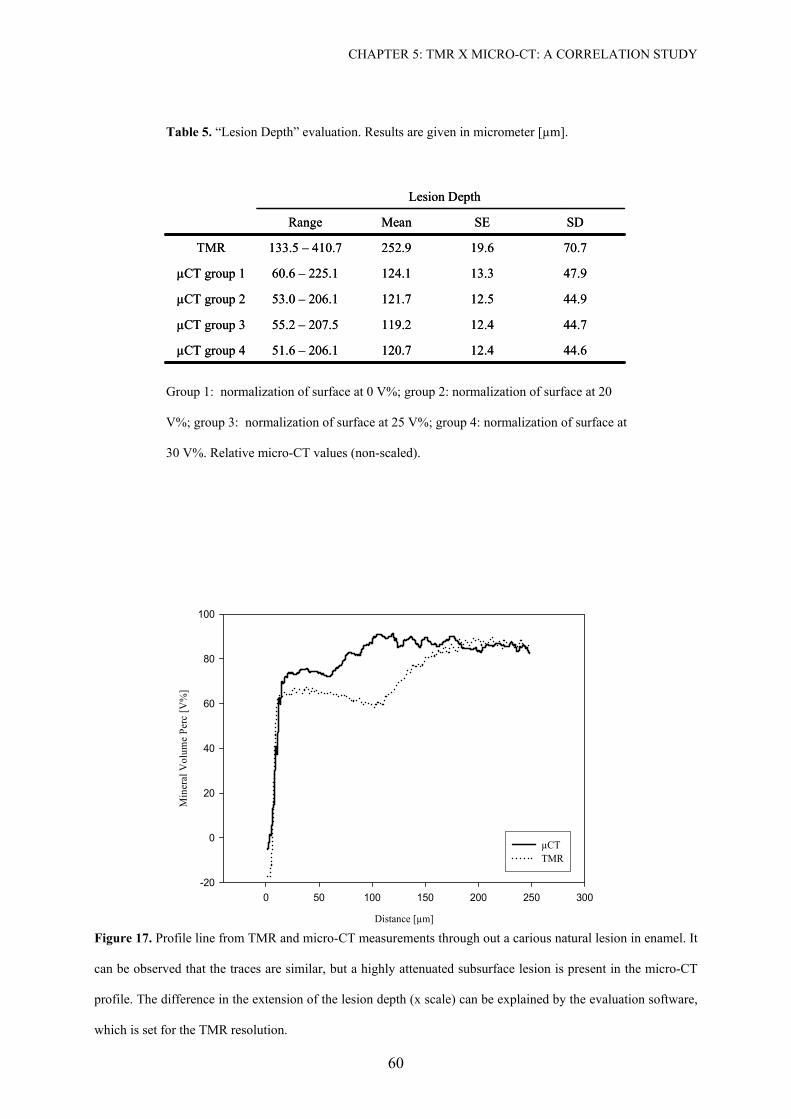
CHAPTER 5: TMR X MICRO-CT: A CORRELATION STUDY
60
Table 5. “Lesion Depth” evaluation. Results are given in micrometer [µm].
47.913.3124.160.6 – 225.1µCT group 1
44.612.4120.751.6 – 206.1µCT group 4
44.712.4119.255.2 – 207.5µCT group 3
44.912.5121.753.0 – 206.1µCT group 2
70.719.6252.9133.5 – 410.7TMR
SDSEMeanRange
Lesion Depth
47.913.3124.160.6 – 225.1µCT group 1
44.612.4120.751.6 – 206.1µCT group 4
44.712.4119.255.2 – 207.5µCT group 3
44.912.5121.753.0 – 206.1µCT group 2
70.719.6252.9133.5 – 410.7TMR
SDSEMeanRange
Lesion Depth
Group 1: normalization of surface at 0 V%; group 2: normalization of surface at 20
V%; group 3: normalization of surface at 25 V%; group 4: normalization of surface at
30 V%. Relative micro-CT values (non-scaled).
Distance [µm]
0 50 100 150 200 250 300
Min
eral
Vol
ume
Perc
[V%
]
-20
0
20
40
60
80
100
µCTTMR
Figure 17. Profile line from TMR and micro-CT measurements through out a carious natural lesion in enamel. It
can be observed that the traces are similar, but a highly attenuated subsurface lesion is present in the micro-CT
profile. The difference in the extension of the lesion depth (x scale) can be explained by the evaluation software,
which is set for the TMR resolution.
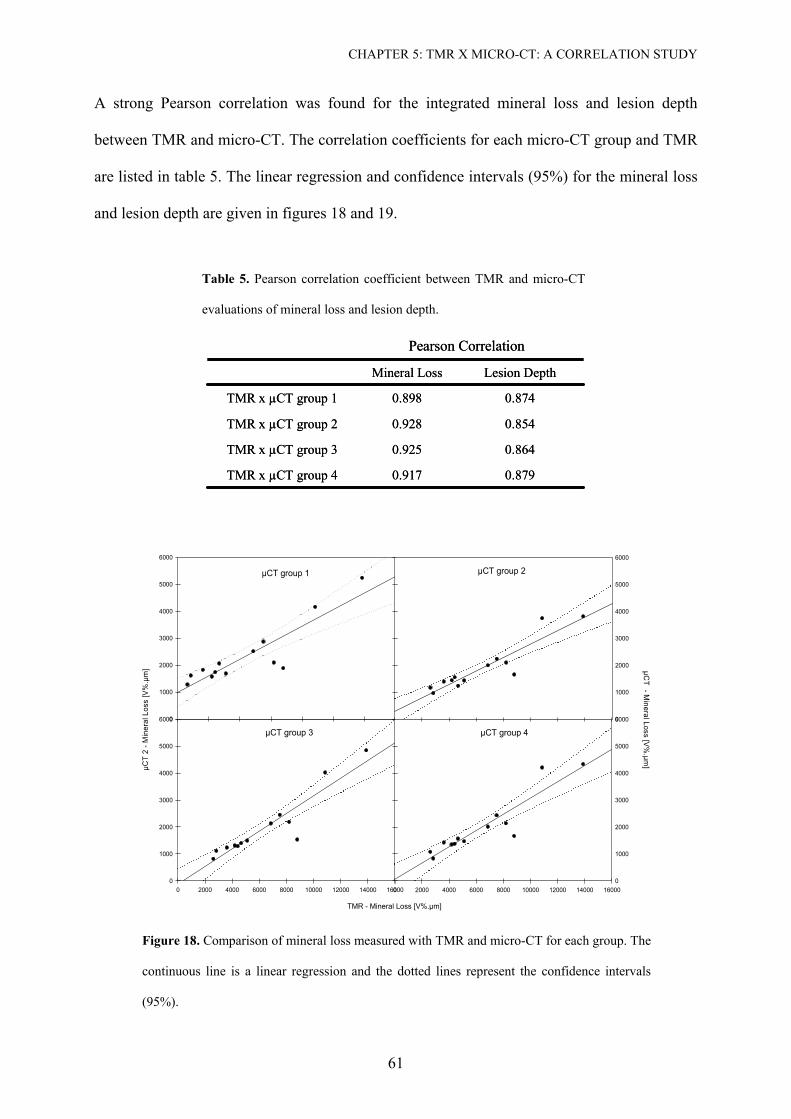
CHAPTER 5: TMR X MICRO-CT: A CORRELATION STUDY
61
A strong Pearson correlation was found for the integrated mineral loss and lesion depth
between TMR and micro-CT. The correlation coefficients for each micro-CT group and TMR
are listed in table 5. The linear regression and confidence intervals (95%) for the mineral loss
and lesion depth are given in figures 18 and 19.
Table 5. Pearson correlation coefficient between TMR and micro-CT
evaluations of mineral loss and lesion depth.
Pearson Correlation
0.8740.898TMR x µCT group 1
0.8790.917TMR x µCT group 4
0.8640.925TMR x µCT group 3
0.8540.928TMR x µCT group 2
Lesion DepthMineral Loss
Pearson Correlation
0.8740.898TMR x µCT group 1
0.8790.917TMR x µCT group 4
0.8640.925TMR x µCT group 3
0.8540.928TMR x µCT group 2
Lesion DepthMineral Loss
µCT group 3
TMR - Mineral Loss [V%.µm]
0 2000 4000 6000 8000 10000 12000 14000 16000
µCT
2 - M
iner
al L
oss
[V%
.µm
]
0
1000
2000
3000
4000
5000
6000
µCT group 1
0
1000
2000
3000
4000
5000
6000
µCT group 2
0
1000
2000
3000
4000
5000
6000
µCT group 4
0 2000 4000 6000 8000 10000 12000 14000 16000
µCT - M
ineral Loss [V%
.µm]
0
1000
2000
3000
4000
5000
6000
Figure 18. Comparison of mineral loss measured with TMR and micro-CT for each group. The
continuous line is a linear regression and the dotted lines represent the confidence intervals
(95%).
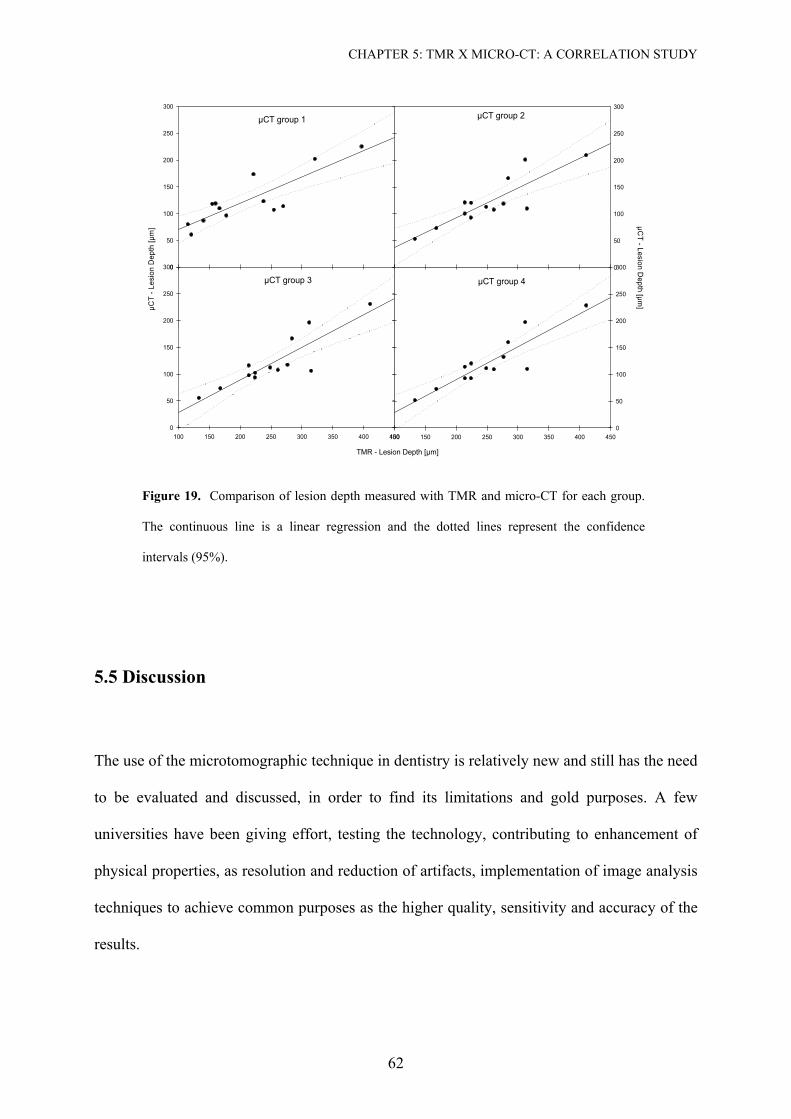
CHAPTER 5: TMR X MICRO-CT: A CORRELATION STUDY
62
µCT group 1
0
50
100
150
200
250
300
TMR vs Ld - UCT 0% Plot 1 RegrPlot 1 Conf1
µCT group 2
0
50
100
150
200
250
300
µCT group 3
TMR - Lesion Depth [µm]
100 150 200 250 300 350 400 450
µCT
- Les
ion
Dep
th [µ
m]
0
50
100
150
200
250
300
µCT group 4
100 150 200 250 300 350 400 450
µCT - Lesion D
epth [µm]
0
50
100
150
200
250
300
Figure 19. Comparison of lesion depth measured with TMR and micro-CT for each group.
The continuous line is a linear regression and the dotted lines represent the confidence
intervals (95%).
5.5 Discussion
The use of the microtomographic technique in dentistry is relatively new and still has the need
to be evaluated and discussed, in order to find its limitations and gold purposes. A few
universities have been giving effort, testing the technology, contributing to enhancement of
physical properties, as resolution and reduction of artifacts, implementation of image analysis
techniques to achieve common purposes as the higher quality, sensitivity and accuracy of the
results.
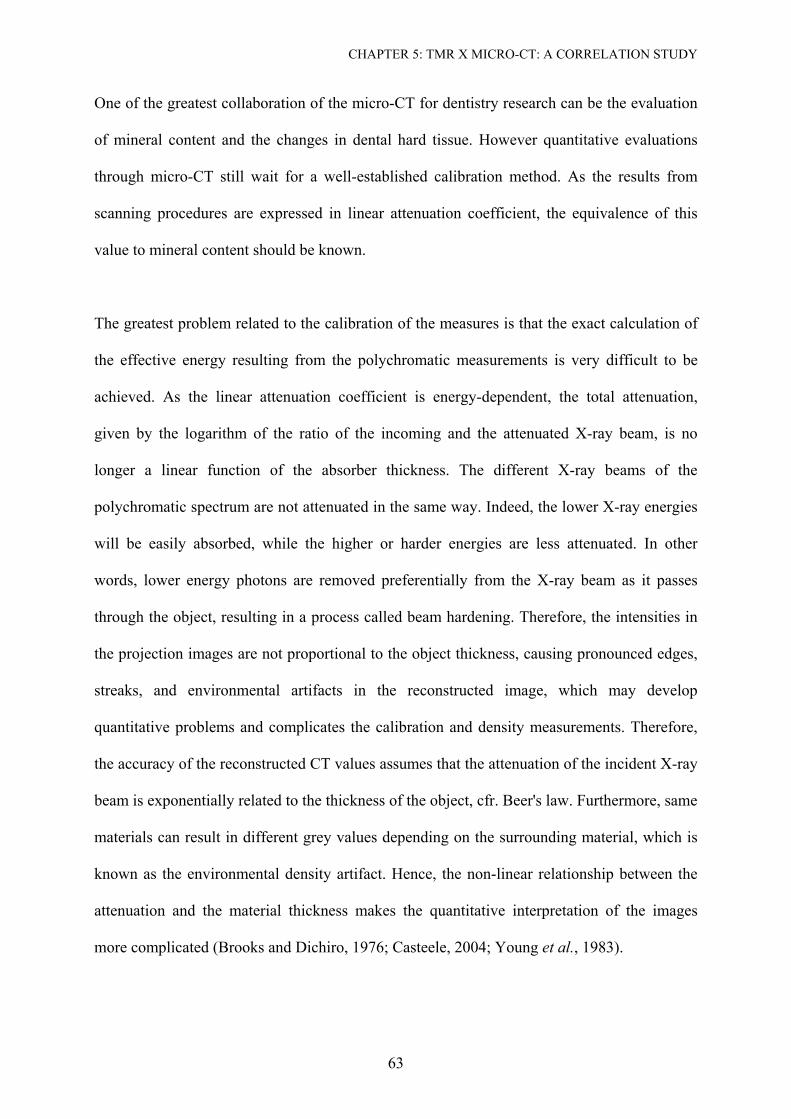
CHAPTER 5: TMR X MICRO-CT: A CORRELATION STUDY
63
One of the greatest collaboration of the micro-CT for dentistry research can be the evaluation
of mineral content and the changes in dental hard tissue. However quantitative evaluations
through micro-CT still wait for a well-established calibration method. As the results from
scanning procedures are expressed in linear attenuation coefficient, the equivalence of this
value to mineral content should be known.
The greatest problem related to the calibration of the measures is that the exact calculation of
the effective energy resulting from the polychromatic measurements is very difficult to be
achieved. As the linear attenuation coefficient is energy-dependent, the total attenuation,
given by the logarithm of the ratio of the incoming and the attenuated X-ray beam, is no
longer a linear function of the absorber thickness. The different X-ray beams of the
polychromatic spectrum are not attenuated in the same way. Indeed, the lower X-ray energies
will be easily absorbed, while the higher or harder energies are less attenuated. In other
words, lower energy photons are removed preferentially from the X-ray beam as it passes
through the object, resulting in a process called beam hardening. Therefore, the intensities in
the projection images are not proportional to the object thickness, causing pronounced edges,
streaks, and environmental artifacts in the reconstructed image, which may develop
quantitative problems and complicates the calibration and density measurements. Therefore,
the accuracy of the reconstructed CT values assumes that the attenuation of the incident X-ray
beam is exponentially related to the thickness of the object, cfr. Beer's law. Furthermore, same
materials can result in different grey values depending on the surrounding material, which is
known as the environmental density artifact. Hence, the non-linear relationship between the
attenuation and the material thickness makes the quantitative interpretation of the images
more complicated (Brooks and Dichiro, 1976; Casteele, 2004; Young et al., 1983).
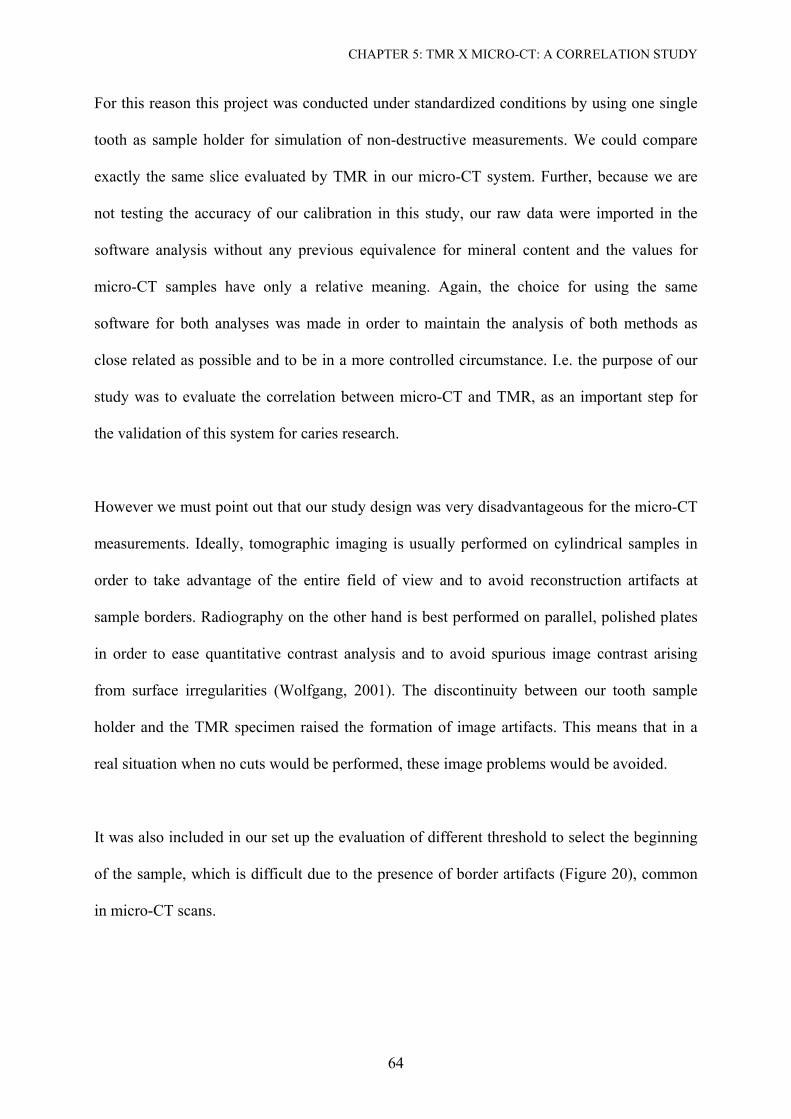
CHAPTER 5: TMR X MICRO-CT: A CORRELATION STUDY
64
For this reason this project was conducted under standardized conditions by using one single
tooth as sample holder for simulation of non-destructive measurements. We could compare
exactly the same slice evaluated by TMR in our micro-CT system. Further, because we are
not testing the accuracy of our calibration in this study, our raw data were imported in the
software analysis without any previous equivalence for mineral content and the values for
micro-CT samples have only a relative meaning. Again, the choice for using the same
software for both analyses was made in order to maintain the analysis of both methods as
close related as possible and to be in a more controlled circumstance. I.e. the purpose of our
study was to evaluate the correlation between micro-CT and TMR, as an important step for
the validation of this system for caries research.
However we must point out that our study design was very disadvantageous for the micro-CT
measurements. Ideally, tomographic imaging is usually performed on cylindrical samples in
order to take advantage of the entire field of view and to avoid reconstruction artifacts at
sample borders. Radiography on the other hand is best performed on parallel, polished plates
in order to ease quantitative contrast analysis and to avoid spurious image contrast arising
from surface irregularities (Wolfgang, 2001). The discontinuity between our tooth sample
holder and the TMR specimen raised the formation of image artifacts. This means that in a
real situation when no cuts would be performed, these image problems would be avoided.
It was also included in our set up the evaluation of different threshold to select the beginning
of the sample, which is difficult due to the presence of border artifacts (Figure 20), common
in micro-CT scans.
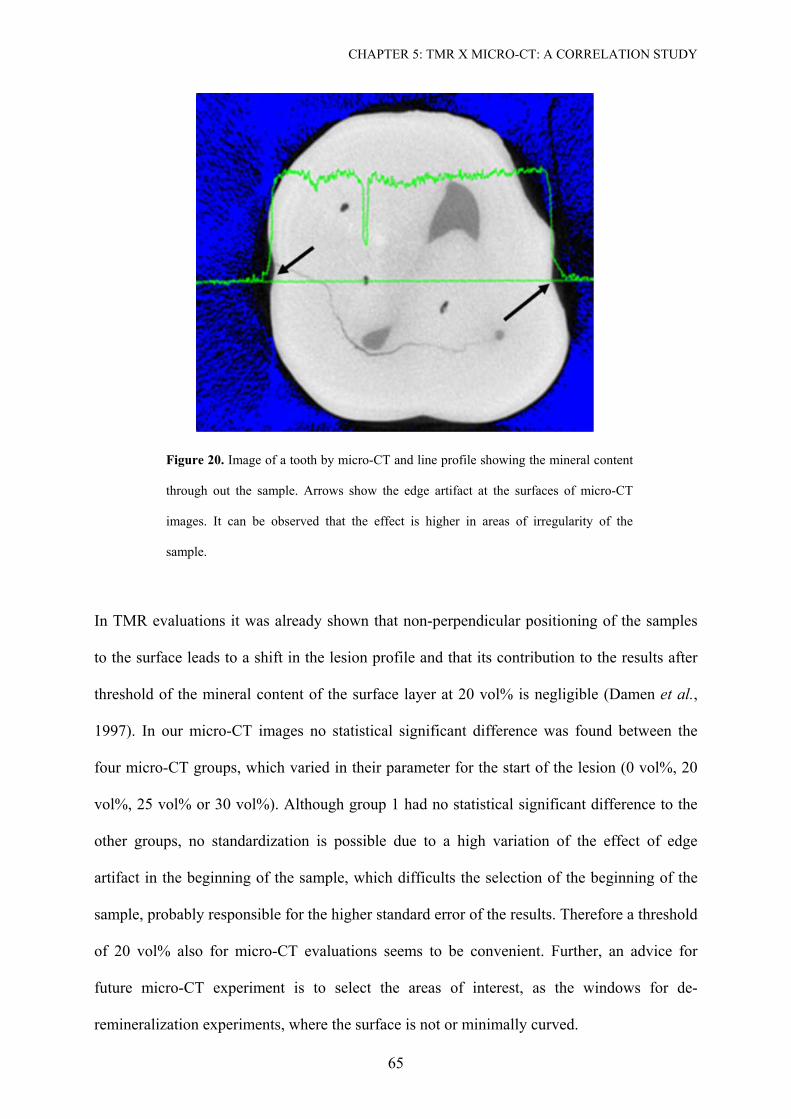
CHAPTER 5: TMR X MICRO-CT: A CORRELATION STUDY
65
Figure 20. Image of a tooth by micro-CT and line profile showing the mineral content
through out the sample. Arrows show the edge artifact at the surfaces of micro-CT
images. It can be observed that the effect is higher in areas of irregularity of the
sample.
In TMR evaluations it was already shown that non-perpendicular positioning of the samples
to the surface leads to a shift in the lesion profile and that its contribution to the results after
threshold of the mineral content of the surface layer at 20 vol% is negligible (Damen et al.,
1997). In our micro-CT images no statistical significant difference was found between the
four micro-CT groups, which varied in their parameter for the start of the lesion (0 vol%, 20
vol%, 25 vol% or 30 vol%). Although group 1 had no statistical significant difference to the
other groups, no standardization is possible due to a high variation of the effect of edge
artifact in the beginning of the sample, which difficults the selection of the beginning of the
sample, probably responsible for the higher standard error of the results. Therefore a threshold
of 20 vol% also for micro-CT evaluations seems to be convenient. Further, an advice for
future micro-CT experiment is to select the areas of interest, as the windows for de-
remineralization experiments, where the surface is not or minimally curved.
CHAPTER 5: TMR X MICRO-CT: A CORRELATION STUDY
66
A very strong Pearson correlation for mineral loss and lesion depth between TMR and micro-
CT could be shown, with no difference between the groups. The option for mineral loss and
depth of the lesion as parameters for the comparison was due to recommendations from the
International Consensus Workshop on Caries Clinical Trial (Huysmans and Longbottom,
2004). According to Huyans and Longbotton, because of the higher variability of lesion depth
and the definition itself of carious process, as a dynamic process, the mineral loss rate should
have even a higher and preferred impact in validations studies. Random differences between
both methods could be explained by the higher energy necessary to scan a whole tooth in
micro-CT and consequently the polychromatic range of the X-ray beams. Enamel is an
extreme dense tissue and the attenuation of the x-ray at the surface is too high. This could
explain why the profiles showed higher peak at the subsurface lesion in comparison to TMR.
The use of higher energy permitted us to scan whole tooth sample, but it could on the other
side compromises the contrast resolution. Further research is necessary to test a calibration for
the system and to establish the sensitivity of the equipment to detect very small artificial
lesions or abrasion lesions in whole tooth samples.
In summary, although we offered a very disadvantageous situation for the micro-CT analysis
it was shown that the method very well correlates with the TMR analysis for mineral loss and
lesion depth evaluation of natural enamel carious lesions. Also we agree that threshold above
20 vol% as initial parameter is not necessary. The most valuable advantage of micro-CT is the
measurement of whole tooth, permitting longitudinal experiments to be conducted and the
possibility of three-dimensional non-destructive evaluations. Further efforts for the calibration
and validation of the method for the future research in cariology are highly recommended.
Part III
Micro-CT and Dentin Study
A Three-Dimensional Evaluation of Caries
68
Chapter 6
Micro-computed tomographic evaluation of a new
enzyme solution for caries removal in deciduous
teeth
6.1 Abstract
This study evaluated a new enzyme solution (SFC-V) for dentin caries removal compared
with Carisolv™, both used with a prototype plastic instrument, this being a modified
technique for Carisolv. Five deciduous carious teeth were sectioned and alternative treatments
were applied to each half. Micro-CT observations showed that both treatments resulted in
removal of the outer demineralized dentin layer with similar effects on deciduous carious
dentin, removing 28.6% (SFC-V) and 28.2% (Carisolv) of demineralized tissue. Remaining
demineralized dentin thicknesses of 0.27 µm (SFC-V) and 0.31 µm (Carisolv) were observed
with no statistically significant difference. FE-SEM analysis demonstrated that the use of
Carisolv resulted in a rougher surface whereas after enzymatic treatment, more organized
dentin collagen, open tubules and only few bacteria were seen. In summary; the experimental
enzymatic solution and the modified Carisolv treatment removed comparable amounts of
carious dentin resulting in differing surface morphologies.
CHAPTER 6: EVALUATION OF A NEW ENZYME SOLUTION
69
6.2 Introduction
Clinical dentistry in the twentieth century has been marked by a lack of complete
understanding of the caries process, leading to a surgical approach and influenced by the
properties of the restorative materials used, for example “extension for prevention” (Tyas et
al., 2000). After development of ultra-high speed rotary cutting instruments in the 1950s,
cavity preparations tended to be larger. The limited lifetime of restorations lead to an era of
“replacement dentistry”, with additional weakening of the tooth structure after each
therapeutic intervention and a constant round of failure of restorations (Hunter et al., 1995).
In 1970, Kato and Fusayama (Kato and Fusayama, 1970a) reported the presence of two
decalcified layers in carious dentin; a first soft layer, with very low calcium content and no
capacity for remineralization, and a second decalcified layer with a mineral concentration
somewhere between that of the first layer and normal sound dentin, which was considered to
be remineralizable. Later, it was shown that collagens fibrils in the first layer are damaged at
both the cross bands and the interbands, with minimal mineral content. This contrasts with the
second layer which demonstrates clear collagen cross banding and interbanding with
numerous apatite crystals in both the peritubular and intertubular dentin (Ohgushi and
Fusayama, 1975).
The 70’s also saw the first attempts at chemo-mechanical removal of caries when Goldman
and Kronman (Kronman et al., 1977) developed the GK-101 solution by adding Sorensen’s
buffer to sodium hypochlorite. After further work to replace glycine with amino butyric acid,
the new version GK-101E, proved to be faster at softening demineralized carious dentin
(Goldman and Kronman, 1976; Schutzbank et al., 1978). However, the product, named
CHAPTER 6: EVALUATION OF A NEW ENZYME SOLUTION
70
Caridex, was only available commercially up to the early 90’s because of its slow procedure
and the large volume of solution required (Beeley et al., 2000).
Carisolv™ (Mediteam Dental AB, Sävedalen, Sweden) was introduced in 1988. The first
version was formulated as a gel and was supplied in two syringes, requiring less volume per
application and less time of operation than GK-101E. No special delivery equipment was
required for its application; solution one, containing 0.5% sodium hypochlorite solution, was
mixed with solution two, a pink viscous gel containing 15 mg of the amino acids lysine,
leucine and glutamic acid, together with carboxymethylcellulose to make it viscous and
erythrocin to make it readily visible (Beeley et al., 2000). Recently, the gel has been
reformulated to improve its efficciency. According to the manufacturer an increase in the
amount of free chloramine was needed, which meant utilizing a higher concentration of
NaOCl. The color agent has been removed and the new Carisolv gel is colorless. The pH of
Carisolv reaches an approximate value of 12 prior to its use. After application of the solution
treatment consists of excavation of caries tissue with specially designed steel hand
instruments having sharp edges and blunt cutting angles.
One major drawback of the methods described so far is their lack of specificity and absence of
self-limitation; the therapeutic endpoint is still assessed by visual and tactile methods. Color
and hardness however are not good parameters on which to base a decision whether dentin
removal should be continued or not during caries excavation (Hahn et al., 2004). The
presence or nor of bacteria after caries removal may be irrelevant if there is a good seal at the
cavity margin as the caries progress is driven by a viable biofilm (Kidd, 2004). It would
therefore be of great advantage to have a method that - in a gentle manner - specifically
removes outer carious dentin and is self-limiting in the sense that remineralizable inner
carious dentin is preserved. This should result in a maximum preservation of dentin.
CHAPTER 6: EVALUATION OF A NEW ENZYME SOLUTION
71
Recently, an enzymatic approach to dentin caries removal has been proposed, which it is
claimed fulfils these criteria. A prototype system has been developed (3M ESPE AG, Seefeld,
Germany) comprising of a treatment solution (SFC-V) and a plastic hand instrument (STAR
V1.3), which cannot remove dentin by itself. This solution essentially consists of a phosphoric
acid/sodium biphosphate buffer of pepsin and a gelling agent. The hand instrument
mechanically supports the treatment and is used to bring the solution into intimate contact
with the dentin surface to be treated.
According to the manufacturer, the phosphoric acid dissolves the inorganic components of
carious dentine, preserving healthy tooth structure, and gives the pepsin access to the organic
parts of the carious biomass. The pepsin selectively dissolves denaturated, but not native
sound collagen. In order to avoid over excavation, the hardness of the hand instrument has
been developed to have a hardness level between that of infected and sound dentin.
The aim of this study was to compare the effect of Carisolv and the new enzymatic method on
natural carious extracted deciduous teeth. Although Carisolv treatment combines use of the
solution with steel hand instruments, only the prototype plastic hand instrument was used. The
evaluation was carried out using micro computed-tomography to measure the thickness of
demineralized dentin retained after treatment and the volume of the removed dentin. FE-SEM
images were taken to evaluate the quality of the retained dentin. The null hypothesis was that
the new enzymatic procedure and Carisolv, when used in combination with the plastic
instrument, would have a similar effect on dentin caries removal.
CHAPTER 6: EVALUATION OF A NEW ENZYME SOLUTION
72
6.3 Materials and Methods
6.3.1 Sample preparation and treatment
Five deciduous carious teeth were selected for this study. One section (Leco VP100, LECO,
Kirchheim, Germany) was made through the center of each caries lesion to obtain two groups,
which were treated by either the new version of Carisolv (Carisolv™ Gel Multimix;
MediTeam Dental AB, Gothenburg, Sweden) – Group A – or by SFC-V (3M ESPE AG,
Seefeld, Germany) – Group B.
Both solutions were mixed according to the manufacturer’s instructions. In order to test the
effectiveness of the chemical or enzymatic treatment itself, it was decided to standardize the
procedure by using a prototype plastic hand instrument (STAR V1.3, 3M ESPE, Seefeld,
Germany) for both groups. In Group A, Carisolv was applied to the carious dentine and after
30 seconds the softened dentine was removed with the plastic hand instrument. The gel was
applied several times until it no longer turned cloudy with debris. The cavity was then rinsed
with water and gently dried. In Group B, the enzymatic solution was mixed and applied to the
gently dried cavity until complete coverage of the dentin lesion was obtained. The plastic
instrument was used to rub the cavity for 45 seconds. Additional SFC-V was added in cases of
dense clouding. Subsequently, the cavity was rinsed with water, gently dried and visually
examined. The procedure was repeated until no further clouding of the solution was seen.
The enamel side of each sample was longitudinally fixed to a plastic stick with fast glue,
which itself was fixed in a base of polyether Permadyne Penta H (3M ESPE AG, Seefeld,
Germany) to facilitate repositioning after treatment. Each block (sample/plastic-
CHAPTER 6: EVALUATION OF A NEW ENZYME SOLUTION
73
stick/polyether) was then located in a cylindrical holder filled with distilled water to avoid
dentin drying out of the dentin and to preserve the sample for further treatment. Both the
outside of the sample holder and the polyether base were marked with an axial alignment line
to allow positioning of the sample, and an alignment notch connecting the sample holder with
the micro-CT turntable permitted a precise repositioning.
6.3.2. Micro-computed Tomography scans
All samples were totally scanned before and after treatment with a small-angle-cone-beam
micro-CT (µCT 40; Scanco Medical AG, Bassersdorf, Switzerland) at 70 kVp and 114 µA, at
a linear isotropic resolution of 8 µm. A 0.5 mm aluminium filter was installed in the beam
path to cut off the softest x-rays resulting in a detector response close to 31 keV. This was
necessary to increase the accuracy of the beam-hardening correction, because in contrast to a
synchrotron illumination, the use of polychromatic x-rays creates the problem of beam
hardening. Beam hardening effects were also adjusted by adding polynomial correction values
to the measured projections. These correction values were determined by scanning a
homogeneous wedge of known density of 1200 mg HA cm-3. The scanned wedge projection
was compared to an ideal (monochromatic) projection (straight line for a wedge), and the
difference between measured wedge projection and ideal projection was fitted
with a third order polynom. This polynom was used as the beam hardening
correction function for subsequent tooth scans.
The object was mounted on a computer-controlled turntable, which synchronized rotation and
axial shift. At an integration time of 300 ms, 1000 projections were taken over 180°. A 50 µm
thick amorphous scintillator transformed the X-rays into visible-light. The image was
projected onto a CCD chip where the signal was digitized by means of an analogue digital
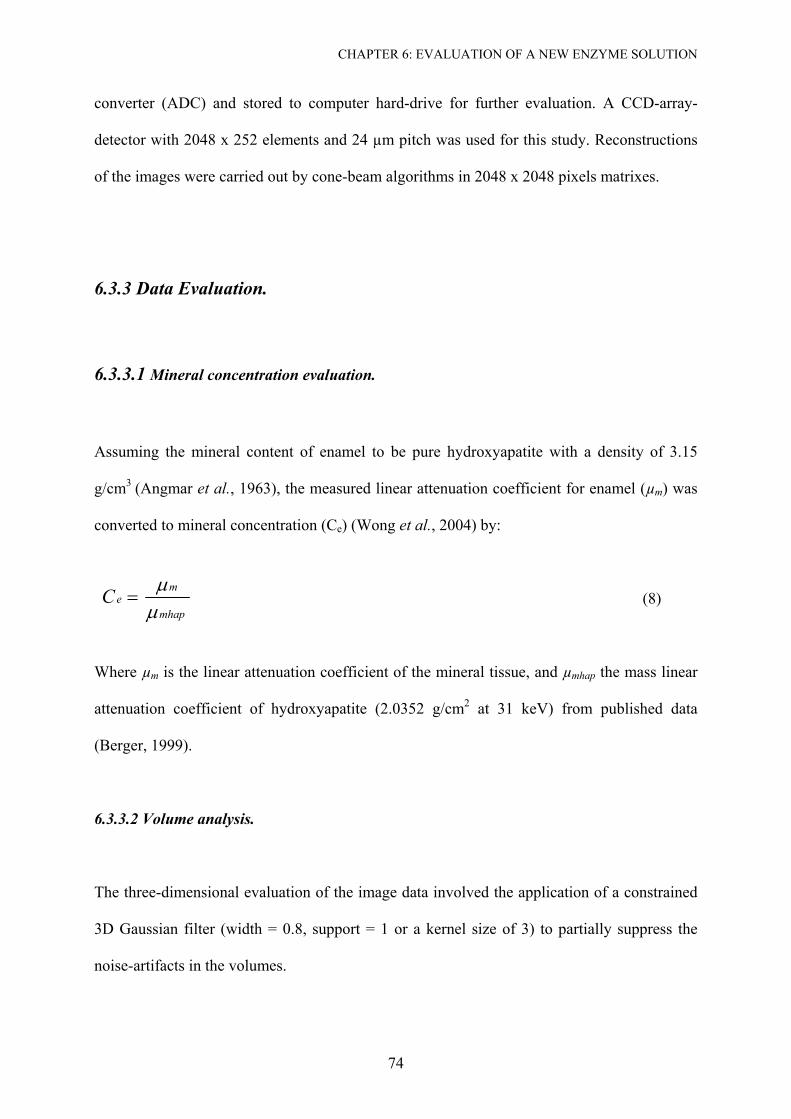
CHAPTER 6: EVALUATION OF A NEW ENZYME SOLUTION
74
converter (ADC) and stored to computer hard-drive for further evaluation. A CCD-array-
detector with 2048 x 252 elements and 24 µm pitch was used for this study. Reconstructions
of the images were carried out by cone-beam algorithms in 2048 x 2048 pixels matrixes.
6.3.3 Data Evaluation.
6.3.3.1 Mineral concentration evaluation.
Assuming the mineral content of enamel to be pure hydroxyapatite with a density of 3.15
g/cm3 (Angmar et al., 1963), the measured linear attenuation coefficient for enamel (µm) was
converted to mineral concentration (Ce) (Wong et al., 2004) by:
(8)
Where µm is the linear attenuation coefficient of the mineral tissue, and µmhap the mass linear
attenuation coefficient of hydroxyapatite (2.0352 g/cm2 at 31 keV) from published data
(Berger, 1999).
6.3.3.2 Volume analysis.
The three-dimensional evaluation of the image data involved the application of a constrained
3D Gaussian filter (width = 0.8, support = 1 or a kernel size of 3) to partially suppress the
noise-artifacts in the volumes.
mhap
meC
µµ
=
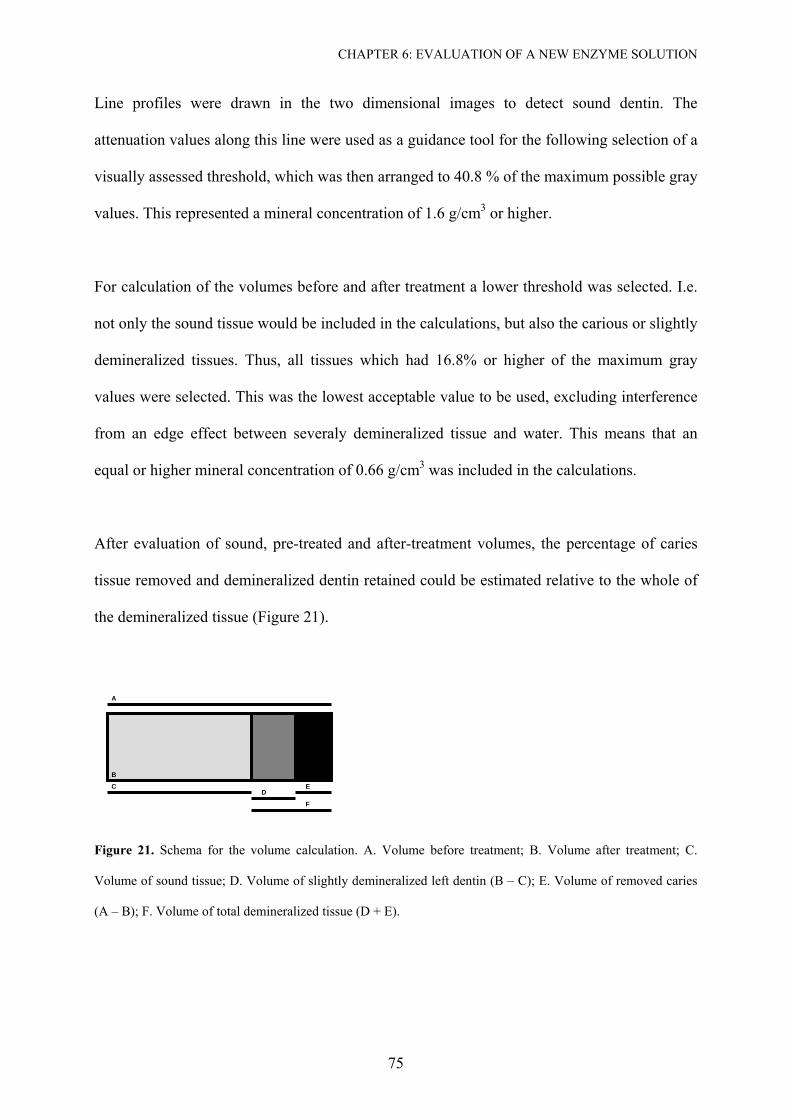
CHAPTER 6: EVALUATION OF A NEW ENZYME SOLUTION
75
Line profiles were drawn in the two dimensional images to detect sound dentin. The
attenuation values along this line were used as a guidance tool for the following selection of a
visually assessed threshold, which was then arranged to 40.8 % of the maximum possible gray
values. This represented a mineral concentration of 1.6 g/cm3 or higher.
For calculation of the volumes before and after treatment a lower threshold was selected. I.e.
not only the sound tissue would be included in the calculations, but also the carious or slightly
demineralized tissues. Thus, all tissues which had 16.8% or higher of the maximum gray
values were selected. This was the lowest acceptable value to be used, excluding interference
from an edge effect between severaly demineralized tissue and water. This means that an
equal or higher mineral concentration of 0.66 g/cm3 was included in the calculations.
After evaluation of sound, pre-treated and after-treatment volumes, the percentage of caries
tissue removed and demineralized dentin retained could be estimated relative to the whole of
the demineralized tissue (Figure 21).
Figure 21. Schema for the volume calculation. A. Volume before treatment; B. Volume after treatment; C.
Volume of sound tissue; D. Volume of slightly demineralized left dentin (B – C); E. Volume of removed caries
(A – B); F. Volume of total demineralized tissue (D + E).
A
B
C D
E
F
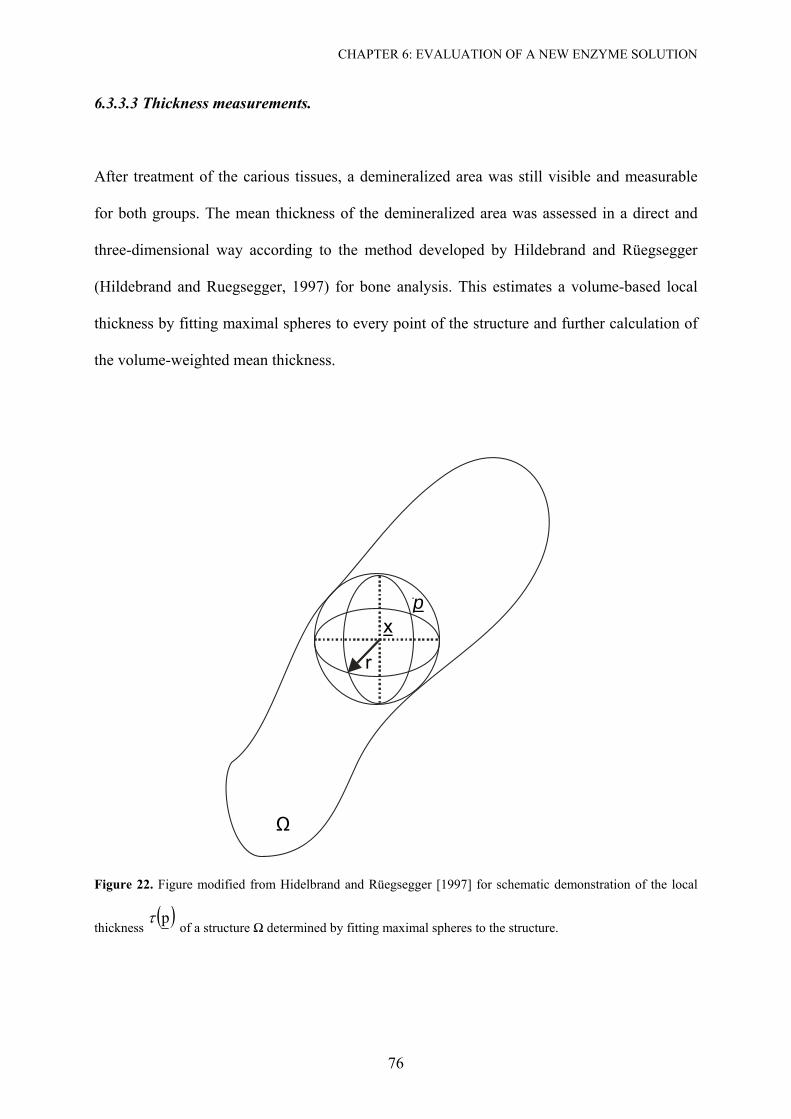
CHAPTER 6: EVALUATION OF A NEW ENZYME SOLUTION
76
6.3.3.3 Thickness measurements.
After treatment of the carious tissues, a demineralized area was still visible and measurable
for both groups. The mean thickness of the demineralized area was assessed in a direct and
three-dimensional way according to the method developed by Hildebrand and Rüegsegger
(Hildebrand and Ruegsegger, 1997) for bone analysis. This estimates a volume-based local
thickness by fitting maximal spheres to every point of the structure and further calculation of
the volume-weighted mean thickness.
Ω
r
xp
Figure 22. Figure modified from Hidelbrand and Rüegsegger [1997] for schematic demonstration of the local
thickness ( )pτ
of a structure Ω determined by fitting maximal spheres to the structure.
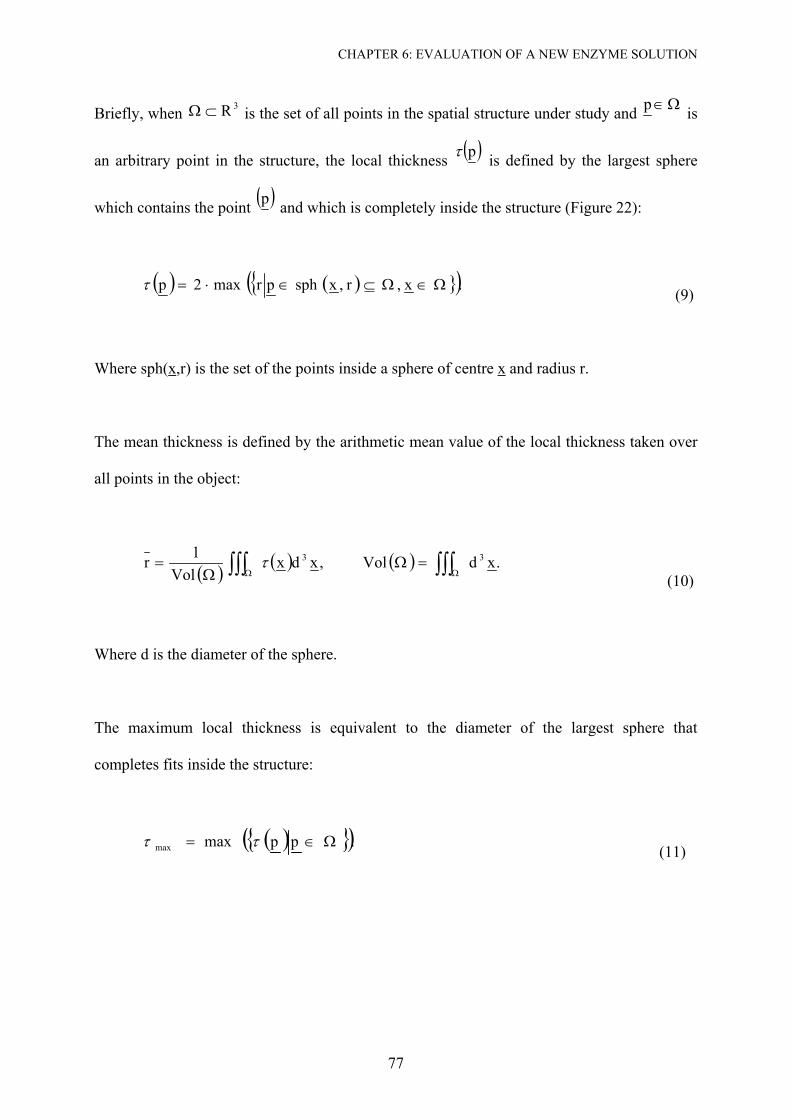
CHAPTER 6: EVALUATION OF A NEW ENZYME SOLUTION
77
Briefly, when 3R⊂Ω is the set of all points in the spatial structure under study and Ω∈p is
an arbitrary point in the structure, the local thickness ( )pτ is defined by the largest sphere
which contains the point ( )p and which is completely inside the structure (Figure 22):
( ) ( ) ( ).x,r,xsphprmax2p Ω∈Ω⊆∈⋅=τ (9)
Where sph(x,r) is the set of the points inside a sphere of centre x and radius r.
The mean thickness is defined by the arithmetic mean value of the local thickness taken over
all points in the object:
( ) ( ) ( ) .xdVol ,xdxVol
1r 33 ∫∫∫∫∫∫ ΩΩ=Ω
Ω= τ
(10)
Where d is the diameter of the sphere.
The maximum local thickness is equivalent to the diameter of the largest sphere that
completes fits inside the structure:
( ) ( ).ppmaxmax Ω∈= ττ
(11)
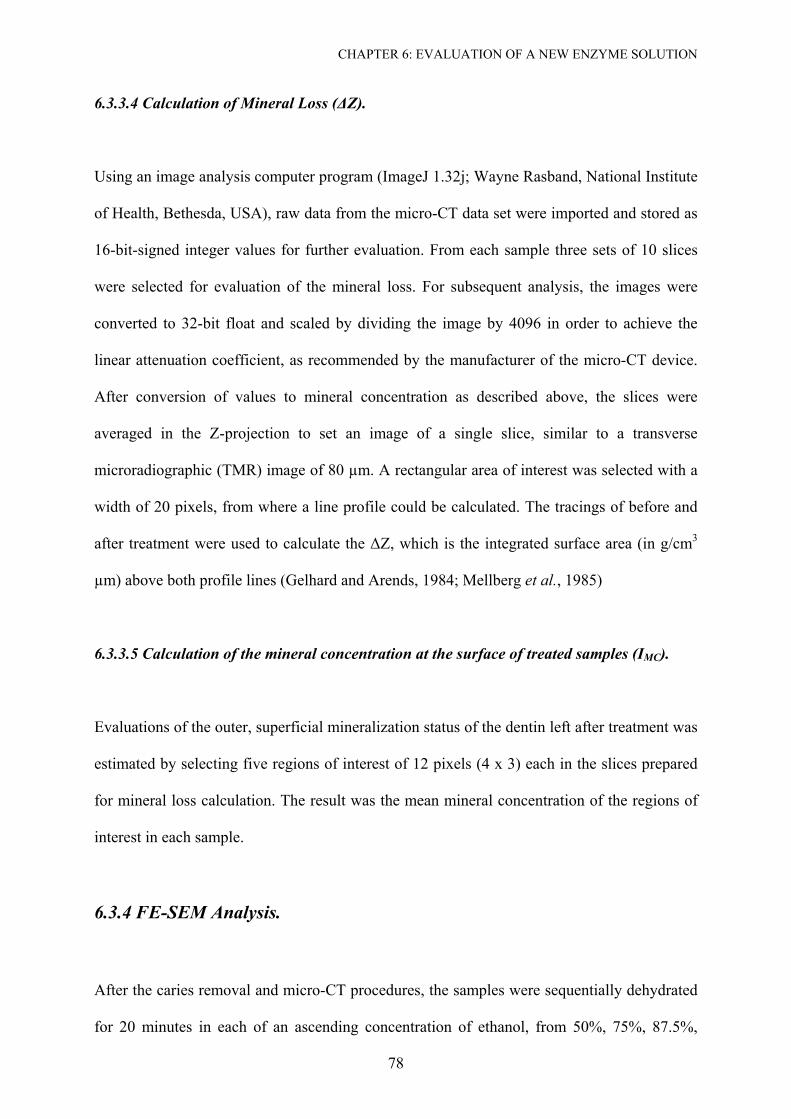
CHAPTER 6: EVALUATION OF A NEW ENZYME SOLUTION
78
6.3.3.4 Calculation of Mineral Loss (∆Z).
Using an image analysis computer program (ImageJ 1.32j; Wayne Rasband, National Institute
of Health, Bethesda, USA), raw data from the micro-CT data set were imported and stored as
16-bit-signed integer values for further evaluation. From each sample three sets of 10 slices
were selected for evaluation of the mineral loss. For subsequent analysis, the images were
converted to 32-bit float and scaled by dividing the image by 4096 in order to achieve the
linear attenuation coefficient, as recommended by the manufacturer of the micro-CT device.
After conversion of values to mineral concentration as described above, the slices were
averaged in the Z-projection to set an image of a single slice, similar to a transverse
microradiographic (TMR) image of 80 µm. A rectangular area of interest was selected with a
width of 20 pixels, from where a line profile could be calculated. The tracings of before and
after treatment were used to calculate the ∆Z, which is the integrated surface area (in g/cm3
µm) above both profile lines (Gelhard and Arends, 1984; Mellberg et al., 1985)
6.3.3.5 Calculation of the mineral concentration at the surface of treated samples (IMC).
Evaluations of the outer, superficial mineralization status of the dentin left after treatment was
estimated by selecting five regions of interest of 12 pixels (4 x 3) each in the slices prepared
for mineral loss calculation. The result was the mean mineral concentration of the regions of
interest in each sample.
6.3.4 FE-SEM Analysis.
After the caries removal and micro-CT procedures, the samples were sequentially dehydrated
for 20 minutes in each of an ascending concentration of ethanol, from 50%, 75%, 87.5%,
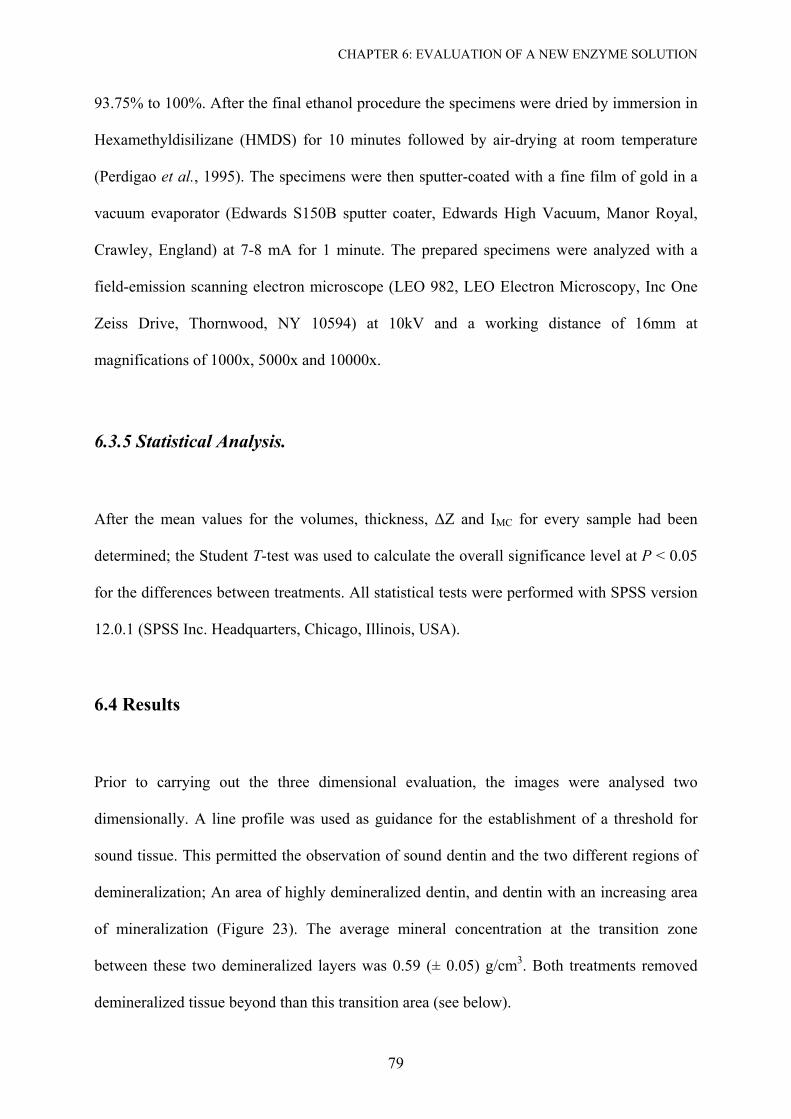
CHAPTER 6: EVALUATION OF A NEW ENZYME SOLUTION
79
93.75% to 100%. After the final ethanol procedure the specimens were dried by immersion in
Hexamethyldisilizane (HMDS) for 10 minutes followed by air-drying at room temperature
(Perdigao et al., 1995). The specimens were then sputter-coated with a fine film of gold in a
vacuum evaporator (Edwards S150B sputter coater, Edwards High Vacuum, Manor Royal,
Crawley, England) at 7-8 mA for 1 minute. The prepared specimens were analyzed with a
field-emission scanning electron microscope (LEO 982, LEO Electron Microscopy, Inc One
Zeiss Drive, Thornwood, NY 10594) at 10kV and a working distance of 16mm at
magnifications of 1000x, 5000x and 10000x.
6.3.5 Statistical Analysis.
After the mean values for the volumes, thickness, ∆Z and IMC for every sample had been
determined; the Student T-test was used to calculate the overall significance level at P < 0.05
for the differences between treatments. All statistical tests were performed with SPSS version
12.0.1 (SPSS Inc. Headquarters, Chicago, Illinois, USA).
6.4 Results
Prior to carrying out the three dimensional evaluation, the images were analysed two
dimensionally. A line profile was used as guidance for the establishment of a threshold for
sound tissue. This permitted the observation of sound dentin and the two different regions of
demineralization; An area of highly demineralized dentin, and dentin with an increasing area
of mineralization (Figure 23). The average mineral concentration at the transition zone
between these two demineralized layers was 0.59 (± 0.05) g/cm3. Both treatments removed
demineralized tissue beyond than this transition area (see below).
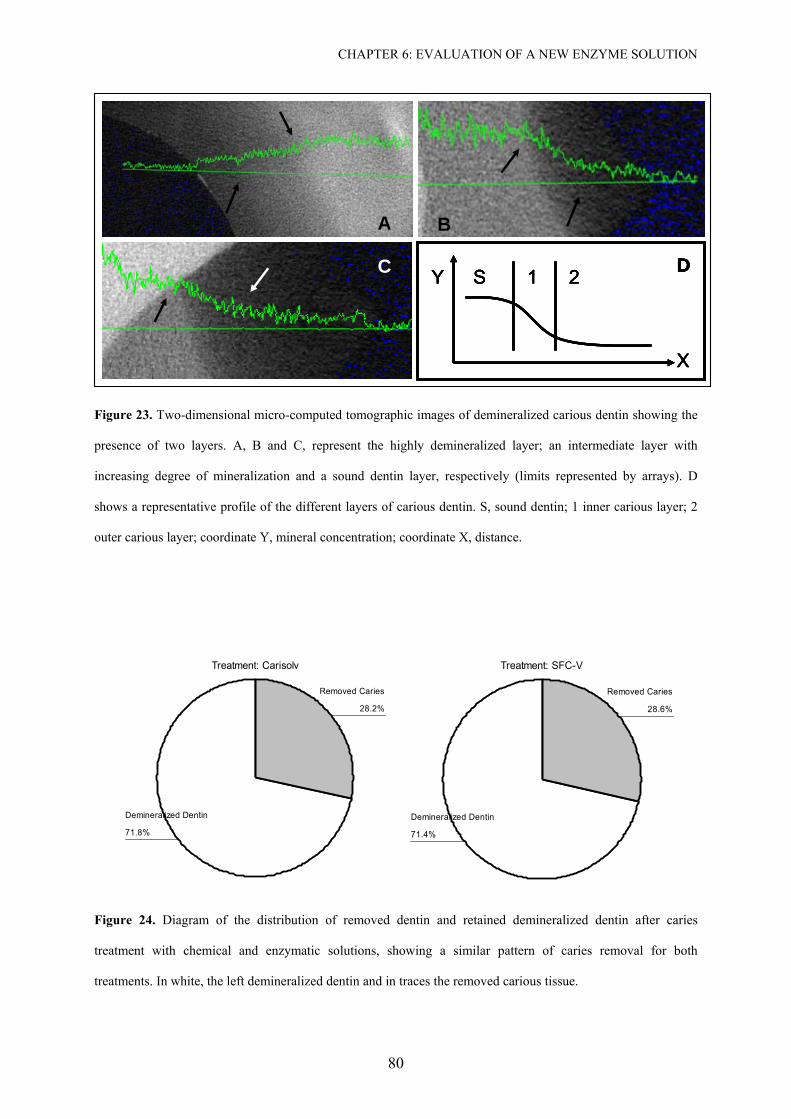
CHAPTER 6: EVALUATION OF A NEW ENZYME SOLUTION
80
BA
Y
X
S 1 2 DC
BA
Y
X
S 1 2 DC
BBAA
Y
X
S 1 2 DY
X
S 1 2 DCC
Figure 23. Two-dimensional micro-computed tomographic images of demineralized carious dentin showing the
presence of two layers. A, B and C, represent the highly demineralized layer; an intermediate layer with
increasing degree of mineralization and a sound dentin layer, respectively (limits represented by arrays). D
shows a representative profile of the different layers of carious dentin. S, sound dentin; 1 inner carious layer; 2
outer carious layer; coordinate Y, mineral concentration; coordinate X, distance.
Treatment: Carisolv
71.8%
28.2%
Demineralized Dentin
Removed Caries
Treatment: SFC-V
71.4%
28.6%
Demineralized Dentin
Removed Caries
Treatment: Carisolv
71.8%
28.2%
Demineralized Dentin
Removed Caries
Treatment: SFC-V
71.4%
28.6%
Demineralized Dentin
Removed Caries
Figure 24. Diagram of the distribution of removed dentin and retained demineralized dentin after caries
treatment with chemical and enzymatic solutions, showing a similar pattern of caries removal for both
treatments. In white, the left demineralized dentin and in traces the removed carious tissue.
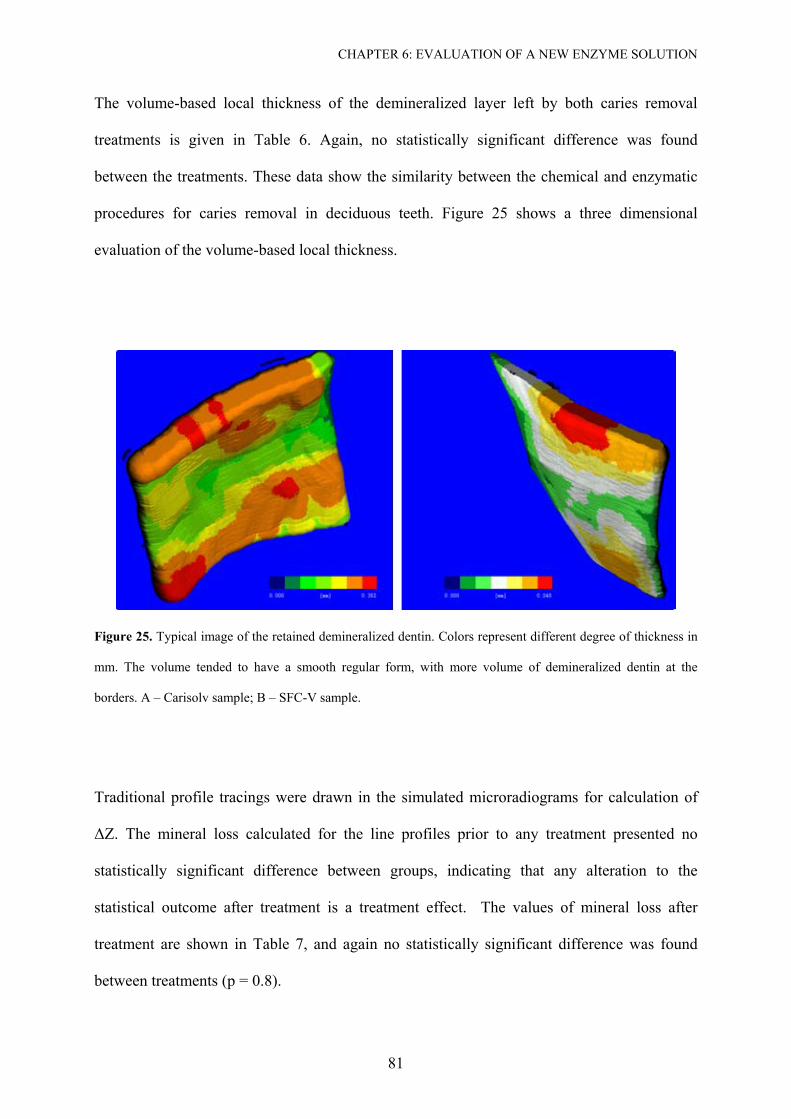
CHAPTER 6: EVALUATION OF A NEW ENZYME SOLUTION
81
The volume-based local thickness of the demineralized layer left by both caries removal
treatments is given in Table 6. Again, no statistically significant difference was found
between the treatments. These data show the similarity between the chemical and enzymatic
procedures for caries removal in deciduous teeth. Figure 25 shows a three dimensional
evaluation of the volume-based local thickness.
Figure 25. Typical image of the retained demineralized dentin. Colors represent different degree of thickness in
mm. The volume tended to have a smooth regular form, with more volume of demineralized dentin at the
borders. A – Carisolv sample; B – SFC-V sample.
Traditional profile tracings were drawn in the simulated microradiograms for calculation of
∆Z. The mineral loss calculated for the line profiles prior to any treatment presented no
statistically significant difference between groups, indicating that any alteration to the
statistical outcome after treatment is a treatment effect. The values of mineral loss after
treatment are shown in Table 7, and again no statistically significant difference was found
between treatments (p = 0.8).
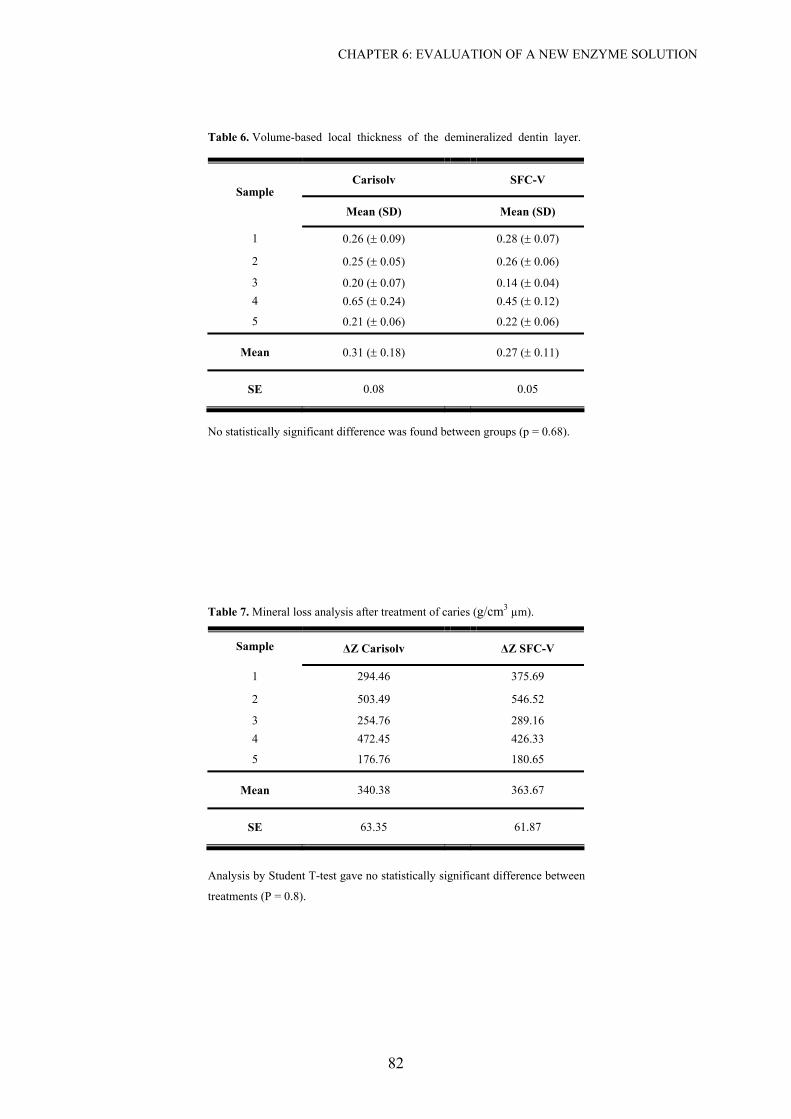
CHAPTER 6: EVALUATION OF A NEW ENZYME SOLUTION
82
Table 6. Volume-based local thickness of the demineralized dentin layer.
Carisolv SFC-V Sample
Mean (SD) Mean (SD)
1 0.26 (± 0.09) 0.28 (± 0.07) 2 0.25 (± 0.05) 0.26 (± 0.06) 3 0.20 (± 0.07) 0.14 (± 0.04)
4 0.65 (± 0.24) 0.45 (± 0.12)
5 0.21 (± 0.06) 0.22 (± 0.06)
Mean 0.31 (± 0.18) 0.27 (± 0.11)
SE 0.08 0.05
No statistically significant difference was found between groups (p = 0.68).
Table 7. Mineral loss analysis after treatment of caries (g/cm3 µm).
∆Z Carisolv ∆Z SFC-V Sample
1 294.46 375.69 2 503.49 546.52 3 254.76 289.16
4 472.45 426.33
5 176.76 180.65
Mean 340.38 363.67
SE 63.35 61.87
Analysis by Student T-test gave no statistically significant difference between
treatments (P = 0.8).
CHAPTER 6: EVALUATION OF A NEW ENZYME SOLUTION
83
The mean mineral concentration in g/cm3 was also measured within regions of interest in the
superficial tissue left by both treatments. Although the SFC-V group (0.90 ± 0.16) tended to
leave a slightly higher amount of mineralized dentin compared to Carisolv (0.85 ± 0.13), no
statistically significant difference was observed between the groups (p = 0.05).
The FE-SEM analysis evidenced different morphological appearance between the two groups
(Figure 26). Group B showed a low number of opened tubules, high numbers of bacteria and
no clear collagen phase in the treated dentin, whereas in Group A, the prevalence of open
tubules, few signs of bacteria, and a highly structured inter-tubular collagen network could be
observed.
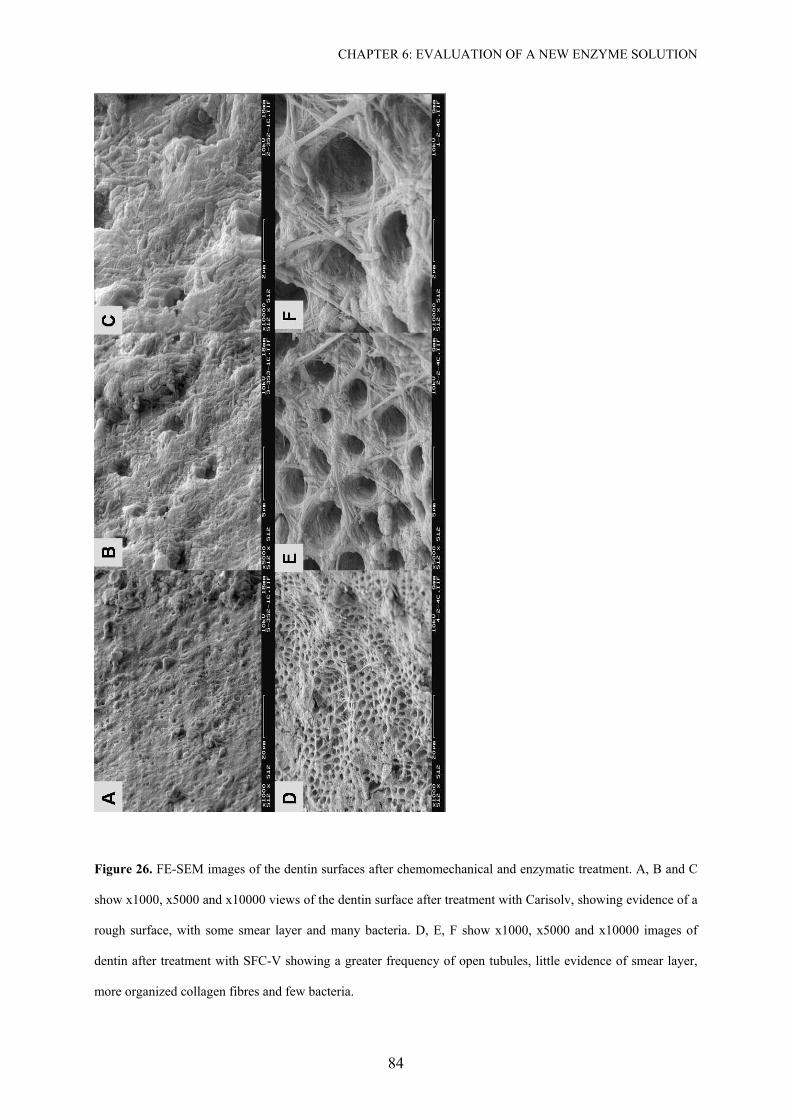
CHAPTER 6: EVALUATION OF A NEW ENZYME SOLUTION
84
Figure 26. FE-SEM images of the dentin surfaces after chemomechanical and enzymatic treatment. A, B and C
show x1000, x5000 and x10000 views of the dentin surface after treatment with Carisolv, showing evidence of a
rough surface, with some smear layer and many bacteria. D, E, F show x1000, x5000 and x10000 images of
dentin after treatment with SFC-V showing a greater frequency of open tubules, little evidence of smear layer,
more organized collagen fibres and few bacteria.
CHAPTER 6: EVALUATION OF A NEW ENZYME SOLUTION
85
6.5 Discussion
The chemomechanical caries removal technique gained interest in dental researches due to its
concept of tissue preservation while insuring removal of the denatured collagen-phase dentin.
Although Sato and Fusayama (Sato and Fusayama, 1976) have shown that the two layers of
infected and affected dentin can be delineated by fuchsin staining, it is still a very subjective
and technique sensitive method. The use of dye as a factor in over preparation of a cavity at
the amelo-dentinal junction and pulpal surface has been clearly demonstrated (Kidd et al.,
1993; Yip et al., 1994). In addition, in this era of esthetic and adhesive dentistry any remnant
of color stain is not acceptable. Thus, a self-limiting caries removal therapy is the best
alternative to preserve remineralizable tissue and to prevent over excavation of the cavity.
The action of Carisolv on carious dentin is still not completely understood. Habib et al.
(Habib et al., 1975) reported disruption of degraded collagen in carious dentin by chlorination
of hydroxiproline in the collagen molecule. Hydroxiproline is converted to pyrrole-2-
carboxylic acid and the quartenary superhelix is destroyed. Tonami et al. (Tonami et al.,
2003) have shown that the amino acids present in Carisolv may be responsible for the
reduction in aggressiveness of sodium hypocloride on sound dentin and the inner layer of
carious dentin.
The new enzymatic solution for caries removal is based on pepsin. The use of limited pepsin
digestion for solubilization of collagen is well known (Kuboki, 1991; Miller and Rhodes,
1982). Pepsin splits collagen polymers into monomers, acting specifically on non-helical
collagen, which contains inter- and intra-molecular cross-linking (Tonami and Ericson, 2005).
Flückiger et al. (Fluckiger et al., 2005) conducted a histological study on the remaining
carious dentin left by Carisolv but considered that a three-dimensional evaluation was needed
CHAPTER 6: EVALUATION OF A NEW ENZYME SOLUTION
86
for a better understanding of its action. In this perspective, micro-computed tomography
(micro-CT) potentially represents a key tool, especially in caries research, since it allows high
spatial resolution records of inner structures (Rossi et al., 2004), three-dimensionally and
without destruction of samples (Lin and Miller, 1996).
According to our images, micro-computed tomography was sensitive enough to detect the two
layers of carious dentin, in accordance with work by Kato and Fusayama (Kato and
Fusayama, 1970b) using optical microscopy and electron microprobe analysis. Our results
also demonstrated the very low mineral content present in the outer, superficial layer (< 0.59
g/cm3), and a gradient of increasing mineral content in the direction of the sound dentin. As
the initial mineral concentration found by both groups A and B was 0.85 and 0.90 g/cm3, we
can assume the ability of both treatments to remove the first very demineralized layer of
carious tissues even without the use of steel instruments.
Similar volumes of carious tissue were removed by Carisolv and SFC-V. The volume-based
local thickness of the demineralized layer left after treatment showed no statistically
significant differences between the groups; however we found a much higher value for the
thickness of the demineralized residual layer in our study compared with the literature. When
Kato and Fusayama (Kato and Fusayama, 1970a) first reported the presence of the two layers
in carious dentin, they described a very thin second layer of only 50-80 µm. These teeth had
been demineralized artificially using a decalcifying solution for ten minutes (Kato and
Fusayama, 1970a), which was expected to yield smaller lesions compared to natural carious
teeth. Our results are also not in agreement with other studies which have used naturally
carious teeth for chemomechanical treatment. After application of N-monochloro-DL-2-
aminobutyric acid (NMAB) or NMAB containing 2 mol/l urea, Yip et al. (Yip et al., 1995)
occasionally found areas of 0.05 to 0.1 mm of remaining demineralized dentin, and Flückiger
CHAPTER 6: EVALUATION OF A NEW ENZYME SOLUTION
87
et al. (Fluckiger et al., 2005) found 0.18 mm and 0.16 mm residual dentin caries thickness for
Carisolv and hand excavators. In the present study it was expected that higher values (0.32
mm and 0.27 mm for Carisolv and SFC-V) would be obtained because we opted for not using
a sharp metal instrument for excavation of the softened tissue, but a plastic instrument, as
recommended for use with SFC-V.
One major drawback of the use of sharp instruments is their lack of specificity and absence of
self-limitation. It would therefore be of great advantage to have a method that results in a
maximum preservation of dentin. Akimoto et al. (Akimoto et al., 2001) demonstrated in-vivo
an increase in nano-hardness and measured calcium levels at non-resin impregnated
demineralized dentin layers, which became remineralized after a period of 6-months
following the adhesive resin treatment. Remineralization of carious dentin has also been
evidenced by enhanced hardness and reduction in bacterial growth after stepwise excavation
of deep dentin caries (Bjorndal et al., 1997; Bjorndal and Thylstrup, 1998; Bjorndal and
Larsen, 2000).
Although not statistically significantly different, the enzymatic solution tended to remove a
greater amount of caries compared to Carisolv. From the FE-SEM images there appeared to
be a difference in the effect the two groups had on carious dentin. In Group A, a rough, non-
organized infected layer of dentin was observed, while in Group B, dentin was more
organized, patent dentin tubules were present and few bacteria were seen. This may be
explained by the different mode of action of the two solutions. As claimed by the
manufacturer, the acid in the enzyme solution may have dissolved remnant hydroxyapatite
during treatment and consequently no smear layer was generated. This effect would not be
seen at the basic pH (12) of the Carisolv solution, therefore, it is necessary to maintain the
mechanical excavation procedure for Group A, using the recommended metal hand
CHAPTER 6: EVALUATION OF A NEW ENZYME SOLUTION
88
instrument with Carisolv solution [cf. (Azrak et al., 2004; Lager et al., 2003)]. This
procedure may, however, result in a non-self-limiting procedure and lead to over-excavation
of dentin from use of the sharp instruments. As stated earlier, it is considered that it would be
a major advantage to have a caries removal method that gently and specifically removes outer
carious dentin, and is self-limiting in the sense that remineralizable inner carious dentin is
preserved.
Studies of dentin caries have shown a specific link between the destruction of the collagenous
matrix and the loss of firmly bound mineral (Frank et al., 1964; Johansen and Parks, 1961;
Selvig, 1968). A systematic evaluation of this retained collagenous phase is needed to
establish whether it is still intact (Kuboki et al., 1977) and/or contains enough mineral for the
promotion of remineralization (Daculsi et al., 1979; Levine and Rowles, 1973; Tveit and
Selvig, 1981), before we can exclude the use of these sharp instruments, as in this study. On
the other hand, Klont and ten Cate (Klont and ten Cate, 1990) have shown that removal of
exposed collagen did not affect the rate of mineral deposition and that remineralization of
dentin occurs by precipitation onto residual hydroxyapatite crystals. It could be therefore, that
the residual dentin, although less well mineralized than sound dentin, offers a source of
deposition and/or growth of new mineral, leading to arrest or reversal of caries at these
locations.
6.6 Conclusion
In summary, Carisolv and the experimental enzymatic solution removed comparable amounts
of deciduous carious dentin, when used in combination with a prototype plastic instrument. A
layer of partially demineralized dentin was retained after the completion of the caries removal
treatment, this layer being thicker than has previously been reported, indicating that more
CHAPTER 6: EVALUATION OF A NEW ENZYME SOLUTION
89
tissue had been preserved. Additional research is necessary to evaluate the quality of the
remaining collagen and the possibility of crystal growth and mineral apposition at this
demineralized layer. The use of Carisolv with the plastic hand instrument did not appear to
remove all the infected carious dentin. The manufacturer’s recommendation to use Carisolv
with metal hand instruments seems to be valid; however this may lead to a non-self-limiting
procedure resulting in over excavation of the cavity from use of sharp instruments.
90
Summary
Over the past years there have been attempts to improve the development of techniques for
caries detection and quantification. The demand for a non-destructive method has encouraged
the use of micro-CT in studies of enamel de-remineralization. Our contribution to this
development were presented in this work by evaluating the limitations of the method
concerning energy and the size of the samples, by correlating the micro-CT results of mineral
loss and lesion depth with a gold standard (TMR), and by suggesting a three-dimensional
model for the study of dentin caries excavation methods.
After a literature review, which is the content of the first and second chapter of this work, we
evaluated a second generation fan-beam commercial micro-CT (µCT 20, SCANCO Medical
AG, Bassersdorf, Switzerland) for mineral content quantification. According to our results,
the machine that works at 50 kVp and 160 µA is not feasible to quantify the mineral content
of whole tooth. Thus, we strongly recommended to consider the limited acceleration voltage
of the µCT 20 system and to limit sample evaluation to 6-mm thickness which is already an
advantage over other analytic approaches which require the preparation of very thin,
micrometric-sized samples.
The correlation of micro-CT and TMR was evaluated in our second experiment, written in
chapter 5. After exposing 70-90 µm slices with natural carious lesion in enamel by a TMR
equipment, micro-CT measurements (µCT 40; Scanco Medical AG, Bassersdorf, Switzerland)
were made inserting these samples inside a whole tooth which was especially prepared in
order to simulate a non-destructive evaluation. Also the effect of edge artefact was evaluated
by using different threshold for the start of the lesion. Our observation showed the high
SUMMARY
91
Pearson correlation between both methods for evaluation of mineral loss and lesion depth and
that the variation of the lesion parameter as 20 v% for the beginning of the lesion is a rational
procedure. Above this value seems to be not necessary and 0 v% can lead to a higher variation
of the values due to operator uncertainties within an artefact area.
With respect to the use of micro-CT in dentin excavation research, it was a valuable tool to
distinguish between the three mineralization phase in the carious process; a very high
demineralised dentin, a layer of increasing mineralization and a sound dentin layer. In this
chapter we have compared a new enzyme solution (SFC-V, 3M ESPE AG, Seefeld, Germany)
for dentin caries treatment in comparison with a well established method (Carisolv™ Gel
Multimix; MediTeam Dental AB, Gothenburg, Sweden). The use of the threshold technique
for the evaluation of the removed and remaining dentin after excavation seems to be
worthwhile. The mathematical model could very well compare both solution and the
remaining thickness of demineralised dentin with additional insight into its three-dimensional
perspective.
In this work we tried to demonstrate the current possibilities of micro-CT imaging and
quantification for the use in caries research. The system presents its limitation with respect to
energy selection, scans artefacts, calibration and costs. However, our caries research domain
demands a method which enables non-destructive analyses due to the dynamic characteristic
of caries itself. The high correlation existed between the micro-CT system and the most
reliable method of caries analyses stimulates the interest to persist the effort for the validation
of the system.
New research should be encouraged to evaluate the equipment for the studies of enamel
abrasion and artificial caries in enamel and dentin. Moreover, real time experiments and three-
SUMMARY
92
dimensional analysis of mineral loss could be done as also morphological insight of the
development of caries. Longer term experiments could be also stimulated using the most
tempting advantage of the method, which is the possibility of conducting longitudinal studies
without destroying the samples.
93
Zusammenfassung
In den letzten Jahren wurden die Methoden zur Kariesdiagnose und -quantifizierung
verbessert. Die Suche nach einer nichtdestruktiven Methode hat das Interesse auf das Micro-
CT (Mikro-Computer Tomographie) gelenkt, um Schmelz De/Remineralizierung zu
untersuchen. Unser Beitrag zu dieser Entwicklung wurde in dieser Arbeit dargestellt. Wir
werteten die Methode hinsichtlich der benötigte Energie und der Größe der Proben aus;
außerdem wurden die Ergebnisse vom Mikro-CT zum Mineralverlust- und zur Läsionstiefe
mit einer bewährten Methode (Transverse Mikroradiographie - TMR) korrelierten. Anhand
diese Daten leiteten wir ein dreidimensionales Modell für die Studie der
Dentinkariesexkavation vor.
Nach einer Literaturübersicht im ersten und zweiten Kapitel dieser Arbeit, werteten wir ein
kommerzielles fan-beam Micro-CT (µCT 20, SCANCO Medical AG, Bassersdorf, Schweiz)
der zweiten Generationen für Mineralgehaltmessungen aus. Entsprechend unserer Ergebnisse,
ist das Gerät, das bei 50 kVp und 160 µA arbeitet, nicht geeignet, den Mineralgehalt eines
vollständigen Zahnes quantitativ zu bestimmen. So empfehlen wir, die begrenzte
Nachbeschleunigungsspannung des µCT 20 Systems zu beachten und Auswertungen auf
Proben mit 6-Millimeter Querschnitt zu begrenzen. Dies hat gegenüber anderen analytischen
Methoden bereits den Vorteil nondestruktiv ohne die sehr dünnen mikrometrischen Proben
arbeiten zu können.
Die Korrelation von Mikro-CT und von TMR Ergebnissen wurde in unserem zweiten
Experiment ausgewertet (siehe Kapitel 5). Nachdem 70-90 µm dicke Scheiben mit natürlicher
Schmelzkaries durch eine TMR analysiert worden sind, wurden Mikro-CT (µCT 40; Scanco
ZUSAMMENFASSUNG
94
Medical AG, Bassersdorf, Schweiz) Messungen durchgeführt. Die Proben wurden in einen
vollständigen Zahnes eingesetzt, der besonders vorbereitet worden war, um eine
zerstörungsfreie Auswertung zu simulieren. Auch der Randeffekt wurde ausgewertet, indem
man unterschiedliche Schwellen für den Anfang der Läsion verwendete. Unsere Beobachtung
zeigte eine hohe Pearson-Korrelation zwischen den Methoden zur Auswertung des
Mineralverlustes und Läsionstiefe. Daten unterstützen die Entscheidung erst den Wert von 20
vol% für den Anfang der Läsion zu wählen. Ein höherer Wert scheint nicht notwendig zu
sein. Kleinerer Werte können zu einer höheren Veränderung der Werte führen, was auf den
Einflusses des Operateurs und dadurch bedürften Artefakten zurückzuführen ist.
In Bezug auf die Dentinexkavation hat sich der Mikro-CT als ein wertvolles Werkzeug
erwiesen, um zwischen den drei Phasen der Mineralisierung im kariösen Prozess zu
unterscheiden: ein sehr stark entmineralisierter Dentinbereich, eine Schicht zunehmende
Mineralisierung und gesundes Dentin. In diesem Kapitel haben wir eine neue Enzymlösung
(SFC-V, 3M ESPE AG, Seefeld, Deutschland) für die Behandlung von Dentinkaries mit einer
gut belegten Methode verglichen (Carisolv Gel Multimix; MediTeam Dental AB,
Gothenburg, Schweden). Der Gebrauch eines Schwellwerts basieren Auswertung zur
Differenzierung des entfernten und restlichen Dentins nach Dentinkariesexkavation war sehr
vielversprechend. Das mathematische Modell konnte die verbliebene Dicke des
entmineralisierten Dentins sehr gut vergleichen und zusätzlich einen Einblick in seine
dreidimensionale Perspektive geben.
In dieser Arbeit versuchten wir, die gegenwärtigen Möglichkeiten der Mikro-CT Aufnahmen
und Quantifizierung für den Gebrauch in der Kariesforschung zu demonstrieren. Das System
hat Beschränkungen ausichtlich der Wahl der Energieintensität, Artefakte während des
ZUSAMMENFASSUNG
95
Einscannens, der Kalibrierung und der Kosten. Jedoch ist es in der Kariesforschung aufgrund
der dynamischen Eigenschaft der Karies erforderlich zerstörungsfreie Analysen vornehmen zu
können. Die hohe Korrelation, die zwischen dem Mikro-CT System und der zuverlässigsten
Methode der Kariesanalysen (TMR) bestand, bestärkt das Interesse an, mit der Validierung
des Systems weiterzumachen.
Das Mikro-CT kann auch für die Studien zur Schmelz Abrasion und künstlichen Karies in
Schmelz und Dentin verwendet werden. Außerdem könnten Realzeitexperimente und
dreidimensionale Analysen des Mineralverlustes wie auch ein morphologischer Einblick der
Entwicklung von Karies durchgeführt werden. Mit dem längerfristige Experimente reizvoll
Vorteil longitudinale Studien, ohne die Proben zerstören zu müssen, sind ebenfalls denkbar
und möglich.
96
References
Akimoto N, Yokoyama G, Ohmori K, Suzuki S, Kohno A, Cox CF (2001). Remineralization across the resin-dentin interface: In vivo evaluation with nanoindentation measurements, EDS, and SEM. Quintessence Int 32(7):561-570.
Anderson P, Elliott JC, Bose U, Jones SJ (1996). A comparison of the mineral content of enamel and dentine in human premolars and enamel pearls measured by X-ray microtomography. Arch Oral Biol 41(3):281-290.
Angmar B, Glas JE, Carlstrom D (1963). Studies on Ultrastructure of Dental Enamel .4. Mineralization of Normal Human Enamel. J Ultra Mol Struct R 8(1):12-23.
Arends J, ten Bosch JJ (1992). Demineralization and remineralization evaluation techniques. J Dent Res 71(Spec Issue):924-928.
Axelsson C, Danielsson P (1994). Three-dimensional reconstruction from cone-beam data in O(N3logN) time. Phys Med Biol 39:477-491.
Azrak B, Callaway A, Grundheber A, Stender E, Willershausen B (2004). Comparison of the efficacy of chemomechanical caries removal (Carisolv) with that of conventional excavation in reducing the cariogenic flora. Int J Paediatr Dent 14(3):182-191.
Beeley JA, Yip HK, Stevenson AG (2000). Chemochemical caries removal: a review of the techniques and latest developments. Br Dent J 188(8):427-430.
Berger MJH, J.H.; Seltzer, S.M.; Coursey, J.S.; Zucker, D.S. (1999). XCOM: Photon Cross Section Database (version1.2). National Institute of Standards and Technology, Gaithersburg, MD. Available: http://physics.nist.gov/xcom.
Bergman G, Lind PO (1966). A Quantitative Microradiographic Study of Incipient Enamel Caries. J Dent Res 45(5P2):1477-1484.
Bergmans L, Van Cleynenbreugel J, Wevers M, Lambrechts P (2001). A methodology for quantitative evaluation of root canal instrumentation using microcomputed tomography. Int Endod J 34(5):390-398.
REFERENCES
97
Bjorndal L, Larsen T, Thylstrup A (1997). A clinical and microbiological study of deep carious lesions during stepwise excavation using long treatment intervals. Caries Res 31(6):411-417.
Bjorndal L, Thylstrup A (1998). A practice-based study on stepwise excavation of deep carious lesions in permanent teeth: a 1-year follow-up study. Community Dent Oral Epidemiol 26(2):122-128.
Bjorndal L, Larsen T (2000). Changes in the cultivable flora in deep carious lesions following a stepwise excavation procedure. 34(6):502-508.
Bonse U, Busch F (1996). X-ray computed microtomography (µCT) using synchrotron radiation (SR). Prog Biophys Mol Bio 65(1-2):133-169.
Brooks RA, Dichiro G (1976). Beam Hardening in X-Ray Reconstructive Tomography. Phys Med Biol 21(3):390-398.
Bushberg JT (1994). Essential Physics of Medical Imaging. 2nd ed.: Williams & Wilkins.
Carlsson CA (1999). Imaging modalities in x-ray computerized tomography and in selected volume tomography. Phys Med Biol 44:R23-R56.
Casteele EVd (2004). Model-based approach for Beam Hardening Correction and Resolution Measurements in Microtomography (Dissertation). Antwerpen, University of Antwerpen.
Cloetens P, Boller E, Wolfgang L, Baruchel J, Schlenker M (2001). Absorption and phase imaging with synchrotron radiation. Europhysics News 32(2).
Cloetens P, Baruchel J (2002). Synchrotron-radiation Microtomography. European Synchrotron Radiation Facility. Available: http://www.esrf.fr/UsersAndScience/Publications/Highlights/2002/Imaging/IMA1/.
Daculsi G, Kerebel B, Lecabellec MT, Kerebel LM (1979). Qualitative and Quantitative Data on Arrested Caries in Dentin. Caries Res 13(4):190-202.
Damen J, Exterkate R, ten Cate J (1997). Reproducibility of TMR for the determination of longitudinal mineral changes in dental hard tissues. Adv Dent Res 11(4):415-419.
Davis GR, Wong FSL (1996). X-ray microtomography of bones and teeth. Physiol Meas 17(3):121-146.
REFERENCES
98
Davis GR, Elliott JC (1997). X-ray microtomography scanner using time-delay integration for elimination of ring artefacts in the reconstructed image. Nucl Instr and Meth in Phys Res A 394(1-2):157-162.
Davis GR (1998). Faster tomographic fan-beam back-projection using Cartesian axes pre-projection. Nucl Instr and Meth in Phys Res A 410:329-334.
de Josselin de Jong E, ten Bosch JJ, Noordmans J (1987). Optimised microcomputer-guided quantitative microradiography on dental mineralised tissue slices. Phys Med Biol 32(7):887-899.
Dowker SEP, Davis GR, Elliott JC (1997). X-ray microtomography - Nondestructive three-dimensional imaging for in vitro endodontic studies. Oral Surg Oral Med O 83(4):510-516.
Dowker SEP, Anderson P, Elliott JC, Gao XJ (1999). Crystal chemistry and dissolution of calcium phosphate in dental enamel. Mineral Mag 63(6):791-800.
Dowker SEP, Elliott JC, Davis GR, Wassif HS (2003). Longitudinal study of the three-dimensional development of subsurface enamel lesions during in vitro demineralisation. Caries Res 37(4):237-245.
Dowker SEP, Elliott JC, Davis GR, Wilson RM, Cloetens P (2004). Synchrotron x-ray microtomographic investigation of mineral concentrations at micrometre scale in sound and carious enamel. Caries Res 38(6):514-522.
Elhila H, Zolfaghari A, Cazaux J, Audran JC, Mouze D (1996). X-ray microscopy and microtomography: Application in biology. J Phys IV 6(C4):739-745.
The Encyclopaedia of Medical Imaging. Vol 1, Physics, Techniques and Procedures (1999). In: Radiology. H Pettersson, D Allison, GK von Schulthess and H-J Smith editors.
Endo M, Tsunoo T, Nakamori N, Yoshida K (2001). Effect of scattered radiation on image noise in cone beam CT. Med Phys 28(4):469-474.
Fearne J, Anderson P, Davis GR (2004). 3D X-ray microscopic study of the extent of variations in enamel density in first permanent molars with idiopathic enamel hypomineralisation. Brit Dent J 196(10):634-638.
Fluckiger L, Waltimo T, Stich H, Lussi A (2005). Comparison of chemomechanical caries removal using Carisolv or conventional hand excavation in deciduous teeth in vitro. J Dent 33(2):87-90.
REFERENCES
99
Frank RM, Wolff F, Gutmann B (1964). Microscopie electronique de la carie au niveau de l'email humain. Arch Oral Biol 9(2):181-188.
Gao XJ, Elliott JC, Anderson P, Davis GR (1993). Scanning Microradiographic and Microtomographic Studies of Remineralization of Subsurface Enamel Lesions. J Chem Soc Faraday T 89(15):2907-2912.
Garberoglio R, Brannstrom M (1976). Scanning Electron-Microscopic Investigation of Human Dentinal Tubules. Arch Oral Biol 21(6):355-362.
Gelhard TB, Arends J (1984). Microradiography of in vivo remineralized lesions in human enamel. II. J Biol Buccale 12(1):59-65.
Goldman M, Kronman JH (1976). A preliminary report on a chemomechanical means of removing caries. J Am Dent Assoc 93(6):1149-1153.
Habib CM, Kronman J, Goldman M (1975). A chemical evaluation of collagen and hydroxyproline after treatment with GK-101 (N-chloroglycine). Pharmacol Ther Dent 2(3-4):209-215.
Hafstrom-Bjorkman U, Sundstrom F, de Josselin de Jong E, Oliveby A, Angmar-Mansson B (1992). Comparison of laser fluorescence and longitudinal microradiography for quantitative assessment of in vitro enamel caries. Caries Res 26(4):241-247.
Hahn SK, Kim JW, Lee SH, Kim CC, Hahn SH, Jang KT (2004). Microcomputed tomographic assessment of chemomechanical caries removal. Caries Res 38(1):75-78.
Hayakawa T, Mishima H, Yokota I, Sakae T, Kozawa Y, Nemoto K (2000). Application of high resolution microfocus X-ray CT for the observation of human tooth. Dent Mater J 19(1):87-95.
Herkstroter FM, Noordmans J, Ten Bosch JJ (1990). Wavelength-independent microradiography used for quantification of mineral changes in thin enamel and dentin samples with natural surfaces, pseudo-thick tooth sections, and whole teeth. J Dent Res 69(12):1824-1827.
Hildebrand T, Ruegsegger P (1997). A new method for the model-independent assessment of thickness in three-dimensional images. J Microsc-Oxford 185(1):67-75.
Hsieh J, Molthen RC, Dawson CA, Johnson RH (2000). An iterative approach to the beam hardening correction in cone beam CT. Med Phys 27(1):23-29.
REFERENCES
100
Hunter AR, Treasure ET, Hunter AJ (1995). Increases in Cavity Volume Associated with the Removal of Class-2 Amalgam and Composite Restorations. Oper Dent 20(1):2-6.
Huysmans MC, Longbottom C (2004). The challenges of validating diagnostic methods and selecting appropriate gold standards. J Dent Res 83(Spec Issue C):C48-52.
International Tables for crystallography. Vol. III (1962). Birmingham: The Kynoch Press.
Itoh M, Shimazu A, Hirata I, Yoshida Y, Shintani H, Okazaki M (2004). Characterization of CO(3)Ap-collagen sponges using x-ray high-resolution microtomography. Biomat 25(13):2577-2583.
Johansen E, Parks HF (1961). Electron-Microscopic Observations on Soft Carious Human Dentin. J Dent Res 40(2):235-248.
Kak AC, Slaney M (1988). Principles of Computerized Tomographic Imaging. New York: The Institute of Electrical and Electronics Engineers, Inc.
Kalukin AR, Van Geet M, Swennen R (2000). Principal components analysis of multienergy X-ray computed tomography of mineral samples. Ieee T Nucl Sci 47(5):1729-1736.
Kato S, Fusayama T (1970). Recalcification of Artificially Decalcified Dentin in-Vivo. J Dent Res 49(5):1060-1067.
Ketcham RA, Carlson WD (2001). Acquisition, optimization and interpretation of X-ray computed tomographic imagery: applications to the geosciences. Computers & Geosciences 27(4):381-400.
Kidd EAM, Joystonbechal S, Beighton D (1993). The Use of a Caries Detector Dye During Cavity Preparation - a Microbiological Assessment. Brit Dent J 174(7):245-248.
Kidd EAM (2004). How 'clean' must a cavity be before restoration? Caries Res 38(3):305-313.
Klont B, ten Cate JM (1990). Release of organic matrix components from bovine incisor roots during in vitro lesion formation. J Dent Res 69(3):896-900.
Kronman JH, Goldman M, Habib CM, Mengel L (1977). Electron-Microscopic Evaluation of Altered Collagen Structure Induced by N-Monochloroglycine (Gk-101). J Dent Res 56(12):1539-1545.
REFERENCES
101
Kuboki Y, Ohgushi K, Fusayama T (1977). Collagen Biochemistry of 2 Layers of Carious Dentin. J Dent Res 56(10):1233-1237. Kuboki Y (1991). Preparation of collagen from hard tissue. In: Collagen experimental method. Y Nagai and D Fujimoto editors. Tokyo: Kodansha, pp. 21-30.
Lager A, Thornqvist E, Ericson D (2003). Cultivatable bacteria in dentine after caries excavation using rose-bur or Carisolv. Caries Res 37(3):206-211.
Landis E, Keane D, Shah L Microtomography of Cement-Based Materials. National Science Foundation. Available: http://www.umeciv.maine.edu/landis/XMT/Default.htm.
Levine RS, Rowles SL (1973). Further studies on the remineralization of human carious dentine in vitro. Arch Oral Biol 18(11):1351-1356.
Lin CL, Miller JD (1996). Cone beam X-ray microtomography for three-dimensional liberation analysis in the 21st century. Int J Miner Process 47(1-2):61-73.
Lindblom K (1954). On microtomography. Acta Radiol 42(6):465-468.
Mellberg JR, Chomicki WG, Mallon DE, Castrovince LA (1985). Remineralization Invivo of Artificial Caries Lesions by a Monofluorophosphate Dentifrice. Caries Res 19(2):126-135.
Mercer CE, Anderson P, Davis GR (2003). Sequential 3D X-ray microtomographic measurement of enamel and dentine ablation by an Er : YAG laser. Brit Dent J 194(2):99-104.
Miller EJ, Rhodes RK (1982). Preparation and Characterization of the Different Types of Collagen. Methods Enzymol 82:33-64.
Morton EJ, Webb S, Bateman JE, Clarke LJ, Shelton CG (1990). 3-Dimensional X-Ray Microtomography for Medical and Biological Applications. Phys Med Biol 35(7):805-820.
Nuzzo S, Peyrin F, Cloetens P, Baruchel J (2002). Quantification of the degree of mineralization of bone in three dimensions using synchrotron radiation microtomography. Med Phys 29(11):2672-2681.
Ohgushi K, Fusayama T (1975). Electron-Microscopic Structure of 2 Layers of Carious Dentin. J Dent Res 54(5):1019-1026.
Oi T, Saka H, Ide Y (2004). Three-dimensional observation of pulp cavities in the maxillary first premolar tooth using micro-CT. Int Endod J 37(1):46-51.
REFERENCES
102
Pashley EL, Talman R, Horner JA, Pashley DH (1991). Permeability of Normal Versus Carious Dentin. Endodontics & Dental Traumatology 7(5):207-211.
Pearisamy K, Anderson P (2000). Scanning microradiographic monitoring of enamel remineralisation following etch and pumicing. J Dent Res 79(5):1206-1206.
Perdigao J, Lambrechts P, Vanherle G (1995). A Morphological Field-Emission Sem Study of Acid-Etched Dentin. J Dent Res J Dent Res 74(3):916-916.
Peters OA, Peters CI, Schonenberger K, Barbakow F (2003). ProTaper rotary root canal preparation: effects of canal anatomy on final shape analysed by micro CT. Int Endod J 36(2):86-92.
Pettersson H, Allison D, von Schulthess GK, Smith H-J (1998). The Encyclopaedia of Medical Imaging: NICER Institute/ISIS Medical Media.
Rhodes JS, Ford TRP, Lynch JA, Liepins PJ, Curtis RV (1999). Micro-computed tomography: a new tool for experimental endodontology. Int Endod J 32(3):165-170.
Rhodes JS, Ford TRP, Lynch JA, Curtis RV (2000). A comparison of two nickel-titanium instrumentation techniques in teeth using microcomputed tomography. Int Endod J 33(3):279-285.
Robinson C, Weatherell JA, Hallsworth AS (1971). Variatoon in composition of dental enamel within thin ground tooth sections. Caries Res 5(1):44-57.
Rossi M, Casali F, Romani D, Bondioli L, Macchiarelli R, Rook L (2004). MicroCT Scan in paleobiology: application to the study of dental tissues. Nucl Instrum Meth B 213:747-750.
Salome M, Peyrin F, Cloetens P, Odet C, Laval-Jeantet AM, Baruchel J, Spanne P (1999). A synchrotron radiation microtomography system for the analysis of trabecular bone samples. Med Phys 26(10):2194-2204.
Sato Y, Fusayama T (1976). Removal of Dentin by Fuchsin Staining. J Dent Res 55(4):678-683.
Schutzbank SG, Galaini J, Kronman JH, Goldman M, Clark RE (1978). Comparative Invitro Study of Gk-101 and Gk-101e in Caries Removal. J Dent Res 57(9-10):861-864.
REFERENCES
103
Selvig KA (1968). Ultrastructural changes in human dentine exposed to a weak acid. Arch Oral Biol 13(7):719-726.
Sohmura T, Wakabayashi K, Lowmunkong R, Hojo H, Kusumoto N, Okuda H, Kojima T, Nakamura T, Yatani H, Takahashi J (2004). 3D shape measurement of dental casts using medical X-ray CT. Dent Mater J 23(2):121-128.
Sokolik IN (2005). Basic radiometric quantities. The Beer-Bouguer-Lambert law. Concepts of extinction (scattering plus absorption) and emission. Schwarzschild’s equation. Available: http://irina.eas.gatech.edu/EAS8803Fall2005/Lecture3.pdf.
Spanne P (1989). X-Ray-Energy Optimization in Computed Microtomography. Phys Med Biol 34(6):679-690.
Stock SR, Barss J, Dahl T, Veis A, Almer JD (2002). X-ray absorption microtomography (microCT) and small beam diffraction mapping of sea urchin teeth. J Struct Biol 139(1):1-12.
Takeda T, Itai Y, Hayashi K, Nagata Y, Yamaji H, Hyodo K (1994). High spatial resolution CT with a synchrotron radiation system. J Comput Assist Tomogr 18(1):98-101.
ten Bosch JJ, Angmar-Mansson B (1991). A Review of Quantitative Methods for Studies of Mineral-Content of Intraoral Incipient Caries Lesions. J Dent Res 70(1):2-14.
Theuns HM, Driessens FC, van Dijk JW, Groeneveld A (1986). Experimental evidence for a gradient in the solubility and in the rate of dissolution of human enamel. Caries Res 20(1):24-31.
Tonami KI, Araki K, Mataki S, Kurosaki N (2003). Effects of chloramines and sodium hypochlorite on carious dentin. J Med Dent Sci 50(2):139-146.
Tonami KI, Ericson D (2005). Protein profile of pepsin-digested carious and sound human dentine. Acta Odontol Scand 63(1):17-20.
Tveit AB, Selvig KA (1981). Invivo Re-Calcification of Dentin Demineralized by Citric-Acid. Scandinavian J Dent Res 89(1):38-42.
Tyas MJ, Anusavice KJ, Frencken JE, Mount GJ (2000). Minimal intervention dentistry - a review - FDI Commission Project 1-97. Int Dent J 50(1):1-12.
REFERENCES
104
Van Geet M (1997). X-Ray Microfocus Computer Tomography. Katholieke Universiteit Leuven. Available: http://www.kuleuven.be/geology/Fcg/Sediment/Research/maarten/xray.htm.
Wakabayashi K, Sohmura T, Nakamura T, Kojima T, Kinuta S, Takahashi J, Yatani H (2005). New evaluation method by microfocus radiograph CT for 3D assessment of internal adaptation of all-ceramic crowns. Dent Mater J 24(3):362-367.
Weatherell JA, Weidmann SM (1967). Density Patterns in Enamel. Caries Res 1:42-51.
Wilson PR, Beynon AD (1989). Mineralization Differences between Human Deciduous and Permanent Enamel Measured by Quantitative Microradiography. Arch Oral Biol 34(2):85-88.
Wolfgang L (2001). Development and applications of synchrotron radiation microscopy (Dissertation). München, Ludwig-Maximilians-Universität München.
Wong FS, Elliott JC, Anderson P, Davis GR (1995). Mineral concentration gradients in rat femoral diaphyses measured by X-ray microtomography. Calcif Tissue Int 56(1):62-70.
Wong FS, Elliott JC, Davis GR, Anderson P (2000). X-ray microtomographic study of mineral distribution in enamel of mandibular rat incisors. J Anat 196(Pt 3):405-413.
Wong FSL, Anderson P, Fan H, Davis GR (2004). X-ray microtomographic study of mineral concentration distribution in deciduous enamel. Arch Oral Biol 49(11):937-944.
Yip HK, Stevenson AG, Beeley JA (1994). The Specificity of Caries Detector Dyes in Cavity Preparation. Brit Dent J 176(11):417-421.
Yip HK, Beeley JA, Stevenson AG (1995). Mineral content of the dentine remaining after chemomechanical caries removal. Caries Res 29(2):111-117.
Young RA, Brown WE (1982). Structures of biological minerais. In: Nacollas Biological mineralization and demineralization. Dahlem Konferenzen. Berlim: Springer Verlag, pp. 101-141.
Young S, Muller H, Marshall W (1983). Computed tomography: beam hardening and environmental density artifact. Radiology 148(1):279-283.
Zolfaghari A (1996). An iterative reconstruction algorithm in cone beam geometry: Simulation and application in X-ray microtomography. Nucl Instrum Meth A 378(1-2):326-336.
105
Acknowledgments
The plan and elaboration of this dissertation could only be rendered with the supportive interest,
encouragement and tangible contribution of many people. Therefore, I have the privilege to acknowledge the
assistance of all who participate in the preparation of this thesis.
Agradeço primeiramente ao meu marido Gustavo Luedemann, que me encorajou a seguir meu coração e
buscar meus sonhos. Pelo seu apoio, nos momentos de dúvida e desânimo, sempre me estimulando a pensar de
forma científica e racional. Também pelo seu amor que me fez suportar a distância da minha terra querida.
Agradeço a meu filho, João Pedro, que ainda na minha barriga, sem ter conhecimento, encheu-me de força
para concluir minha pesquisa e finalizar este trabalho. Eu os amo demais!
Minha amada família, papai, mamãe, Tatá, Marcelo e Nanana. Por mais uma vez apoiar minha partida em
busca dos meus sonhos. Tenho certeza que sem o amor presente de vocês a distância e o caminho seriam mais
duros. Meu eterno MUITO OBRIGADA!!!
An meinen Doktorvater Prof. Dr. Karl-Heinz Kunzelmann mein herzlichen Dank für sein Vertrauen und
seine Unterstützung. Seine Kompetenz und Bereitwilligkeit neue Anwendungen für das Mikro-CT in der
zahnmedizinischen Forschung zu entdecken ergaben eine fruchtbare und dauernde Zusammenarbeit.
I would like to thank the Director of the Department of Restorative Dentistry of the University of
Munich, Prof. Dr. Reinhard Hickel, for the encouragement and support to send me to all important
scientific congresses which took place during my stay. It was exactly in one of these conferences that I had
the privilege to meet Dr. Jaap ten Bosch. I am very grateful to you, Jaap, for all helpful discussion
concerning the planning of this work, insuring that even with the distance, every small detail would be
properly done. Thanks for trusting on me and on this project.
ACKNOWLEDGMENTS
106
Special thanks to Dr. Elbert Josselin de Jong for all valuable comments and to be by my side during the
whole TMR phase, in the University of Freiburg, ensuring the high quality of the analysis.
Mein Herzlichen Dank an Prof. Dr. Hellwig und seine Mitarbeiter in der Universität Freiburg, für die
reibungslose Bereitstellung und Einleitung in den TMR Messungen. Und auch für den herzlichen Empfang
in Freiburg.
I gratefully acknowledge the Department of Anatomy and members for sharing their equipment to my first
micro-CT evaluations, especially Mrs. Maiko Matsuura, for the initial instructions and for the infinite
patience when I filled her disk with enormous tomographic data.
Many colleagues of the department of Restorative Dentistry of the University of Munich have also assisted
me in numerous ways. Thanks Dr. Thomas Obermeier for helping me always with computer support,
memory troubles, internet access, etc. Dr. Nicoleta Ilie, a great researcher and friend, have helped me with
encouragement, shared knowledge and friendship. Many thanks for the enjoyable moments making the
working time more pleasant.
Thanks to DAAD and Capes, for the financial support during my work in Germany, for the German curse
and travel tickets.
Um agradecimento especial aos meus novos e eternos amigos que encontrei na Alemanha. Os nossos
momentos de descontração e amizade estarão sempre na minha lembrança. Iris, Michael, Roberto, Elaine,
Evelize e Zé. As minhas amigas irmãs de jornada, colegas de faculdade, que sempre estivem ao meu lado e
que do Brasil torceram pelo meu sucesso. Ana Carolina Robles, Cristiane Magalhães e Juliana Azevedo.
Minha nova família Luedemann, que me aceitou de braços abertos, mesmo com tamanha distância. Também
pelo apoio e carinho, muito obrigada.
107
Curriculum Vitae
Name: Tatiana Nogueira Rocha Clementino Luedemann
Place and date of birth: Brasília, DF, Brazil – 04.12.1976
Civil status: Married
Primary School:
Escola Paroquial Santo Antônio (1984 – 1990). Brasília, DF, Brazil
Centro Educacional Sigma (1991). Brasília, DF, Brazil
Secondary School:
Colégio Objetivo (1992). Brasília, DF, Brazil
North Carolina School of Arts (1992 – 1993), Winston Salem, USA
Colégio Objetivo (1994 – 1995). Brasília, DF, Brazil
Undergraduation:
Pontifícia Universidade Católica (1996 – 2000). Belo Horizonte, MG, Brazil – Degree of
Dental Science
Post-graduation:
Escola de Aperfeiçoamento Profissional – ABO/MG. Belo Horizonte, MG, Brazil –
Especialization in Restorative Dentistry
Publications:
Clementino-Luedemann, T. N. R and Kunzelmann, K-. H (2006). Mineral Concentration of
Natural Human Teeth by a Commercial Micro-CT. Dent Mater J 25(1):113-119.
Clementino-Luedemann, T. N. R; Dabanoglu, A.; Ilie, N; Hickel, R. and Kunzelmann, K-. H. (2006). Micro-computed Tomographic Evaluation of a New Enzyme Solution for Caries Removal in Deciduous Teeth. Dent Mater J 25(4):675-683.


![Aus der Poliklinik der Zahnerhaltung und Parodontologie ... · kanalaufbereitung wurden durch eine Umfrage in Nordjordan untersucht [Al Omari 2004]. Eine vergleichbare Untersuchung](https://img.pdfslide.net/doc/110x75/5d4a079088c993e6068bbe23/aus-der-poliklinik-der-zahnerhaltung-und-parodontologie-kanalaufbereitung.jpg)