Embed Size (px)
Citation preview

Austerity and Anarchy:
Budget Cuts and Social Unrest in Europe, 1919-2008
Jacopo Ponticelli Hans-Joachim Voth⇤
Abstract
Does fiscal consolidation lead to social unrest? Using cross-country evidence
for the period 1919 to 2008, we examine the extent to which societies become
unstable after budget cuts. The results show a clear correlation between fis-
cal retrenchment and instability. Expenditure cuts are particularly potent in
fueling protests; tax rises have only small and insignificant e↵ects. We test if
the relationship simply reflects economic downturns, using a recently-developed
IMF dataset on exogenous expenditure shocks, and conclude that this is not the
case. While autocracies and democracies show broadly similar responses to bud-
get cuts, countries with more constraints on the executive are less likely to see
unrest after austerity measures. Growing media penetration does not strengthen
the e↵ect of cut-backs on the level of unrest. We also find that austerity episodes
that result in unrest lead to quick reversals of fiscal policy.
⇤Ponticelli: UPF ([email protected]); Voth: ICREA/UPF and CREI ([email protected]).We thank Alberto Alesina, Silvia Ardagna, Carlo Favero, and Francesco Giavazzi for sharing theirdata, and Olivier Blanchard, Vasco Carvalho, Mario Diani, Jordi Galı, Nicola Gennaioli, Tim Leunig,Kris Mitchener, Federico Todeschini, Alan Taylor, and Carlos Vegh for comments on the paperand the project at large. Seminar audiences at the 2011 EHA meetings, the 2010 Bank of ChileFiscal Policy Conference, Chatham House, the 2012 INET Conference in Berlin, and at CREI o↵eredfeedback. Financial support by the European Research Council and the Barcelona GSE is gratefullyacknowledged.
1

1 Introduction
From the French Revolution to the Arab Spring, social unrest has led to key turn-
ing points in history. Marx saw it as the driving force of the transition of societies
from feudalism to capitalism and, eventually, communism. The power of unrest as a
catalyst for change manifests itself explicitly in regime changes, or it operates through
expectations: The extension of the franchise in Western societies can be seen as a bid
to reduce the threat of revolution (Acemoglu and Robinson, 2000).1 What leads to
social unrest is less clear. Economic shocks are one possible contributing factor: The
demise of the Weimar Republic at the height of the Great Depression is a prominent
example of economic hardship translating into political instability and social unrest
(Bracher, 1978).2
In this paper, we examine one of the possible determinants of unrest and violent
protests - fiscal policy. How do budget measures a↵ect the level of social instability?
The extent to which societies fracture and become unstable in response to drastic
retrenchment in the government budget is a major concern for policymakers tackling
large budget deficits: To name but two examples, in both Argentina in 2001 and in
Greece in 2010-11, austerity measures often coincide with waves of protest and civil
unrest. Economic conditions can deteriorate further and faster if political and social
chaos follows attempts to reign in spending.3 Consequently, sustainable debt levels for
countries that are prone to unrest may be lower than they otherwise would be.
Using a panel dataset for 25 European countries covering the period 1919 to 2008,
we show a clear link between the magnitude of expenditure cut-backs and increases in
social unrest. With every additional percentage point of GDP in spending cuts, the risk
of unrest increases. This finding is surprising in the light of the recent political economy
literature on expenditure cuts. Alesina et al. (1998, 2010) show that governments
typically do not lose votes in elections after they implement austerity programs (and
relatedly, there is no electoral benefit for free-spending parties (Brender and Drazen,
2008). The fact that austerity may lead to unrest - even without penalties at the ballot
box - may help to explain why governments are typically reluctant to cut spending,
even if this might be economically beneficial.4
Europe over the last century is an an ideal testing ground for our hypthesis. The
continent went from high levels of instability in the first half of the 20th century to
1In a related exercise, Boix (2003) models the incentives of the populace to resort to violence asa function of the wealth distribution and economic development.
2The French Revolution has also been interpreted in these terms (Soboul, 1974; Doyle, 2001). Theview is controversial (Hunt, 2004; Cobban, 1964).
3Bloom (2009) documents how uncertainty shocks can reduce output.4Alesina and Ardagna (2010); Alesina et al. (2002); Guajardo et al. (2011). An early example in
the literature is Giavazzi and Pagano (1990). The finding is controversial – cf. Devries et al. (2011).
2

relatively low ones in the second, and from frequently troubled economic conditions
to prosperity. It thus provides a rich laboratory of changing economic, social and
political conditions. In terms of outcome variables, we focus on riots, demonstrations,
political assassinations, government crises, and attempted revolutions. These span the
full range of forms of unrest, from relatively minor disturbances to armed attempts to
overthrow the established political order. We compile a new index that summarizes
these variables, and then ask - for every percentage cut in government spending, how
much more instability should we expect?
As a first pass at the data, Figure 1 shows the relationship between fiscal adjust-
ment episodes and the number of incidents indicating instability (CHAOS). CHAOS is
the sum of demonstrations, riots, strikes, assassinations, and attempted revolutions in
a single year in each country. The first set of five bars show the frequencies conditional
on the size of budget cuts. When expenditure is increasing, the average country-year
unit of observation in our data registers less than 1.4 events. For moderate budget
cuts, there is no increase in the frequency of unrest. However, as austerity inten-
sifies, the frequency of disturbances rises. Above 3%, the frequency of events rises
markedly. Once austerity measures involve expenditure reductions by 5% or more,
there are around 4 events per year and country - more than twice as many as in times
of expenditure increases or mild cuts.
[Figure 1 here]
The same relationship can be observed in each of the four main subcategories of
CHAOS. The frequency of riots, demonstrations, political assassinations, and general
strikes is greatest for the biggest cuts. While small cuts have few e↵ects, beyond a
certain threshold, unrest explodes.
The strength of the link between austerity measures and unrest is our first impor-
tant finding. Is the link causal? Other factors, such as generally depressed economic
conditions, have the potential to drive up unrest and the need for cut-backs simulta-
neously. Controlling for economic growth does not change our results. This suggests
that we capture more than a general association between economic downturns and
unrest. Also, controlling for ethnic fragmentation and unemployment does not change
our result. Findings are robust to adding other possible tools available to governments
to finance public deficit as controls: inflation and public debt.
To demonstrate that causality runs from cut-backs to unrest, we use recently com-
piled data on changes in the government budget that follow directly from discretionary
policy decisions (Devries et al., 2011).5. In addition, we draw on the work by Alesina
5The recent work by Devries et al. (2011) follows in the footsteps of Romer and Romer (1989,2010). For a critique of the application to US fiscal policy after 1945, cf. Ramey (2011)
3

et al. (2012) that decomposes changes in the government budget that follow directly
from discretionary policy decisions into their anticipated and unanticipated compo-
nents. For both types of additional evidence, we find clear indications that the link
runs from budget cuts to unrest.
Our findings are robust to a wide range of alternative specifications and further
tests. Di↵erent measures of unrest do not a↵ect our conclusions. We examine if the
link between austerity and unrest changes as countries institutions improve. For most
values of the Polity2 score of institutional quality, results are broadly constant. How-
ever, countries with very high levels of constraints on the executive show a somewhat
weaker degree of association. Further, we examine if the spread of mass media changes
the probability of unrest. This is not the case. If anything, higher levels of media avail-
ability and a more developed telecommunications infrastructure reduce the strength
of the mapping from budget cuts to instability. We also test which part of the distri-
bution of unrest is responsible for our results, using quantile regressions: The higher
the level of unrest, the bigger the relative impact of additional budget cuts. Finally,
we test for asymmetries in the relationship between unrest and austerity. Reductions
increase instability, but spending increases do not cut the number of incidents to the
same extent.
Earlier papers have typically focussed on case studies, on relatively short time-
periods, or on subsets of the developing world.6 DiPasquale and Glaeser (1998) ana-
lyzed race riots in the US in the 1960s and early 1990s.7 They find that ethnic hetero-
geneity and unemployment rates are a strong predictors of riots, and that poverty is
relatively unimportant. Bohlken and Sergenti (2010) argue that riot probabilities in
India over the period 1982-95 dropped sharply when growth rates accelerated. Field
et al. (2008) examine religious violence in Ahmedabad, India, in 2002, and argue that
tenancy rights created neighborhoods that were more integrated, and hence more prone
to violence.
Comparative work by Alesina and Perotti (1996) suggests that inequality leads
to more unrest, and this instability can adversely a↵ect investment. Work on 23
African countries during the 1980s found that budget cuts had typically no e↵ect
on political and social stability. IMF interventions, on the other hand, often led to
more frequent disturbances (Morrison et al., 1994). Paldam (1993) examines current
account crises in seven South American countries during the period 1981-90, using
high-frequency (weekly) data. He finds that the run-up to new austerity measures is
associated with higher levels of unrest, but that actual implementation is followed by
6Theoretical work on unrest includes Kuran (1989), Tullock (1971), and Grossman (1991).7The authors also analyse international data for the period 1960-85. They find that higher GDP
reduces the incidence of riots, while urbanization rates are positively associated with them.
4

fewer disturbances. Similarly, Haggard et al. (1995) find that IMF interventions and
monetary contractions in developing countries led to greater instability. Analyzing the
period 1937-1995, Voth (2011) explores related issues for the case of Latin America.
He finds that austerity and unrest are tightly linked in a majority of cases.8 Martin
and Gabay (2012) analyze fiscal protests in a set of European countries after 1980,
and argue that incompatibilities between tax and spending policies are responsible for
popular opposition. Andronikidou and Kovras (2012) focus on cultural determinants
of di↵erential inclinations to protest.
Relative to these papers, we make several contributions. To the best of our knowl-
edge, ours is the first systematic analysis of how budget cuts a↵ect the level of social
instability and unrest in a broad cross-section of developed countries, over a long pe-
riod. We also examine the exact causes of instability in a subset of the data where
more detailed information is available, and find a strong link with austerity. This also
allows us to perform placebo tests. Using detailed evidence on the motivations for
government expenditure changes, we strengthen the causal link still further. Finally,
we examine the link between instability and media penetration.
Other related literature includes work on the political economy of fiscal consol-
idation and its economic e↵ects, as well as the logic of conflict between politicians
and society. Recent work has emphasised that cutting entitlement programs tends to
produce persistent improvements in the budget balance, while revenue measures and
capital expenditure cuts have only temporary e↵ects (Alesina and Perotti, 1995). The
timing of stabilization measures has been explored in war-of-attrition models, which
view relative bargaining strength of di↵erent groups as crucial (Alesina and Drazen,
1991). A rich literature has examined the macroeconomic e↵ects of budget cuts. Gi-
avazzi and Pagano (1990) and Alesina et al. (2002) find that cuts can be expansionary.
Amongst the reasons suggested for this finding are a reduction in uncertainty about
the course future spending (Blanchard, 1990a), and a positive wealth shock as a re-
sult of lower taxes in the future (Bertola and Drazen, 1993).9 Recently, work by the
IMF has suggested that austerity measures may be less expansionary than previously
thought; they may well have the standard negative Keynesian e↵ects as a result of
lower demand (IMF, 2010; Guajardo et al., 2011).
We also relate to the rich literature on conflict between the government and society
at large. Persson et al. (1997) argue that the separation of powers in modern consti-
tutions is deliberately designed to engineer conflict, preventing the abuse of power. It
could be argued that ”direct action” in the form of demonstrations and extra-legal
8There is also a rich literature on economic instability and political radicalization, which we cannotsurvey here. For a recent analysis of the interwar period, cf. De Bromhead et al. (2012).
9Once the response of labor supply and capital formation is fully taken into account, these e↵ectsmay not go through (Baxter and King, 1993).
5

means such as riots act as an extreme form of ”checks and balances” on the execu-
tive. Other related work that also treats the issue of conflict between government and
governed includes the work of Buchanan and Tullock (1962), Ferejohn (1986), Shleifer
and Vishny (2002).
The paper is structured as follows: Section 2 presents our data, and section 3 sum-
marises our main results. Robustness checks and extensions are discussed in section
4; section 5 concludes.
2 Data
In this section, we briefly describe our data and summarize its main features. Five
main indicators of domestic conflict in the long-term data form the main basis of this
study - general strikes, riots, anti-government demonstrations, political assassinations,
and attempted revolutions. These data are part of the Cross National Time Series
Dataset, compiled by Banks (2010) and his collaborators. The main source of data
on unrest episodes are the reports of the The New York Times, while the variables’
definition is adopted from Rummel and Tanter (1971). In addition, we use data on
GDP, government revenue, expenditure, and the budget balance from a variety of
sources.10 The dataset contains information on 25 European countries and covers the
years from 1919 to 2008.11
Table 1 gives an overview of the main variables and their descriptive statistic for
the long-term data. The average number of assassinations and general strikes was
quite low in our sample, with less than 2 events in each decade. There were more
riots and more demonstrations, 5-6 per decade. Attempted revolutions are quite rare,
but some countries registered high levels of instability. The record in our sample is
Germany in 1923, with 5 recorded attempts at overthrow (with communist insurgencies
in Saxony and Thuringia, the Hitler Beer Hall Putsch, and a separatist movement in
the Rhineland). Assassinations and riots similarly show a broad range of observed
values. Almost a century of data includes some extreme observations.12 For example,
Austria and Germany saw major output declines in 1945 and 1946, respectively. The
biggest reduction in governments spending in our data occurred in Poland, in 1982;
the second-largest, in Finland, in 1947. The start of wars is often associated with big
increases in expenditure. The record-holder in our dataset is Hungary in 1940, with
10See the Data Appendix for a detailed description of the sources of each variable11The countries included are: Austria, Belgium, Bulgaria, Cyprus, Czech Republic, Denmark,
Estonia, Finland, France, Germany, Greece, Hungary, Ireland, Italy, Netherlands, Norway, Poland,Portugal, Russian Federation, Slovak Republic, Spain, Sweden, Switzerland, United Kingdom, Yu-goslavia.
12In the data appendix we explain in detail how we deal with outliers.
6

an increase of over 30 percent.
[Table 1 here]
To obtain a single measure of instability, we calculate CHAOS by taking the sum of
the number of assassinations, demonstrations, riots, general strikes, and attempted rev-
olutions. While a crude way of aggregating indicators, it has high predictive power.13
In the robustness section, we show that alternative methods of reducing data com-
plexity such as principal components analysis do not change our results.
For CHAOS, the average country in our sample registers 1.6 incidents per year.
Instability was not constant over time. The maximum is higher - Italy in 1947 saw
a total of 38 incidents, including 7 general strikes, 19 riots, and 9 anti-government
demonstrations. Figure 2 gives an overview of the evolution over time, plotting the
average of CHAOS as well as the maximum number of incidents observed. While there
is no clear-cut pattern over time, some features emerge. The interwar period showed
relatively high levels of unrest, with an average of 1.8 incidents per year, compared to
1.3 in the post-war period. The immediate post-World War II period, and the period
form 1968 to 1994 also show unusually high levels of unrest. Comparatively speaking,
the years since 1994 have been unusually tranquil (average CHAOS = 0.68).
[Figure 2 here]
In compiling information on expenditure and the budget balance data, we need to
trade o↵ the accuracy of information against availability over a long time span. We rely
on standard data sources on the central government revenue and expenditure relative
to GDP from Mitchell (2007), augmented by data from the OECD when available
(mostly from 1970 onwards). Expenditure changes will serve as the main explanatory
variable. Figure 3 graphs changes in expenditure/GDP from one year to the next. The
distribution is almost symmetric around the mean, with similar numbers of country-
years witnessing expenditure increases and declines (787 vs 662). In an average year
and country over the period, central government expenditure relative to GDP rose by
0.3%. The vast majority of observations is in the range of changes by less than 3%,
with a few outliers in the tails of the distribution (typically driven by the beginning
and end of wars).
[Figure 3 here]
13One alternative is the weighted conflict index (wci), as compiled by Banks (2010). It gives fixedweights determined to di↵erent forms of unrest: Demonstrations have a weight of 200, while politicalassassinations have a weight of 24.
7

When focusing on the sub-period from 1970 to 2007, we use cyclically adjusted
fiscal data constructed by Alesina and Ardagna (2010).14 In particular we employ
their data on primary expenditure, government investment, total revenues and the
primary budget balance. In this way we correct for both changes in interest payments
and the immediate e↵ect of the economic cycle, which drives both expenditure and
revenue without any additional policy decision being taken. For a subsample of the
data (1978-2008, 17 countries), we also use data by Devries et al. (2011). These
authors examine in detail the policy changes that led to changes in a country’s fiscal
stance. Only expenditure cuts or revenue increases motivated by a decision to press
ahead with fiscal consolidation are considered.15 Overall, Devries et al. (2011) find
173 periods of fiscal policy adjustment.
As a first pass at the data, we repeat the exercise in Figure 1 for output growth
(Figure 4). We subdivide the sample into terciles, and examine how much the inci-
dence of various indicators of unrest declines as growth accelerates. For the summary
indicator (CHAOS), there are a little more than 2 incidents when growth is in the
lowest tercile. This falls to 1.3-1.5 incidents as growth accelerates. There is also a
clear pattern of decline for demonstrations and for assassinations. In the case of riots,
the di↵erences are smaller overall, whereas in the case of general strikes, there seems
to be little pattern at all. Based on a first, visual inspection of the data, it seems that
the link between budget cuts and unrest is clearer than the one with growth.
[Figure 4 here]
Next, we examine the correlation structure of our data in Table 2. Assassinations,
general strikes, riots, revolutions and demonstrations are all positively and significantly
correlated with each other. This supports our assumption that they reflect a broader
underlying pattern of social instability and unrest. CHAOS is also positively correlated
with the weighted conflict index (wci). Finally, Table 2 suggests that higher levels of
expenditure and faster growth are associated with less unrest. The simple correlation
of CHAOS with changes in the budget balance is positive and significant. Higher
taxes and lower expenditure are associated with more unrest, but the relationship is
not significant.
[Table 2 here]
In the case of output changes, the coe�cient is negative, but insignificant (Table
2). The simple correlations suggest that these co-movements do not extend to all indi-
cators of unrest equally: riots, revolutions, and demonstrations decline as expenditure
14Alesina and Ardagna use the method of Blanchard (1990b)15The approach is similar to the “narrative approach” pioneered by Romer and Romer (1989)
8

rises, but assassinations and strikes seem - at a first pass - uncorrelated. Similarly,
output growth seems to correlate negatively with assassinations, riots, revolutions,
and demonstrations, but not with strikes. Next, we examine the connection between
budget position, expenditure, and unrest more systematically.
3 Results
The graphical evidence in Figures 1 and 4 suggests a link between “hard times” - low
growth and budget cut-backs - and unrest. Next, we examine if there is a systematic
relationship between budget measures and social instability. We present evidence
from the last century of budget cuts and turmoil, and then show that these hold if we
use a more narrow but cleanly defined measure of austerity. The dynamic nature of
responses to spending reductions is also not responsible for our results. Next, we look
at interaction e↵ects with institutional factors. Do countries with more accountable
governments weather the storms of austerity better? We find an inverse relationship
between government spending and unrest at all levels of institutional quality, but the
link appears stronger the more authoritarian a regime is. Finally, we examine the
impact of media penetration.
3.1 Baseline Results
We estimate simple panel regressions of the type:
Iit = ↵ + ↵i + ↵t + ��Bit + �X 0it + "it (1)
where Iit denotes the level of instability in country i at time t, �Bit is a measure of
the change in the budget position, ↵i is a country-specific intercept, ↵t is a time-specific
dummy, and Xit is a vector of control variables.
We use CHAOS as the dependent variable in our baseline specification, and test the
robustness of findings to alternative specifications later. CHAOS is a count variable.
To avoid issues of overdispersion, we estimate a negative binomial model clustering
standard errors at the country level.16 This takes the highly skewed distribution
of the number of incidents into account. Table 3 gives the main results. We find
that expenditure cuts are strongly and significantly associated with the number of
unrest incidents in any one country and year (column 1). The same is true of overall
improvements in the budget position (column 3). We find a positive e↵ect of tax rises,
but the coe�cient is small and the estimated standard error is large (column 2).
16In the robustness section, we show that Poisson Quasi-Maximum Likelihood estimation yieldnearly identical results.
9

Under OLS with fixed e↵ects and year-dummies, we find the same pattern: ex-
penditure increases reduce instability in a powerful way (column 4). A one standard-
deviation cut in expenditure raises the number of incidents (CHAOS) by 0.4 per year
and country. Tax increases have a positive sign, but the e↵ect is not significant at stan-
dard levels (column 5). It is also small - a one standard deviation rise in the tax/GDP
ratio increases unrest by less than 0.01 events. Overall, we find that improvements in
the budget balance raise the level of unrest (column 6).
[Table 3 here]
To illustrate the magnitude of e↵ects, we present the predicted number of incidents
per year conditional on di↵erent values of expenditure changes and GDP growth. Table
4 performs such an analysis. We see that for any given level of GDP growth, the
implied number of unrest episodes rises rapidly as expenditure is cut. At negative
growth of 2%, for example, going from expenditure cuts of 1% to 10% implies almost
a doubling of the frequency of unrest. Compared to this, the e↵ects of poor economic
performance are relatively mild. Going from negative growth of 2% to a collapse by
10% only increases the predicted number of incidents by 0.18 p.a. [holding expenditure
cuts constant at 1%]. The higher the level of expenditure cuts, the higher the e↵ect
of low growth. At expenditure cuts of 10%, the same change in growth rates produces
0.29 extra incidents.
[Table 4 here]
3.2 Full Set of Controls, 1970-2007
The downside of using the full sample, for the years 1919-2008, is that many im-
portant covariates are not available. For example, consistent and comparable data on
unemployment rates is rare for earlier periods. To address this issue, we estimate the
same regressions but with a full set of controls, for a subset of 16 countries over the
period 1970-2007.
[Table 5 here]
We add changes in output per head, unemployment, ethnic fractionalization, polity
scores, the debt/GDP level, as well as changes in inflation and the primary budget
balance to our set of explanatory variables. For this subset of the sample, our fiscal
variables are also more cleanly defined. We can use primary expenditure - net of
debt servicing cost - which is conceptually superior. Some of the variation in primary
expenditure and total revenue could, however, also reflect changes that are driven by
10

automatic stabilizers. To take this into account we cyclically adjust all fiscal variables
using the Blanchard methodology (as in Alesina and Ardagna, 2010), in an attempt to
clean as much as possible the change in fiscal variables from their cyclical component.
As Table 5 shows, the link between expenditure cuts and unrest remains una↵ected,
as is the predictive power of the budget position overall. In contrast to the results with
the full sample, tax increases appear to be also strongly associated with instability.
We will analyze this issue further when using information on the cause of each unrest
event. Finally, in column 4, we examine if adjusting the budget position for debt
service (using the primary surplus as the explanatory variable) changes our findings;
it does not. In addition, we find positive coe�cients on ethnic fractionalization and
unemployment, which is in line with the results by DiPasquale and Glaeser (1998).
Inflation is strongly and negatively associated with unrest, giving credence to theories
that see it as a way to preserve “social peace” in economies under pressure (Feldman,
1997).
3.3 Results with Exogenous Retrenchment Measures
The obvious challenge in interpreting equation (1) is the potential for omitted vari-
able problems. It is possible that the economic cycle is simultaneously driving both un-
rest and the need for budget cuts. Above, we already control for GDP growth rates, and
our main finding remains una↵ected. However, the omitted variable problem would
only be solved if we measured the e↵ect of economic output on instability perfectly.
Since this is unlikely, we present another type of analysis. We use a recently-developed
database on the motivations behind expenditure changes to separate cyclically-driven
austerity from deliberately-targeted measures that aim at restoring sustainability over
the long run.
In Table 6 we use the IMF measure of policy-action based changes in expenditure,
revenues and the budget balance to strengthen the argument for a causal link. Here,
the source of variation is identified as cleanly as possible: Only changes in the bud-
get balance motivated by concern about the long-run fiscal position are used. The
downside is that we only have information on episodes of fiscal retrenchment (deficit
reductions) and not on periods of fiscal expansion. Using this action-based measure
as explanatory variables for unrest produces a negative, large and significant coe�-
cient for change in expenditure, a positive and non significant coe�cient for change in
revenues and a positive and significant coe�cient for the budget balance.
In columns 4 to 6 we use the Alesina et al. (2012) decomposition of anticipated
and unanticipated changes in fiscal variables to refine the analysis further. For each
year, we use the unanticipated share of expenditure, revenues and budget position as
11

an additional explanatory variable. As the regression results show, unrest rises the
most when spending cuts are unanticipated – rioting and other forms of protest occur
in direct response to new policy measures. The closer we get to measuring the impact
of policy measures, the stronger the link between austerity and unrest becomes. This
strengthens the case for a causal link between unrest and austerity.
[Table 6 here]
3.4 Accounting for Dynamics
So far, we have ignored the time-series dynamics in our data. Unrest shows positive
and significant serial correlation for up to 2 years. In addition, we have abstracted
from anticipation e↵ects – events on the street may be caused as much by anticipated
expenditure cuts, for example, as by those actually taking place. In Table 7, we show
results for a number of dynamic specifications. In column 4, we examine the e↵ect of
expenditure cuts from t-2 (two years previous) to t+2. We find that there is a relatively
small (and insignificant) e↵ect of expenditure cuts in the previous year. In contrast,
the e↵ect of current-year changes remains strong and highly significant. Austerity in
the next year also has predictive power for unrest at time t – unrest is just as likely to
erupt in response to current as to future austerity. In column 5, we examine the e↵ect
of including lagged social instability. While highly significant, the estimated coe�cient
for the other variables are largely una↵ected. The same conclusion emerges from the
final column (6); future positive GDP growth is associated with less growth, but the
e↵ect is not well-estimated.
[Table 7 here]
3.5 Institutions and the Sensitivity of Unrest to Austerity
Greater constraints on the executive and more democracy should on the one hand
reduce social conflict, producing less of a need to take to the streets.17 On the other
hand, there will be less repression by the authorities in more democratic countries
with higher Polity scores, making it easier for protests to be organized. Which e↵ect
dominates is not clear ex ante. Table 8 demonstrates that in countries with better
institutions, the responsiveness of unrest to budget cuts is generally lower. Where
constraints on the executive are minimal, the coe�cient on expenditure changes is
strongly negative - more spending buys a lot of social peace, and expenditure cuts
powerfully fan the flames of discontent. As we limit the sample to ever more democratic
17For reflections on the relationship between institutions and social conflict, cf. Acemoglu (2003).
12

countries, the size of the coe�cient declines slightly. For mature democracies with a
full set of civil rights, the coe�cient is still negative, but much smaller and no longer
significant. The link with growth is also relatively stable. Higher output generally
dents the tendency to riot, demonstrate, assassinate, or strike in countries with low
institutional quality. The only exception is in full democracies, where the connection
is weaker but still negative, and in the most authoritarian regimes, where there is no
clear link.
[Table 8 here]
3.6 Media Penetration
Does greater media penetration increase or reduce unrest? Events in the Arab
world in 2010 and early 2011 have led many observers to argue that greater media
availability tightens the link between discontent and unrest. Data on media penetra-
tion is available in the Banks dataset.Three indicators are relevant - phone penetra-
tions per capita, radio and television take-up.18 Radio and television are unidirectional
forms of media, allowing typically government-controlled messages to be broadcast to
the population. If anything, they should make it easier for authorities to reduce un-
rest. Phones, on the other hand, allow peer-to-peer communication. All else equal,
the expected e↵ect is that they facilitate organized protest. To analyze the data, and
to avoid confusing results with the growing availability of broadcasting and telecom-
munications over time, we rank penetration rate in our sample in each year. We do so
separately for each category, and then sum the ranks for each country-year. This gives
a rank ordering of media penetration in country x in year y. We then divide the sample
at the median. Table 9, col. (1) and (2) presents the results of estimating standard
regressions for these two subsamples. We find that below-average media penetration
is associated with a strong e↵ect of expenditure cuts on unrest. Above the median,
the e↵ect disappears. In col. (3)-(6), we di↵erentiate between uni-directional infor-
mation media (info-media) and peer-to-peer telecommunications (peer-media). The
attenuation of the e↵ect of expenditure changes is milder for peer-media, and strong
for info-media. For both types, the e↵ect of economic conditions is always important
above the median for media penetration, but below (in the case of peer media) the ef-
fect is small and poorly estimated. These results do not suggest that countries which,
at any one point of time, have greater availability of mass media (relative to their
neighbors) experience generally higher level of unrest.19
18We disregard data on telegrams since they are unavailable after 1980.19The obvious alternative is to condition on the absolute level of, say, phone penetration. Most of
the variation in phone penetration, however, simply reflects GDP growth and the declining cost oftelephones relative to all other goods; no clear pattern emerges.
13

[Table 9 here]
4 Robustness and Extensions
In this section, we examine the sensitivity of our results. We test if a more com-
plete set of controls - available for a part of our original sample - can overturn our
result, if our main finding holds for sub-periods, and which individual components of
unrest are particularly a↵ected by austerity. We also examine if the e↵ect is driven
by outliers, whether positive or negative changes in expenditure matter more for the
e↵ect on unrest, and whether the e↵ect is constant in all parts of the distribution of
the dependent variable. Finally, we test if greater unrest leads to sharper reversals in
fiscal policies.
4.1 Results by Subcomponent of CHAOS
Which component of CHAOS is most a↵ected by austerity measures? In Table
10 , we use the same specification as in Table 3 using a negative binomial model,
looking at the e↵ect of expenditure cuts on each of the components of our aggregate
indicator of instability in the full sample: general strikes, demonstrations, riots, and
assassinations, and attempted revolutions. Of the five outcome variables, all show the
expected sign, and three of them - demonstrations, riots and attempted revolutions
- are statistically significant. The variables that do not show a large, significant co-
e�cient are assassinations and general strikes. On average, years with expenditure
increases saw fewer general strikes, but there are numerous general strikes that are not
an immediate reaction to economic conditions and budget measures (such as, for ex-
ample, the 1926 general strike in Britain). For the other variables, the coe�cients are
large, indicating that austerity measures coincide with significant increases in demon-
strations, attempted revolutions, riots, and assassinations. In all specifications, the
e↵ect of GDP growth on unrest is negative. In contrast to the results for expenditure
changes, the e↵ect is not tightly estimated.
[Table 10 here]
4.2 Results by Subperiods
Table 11 takes this analysis one step further, by breaking the period 1919-2008 into
four sub-periods. We distinguish the interwar years from the period of post-World War
II reconstruction, the period of slowing growth in the 1970s and 1980s, as well as the
years after the fall of the Berlin Wall after 1989. For the first two sub-periods, we
14

use expenditure relative to GDP as the explanatory variable; thereafter, as a result of
greater data availability, it is primary (non-debt) expenditure. In each subperiod, we
find the same pattern as in the long-run data. The only exception is the penultimate
period, 1970-1989, when the e↵ect of expenditure changes is not as tightly estimated
as it is in the other sub-periods. The e↵ect of changes in budget expenditure on unrest
is strongest in the period after the fall of the wall, when the estimated coe�cient is
twice as large as in the earlier periods. The e↵ect of GDP growth is negative except
during the post-war boom: More growth was associated with more unrest. While
it is di�cult to test for the causes of this reversal exactly, it seems plausible that
high rates of output growth may have encouraged worker militancy. At a time when
many countries reached full employment, this e↵ect seems to have dominated. The
normal pattern of GDP growth reducing unrest reasserts itself after 1970. From 1970
onwards, we can control for additional variables, and do so. Inflation seems to have
reduced unrest in the 1970s, in line with some of the political economy literature on
the origins of high inflation (Samuelson and Solow, 1960). The fall of the Berlin wall
saw the spread of Western-style democracy eastwards. The overall connection between
austerity and social instability is the same in the expanded sample, and it is highly
significant.
[Table 11 here]
4.3 Alternative Measure of Unrest
How much does our main finding depend on the way in which we aggregate un-
rest? CHAOS is the simple sum of incidents. Instead, we can use the weighted conflict
index, as compiled by Banks (2010). It encompasses a larger set of domestic conflicts
including, in addition to the components of CHAOS, purges, major government crisis
and guerrilla warfare. It also assigns di↵erent, fixed weights to each individual com-
ponent. The correlation coe�cient of the variable with CHAOS is 0.75, significant at
the 1% level. Another alternative is to use the first principal component of the five
indicators that go into CHAOS. They all enter with a positive weighting. The first
principal component explains 0.42 of the overall variance. The correlation coe�cient
with CHAOS is 0.98.
In Table 12, we use both wci and the first principal as dependent variables. Since
the dependent variable is no longer a count variable, we use panel OLS, and obtain large
and mostly significant coe�cients for expenditure changes and the budget position.
For the principal component, expenditure increases cut unrest significantly; for the
wci, the standard error is slightly above the typical cut-o↵ for significance. As before,
there is no clear pattern for tax changes. The results are largely identical in terms of
15

magnitude and significance with the baseline results in Table 3.20 We conclude that
the way in which we measure unrest does not a↵ect our main finding.
[Table 12 here]
4.4 Outliers and the Magnitude of E↵ects in Di↵erent Parts
of the Distribution
An additional factor that can be questioned involves the use of a count variable
for unrest in the baseline results. The variable CHAOS is designed to capture the
intensity of unrest, but it may be that it is influenced by a number of outliers with
a high count of incidents. For example, Italy in 1947 saw a decline in expenditure
(by 0.6%) and also the highest frequency of unrest in our sample, with 38 incidents
in a single year. Extreme observations such as this one might make it easier to find
significant e↵ects. To examine this potential issue, we transform CHAOS into a simple
dichotomous variable, with unrest coded as equal to unity if there are one or more
incidents in a country in a single year. In Table 13, we re-estimate the baseline
regression with panel logit using country- and year-fixed e↵ects. We find the same
results as before - expenditure cuts wreak havoc, tax increases do so only to a small
extent and insignificantly. Overall, the budget balance matters for predicting unrest.
We conclude that the role of outliers is not decisive in underpinning the relationship
we established in baseline results.
[Table 13 here]
4.5 Symmetry of Expenditure Increases and Cuts
Which part of the variation in the explanatory variables is responsible for the link
between austerity and unrest? Do increases in expenditure do as much to reduce
unrest as cuts increase them? In Table 14, we examine this issue. Column (1) shows
the results for expenditure increases. The coe�cient is negative, but not large, and
not significant. In contrast, if expenditure changes are negative, they matter a great
deal for unrest, driving up CHAOS by 0.24 incidents for each standard deviation
of expenditure cuts. Next, we repeat the exercise for output changes. Increases in
output do much to cut unrest (col. 3), with a one standard deviation increase in
output (3.77%) reducing CHAOS by 0.2 incidents on average. In contrast, declines
do not set o↵ major disruptions to the same degree (but the sample is relatively
20A decrease of 1 GDP point in public expenditure is associated with an increase of 0.04 stan-dard deviations in CHAOS, 0.03 standard-deviations in first principal component of chaos and 0.02standard-deviations in wci.
16

small). Overall, the results in table 12 confirm that the relevant identifying variation
for expenditure changes comes from cuts; for output changes, it comes from positive
growth, not recessions.
[Table 14 here]
4.6 Fiscal Reversals
Does unrest lead to fiscal reversals? Are the politics of the ”street” powerful
enough to change the minds of politicians implementing austerity programs? Here, we
examine the time path of fiscal adjustments, comparing periods of austerity with and
without unrest. Figure 5 shows the change in expenditure relative to GDP from year
1 (when the cuts are implemented and unrest either occurs or does not) to year 4.
We compare two groups – countries with austerity programs with and without unrest
in year 1. Unsurprisingly given our earlier findings, consolidation episodes associated
with unrest on average see more severe budget cuts. In both groups, budget cuts are
scaled back after year 1, and spending increases again in year 2. However, the reversal
is much more marked during episodes where austerity coincided with unrest. The
change in budget position amounts to an almost 3 percentage point swing, from cuts
of over 2 percent to increases of more than 0.75 percent. The reversal in countries
without unrest is only half as large. In years 3 and 4, expenditure continues to expand
in countries that saw unrest, but at a slower pace. In contrast, countries without unrest
grow their spending in a more gradual fashion, reaching a higher rate of expansion by
year 4. In this sense, our results suggest that austerity programs that are so severe
that they fan the flames of unrest can be self-defeating – they lead to a quick reversal
of fiscal policy.
[Figure 5 here]
5 Conclusions
We find a close association between unrest and budget cuts in Europe during
the period 1919-2008. Because unrest is a low-frequency event, its incidence and
association with other factors is best examined in a long-run setting, using data from
a large number countries. The link is strong in almost every single sub-periods, and
for all types of unrest. 21 When we use recently-developed data that allows clean
21Strikingly, where we can trace the cause of each incident (during the period 1980-95), we can showthat only austerity-inspired demonstrations respond to budget cuts in the time-series. Cf. AppendixI.
17

identification of arguably exogenous, policy-driven changes in the budget balance, our
results continue to hold. Finally, these findings are not a↵ected by using alternative
measures of unrest. Contrary to what might be expected, we find no evidence that
the spread of mass media facilitates the rise of mass protests.
The link between fiscal retrenchment and unrest may help to resolve a paradox in
the political economy literature. There appears to be no significant punishment at the
polls for governments pursuing cut-backs (Alesina et al., 1998; Alesina et al., 2010),
and no evidence of gains in response to budget expansion (Brender and Drazen, 2008).
Also, the empirical evidence on the economic e↵ects of budget cuts is mixed, with
some studies finding an expansionary e↵ect, and others, a contractionary one.22 Why,
then, is fiscal consolidation often delayed, or only implemented half-heartedly?
Our findings suggest one possible answer why austerity is often avoided - fear of
instability and unrest.23 Expenditure cuts carry a significant risk of increasing the
frequency of riots, anti-government demonstrations, general strikes, political assassi-
nations, and attempts at revolutionary overthrow of the established order. While the
type of instability evnts we analyze are infrequent in normal years, they become much
more common as tougher austerity measures are implemented. Anticipated properly,
they may act as a potent brake on government policy. Once unrest erupts, govern-
ments quickly reverse course and increase spending in the following year, according to
our results – the politics of the street are e↵ective in reversing austerity. The close link
between austerity and instability may also help to explain why countries with higher
levels of unrest are on average also more indebted (Woo, 2003).
22Alesina and Ardagna (2010); Alesina et al. (2002); Guajardo et al. (2011). An early example inthe literature is Giavazzi and Pagano (1990)
23Alesina et al. (2010) also suggest that implementation of budget measures may be harder if theburden falls disproportionately on some groups. War-of-attrition models of consolidation are onealternative (Alesina and Drazen, 1991).
18

References
Acemoglu, D. (2003). “Why not a Political Coase Theorem? Social Conflict, Com-
mitment, and Politics”. Journal of Comparative Economics 31 (4), 620–652.
Acemoglu, D. and J. Robinson (2000). “Why Did the West Extend the Franchise?
Democracy, Inequality, and Growth in Historical Perspective”. Quarterly Journal
of Economics 115 (4), 1167–1199.
Alesina, A. and S. Ardagna (2010). “Large Changes in Fiscal Policy: Taxes versus
Spending”. Tax Policy and the Economy 24 (1), 35–68.
Alesina, A., S. Ardagna, R. Perotti, and F. Schiantarelli (2002). “Fiscal Policy, Profits,
and Investment”. American Economic Review 92 (3), 571–589.
Alesina, A., D. Carloni, and G. Lecce (2010). “The Electoral Consequences of Large
Fiscal Adjustments”. Harvard University, Mimeo.
Alesina, A. and A. Drazen (1991). “Why Are Stabilizations Delayed?”. The American
Economic Review 81 (5), 1170–1188.
Alesina, A., C. Favero, and F. Giavazzi (2012). “The Output E↵ect of Fiscal Consol-
idations”. NBER Working Paper No. w18336 .
Alesina, A. and R. Perotti (1995). “The Political Economy of Budget Deficits”. Sta↵
Papers-International Monetary Fund 42 (1), 1–31.
Alesina, A. and R. Perotti (1996). “Political Instability, Income Distribution, and
Investment”. European Economic Review 40 (6), 1203–1228.
Alesina, A., R. Perotti, J. Tavares, M. Obstfeld, and B. Eichengreen (1998). “The
Political Economy of Fiscal Adjustments”. Brookings Papers on Economic Activ-
ity 1998 (1), 197–266.
Andronikidou, A. and I. Kovras (2012). “Cultures of Rioting and Anti-Systemic Pol-
itics in Southern Europe”. West European Politics 35 (4), 707–725.
Banks, A. S. (2010). Cross-National Time-Series Data Archive. Databanks Interna-
tional, Jerusalem.
Baxter, M. and R. King (1993). “Fiscal Policy in General Equilibrium”. The American
Economic Review 83 (3), 315–334.
Bertola, G. and A. Drazen (1993). “Trigger Points and Budget Cuts: Explaining the
E↵ects of Fiscal Austerity”. The American Economic Review 83 (1), 11–26.
19

Blanchard, O. (1990a). “Comment on Giavazzi and Pagano, ‘Can Severe Fiscal Con-
tractions Be Expansionary?”’. NBER Macroeconomics Annual 5, 111–116.
Blanchard, O. (1990b). “Suggestions for a New Set of Fiscal Indicators”. OECD
Economics Department Working Papers .
Bloom, N. (2009). “The Impact of Uncertainty Shocks”. Econometrica 77 (3), 623–685.
Bohlken, A. and E. Sergenti (2010). “Economic Growth and Ethnic Violence: An
Empirical Investigation of Hindu–Muslim Riots in India”. Journal of Peace Re-
search 47 (5), 589.
Boix, C. (2003). Democracy and Redistribution. Cambridge University Press, United
Kingdom.
Bracher, K. (1978). Die Auflosung der Weimarer Republik. Athenaum-Verlag.
Brender, A. and A. Drazen (2008). “How Do Budget Deficits and Economic Growth
A↵ect Reelection Prospects? Evidence from a Large Panel of Countries”. The
American Economic Review 98 (5), 2203–2220.
Buchanan, J. and G. Tullock (1962). The Calculus of Consent: Logical Foundations
of Constitutional Democracy, Volume 100. University of Michigan Press.
Cobban, A. (1964). The Social Interpretation of the French Revolution. Cambridge
University Press, United Kingdom.
De Bromhead, A., B. Eichengreen, and K. O’Rourke (2012). “Right-wing Political
Extremism in the Great Depression”. NBER Working Paper No. w17871 .
Devries, P., J. Guajardo, D. Leigh, and A. Pescatori (2011). “A New Action-based
Dataset of Fiscal Consolidation”. IMF Working Paper No. 11/128 .
DiPasquale, D. and E. Glaeser (1998). “The Los Angeles Riot and the Economics of
Urban Unrest”. Journal of Urban Economics 43 (1), 52–78.
Doyle, W. (2001). The French Revolution: a Very Short Introduction, Volume 54.
Oxford University Press, USA.
Feldman, G. (1997). The Great Disorder: Politics, Economics, and Society in the
German Inflation, 1914-1924. Oxford University Press, USA.
Ferejohn, J. (1986). “Incumbent Performance and Electoral Control”. Public
Choice 50 (1), 5–25.
20

Field, E., M. Levinson, R. Pande, and S. Visaria (2008). “Segregation, Rent Control,
and Riots: the Economics of Religious Conflict in an Indian City”. The American
Economic Review 98 (2), 505–510.
Francisco, R. (2006). European Protest and Coercion Data.
Giavazzi, F. and M. Pagano (1990). “Can Severe Fiscal Contractions Be Expansionary?
Tales of Two Small European Countries”. NBER Macroeconomics Annual 1990 5,
75–111.
Grossman, H. (1991). “A General Equilibrium Model of Insurrections”. The American
Economic Review 81 (4), 912–921.
Guajardo, J., D. Leigh, and A. Pescatori (2011). “Expansionary Austerity: New
International Evidence”. IMF Working Paper No. 11/158 .
Haggard, S., J. Lafay, and C. Morrisson (1995). The Political Feasibility of Adjustment
in Developing Countries. OECD.
Hunt, L. (2004). Politics, Culture, and Class in the French Revolution, Volume 1.
University of California Press.
IMF (2010). “Will It Hurt? Macroeconomic E↵ects of Fiscal Consolidation”. World
Economic Outlook .
Kuran, T. (1989). “Sparks and Prairie Fires: A Theory of Unanticipated Political
Revolution”. Public Choice 61 (1), 41–74.
Maddison, A. (2010). Statistics on World Population, GDP and Per Capita GDP,
1-2008 AD.
Marshall, M. and K. Jaggers (2010). Polity IV Project: Political Regime Characteris-
tics and Transitions, 1800-2010.
Martin, I. and N. Gabay (2012). “Fiscal Protest in Thirteen Welfare States”. Socio-
Economic Review .
Mitchell, B. (2007). International Historical Statistics: Europe , 1750-2005. Palgrave
MacMillan, London.
Morrison, C., L. J.D., and S. Dessus (1994). “Adjustment Programmes and Politico-
Economic Interactions in Developing Countries: Lessons from an Empirical Analysis
of Africa in the 1980s”. In From Adjustment to Development in Africa: Conflict,
Controversy, Convergence, Consensus? Royal African Society.
21

Paldam, M. (1993). The Socio-political Reactions to Balance-of-payments Adjustments
in LCDs: A Study of Nine Cases from Latin America. Institute of Economics,
Aarhus University.
Patsiurko, N., J. Campbell, and J. Hall (2011). “Measuring Cultural Diversity: Ethnic,
Linguistic and Religious Fractionalization in the OECD”.
Persson, T., G. Roland, and G. Tabellini (1997). “Separation of Powers and Political
Accountability”. The Quarterly Journal of Economics 112 (4), 1163–1202.
Ramey, V. (2011). “Identifying Government Spending Shocks: It’s all in the Timing”.
The Quarterly Journal of Economics 126 (1), 1–50.
Romer, C. and D. Romer (1989). “Does Monetary Policy Matter? A New Test in the
Spirit of Friedman and Schwartz”. NBER Macroeconomics Annual .
Romer, C. and D. Romer (2010). “The Macroeconomic E↵ects of Tax Changes: Es-
timates Based on a New Measure of Fiscal Shocks”. The American Economic Re-
view 100 (3), 763–801.
Rummel, R. and R. Tanter (1971). Dimensions of Conflict Behavior Within and Be-
tween Nations, 1955-1960. Number 5021. Inter-University Consortium for Political
Research.
Samuelson, P. and R. Solow (1960). “Analytical Aspects of Anti-inflation Policy”. The
American Economic Review 50 (2), 177–194.
Shleifer, A. and R. Vishny (2002). The Grabbing Hand: Government Pathologies and
Their Cures. Harvard University Press.
Soboul, A. (1974). The French Revolution, 1787-1799: from the Storming of the
Bastille to Napoleon. Random House.
Tullock, G. (1971). “The Paradox of Revolution”. Public Choice 11 (1), 89–99.
Voth, H. (2011). “Tightening Tensions: Fiscal Policy and Civil Unrest in Eleven South
American Countries, 1937-1995”. In J. Galı (Ed.), Fiscal Policy and Macroeconomic
Performance. Central Bank of Chile, Santiago de Chile.
Woo, J. (2003). “Economic, Political, and Institutional Determinants of Public
Deficits”. Journal of Public Economics 87 (3-4), 387–426.
22

EPCD Dataset and Results (For Online Publication
Only)
The European Protest and Coercion Database (EPCD) developed by Francisco
(2006) can be used to pin down the main motive behind each public demonstration.
We first describe the dataset and then present results.
European Protest and Coercion Data (1980-1995):
The EPCD codes daily data on all reported protest events occurred in 28 European
countries between 1980 and 1995. The data is constructed using the full-text reports
from more than 400 newspapers in the Lexis-Nexis database. We restrict our attention
to the same types of protest events covered in the long-term data: riots, demonstra-
tions, political assassinations, general strikes, and attempted revolutions.24 The main
advantage of the EPCD over the Arthur Banks’ database is that the former records
the issue behind each protest, allowing us to test the relationship between austerity
and unrest in a very precise way, even if only for a small subset of the overall dataset.25
There are relatively few protests that are caused by austerity measures. At the
same time, when they happen, they involve a large number of participants - by far the
largest number of protesters of any category, as Table 15 illustrates. These protests
tend to be relatively peaceful, with few protesters arrested, injured or killed, and
relatively few members of the security forces involved.
[Table 15 here]
We define as a single protest event an event recorded with the same entry in the
following EPCD variables: event, protester and location. The variable event provides
a short description of the main issues of each protest and it is the variable we use to
sort protest events into di↵erent categories (expenditure cuts, tax increase, economy,
peace, labour, education and ecology), protester indicates the protesting group or type
(e.g. ferry workers, teachers, truck drivers etc.), location is the geographical location
24We define as a single protest event an event recorded with the same entry in the following EPCDvariables: “event”, “protester” and “location”. The variable “event” provides a short description ofthe protest and its reasons, “protester” indicates the protesting group or type (e.g. ferry workers,teachers, truck drivers), “location” is usually the city in which it took place. Events that last morethan one day are collapsed in this way in a unique observation, where the number of protesters andsecurity forces members are averages across days. Notice that we only consider protest events whosenumber of participants is above 100 for riots and demonstrations and above 1000 for general strikes(no threshold is used for assassinations and attempted revolutions). These are the same thresholdused in the Banks (2010) database.
25For this data we are also able to distinguish among austerity-inspired protests between thosewhose primary cause is expenditure cuts and those mainly related to tax increases.
23

in which the event took place. Events that last more than one day are collapsed in
this way in a unique observation, where the number of protesters and security forces
members are averages across days. Our dependent variable is the number of events
in each category occurred in each country-year. Notice that we only consider protest
events whose number of participants is above 100 for riots and demonstrations and
above 1000 for general strikes (no threshold is used for assassinations and attempted
revolutions). These are the same threshold used in the Arthur Banks database.
Data cleaning: We exclude from our estimates one clear outlier, France in 1995,
where we register 301 events, against the 2.1 protest events related to expenditure cuts
per year that we register on average in Europe. This peak is due to the approval of
the Juppe austerity plan that entered into force in 1996.
Results
We examine if the public assemblies that are motivated by complaints against
austerity - as determined by the newspaper records in Lexis-Nexis - are significantly
a↵ected by actual changes in fiscal policy. Our approach here is similar to what has
been called the “narrative approach” (Romer and Romer (1989)). Table 16 gives the
results. If we use the same specification as in Table 3, we find similar results. In-
creasing expenditure lowers levels of unrest (column 1). In column 2, we examine
the responsiveness of anti-tax demonstrations to revenue increases, and find a weakly
positive relationship. The main finding, that anti-austerity protests surge when expen-
diture is cut, survives controlling for a host of additional variables, including country-
and year-fixed e↵ects.
[Table 16 here]
We can strengthen this result further by conducting a placebo test. In Table 17,
we look at other protests, and test if they can be predicted by the same explanatory
variables as in Table 16. Labour disputes and demonstrations about the state of the
economy are less frequent when expenditure is expanding, but the link is not strong or
statistically significant. Peace rallies, ecological issues, and unrest events in response
to education policy are actually more frequent in times of fiscal expansion. Overall,
the placebo test shows that only in the case of anti-austerity demonstrations is there
a strong and significant link with changes in government expenditure.
[Table 17 here]
24

Data Appendix (For Online Publication Only)
Variable name Definition Source Time period
1. Fiscal variables (not cyclically adjusted):
�(exp/GDP) Annual change in total central government spend-ing as a share of GDP (percentage points)
Mitchell (2007) from 1919 to1969; OECD from 1970 to2008 (GTE).
1919-2008
�(rev/GDP) Annual change in total central government revenueas a share of GDP (percentage points)
Mitchell (2007) from 1919 to1969; OECD from 1970 to2008 (GTR)
1919-2008
�(budget/GDP) Annual change in total central government budgetas a share of GDP (percentage points)
Mitchell (2007) from 1919
to 1969 ( (rev�exp)GDP
); OECDfrom 1970 to 2008 ((GTE �GTR)/B1 GA)
1919-2008
2. Fiscal variables (cyclically adjusted):
�(primary exp/GDP) Annual change in cyclically adjusted current ex-penditure as a share of GDP (percentage points)
Alesina and Ardagna (2010) 1970-2007
�(tot rev/GDP) Annual change in cyclically adjusted total revenueas a share of GDP (percentage points)
Alesina and Ardagna (2010) 1970-2007
�(primary budget/GDP) Annual change in cyclically adjusted primary bud-get as a share of GDP (percentage points)
Alesina and Ardagna (2010) 1970-2007
3. Fiscal variables (exogenous retrenchment data)
�(exp/GDP)IMF Annual change in government expenditure as ashare of GDP (percentage points)
Devries et al. (2011) 1978-2008
�(rev/GDP)IMF Annual change in taxes as a share of GDP (per-centage points)
Devries et al. (2011) 1978-2008
�(budget/GDP)IMF Annual change in government budget as a share ofGDP (percentage points)
Devries et al. (2011) 1978-2008
�(exp/GDP)IMF
u
Unanticipated component of the annual change ingovernment expenditure as a share of GDP (per-centage points)
Alesina et al. (2012) 1978-2008
�(rev/GDP)IMF
u
Unanticipated component of the annual change intaxes as a share of GDP (percentage points)
Alesina et al. (2012) 1978-2008
�(budget/GDP)IMF
u
Unanticipated component of the annual change ingovernment budget as a share of GDP (percentagepoints)
Alesina et al. (2012) 1978-2008
4. Social unrest variables:
CHAOS Sum of general trikes, demonstrations, riots, assas-sinations, revolutions
Banks (2010) 1919-2008
PCA First principal component of CHAOS Banks (2010) 1919-2008WCI Weighted Conflict Index, weighted sum of: general
strikes, demonstrations, riots, assassinations, rev-olutions, guerrilla warfare, government crises andpurges
Banks (2010) 1919-2008
General strikes Any strike of 1,000 or more industrial or serviceworkers that involves more than one employer andthat is aimed at national government policies orauthority
Banks (2010) 1919-2008
Demonstrations Any peaceful public gathering of at least 100 peo-ple for the primary purpose of displaying or voicingtheir opposition to government policies or author-ity (excluding anti-foreign nature demonstrations)
Banks (2010) 1919-2008
25

Variable name Definition Source Time period
Riots Any violent demonstration or clash of more than100 citizens involving the use of physical force
Banks (2010) 1919-2008
Assassinations Any politically motivated murder or attemptedmurder of a high government o�cial or politician
Banks (2010) 1919-2008
Revolutions Any illegal or forced change in the top governmen-tal elite, any attempt at such a change, or any suc-cessful or unsuccessful armed rebellion whose aimis independence from the central government
Banks (2010) 1919-2008
5. Controls:
� (GDP/POP) Annual growth in GDP, PPP adjusted Maddison (2010) 1919-2008Unemployment rate OECD Outlook n. 84 1970-2007Inflation rate OECD Outlook n. 84 1970-2007Primary budget Level of cyclically adjusted primary budget as a
share of GDPAlesina and Ardagna (2010) 1970-2007
Public debt/GDP Level of public debt as a share of GDP OECD Outlook n. 84 1970-2007Ethnic Fragmentation Probability that two randomly selected individu-
als in a country belong to di↵erent ethnic groups.Data is available for 1985 and 2000. We assign the1985 values to years from 1970 to 1990, and the2000 value for years from 1991 to 2007
Patsiurko et al. (2011) 1985, 2000
Polity2 Revised Combined Polity Score Marshall and Jaggers (2010)Media Sum of the rankings for each country in number of
telephones (including cellular phones) per capita,radios per capita and televisions per capita
Banks (2010) (phone6,media2 and media4)
1919-2008
Info-Media Sum of the rankings for each country in number oftelephones (including cellular phones) per capita
Banks (2010) (phone6,media2 and media4)
1919-2008
Peer-Media Sum of the rankings for each country in radios percapita and televisions per capita
Banks (2010) (phone6,media2 and media4)
1919-2008
Note on data cleaning of fiscal variables: To take deal with outliers we use as a general rule to drop all observations for which thechange in the budget position with respect to the previous year is larger than 10% in absolute value. This procedure excludes 17observations from the sample: Belgium in 1948 and 1949, Czech Republic in 1921, 1924 and 1996, United Kingdom in 1946 and1947, Greece in 1930 and 1931, Ireland in 1965, Italy in 1920, 1923, 1936 and 1937, Netherlands in 1946 and 1948, Yugoslaviain1932.
26

Figures
0
1
2
3
4
CHAOS Riots Demonstrations PoliticalAssassinations
General Strikes
Measure of Instability
Num
ber o
f Inc
iden
ts
expenditure increases
expenditure reductions > 1%
>2%
>3%
>5%
Figure 1: Frequency of Incidents and the Scale of Expenditure Cuts
Figure 2: CHAOS over Time
27

0.0
5.1
.15
.2D
ensi
ty
-20 -10 0 10 20 30Expenditure/GDP, change from t-1 to t
0.1
.2.3
.4D
ensi
ty
-20 -10 0 10 20Revenues/GDP, change from t-1 to t
0.1
.2.3
Den
sity
-10 -5 0 5 10Budget/GDP, change from t-1 to t
0.0
2.0
4.0
6.0
8.1
Den
sity
-50 0 50GDP, change from t-1 to t
Figure 3: Changes in Fiscal Variables and GDP Per Capita (% points)
0
1
1
2
2
3
CHAOS Riots Demonstrations PoliticalAssassinations
General Strikes
Measure of Instability
Num
ber o
f Inc
iden
ts
lowest tercile (median growth = - 0.5%)
middle tercile (3.3%)
highest tercile (6.6%)
Figure 4: Frequency of Incidents and Economic Growth
p
28

-2.5
-2
-1.5
-1
-0.5
0
0.5
1
1 2 3 4Period
Cha
nge
in (E
xp/G
DP
) (%
poin
ts)
expenditure path without unrest expenditure path with unrest
Figure 5: Average Change in Expenditure/GDP in Years After Expendi-ture Cuts
Tables
Table 1: Descriptive Statistics
Mean Std. Dev. Min. Max. Observations�(exp/GDP) 0.2 2.8 -21.7 30.3 1449�(rev/GDP) 0.2 1.9 -17.8 20.5 1398�(budget/GDP) 0.0 2.2 -9.9 9.9 1392�(GDP) 3.2 5.7 -58.7 52.1 1788CHAOS 1.636 3.753 0 38 1797Riots 0.635 1.997 0 25 1797Demonstrations 0.535 1.53 0 17 1797Political Assassinations 0.177 0.762 0 15 1797General Strikes 0.196 0.654 0 7 1797Revolutions 0.093 0.361 0 5 1797
Notes: Fiscal variables and GDP growth expressed in % points.
29

Table 2: Cross-correlation Table
��
exp
GDP
� �rev
GDP
� ⇣budget
GDP
⌘�(GDP) CHAOS Riots Demonstr. Political General Revolutions
Assassin. Strikes�(exp/GDP) 1.000
�(rev/GDP) 0.627 1.000(0.000)
�(budget/GDP) -0.711 0.102 1.000(0.000) (0.000)
�(GDP) -0.151 -0.036 0.200 1.000(0.000) (0.195) (0.000)
CHAOS -0.062 0.036 0.065 -0.079 1.000(0.021) (0.193) (0.017) (0.001)
Riots -0.065 0.027 0.079 -0.030 0.867 1.000(0.016) (0.317) (0.004) (0.224) (0.000)
Demonstrations -0.052 0.032 0.020 -0.098 0.763 0.464 1.000(0.054) (0.239) (0.466) (0.000) (0.000) (0.000)
Political Assassinations 0.006 0.015 0.006 -0.064 0.439 0.213 0.188 1.000(0.816) (0.583) (0.835) (0.010) (0.000) (0.000) (0.000)
General Strikes -0.030 0.039 0.060 -0.009 0.599 0.447 0.344 0.147 1.000(0.259) (0.150) (0.028) (0.718) (0.000) (0.000) (0.000) (0.000)
Revolutions -0.027 -0.025 0.029 -0.091 0.354 0.259 0.111 0.220 0.175 1.000(0.311) (0.371) (0.284) (0.000) (0.000) (0.000) (0.000) (0.000) (0.000)
30

Table 3: Baseline Result
Dependent variable: CHAOSEstimator: Negative Binomial OLS
(1) (2) (3) (4) (5) (6)
�(exp/GDP) -0.049** -0.146**[0.022] [0.057]
�(rev/GDP) 0.003 -0.003[0.020] [0.048]
�(budget/GDP) 0.075*** 0.131*[0.027] [0.065]
�(GDP) -0.030** -0.025* -0.030** -0.006 0.019 0.007[0.012] [0.013] [0.013] [0.070] [0.082] [0.083]
Observations 1,310 1,259 1,253 1,310 1,259 1,253R-squared 0.119 0.108 0.114Number of countries 24 24 24 24 24 24
Notes: Standard errors clustered at country level in parentheses. Significance levels:*** p<0.01, ** p<0.05,
* p<0.1. All regressions include country and year fixed e↵ects.
Table 4: Predicted Number of CHAOS Episodes UnderDi↵erent Expenditure Reductions and GDP Growth
GDP Growth3% -2% -5% -10%
Expenditure Reduction = 1% 0.58 0.69 0.75 0.87
5% 0.71 0.84 0.92 1.06
10% 0.91 1.07 1.17 1.36
15% 1.16 1.37 1.50 1.74
31

Table 5: Full Set of Controls, 1970-2007
Dependent variable: CHAOSEstimator: Negative Binomial (1) (2) (3) (4) (5) (6)
� (primary exp/GDP) -0.128** -0.204**[0.057] [0.104]
� (tot rev/GDP) 0.095* 0.165***[0.055] [0.042]
� (primary budget/GDP) 0.074* 0.129**[0.040] [0.055]
�(GDP) -0.133*** -0.247** -0.088** -0.136 -0.111*** -0.193*[0.044] [0.112] [0.044] [0.112] [0.041] [0.099]
Lag unemployment rate 0.039 0.054 0.043[0.075] [0.079] [0.080]
Ethnic fragmentation 3.909*** 3.722*** 4.063***[0.832] [0.847] [0.813]
Polity2 index 0.239 0.223 0.203[0.352] [0.325] [0.342]
Log (POP) 4.274 3.958 3.010[6.308] [5.536] [5.733]
Public debt/GDP -0.642 -0.380 -0.560[1.109] [1.173] [1.170]
� inflation -0.058** -0.050 -0.062**[0.027] [0.034] [0.030]
Primary budget -0.034 -0.044 -0.063[0.055] [0.050] [0.058]
Observations 522 434 522 434 522 434Number of countries 16 16 16 16 16 16
Notes: Standard errors clustered at country level in parentheses. Significance levels:*** p<0.01, ** p<0.05, * p<0.1.
All regressions include country and year fixed e↵ects. All fiscal data are cyclically adjusted using the Blanchard
methodology.
32
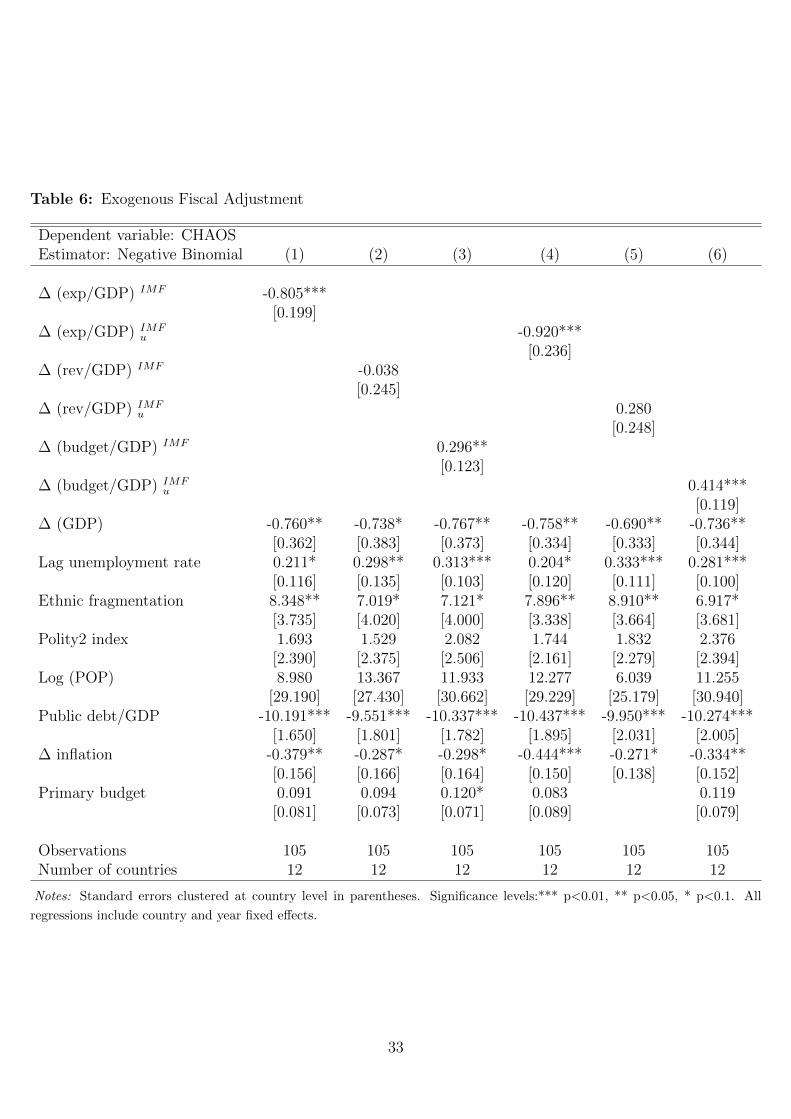
Table 6: Exogenous Fiscal Adjustment
Dependent variable: CHAOSEstimator: Negative Binomial (1) (2) (3) (4) (5) (6)
� (exp/GDP) IMF -0.805***[0.199]
� (exp/GDP) IMFu -0.920***
[0.236]� (rev/GDP) IMF -0.038
[0.245]� (rev/GDP) IMF
u 0.280[0.248]
� (budget/GDP) IMF 0.296**[0.123]
� (budget/GDP) IMFu 0.414***
[0.119]� (GDP) -0.760** -0.738* -0.767** -0.758** -0.690** -0.736**
[0.362] [0.383] [0.373] [0.334] [0.333] [0.344]Lag unemployment rate 0.211* 0.298** 0.313*** 0.204* 0.333*** 0.281***
[0.116] [0.135] [0.103] [0.120] [0.111] [0.100]Ethnic fragmentation 8.348** 7.019* 7.121* 7.896** 8.910** 6.917*
[3.735] [4.020] [4.000] [3.338] [3.664] [3.681]Polity2 index 1.693 1.529 2.082 1.744 1.832 2.376
[2.390] [2.375] [2.506] [2.161] [2.279] [2.394]Log (POP) 8.980 13.367 11.933 12.277 6.039 11.255
[29.190] [27.430] [30.662] [29.229] [25.179] [30.940]Public debt/GDP -10.191*** -9.551*** -10.337*** -10.437*** -9.950*** -10.274***
[1.650] [1.801] [1.782] [1.895] [2.031] [2.005]� inflation -0.379** -0.287* -0.298* -0.444*** -0.271* -0.334**
[0.156] [0.166] [0.164] [0.150] [0.138] [0.152]Primary budget 0.091 0.094 0.120* 0.083 0.119
[0.081] [0.073] [0.071] [0.089] [0.079]
Observations 105 105 105 105 105 105Number of countries 12 12 12 12 12 12
Notes: Standard errors clustered at country level in parentheses. Significance levels:*** p<0.01, ** p<0.05, * p<0.1. All
regressions include country and year fixed e↵ects.
33
Table 7: Accounting for Dynamics
Dependent variable: CHAOSEstimator: Negative Binomial (1) (2) (3)
�(exp/GDP) t�2 0.012 1.668 1.726[1.655] [1.694] [1.700]
�(exp/GDP) t�1 -1.943 -1.206 -1.318[1.761] [1.279] [1.289]
�(exp/GDP) t -0.050** -0.043* -0.044*[0.020] [0.024] [0.024]
�(exp/GDP) t+1 -5.097** -5.148*** -5.288***[2.254] [1.917] [2.013]
�(exp/GDP) t+2 -0.956 -1.233 -1.280[2.196] [1.864] [1.777]
CHAOS t�1 0.083*** 0.084***[0.009] [0.009]
� (GDP) t -0.014 -0.026 -0.026[0.018] [0.017] [0.017]
�(GDP) t+1 -2.070[2.029]
Observations 1,199 1,193 1,193Number of countries 23 23 23
Notes: Standard errors clustered at country level in parentheses. Significance
levels:*** p<0.01, ** p<0.05, * p<0.1. All regressions include country and
year fixed e↵ects.
Table 8: Institutions and the Sensitivity of Unrest to Austerity
Polity2 IndexDependent variable: CHAOS <-6 <5 <10 =10Estimator: Negative Binomial (1) (2) (3) (4)
� (exp/GDP) -0.117** -0.109*** -0.095*** -0.033[0.054] [0.029] [0.022] [0.023]
� (GDP) 0.003 -0.004 -0.029 -0.016[0.034] [0.027] [0.026] [0.039]
Observations 149 248 383 915Number of countries 8 11 17 19
Notes: Standard errors clustered at country level in parentheses. Significance levels:***
p<0.01, ** p<0.05, * p<0.1. All regressions include country and year fixed e↵ects.
34

Table 9: Media Penetration and Unrest
Media Info-Media Peer-MediaDependent variable: CHAOS <median >median <median >median <median >medianEstimator: Negative Binomial (1) (2) (3) (4) (5) (6)
� (exp/GDP) -0.067*** 0.019 -0.077*** 0.011 -0.071*** -0.050*[0.024] [0.037] [0.027] [0.034] [0.024] [0.027]
� (GDP) -0.074* -0.084 -0.085** -0.091 -0.035* -0.062***[0.040] [0.072] [0.042] [0.073] [0.020] [0.019]
Observations 281 499 306 474 510 800Number of countries 16 19 15 17 18 18
Notes: Standard errors clustered at country level reported in parentheses. Significance levels:*** p<0.01, ** p<0.05,
* p<0.1. Media includes phones, radio and TV. Infor-Media includes radio and TV. Peer-Media includes phones. All
regressions include country and year fixed e↵ects.
Table 10: Results by Subcomponent of CHAOS
SubcomponentsDependent variable Riots Demonstrations Political Generalindicated in columns Assassinations StrikesEstimator: Negative Binomial (1) (2) (3) (4)
� (exp/GDP) -0.040* -0.041* -0.059*** -0.045[0.021] [0.022] [0.021] [0.031]
� (GDP) -0.013 -0.034 -0.019 -0.002[0.014] [0.022] [0.021] [0.027]
Observations 1,310 1,310 1,310 1,310Number of countries 24 24 24 24
Notes: Standard errors clustered at country level in parentheses. Significance levels:*** p<0.01, **
p<0.05, * p<0.1. All regressions include country and year fixed e↵ects.
35

Table 11: Results by Subperiods
SubperiodsDependent variable: CHAOS 1919-1939 1946-1969 1970-1989 1990-2007Estimator: Negative Binomial (1) (2) (3) (4)
� (exp/GDP) -0.039 -0.107***[0.035] [0.029]
� (primary exp/GDP) -0.067 -0.185***[0.083] [0.068]
� (GDP) -0.046*** 0.066*** -0.096* -0.291***[0.016] [0.023] [0.051] [0.081]
Observations 238 346 239 283Number of countries 17 16 14 16
Notes: Standard errors clustered at country level in parentheses. Significance levels:*** p<0.01,
** p<0.05, * p<0.1. All regressions include country and year fixed e↵ects.
Table 12: Alternative Measures of Unrest
Dependent variableindicated in columns Principal Component Analysis Weighted Conflict IndexEstimator: OLS (1) (2) (3) (4) (5) (6)
�(exp/GDP ) -0.054** -31.983[0.022] [24.649]
�(rev/GDP ) 0.000 16.266[0.019] [33.410]
�(budget/GDP ) 0.051** 49.802[0.024] [31.073]
�(GDP ) -0.002 0.007 0.002 -5.107 -1.955 -8.118[0.028] [0.033] [0.032] [24.745] [29.395] [30.790]
Observations 1,310 1,259 1,253 1,310 1,259 1,253R-squared 0.123 0.115 0.121 0.128 0.123 0.126Number of countries 24 24 24 24 24 24
Notes: Standard errors clustered at country level in parentheses. Significance levels:*** p<0.01, **
p<0.05, * p<0.1. All regressions include country and year fixed e↵ects.
36

Table 13: CHAOS as a Dichotomous Variable
Dependent variable: CHAOS dummyEstimator: Logit (1) (2) (3)
�(exp/GDP ) -0.040[0.030]
�(rev/GDP ) 0.020[0.049]
�(budget/GDP ) 0.088*[0.045]
�(GDP ) -0.048* -0.039 -0.050*[0.026] [0.028] [0.028]
Observations 1,295 1,244 1,238Number of countries 22 22 22
Notes: Robust standard errors in parentheses. Significance levels:*** p<0.01,
** p<0.05, * p<0.1. The dependent variable is a dichotomous variable equal to
1 when chaos is greater than 0, and equal to 0 otherwise. All regressions include
country and year fixed e↵ects.
Table 14: Unrest, Expenditure Cuts and Growth
Dependent variable: CHAOS SubsamplesEstimator: Negative Binomial � Exp>0 � Exp<0 � GDP>0 � GDP<0
(1) (2) (3) (4)
�(exp/GDP ) 0.015 -0.078** -0.047** -0.008[0.023] [0.035] [0.023] [0.029]
�(GDP ) -0.041** -0.033* -0.017 -0.070[0.017] [0.019] [0.020] [0.061]
Observations 702 608 1,147 160Number of countries 24 24 24 22
Notes: Standard errors clustered at country level reported in parentheses. Significance levels:***
p<0.01, ** p<0.05, * p<0.1. All regressions include country and year fixed e↵ects.
37

Table 15: Descriptive Statistics, EPCD Dataset
Main issue: Exp Cuts Taxes Economy Labour Ecology Peace Education
Number of events 901 246 8,677 8,117 797 1,987 531
Averages per event:Protesters:
Total 192,557 142,347 49,479 33,839 5,732 20,092 52,784Arrested .76 2 4.2 4.4 2 7.2 2.4Injured .36 .54 .3 .28 0.7 1.1 1
Security forces:Total 81 108 36 34 44 152 144Injured .35 .094 .12 .11 .092 .12 1.3
Table 16: Protest events from EPCD, 1980-1995
Dependent variable: N eventswith main issue = Exp CutsEstimator: Negative Binomial (1) (2) (3)
� (primary exp/GDP) -0.214*[0.124]
� (tot rev/GDP) -0.164[0.111]
� (primary budget/GDP) 0.021[0.051]
� (GDP) -0.134 -0.106 -0.097[0.104] [0.096] [0.102]
Lag unemployment rate 0.111 0.129 0.115[0.103] [0.100] [0.100]
Observations 230 230 230Number of countries 16 16 16
Notes: Standard errors clustered at country level in parentheses. Sig-
nificance levels:*** p<0.01, ** p<0.05, * p<0.1. All regressions in-
clude country and year fixed e↵ects. In all specifications we excluded
one clear outlier: France in 1995.
38

Table 17: Placebo test, 1980-1995
Dependent variable Protest Event Main Issue:indicated in columns Exp Cuts Economy Peace Labor Education Ecology AllEstimator: Negative Binomial (1) (2) (3) (4) (5) (6) (7)
� (primary exp/GDP) -0.214* 0.007 0.031 0.006 -0.238 -0.052 0.001[0.124] [0.036] [0.081] [0.037] [0.252] [0.107] [0.024]
� (GDP) -0.134 0.013 0.075 0.025 0.150 -0.006 -0.003[0.104] [0.026] [0.089] [0.024] [0.127] [0.056] [0.022]
Lag unemployment rate 0.111 0.052 0.063 0.051 -0.298* 0.014 0.026[0.103] [0.033] [0.063] [0.034] [0.155] [0.080] [0.030]
Observations 230 230 230 230 230 230 230Number of countries 16 16 16 16 16 16 16
Notes: Standard errors clustered at country level in parentheses. Significance levels:*** p<0.01, ** p<0.05, * p<0.1. All
regressions include country and year fixed e↵ects. In all specifications we excluded one clear outlier: France in 1995.
39