Embed Size (px)
Citation preview

AUSTRACANNUAL REPORT
2014–15
© Commonwealth of Australia 2015
ISSN 1321-1366
This work is copyright. You may download, display, print and reproduce this material in unaltered form only (retaining this notice) for your personal, non-commercial use or use within your organisation. Where material has been sourced from other third-party sources, copyright continues.
Requests and enquiries concerning reproduction and rights for commercial use should be addressed to [email protected]
Designed and produced by the Australian Transaction Reports and Analysis Centre (AUSTRAC)
Index: Karen Gillen

13 October 2015The Hon Michael KeenanMinister for JusticeParliament HouseCANBERRA ACT 2600
Dear Minister
In accordance with section 226 of the Anti-Money Laundering and Counter-Terrorism Financing Act 2006 and section 63 of the Public Service Act 1999, I am pleased to submit the annual report on the operations of the Australian Transaction Reports and Analysis Centre for the year ended 30 June 2015.
Yours sincerely
Paul Jevtovic APMCHIEF EXECUTIVE OFFICER

AUSTRAC ANNUAL REPORT 2014–15 04
About our report
AUSTRAC at a glance
Our year on a page
CEO review
Chapter 1: Agency overview – who is AUSTRAC?
Chapter 2: A year of refocussing
Chapter 3: Building relationships to strengthen the system
Chapter 4: Protecting the national interest
Chapter 5: Management and accountability
Chapter 6: Financial performance
Financial statements
Appendixes, abbreviations and indexes
CONTENTS
0506070812303658728086140

AUSTRAC ANNUAL REPORT 2014–15 05
This report summarises our performance for the financial year ending 30 June 2015.
We manage our performance through the outcome and program structure in the annual portfolio budget statement (PBS). As required, this report reviews our performance against the outcomes, planned performance, deliverables and key performance indicators (KPIs) in our 2014–15 Portfolio Budget Statement (PBS).
Our performance at a high level is captured in our performance scorecard on page 21. More detail is available throughout the report.
ABOUT OUR REPORT

AUSTRAC AT A GLANCE
OUR ROLEWe are an Australian Government agency with a mandate specified in the Anti-Money Laundering and Counter-Terrorism Financing Act 2006.
OUR AIMWe strive to be a global leader in anti-money
laundering and counter-terrorism financing, and the primary source for financial intelligence in Australia.
OUR VISIONAUSTRAC’s vision is an Australian community that is hostile to money laundering, financing of terrorism, and serious and organised crime, including people smuggling, and tax evasion.
OUR 2014–15 OUTCOMEA financial environment hostile to money laundering,
financing of terrorism, major crime and tax evasion through industry regulation and the collection,
analysis and dissemination of financial intelligence.

OUR YEAR ON A PAGE

AUSTRAC ANNUAL REPORT 2014–15 CEO REVIEw08
Thank you for reading AUSTRAC’s 2014–15 annual report – my first as CEO.
I was honoured to be appointed to this role in November 2014, following the conclusion of John Schmidt’s five-year term. I provide this overview on behalf of my predecessor, and of course, incorporating the first seven months of my appointment. John must be acknowledged for his leadership and contribution in his time as CEO. During his tenure AUSTRAC continued to make important contributions to anti-money laundering and counter-terrorism financing regulation in Australia and overseas, and to law enforcement, revenue and intelligence operations.
A greater interest in national security, including the economic security of our nation, means our work is attracting more community interest, increased expectations from our partners and fortunately increased government support.
We’re facing rapid changes to technology that create ongoing challenges in protecting our financial system and the community from domestic and international criminal threats. These challenges, coupled with a push to work more efficiently, demand we continue to evolve and become more agile.
Since November, I have been working together with staff to develop a new vision and strategic direction for our organisation. We have set in motion the implementation of a new strategic plan, underpinned by a new operating model, new governance and leadership frameworks and a new organisational structure.
It is important to constantly reflect on our journey, and more importantly, the direction we are pursuing. This year we’ve had many great achievements, but also faced many challenges as we balanced our existing commitments and our future aspirations.
CEO REVIEw

AUSTRAC ANNUAL REPORT 2014–15CEO REVIEw 09
OUR ACHIEVEMENTS
Combating the financing of terrorismEverything we do is aimed at protecting the national interests of Australian citizens. We provide ongoing financial intelligence input to counter-terrorism priorities, including investigations and operations by all national intelligence and law enforcement agencies.
With an injection of funding, we have been able to enhance our commitment to these important efforts through the establishment of a National Security Operations team. This team, working with specialist analytical areas in AUSTRAC and partner agencies, is producing new insights and enhancing our knowledge of the nature and extent of terrorism financing.
In addition to working with government partners, we have been directly engaging the private sector to provide them with improved insights on the nature of risks and threats our financial sector faces. As a direct result, we saw a 300 per cent increase in the number of suspicious matter reports (SMRs) received identifying suspicions of terrorism financing.
International leadershipWe continue to make a strong international contribution with important roles in Australia’s delegation to the Financial Action Task Force (FATF), which we were President of this year, and the Asia/Pacific Group on Money Laundering. We also made important contributions to the strategic direction of the Egmont Group of Financial Intelligence Units.
Our contribution to these forums provides us an effective way to influence international thinking and decision making, and to provide information on current and emerging money laundering and terrorism financing risks.
Sharing our intelligence with partner agenciesOur work is valued by our partner agencies and continues to contribute to enforcement outcomes. This year we distributed 93,137 SMRs – an increase of 21 per cent on the previous year.
Partner agencies conducted 1,825,041 online activities using our database, equating to 5,000 each day, 3.4 searches every minute.
Notably, our data contributed to:
• 373 Department of Human Service’s program cases, achieving savings of $5,564,467
• 16,038 ATO cases, contributing to $466 million in income tax assessments and debt collections.
This brings our total contribution to tax assessment and debt collections to nearly $2.5 billion over the past 10 years.
We’ve also continued to make a significant contribution to seven cross-agency taskforces, including the Eligo National Taskforce and Project Wickenby.
2014–15 saw a significant milestone in the development of our new intelligence system – AUSTRAC Intelligence (AI). Following successful trials with NSW Crime Commission, NSW Police and the ATO, access is now being rolled out to partner agencies and users across Australia.
EnforcementDuring the year, we continued to take a strong stance on businesses that contravened their obligations. This included:
• issuing infringement notices to two businesses, including a record fine to one of the world’s largest remittance network providers
• the cancellation of the registration of eight businesses.

AUSTRAC ANNUAL REPORT 2014–15 CEO REVIEw10
OUR CHALLENGES
Implementing the AUSTRAC Industry ContributionIn May 2014, the government announced that the AUSTRAC Supervisory Levy would be replaced with the AUSTRAC Industry Contribution. The industry contribution is a levy on reporting entities to recover the costs of our regulatory and financial intelligence functions.
Throughout implementation, we have consulted broadly with industry to achieve an appropriate balance between delivering on our their expectations and meeting our obligations to government.
Delivering on the government’s deregulation agendaWe are mindful of the government’s deregulation agenda and have worked hard to reduce red tape internally and externally. Doing this in a way that allows us to continue providing enhanced products and services to business has been challenging.
We have streamlined our communication products making it easier for reporting entities to get the response needed from our contact centre.
We commenced a review of the annual compliance report, to ensure that the regulatory burden this imposes is proportionate to the level of money laundering or terrorism financing risk exposure.
We have consulted with industry on the new customer due diligence requirements, which will further reduce regulatory burden. These initiatives will be finalised in 2015–16.
Maintaining a strong AML/CTF regimeEnsuring that the AML/CTF Act and Rules contribute to the disruption of money laundering and terrorism activity is critical to our work. We have provided substantial input to the statutory review being undertaken by the Attorney-General’s Department, to ensure our regulatory regime maintains pace with the changing environment.
An important consideration for the review was the FATF mutual evaluation of Australia.
In August 2014, a team of international assessors descended on Australia to interview government agencies and businesses in relation to the operation of Australia’s regime. This included an intensive two-day visit with AUSTRAC. Armed with information gleaned from their visit, together with a volume of material provided by Australian authorities, the assessors presented their findings to the February 2015 FATF meeting in Paris.
In April 2015 the mutual evaluation report (MER) on Australia was published. The report provided many positives comments about Australia’s regime, in particular noting that we have a mature and sophisticated AML/CTF regime and a well-developed legal and institutional framework. However, the report also detailed some priority actions for Australia and recommendations to improve our legislation and operations.
In addition to the public and closed submissions made to the statutory review and the consultations held with industry and government agencies, due consideration has been given to the recommendations in the FATF report.
2015–16 will see the culmination of several years of effort associated with Australia’s mutual evaluation process and the statutory review of the AML/CFT regime, with a report to be provided to government.
AUSTRAC ANNUAL REPORT 2014–15CEO REVIEw 11
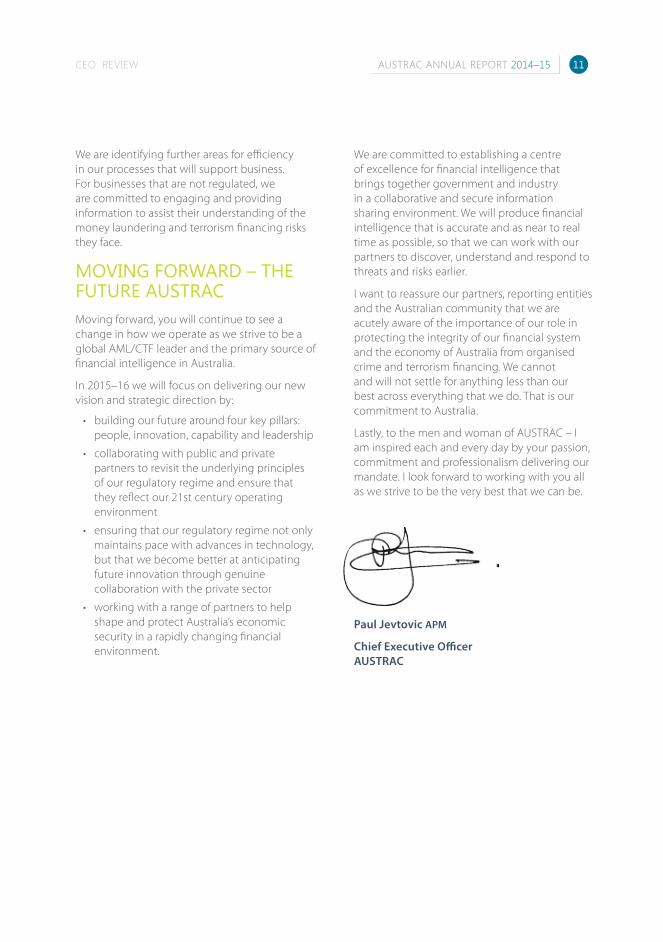
We are identifying further areas for efficiency in our processes that will support business. For businesses that are not regulated, we are committed to engaging and providing information to assist their understanding of the money laundering and terrorism financing risks they face.
MOVING FORWARD – THE FUTURE AUSTRACMoving forward, you will continue to see a change in how we operate as we strive to be a global AML/CTF leader and the primary source of financial intelligence in Australia.
In 2015–16 we will focus on delivering our new vision and strategic direction by:
• building our future around four key pillars: people, innovation, capability and leadership
• collaborating with public and private partners to revisit the underlying principles of our regulatory regime and ensure that they reflect our 21st century operating environment
• ensuring that our regulatory regime not only maintains pace with advances in technology, but that we become better at anticipating future innovation through genuine collaboration with the private sector
• working with a range of partners to help shape and protect Australia’s economic security in a rapidly changing financial environment.
We are committed to establishing a centre of excellence for financial intelligence that brings together government and industry in a collaborative and secure information sharing environment. We will produce financial intelligence that is accurate and as near to real time as possible, so that we can work with our partners to discover, understand and respond to threats and risks earlier.
I want to reassure our partners, reporting entities and the Australian community that we are acutely aware of the importance of our role in protecting the integrity of our financial system and the economy of Australia from organised crime and terrorism financing. We cannot and will not settle for anything less than our best across everything that we do. That is our commitment to Australia.
Lastly, to the men and woman of AUSTRAC – I am inspired each and every day by your passion, commitment and professionalism delivering our mandate. I look forward to working with you all as we strive to be the very best that we can be.
Paul Jevtovic APM
Chief Executive Officer AUSTRAC

O1AGENCY OVERVIEw: wHO IS AUSTRAC?

wE STRIVE TO BE A GLOBAL LEADER IN ANTI-MONEY LAUNDERING AND COUNTER-TERRORISM
FINANCING, AND THE PRIMARY SOURCE FOR FINANCIAL INTELLIGENCE IN AUSTRALIA.

AUSTRAC ANNUAL REPORT 2014–15 AGENCY OVERVIEw: wHO IS AUSTRAC?14
ROLE AND ACCOUNTABILITYThe Australian Transaction Reports and Analysis Centre (AUSTRAC) is an Australian Government agency with a mandate specified in the Anti-Money Laundering and Counter-Terrorism Financing Act 2006 (AML/CTF Act).
We are part of the Attorney-General’s portfolio, with CEO Paul Jevtovic APM reporting to the Minister for Justice, the Hon. Michael Keenan.
OUR AIMWe strive to be a global leader in anti-money laundering (AML) and counter-terrorism financing (CTF), and the primary source for financial intelligence in Australia.
OUR HISTORYThe agency was established in 1989 under the Cash Transaction Reports Act 1988 as the Cash Transaction Reports and Analysis Centre. Our primary responsibility at that time was collecting and analysing various reports about suspicious transactions, international currency transfers and significant amounts of cash.
Our remit has expanded over time. We’re now responsible for strengthening Australia’s economy, by responding to domestic and international criminal activities that threaten the integrity of the financial system.
OUR ENVIRONMENTThe financial sector, comprising more than 14,000 regulated entities and $4.4 trillion in assets, is at risk from criminal abuse. Criminal activity relies on concealing and laundering illicit financial flows.
Countering money laundering and terrorism financing (ML/TF) contributes to a safer and more secure Australia. The task is made harder by a rapidly evolving financial sector. Globalisation continues to expand and complicate financial flows, and exponential change in technology makes predicting the future payments landscape difficult. New entrants and new value exchange models will continue to require new approaches.
Fraud and corruption, including criminal infiltration of financial institutions and the gambling industry, undermine Australia’s economic integrity and impact government revenue. Community attitudes towards regulation and privacy are also changing, adding further uncertainty to regulatory demand and direction over the next decade.
The fast moving environment brings challenges. It also brings the opportunity for a new collaborative relationship with the financial sector, and domestic and international partners, to protect the integrity of the future financial system.
VISION AND STRATEGIC DIRECTIONThis year we worked to the following vision, as outlined in our PBS:
AUSTRAC’S VISION IS AN AUSTRALIAN COMMUNITY THAT IS HOSTILE TO MONEY
LAUNDERING, FINANCING OF TERRORISM, AND SERIOUS AND ORGANISED CRIME, INCLUDING
PEOPLE SMUGGLING, AND TAX EVASION.
Our vision, purpose and strategic direction were reviewed this year, to prepare us to launch a new vision, purpose and strategic direction next financial year. Find out more about this work in Chapter two: A year of refocusing.
ABOUT US

AUSTRAC ANNUAL REPORT 2014–15AGENCY OVERVIEw: wHO IS AUSTRAC? 15
EXECUTIVE STRUCTURE IN 2014–15Note: this structure is representative of positions and titles for the majority of 2014–15
OUR EXECUTIVE
As with most organisations, there were a number of changes to our Executive structure this year. The most significant of these was a change of CEO, following the conclusion of John Schmidt’s five-year term. John made a significant contribution in his time as CEO. His leadership saw the agency take a key role in a range of law enforcement, revenue and intelligence operations.
Paul Jevtovic APM was appointed as our new CEO and commenced on 17 November 2014.
Our organisational structure was reviewed this year, to prepare us to launch a new organisational structure next financial year. Find out more about this work in Chapter two: A year of refocusing.
EGMOperations
Chief ExecutiveO�cer
GMOperations
Support
GMCompliance
GMIntelligence
Chief FinanceO�cer
EGMCorporate
GMProgram
Management
GM Corporate
Chief Information
O�cer
General Counsel/GM
Legal & Policy

AUSTRAC ANNUAL REPORT 2014–15 AGENCY OVERVIEw: wHO IS AUSTRAC?16
PAUL JEVTOVIC APM
CEOPaul Jevtovic was appointed AUSTRAC CEO in November 2014. Paul is an experienced investigator, intelligence professional and crime fighter. His 33 years of policing and intelligence experience have brought a new direction to the agency.
Prior to working at AUSTRAC, Paul worked at the Australian Crime Commission (ACC) as Executive Director, Intervention and Prevention. From October 2013 to April 2014 he performed the role of ACC CEO.
Paul was the Deputy Director at the Office of Police Integrity from 2010–12. Before this he had a 28 year career with the Australian Federal Police (AFP), working across a broad range of investigative fields including drugs, serious and organised crime, fraud and internal affairs, anti-corruption, and international policing capabilities.
In 2007 he was awarded the Australia Policing Medal (APM) for his service to the development of international policing capabilities.
In the first seven months of his term as AUSTRAC CEO Paul has made significant changes; building on a strong foundation to refocus the agency for the future. He has begun transforming AUSTRAC’s culture by driving organisation-wide efforts to encourage leadership and innovation at all levels.

AUSTRAC ANNUAL REPORT 2014–15AGENCY OVERVIEw: wHO IS AUSTRAC? 17
PETER CLARK
Executive General Manager, OperationsPeter is responsible for the Compliance, Intelligence and Enforcement functions of the agency.
Before joining AUSTRAC, Peter was a Senior Financial Sector Specialist at the International Monetary Fund (IMF) in Washington DC. He provided advice on the structure and regulation of financial markets, and developed technical assistance and capacity building initiatives.
Peter has also served as:
• Secretary General of the International Organisation of Securities Commissions
• Head of the International Branch at the Australian Securities and Investments Commission (ASIC).
LIZ ATKINS PSM
Executive General Manager, CorporateLiz is responsible for our corporate, information technology, program management, and legal and policy functions.
Liz led AUSTRAC’s contribution to the development of the AML/CTF Act, and the first set of AML/CTF Rules and guidance. She was also instrumental in the most recent review of the international AML/CTF standards.
Her career has covered general administration and management, policy development, provision of legal advice, litigation and the development of legislation in the areas of transport, communications, law enforcement and national security.
On Australia Day 2013 she was awarded the Public Service Medal (PSM) for outstanding public service in the development and implementation of AML/CTF legislation and regulation.

AUSTRAC ANNUAL REPORT 2014–15 AGENCY OVERVIEw: wHO IS AUSTRAC?18
ANGELA JAMIESON
General Manager, Operations SupportAngela’s area oversee AUSTRAC’s intelligence and compliance branches with frontline activities, including strategic intelligence, AML/CTF relief applications and client services.
Prior to joining AUSTRAC she was an Assistant Commissioner in Serious Non-Compliance at the ATO. She also worked in professional services with EY and Deloitte, specialising in fraud and forensics.
Angela started her career in smaller accounting practices where she provided general accounting and taxation advice. She holds a Bachelor of Business majoring in accounting, is a CPA, a certified fraud examiner and has specialised in forensic accounting.
AMANDA WOOD
General Manager, Compliance Prior to her departure in April 2015, Amanda oversaw our Compliance and Policy functions, the implementation of the AUSTRAC supervisory levy and reforms to the regulation of the remittance sector.
Before joining AUSTRAC, Amanda provided services to a range of government and commercial entities in the areas of risk management and regulatory compliance.
Amanda joined the Department of the Treasury after university before transferring to APRA. After another stint in Treasury, Amanda served as a Ministerial Adviser to the Assistant Treasurer between 2002 and 2003.
JOHN VISSER
General Manager, IntelligenceJohn joined AUSTRAC in 1991. His career with the agency has included leadership roles in the regulatory, intelligence and corporate branches.
He was instrumental in the development and implementation of AUSTRAC’s analysis and intelligence systems, including the agency’s money laundering monitoring, enquiry and data mining systems.
He has also represented AUSTRAC in a number of key money laundering, law enforcement and intelligence forums in Australia and around the world.
ALF MAZZITELLI JP
Chief Finance OfficerAlf was appointed Chief Finance Officer in May 2011. He is responsible for managing AUSTRAC’s financial management strategies, processes and systems in accordance with legislative, corporate governance, strategic and business objectives.
Alf has held a number of roles within the agency, as well as being seconded to the Department of Finance and the Attorney-General’s Department (AGD). He holds a Bachelor of Business majoring in Accounting and is a member of CPA Australia.

AUSTRAC ANNUAL REPORT 2014–15AGENCY OVERVIEw: wHO IS AUSTRAC? 19
MICHELE FOSTER
General Manager, CorporateMichele is responsible for all aspects of Human Resources (HR), agency risk management, protective security, fraud and corruption control, business continuity management and information/records management.
Michele also worked at the Department of Health and the Department of Immigration in a range of corporate areas, including finance and HR, before moving into project management for more than 15 years.
ANTHONY JOHNSTON
Acting General Manager, Information TechnologyAnthony has been acting in the Chief Information Officer role since October 2013.
His background in technology and infrastructure has helped the agency navigate significant change. He has worked in various technical roles, primarily in the banking and financial service sectors.
Anthony is an active member of the Australian Information Security Association.
RUSSELL WILSON
General Manager, Legal and Policy, and General CounselRussell joined AUSTRAC in 2006 as our first General Counsel. In this role he was part of the team that saw in the introduction of the current AML/CTF Act.
Over the last 12 months Russell has been a member of the team assessing the Sri Lankan AML/CTF regime as part of the Asia/Pacific Group on Money Laundering’s (APG) program of evaluations.
Prior to working at AUSTRAC, Russell performed various work with the Australian Government Solicitor, leading multidisciplinary teams. He also taught a range of legal subjects at Canberra University and the Australian National University.
STEVEN ATKINS
General Manager, Program ManagementSteven joined AUSTRAC in March 2011. He and his team are responsible for the agency wide planning and governance of major programs and projects. They support broader agency integrated planning and provide expertise and services for project delivery and executive support.
Prior to AUSTRAC, Steven worked in the private sector, in telecommunications, broadcasting, banking and airlines.

AUSTRAC ANNUAL REPORT 2014–15 AGENCY OVERVIEw: wHO IS AUSTRAC?20
2014–15 OUTCOMEA financial environment hostile to money laundering, financing of terrorism, major crime and tax evasion through industry regulation and the collection, analysis and dissemination of financial intelligence.
2014–15 OUTCOME STRATEGYAUSTRAC achieves its outcome by operating as Australia’s AML/CTF regulator and financial intelligence unit.
AUSTRAC’s strategy involves:
• ongoing implementation of Australia’s AML/CTF regime in partnership with industry, government and partner agencies
• maintaining the trust of the community, industry and government in AUSTRAC as Australia’s AML/CTF regulator
• adopting a risk-based approach to improving industry compliance with the obligations, including through pursuing a strategic enforcement policy
• maintaining AUSTRAC’s reputation as a global leader in collecting, analysing and disseminating financial intelligence.
Although this was a year of refocusing, we also delivered on the expectations of the government, our partners and the community.
The performance scorecard outlines our achievements against our deliverables and KPI as prescribed in our PBS. You can find out more about the achievements by reading the relevant chapters.
OUTCOME AND PROGRAM STRUCTURE
PERFORMANCE SCORECARD

AUSTRAC ANNUAL REPORT 2014–15AGENCY OVERVIEw: wHO IS AUSTRAC? 21
Deliverable Target Result Key points on performance Page
Transaction reporting among regulated population
Take action against non-compliance by regulated entities according to compliance and risk profile
We undertook data analysis to detect entities not reporting or reporting irregular behaviour.
We issued:
• 46 compliance assessment reports highlighting transaction reporting obligations needing rectification
• 12 notices of reviewable decisions relating to the registration of remittance providers, including concerns about transaction reporting.
70
Education and awareness programs delivered to industry
Assistance delivered to industry sectors according to compliance and risk profile
We regularly meet with industry to improve their awareness of the obligations. This year we held three industry forums and two major reporters’ forums.
We produced:
• communication campaigns, including 101,511 emails and 2,941 letters
• guidance material, including the new online AUSTRAC compliance guide
• the online Remittance Sector Register, registering 5,380 businesses.
38–41
PROGRAM 1.1 DELIVERABLESFully Achieved Partially achieved Not achieved

AUSTRAC ANNUAL REPORT 2014–15 AGENCY OVERVIEw: wHO IS AUSTRAC?22
Deliverable Target Result Key points on performance Page
Industry sectors risk rated Ongoing risk rating of all regulated sectors
We undertook ongoing risk rating of our regulated population using:
• macro data analysis of reporting trends
• past assessment activity
• levels of industry regulation
• partner agency input
• resources available to an industry or reporting entity to ensure compliance.
71
Annual supervisory program
95 per cent of assessments in supervisory program completed
We completed 100 assessments, equating to 96 per cent of those planned under the annual supervisory program.
70
Effective use of remedial powers to promote compliance
Identify and take action on appropriate cases
We stepped up our assessment in the remittance sector, culminating in:
• suspension of two remittance providers’ registration
• cancellation of eight remittance providers’ registration
• imposition of conditions on two remittance providers’ registration
• refusal of two registration applications.
39

AUSTRAC ANNUAL REPORT 2014–15AGENCY OVERVIEw: wHO IS AUSTRAC? 23
Deliverable Target Result Key points on performance Page
Development of Rules and guidance to meet industry and government needs
AML/CTF Rules registered and guidance published addressing issues raised by government and industry
In 2014–15 we registered 14 AML/CTF Rules.
We published:
• guidance on the Document Verification Service in April of 2015 as part of the AUSTRAC Compliance Guide
• draft guidance on the key terms used in the ‘politically exposed person’ definition in the AML/CTF Rules. This was released for the first round of public consultation in January 2015.
64
Advice on identified law improvements provided to government
Timely and quality advice on proposed law improvements
We provided advice on law improvements regarding:
• statutory review of the AML/CTF Act, regulations and AML/CTF Rules
• amending the secrecy and access provisions of the AML/CTF Act to assist the Australian Taxation Office (ATO) in its data-matching functions
• prescribing new designated agencies, such as the Independent Broad-based Anti-corruption Commission (IBAC) of Victoria
• realigning the framework to accommodate the AUSTRAC industry contribution
• repealing the account blocking provisions of the Financial Transactions Reports Act 1988 (FTR Act).
64

AUSTRAC ANNUAL REPORT 2014–15 AGENCY OVERVIEw: wHO IS AUSTRAC?24
Deliverable Target Result Key points on performance Page
High level of database availability
97 per cent availability
This benchmark was consistently exceeded, averaging at 99.72 per cent availability.
Partner agencies consider our TRAQ Enquiry System (TES) a useful resource:
• 3,364 registered partner agency personnel have online access to AUSTRAC information through TES
• partner agency personnel logged on to the database to access financial information 197,360 times
• partner agency personnel conducted a total of 1,825,041 TES activities.
This equates to 5,000 TES activities every day – 3.4 every minute.
44
Analysis and dissemination of matters of intelligence interest
95 per cent of planned intelligence products disseminated
We completed 943 disseminations, from the 1,200 planned.
This shortfall is due to a number of reasons, including:
• a shift in focus, to ensure our efforts are on the quality of products rather than quantity – including advances in our profiling and detection analytics that reduce the need for high volumes of entity-level disseminations compared to value-add intelligence reports
• output levels were impacted as we moved partner agencies to our new database, AUSTRAC Intelligence (AI), to improve our the quality and consistency of these disseminations for future years.
43
AUSTRAC ANNUAL REPORT 2014–15AGENCY OVERVIEw: wHO IS AUSTRAC? 25
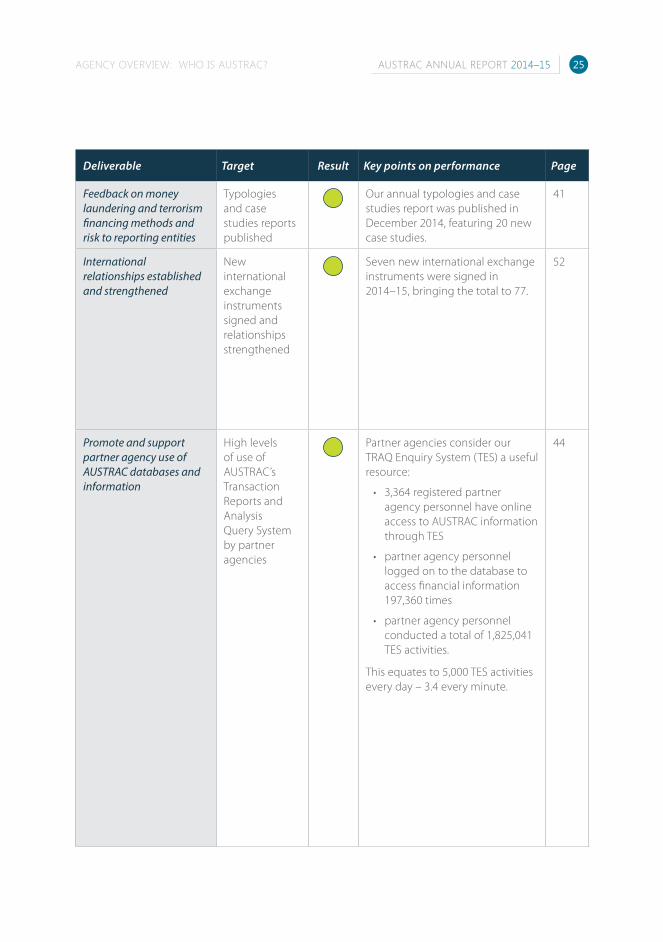
Deliverable Target Result Key points on performance Page
Feedback on money laundering and terrorism financing methods and risk to reporting entities
Typologies and case studies reports published
Our annual typologies and case studies report was published in December 2014, featuring 20 new case studies.
41
International relationships established and strengthened
New international exchange instruments signed and relationships strengthened
Seven new international exchange instruments were signed in 2014–15, bringing the total to 77.
52
Promote and support partner agency use of AUSTRAC databases and information
High levels of use of AUSTRAC’s Transaction Reports and Analysis Query System by partner agencies
Partner agencies consider our TRAQ Enquiry System (TES) a useful resource:
• 3,364 registered partner agency personnel have online access to AUSTRAC information through TES
• partner agency personnel logged on to the database to access financial information 197,360 times
• partner agency personnel conducted a total of 1,825,041 TES activities.
This equates to 5,000 TES activities every day – 3.4 every minute.
44
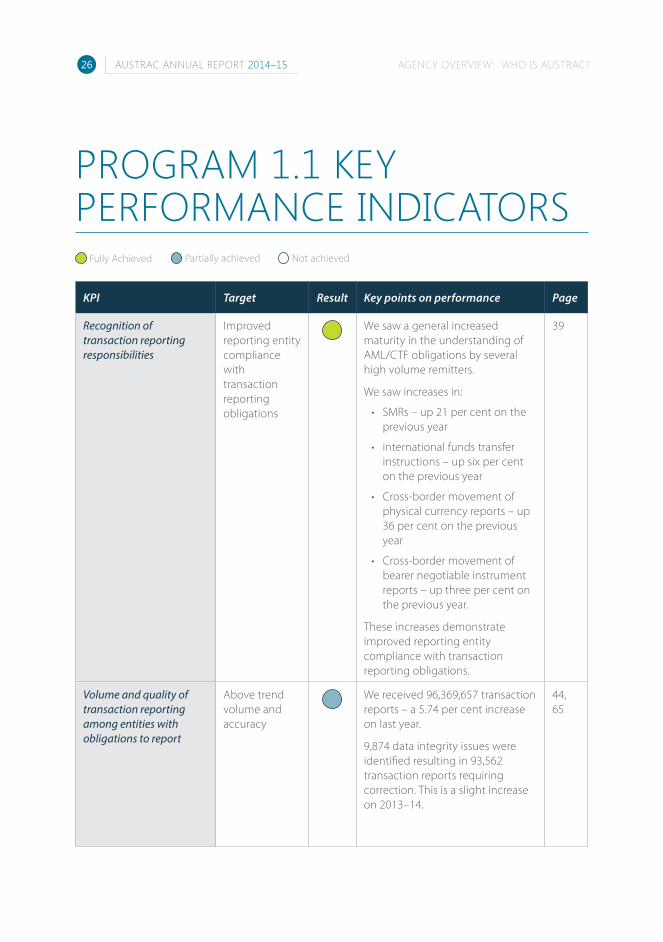
AUSTRAC ANNUAL REPORT 2014–15 AGENCY OVERVIEw: wHO IS AUSTRAC?26
KPI Target Result Key points on performance Page
Recognition of transaction reporting responsibilities
Improved reporting entity compliance with transaction reporting obligations
We saw a general increased maturity in the understanding of AML/CTF obligations by several high volume remitters.
We saw increases in:
• SMRs – up 21 per cent on the previous year
• international funds transfer instructions – up six per cent on the previous year
• Cross-border movement of physical currency reports – up 36 per cent on the previous year
• Cross-border movement of bearer negotiable instrument reports – up three per cent on the previous year.
These increases demonstrate improved reporting entity compliance with transaction reporting obligations.
39
Volume and quality of transaction reporting among entities with obligations to report
Above trend volume and accuracy
We received 96,369,657 transaction reports – a 5.74 per cent increase on last year.
9,874 data integrity issues were identified resulting in 93,562 transaction reports requiring correction. This is a slight increase on 2013–14.
44, 65
PROGRAM 1.1 KEY PERFORMANCE INDICATORS
Fully Achieved Partially achieved Not achieved

AUSTRAC ANNUAL REPORT 2014–15AGENCY OVERVIEw: wHO IS AUSTRAC? 27
KPI Target Result Key points on performance Page
Recognition of compliance reporting obligations
85 per cent of regulated entities with compliance reporting obligations have submitted a compliance report
86 per cent of the expected 6,787 compliance reports were received by 30 June 2015.
39
Level of industry compliance
Industry monitoring demonstrates improved compliance
96.7 per cent of reporting entities reported having implemented a compliance program.
This is a slight increase compared with 96.38 per cent in 2013–14.
70
Significant non-compliance rectified
Selected cases of detected non-compliance addressed
At 30 June 2015, we had:
• issued 72 compliance assessment reports requiring reporting entities to take remedial action for significant non-compliance
• issued 285 findings (including remediation requirements)
• made 162 recommendations to improve the robustness of AML/CTF programs.
We:
• refused two remitter applications for registration
• cancelled eight remitter registrations
• imposed conditions on the registration of two remitters.
39, 70

AUSTRAC ANNUAL REPORT 2014–15 AGENCY OVERVIEw: wHO IS AUSTRAC?28
KPI Target Result Key points on performance Page
Improved industry understanding of obligations
Industry monitoring demonstrate improved awareness and understanding
We monitor our regulated population through assessments and reviews of compliance reports.
Increases in the number of transaction reports submitted in 2014–15 indicate improvements in industry monitoring and understanding.
39
Policy development has regard to revised international standards and domestic AML/CTF risks
New policy reflects international standards and domestic AML/CTF risks
We participated in interdepartmental committees to consider:
• enhancements to the AML/CTF regime
• financial inclusion
• remittance.
In collaboration with the AGD, we continued to:
• engage and consult on the customer due diligence reforms
• contribute to the statutory review of the AML/CTF regime, ensuring findings of the Financial Action Task Force (FATF) mutual evaluation report (MER) on Australia, including recommendations to align more closely with the FATF standards, are taken into consideration.
42

AUSTRAC ANNUAL REPORT 2014–15AGENCY OVERVIEw: wHO IS AUSTRAC? 29
KPI Target Result Key points on performance Page
Value of AUSTRAC information and financial intelligence to partner agency and taskforce operations
Number and significance of operational matters to which AUSTRAC has contributed
We distributed 93,137 SMRs to partner agencies, an increase of 21 per cent on the previous year.
Our data contributed to:
• 373 Department of Human Service’s Centrelink program cases, achieving savings of $5,564,467
• 16,038 ATO cases, contributing to $466 million in income tax assessments and debt collections.
We’ve made significant contributions to seven cross-agency taskfroces, including the Eligo Taskforce and Project Wickenby.
42–43, 66
Increased financial intelligence exchange with counterpart financial intelligence units
95 per cent of planned program disseminations achieved
We participated in 857 financial intelligence exchanges.
This is 425 per cent per cent of the planned program disseminations (200) and a sizeable increase on last year (301).
50
International technical assistance and training builds capacity of recipient financial intelligence units and other stakeholders to meet international standards
Technical assistance delivered in accordance with program and budget
We were involved in five Technical Assistance & Training (TA&T) programs:
• PPATK-AUSTRAC partnership program (PAPP)
• Indonesian Alternative Remittance and Cash Couriers Program (IndoARCC)
• Improving Governance in South-East Asia Program (IGiSEA)
• Strengthening AML/CTF Regulation in South Asia Program (SARiSA)
• Combating Corruption – Strengthening the Financial System against Money Laundering and Recovering Proceeds of Crime in Papua New Guinea.
56

O2A YEAR OF REFOCUSING

wE NEED TO BE HIGHLY ADAPTABLE AND RESPONSIVE TO KEEP PACE wITH TECHNOLOGY,
FINANCIAL MODELS, AND CONSUMER AND CRIMINAL PATTERNS.

AUSTRAC ANNUAL REPORT 2014–15 A YEAR OF REFOCUSING32
On 17 November 2014 Paul Jevtovic APM commenced as AUSTRAC CEO. Paul inherited an agency motivated to make a difference to Australia’s national interest.
Our areas of focus are driven by government priorities, such as national security, foreign fighters, the FATF evaluation and the AML/CTF Act review. Under new leadership, we have commenced a journey to ensure we are well placed to respond to these priorities. We will achieve this through a new strategic direction, and a focus on collaboration and innovation.
We are determined to:
• provide the services and products that industry and government partners expect of us
• ensure that as ‘custodians’ of Australia’s financial intelligence we are treating those holdings as a national asset
• create an environment where government agencies and industry work side by side to analyse and identify the highest threats to our financial system, economy and the citizens of our nation.
The changes we are making are largely driven by:
• increased community interest and expectations in relation to money laundering and terrorism financing threats
• improvements to technology that make it easier for our financial system to be abused
• a push from government to work more efficiently
• the need to be contemporary and keep up with the modern practices of Australian businesses.
The second half of this year saw our staff collaborate to develop a new vision and to decide what the future AUSTRAC might look like.
THE CHANGE PROGRAMWe recognise the need to continuously evolve to meet future demands. We need to be highly adaptable and responsive to keep pace with technology, financial models, and consumer and criminal patterns.
A number of working groups formed to design initiatives that will get us to our desired future state. These working groups helped prepare for the implementation of a new strategic framework, supported by a change program and new leadership and governance frameworks.
Work progressed on:
• business planning and strategic direction
• 2015 strategic intelligence priorities
• national and global footprint
• national capability review
• strategic workforce plan
• brand and marketing
• cutting red tape initiative.
FROM 1 JULY 2015, OUR VISION IS FOR A FINANCIAL SYSTEM FREE
FROM CRIMINAL ABUSE.
OUR TRANSFORMATION

AUSTRAC ANNUAL REPORT 2014–15A YEAR OF REFOCUSING 33
To deliver on this, we are planning to embed:
• new relationships
• flexible ways of working
• a culture of innovation and empowerment
• a new operating model that supports a financial intelligence focus.
OUR STRATEGIC PLANA new strategic plan will be implemented from 1 July 2015. It sets our future goals, in terms of our identity and our business, and what we need to do to achieve them. This includes three major initiatives, designed by our working groups, that will get us to where we need to be.
MAJOR INITIATIVES
A new way of doing businessWe will establish a centre of excellence for financial intelligence that brings together government and industry in a collaborative, secure and real time information sharing environment.
Reshaping the AML/CTF frameworkThe review of the AML/CTF Act, and associated Rules and regulations (the AML/CTF regime) and the outcomes of the FATF mutual evaluation report (MER) provide a unique opportunity to improve our framework for information collection, our relationship with partners (particularly industry), and to streamline the domestic AML/CTF regime and reduce, where possible, the regulatory impact.
International and domestic footprintWe will review where we need to position ourselves nationally and globally to support delivery of our strategic plan. Our footprint will support us to create new, collaborative relationships with our partners in order to better achieve our vision.
A NEW OPERATING MODELOur Executive Committee designed a new operating model, which was released to staff at the end of June. This outlines the fundamental functions of our organisation and underpins our purpose and processes for delivering value to our stakeholders.
Our operating model is supported by six operating principles that will assist to deliver on our purpose and strategic direction.
These will help us to plan and prioritise our work to best deliver our intended outcomes.
THE NEW GOVERNANCE FRAMEWORKOur operating model will be supported by a new governance framework. This framework will lay the foundations for our success in future years and ensure that we maximise the alignment of our capabilities and functions.
In designing the governance framework, we reviewed and rationalised our internal committees from eight to three strategic governance committees.
From 1 July 2015 we will operate the:
• Executive Committee, responsible for agency-wide strategic initiatives and financial oversight
• Operations Committee, responsible for our strategic direction and oversight of our operational capabilities
• Organisational Health Committee, focusing on our ability to deliver sustainable, high-quality and timely outcomes through our people and other resources.
The Audit and Risk Committee and the Privacy Consultative Committee operated in 2014–15 and will continue in the future.

AUSTRAC ANNUAL REPORT 2014–15 A YEAR OF REFOCUSING34
STRUCTURE AND LEADERSHIPA new structure was designed and came into effect on 1 July 2015.
Key changes include:
• a number of title and role changes
• the alignment of operational activities into one division
• the recognition of innovation as a key work area.
Deputy CEOOperations
Deputy CEOCorporate
Chief ExecutiveO�cer
National ManagerInternationalOperations
National ManagerStrategic
Intelligence& Policy
National ManagerCompliance
National ManagerIntelligence
National ManagerFinance &
Infrastructure(Chief Finance O�cer)
National ManagerInnovation & Technology
(Chief Information O�cer)
National ManagerPeople & Integrity
National ManagerLegal, Governance
and Risk(General Counsel)

AUSTRAC ANNUAL REPORT 2014–15A YEAR OF REFOCUSING 35
LEADERSHIP FRAMEWORKWe are first and foremost committed to serving the national interest, with a leadership team who accept that leadership is both a privilege and an obligation.
In addition to a new structure, the CEO developed a leadership framework defined by three core leadership behaviours:
1. collaboration
2. inspiration
3. innovation.
The framework will ensure that our leaders work across national and international boundaries to provide Australia with the ability to regulate, discover, understand, respond and add value in the fight against serious and organised crime.
COLLABORATION INSPIRATION INNOVATION

O3BUILDING RELATIONSHIPS TO STRENGTHEN THE SYSTEM

STRENGTHENING OUR RELATIONSHIP wITH INDUSTRY IS OUR NUMBER ONE STRATEGIC
RELATIONSHIP PRIORITY. wE ARE wORKING TO BETTER UNDERSTAND wHO THEY ARE SO THAT INDUSTRY REPRESENTATIVES, REGULATORS AND LAw ENFORCEMENT CAN wORK SIDE BY SIDE.

AUSTRAC ANNUAL REPORT 2014–15 BUILDING RELATIONSHIPS TO STRENGTHEN THE SYSTEM38
Our industry partners are crucial to our success.
We want genuine collaboration with industry so we can make complying with their obligations as easy as possible. We are committed to the government’s agenda for better regulation and reductions in red tape to drive efficiency improvements.
Strengthening our relationship with industry is our number one strategic relationship priority. We are working to better understand their needs so that industry representatives, regulators and law enforcement can work together to:
• produce financial intelligence that is accurate and as near to real time as possible
• discover and understand threats and risks
• collaborate on responses and solutions.
WHO ARE OUR REPORTING ENTITIES?Our regulated population is diverse, ranging from major banks and casinos to single-operator businesses.
At 30 June 2015, 14,040 reporting entities were enrolled with us – an increase of 45 on the previous year.
REGISTRATION ACTIVITYReporting entities providing a designated remittance service must enrol and register with us before providing remittance services to their customers.
At 30 June 2015 5,379 reporting entities were registered with AUSTRAC.
A remitter may have one or more registrations in different capacities. Note that figures prior to 2013–14 represented the number of registrations issued (some of which may be to the same entities).
This year we delivered:
• 41 reviews of registration (mostly influenced by partner agencies and entities of interest to the Eligo National Taskforce), with consideration of whether to refuse an application for registration, impose conditions, suspend or cancel a registration were conducted
• two workshops to 26 Remittance Network Provider (RNPs) to assist them with renewing the registration of their affiliates.
We stepped up our assessment of ML/TF risk within the remittance provider industry. This culminated in the:
• suspension of two remittance providers’ registration
• cancellation of eight remittance providers’ registration
• imposition of conditions on two remittance providers’ registration
• refusal of two registration applications.
wORKING wITH OUR PARTNERS IN INDUSTRY
AUSTRAC ANNUAL REPORT 2014–15BUILDING RELATIONSHIPS TO STRENGTHEN THE SYSTEM 39
PROVIDING SUPPORT TO INDUSTRYWe’re focused on building positive and productive relationships with entities through phone and email communication to increase sharing and verification of information.
This year we reviewed and streamlined our processes to make it easier for entities to meet their obligations. We:
• identified and contacted 338 potential reporting entities not enrolled, resulting in 35 new enrolments and 102 escalations for further action
• reviewed and verified 1,362 new enrolments and assessed and processed 1,250 reporting entity roll removals.
Note: Enrolment obligations for reporting entities change over time depending on whether they offer designated services under the AML/CTF Act.
AWARENESS OF AML/CTF OBLIGATIONSWe monitor our regulated population’s awareness of AML/CTF obligations by conducting assessments and reviewing information submitted in AML/CTF compliance reports. We educate and increase reporting entity and industry understanding of AML/CTF obligations through:
• industry forums
• meetings with industry
• communication campaigns
• guidance material
• the online Remittance Sector Register
• interactions with the AUSTRAC Contact Centre.
This year we saw a general increased maturity in the understanding of AML/CTF obligations by several high-volume remitters.
MAJOR REPORTERS’ FORUMS We held major reporters’ forums in October 2014 and April 2015.
The forums are attended by 19 designated business groups (DBGs) containing about 380 reporting entities – almost three per cent of our reporting entity population. These DBG’s account for 86 per cent of the number of transaction reports lodged, equalling 93 per cent of the value lodged.
The forums allow us to provide feedback to our major reporting entities about:
• the financial intelligence they provide
• how is it used
• factors that can assist them to better identify potential ML/TF activity
• future developments in the AML/CTF regime.
COMPLIANCE REPORTING6,787 reporting entities required to submit an AML/CTF annual compliance report (ACR) this year. At 30 June 2015, 86 per cent of these had submitted their compliance report for this reporting period.
In consultation with industry, we commenced a review of the ACR to ensure it maintains its currency and relevance. As the AML/CTF Act has been bedded down, the information collected has become less useful for analysis and input into our risk-based approach to supervision.
We identified that the regulatory burden of submitting the ACR may not be proportionate to the level of ML/TF risk exposure for some reporting entities.

AUSTRAC ANNUAL REPORT 2014–15 BUILDING RELATIONSHIPS TO STRENGTHEN THE SYSTEM40
On 2 October 2014 we commenced public consultation on the draft Regulation Impact Statement – Proposed changes to the annual compliance report. Public consultation closed on 28 November 2014. We received 20 industry submissions outlining key issues, mostly with the annual return and the proposed enhanced compliance report.
We will undertake further stakeholder engagement before finalising the review.
NEW CUSTOMER DUE DILIGENCE REQUIREMENTSCustomer due diligence (CDD) is central to an effective AML/CTF regime.
Our reporting entities need to identify and verify each of their customers so they can:
• determine the ML/TF risk posed
• decide whether to proceed with a business relationship or transaction
• assess the level of future monitoring required.
New CDD requirements took effect on 1 June 2014 through amendments to seven chapters of the AML/CTF Rules. The changes are currently being implemented. To date, we’ve engaged and consulted with government, industry and other community stakeholders on:
• requirements to e-verification
• safe harbour provisions
• extending current customer identification exemptions to include beneficial owners and politically exposed persons.
The changes to the Rules draw on best practice international techniques and endorsed international standards which directly seek to protect Australia’s:
• revenue base, through enhanced collection and verification of customer information
• national security from organised criminals and money launderers misusing the complex business structures to conceal their ownership and controlling interest.
CONSULTATION ON AUSTRAC INDUSTRY CONTRIBUTIONOn 13 May 2014 the government announced as part of the Budget that the AUSTRAC supervisory levy would be replaced with the AUSTRAC industry contribution.
The industry contribution is a levy on reporting entities to recover the costs of AUSTRAC’s regulatory and financial intelligence functions. The industry contribution arrangements apply from the 2014–15 financial year onwards.
The Australian business sector derives significant benefits from supporting a strong AML/CTF regime. We value the input of our industry partners in protecting our financial system from criminal abuse, and in helping us to discover, understand and respond to criminal including serious and organised crime and terrorism financing.
We consulted extensively with industry on the proposed calculation model for the 2014–15 industry contribution, including releasing consultation papers on:
• 26 June 2014
• 25 September 2014
• 3 December 2014.
We received more than 20 written submissions from stakeholders. The final model for 2014–15 was released in March, and reflected stakeholder feedback. Invoices for 2014–15 were issued in April 2015.
In June 2015 we commenced preparations for the 2015–16 industry contribution. Consultation for this will commence early in the 2015–16 financial year.
Further information about the contribution is available on our website.

AUSTRAC ANNUAL REPORT 2014–15BUILDING RELATIONSHIPS TO STRENGTHEN THE SYSTEM 41
RESOURCES, PUBLICATIONS AND COMMUNICATIONWe publically release resources and publications to ensure the information our reporting entities need is readily available.
Terrorism financing in Australia 2014In 2014 we publicly released a new flagship report: Terrorism financing in Australia 2014. The report provides industry and the public with significant information on terrorism financing, the main characteristics of terrorism financing in Australia and the many channels used to raise and transfer terrorist funds.
Typologies and case studies report 2014The AUSTRAC typologies and case studies report 2014 was released in December 2014. It covers 20 real life partner agency case studies where AUSTRAC information was used throughout the investigation. This report was the eighth and final edition. From mid-2015 our case studies will be available on a searchable online case study hub.
Strategic analysis briefsOur strategic analysis briefs offer insights for government and industry on ML/TF risks, trends and methods. This year we released two strategic analysis briefs:
• Money laundering through real estate, which outlines 10 money laundering methods and the vulnerabilities and indicators associated with the real estate sector
• Money laundering through legal practitioners, which covers five money laundering methods and vulnerabilities and indicators associated with legal practitioners.
AUSTRAC compliance guideWe published a new, web-based AUSTRAC compliance guide in September 2014. This version simplifies and consolidates a range of guidance material and replaces the AUSTRAC regulatory guide. It explains obligations for entities regulated under the AML/CTF Act and FTR Act and assists them to design, develop and implement systems and controls to mitigate the risks of money laundering and terrorism financing.
Stakeholder communicationWe issued 101,511 emails and 2,941 letters to reporting entities and industry associations in 14 unique campaigns, including compliance reporting obligations, mutual evaluation, release of typologies and the industry contribution.
New AUSTRAC websiteWe redesigned and rebuilt our external website to make it more user-focused and accessible.
AUSTRAC on TwitterIn May 2015 AUSTRAC joined Twitter under the handle @AUSTRAC_gov_au. This has given us a quick and contemporary way to get information to our partner agencies and reporting entities.
FOLLOW US ON TWITTER:
@AUSTRAC_gov_au

AUSTRAC ANNUAL REPORT 2014–15 BUILDING RELATIONSHIPS TO STRENGTHEN THE SYSTEM42
We work closely with partner agencies across federal and state governments. This collaboration and sharing of information produces more effective outcomes for Australia.
This year we contributed to many interdepartmental committees and partner agency taskforces, including the following whole-of-government forums:
• Heads of Commonwealth Operational Law Enforcement Agencies
• AML Interdepartmental Committee
• National Intelligence Collection Management committee, chaired by the Office of National Assessments
• Serious Organised Crime Coordination Committee
• Australian Counter-Terrorism Centre
• Australian Criminal Intelligence Forum
• NSW Crime Commission and NSW Police Organised Crime Squad
• National Border Targeting Centre
• Border Management Group
• ACC’s National Criminal Intelligence Fusion Capability
• AFP’s Fraud and Anti-corruption Centre
• an interdepartmental committee convened by the Department of Foreign Affairs and Trade (DFAT), which is concerned with financial inclusion and remittance
• an interdepartmental committee, co-chaired by Department of Immigration and Border Protection and AusTRADE, for Significant and Premium Investment Visas
• Various forums under organised crime national framework, including Joint Management Groups, Joint Analyst Groups Operations Coordination Group.
We were also involved in seven cross-agency taskforces:
• Project Wickenby
• Taskforce Eligo
• Western Australian Joint Organised Crime Taskforce
• Trade Union Corruption Taskforce
• Waterfront taskforces, including Jericho, Trident and Polaris
• Terrorism Financing Investigation Unit
• Operation Morpheus.
CONSULTATION HIGHLIGHTSWe worked with the ATO on the 2013–14 Budget measure Tax Compliance: Improving compliance through third party reporting and data matching. We engaged ten entities, including banks, to secure additional payment information resulting in a marked increase in the data match rate within the ATO.
We worked collaboratively with the AGD to continue our engagement and consultation with government, industry and other community stakeholders regarding the CDD reforms. Find out more about this on page 40.
We contributed to the statutory review of the AML/CTF regime to ensure it is taking into account our strategic direction and operational issues arising from the findings in the FATF’s MER of Australia. Find out more about our contribution to the review on page 63.
wORKING wITH OUR PARTNERS IN GOVERNMENT

AUSTRAC ANNUAL REPORT 2014–15BUILDING RELATIONSHIPS TO STRENGTHEN THE SYSTEM 43
SMARTER DATA – SHARING WITH PARTNER AGENCIESThis year we used our data in smarter ways – sharing it more effectively with partner agencies to support them to efficiently use financial intelligence to undertake their investigative and regulatory operations.
Fast factsThe DHS Centrelink program uses our information to support its compliance activity. In 2014–15 this information contributed to 373 cases, achieving savings of $5,564,467.
The ATO uses our information to support its compliance activity. In 2014–15 this information directly contributed to the ATO raising income tax assessments and collecting debts totalling $466 million across 16,038 cases.
We distributed 93,137 suspicious matter reports (SMRs) and suspect transaction reports (SUSTRs) to partner agencies – an increase of 21 per cent on last year.
The table below outlines the five agencies who received the most reports from us.
Agency 2014–15 2013–14
Australian Taxation Office
80,978 64,110
Australian Federal Police
3,298 3,163
Australian Customs and Border Protection Service
1,536 1,605
Australian Crime Commission
1,533 1,333
Department of Human Services
1,479 1,283
Many of the SMRs accepted are linked to current investigations or operations and a number are being used to generate new leads.
Find out more about SMRs on page 66.
PLANNED INTELLIGENCE DISSEMINATIONSWe completed 943 intelligence product disseminations.
This shortfall is due to a number of reasons, including:
• a shift in focus, to ensure our efforts are on the quality of products rather than quantity – including advances in our profiling and detection analytics that reduce the need for high volumes of entity-level disseminations compared to value-add intelligence reports
• output levels were impacted as we moved partner agencies to our new database, AUSTRAC Intelligence (AI), to improve our the quality and consistency of these disseminations for future years.
197,360TES LOGINS
373DHS cases
Our info contributed to:$5.5millionin savings
Resulting in:
16,038ATO cases
Our info contributed to:$466millionin debt collection
Resulting in:
93,137SMRs/SUSTsdistributed
21%increase onlast year
197,360TES LOGINS
373DHS cases
Our info contributed to:$5.5millionin savings
Resulting in:
16,038ATO cases
Our info contributed to:$466millionin debt collection
Resulting in:
93,137SMRs/SUSTsdistributed
21%increase onlast year
197,360TES LOGINS
373DHS cases
Our info contributed to:$5.5millionin savings
Resulting in:
16,038ATO cases
Our info contributed to:$466millionin debt collection
Resulting in:
93,137SMRs/SUSTsdistributed
21%increase onlast year
AUSTRAC ANNUAL REPORT 2014–15 BUILDING RELATIONSHIPS TO STRENGTHEN THE SYSTEM44
DATABASE AVAILABILITY We store our financial intelligence in the Transaction Reports Analysis and Query (TRAQ) database. Authorised partner agency personnel access this through the TRAQ Enquiry System (TES).
Fast factsDatabase availability averaged at 99.72 per cent for 2014–15.
At 30 June 2015, there were 3,364 registered partner agency personnel with online access to our information through TES, compared to 3,406 at 30 June 2014.
Partner agency users logged onto TES to access financial information on 197,360 occasions, conducting a total of 1,825,041 TES activities.
9,874 data integrity issues were identified, resulting in 93,562 transaction reports requiring correction. This is a slight increase from 2013–14 (9,697 issues, requiring 93,284 corrections).
MAKING IT EASIER – MOVING OUR PARTNER AGENCIES TO AUSTRAC INTELLIGENCEWe have 42 memorandums of understanding (MOUs) with our domestic partner agencies that provide a framework for the access and use of our information.
This year we began reviewing these to facilitate access to our new financial intelligence data system, AUSTRAC Intelligence (AI), which will replace TES. AI was successfully trialled with NSW Crime Commission, NSW Police and the ATO this year to test the infrastructure and connectivity.
AI will be available to each of our partner agencies upon signing a new MOU. The MOUs will reflect AI’s enhanced capability and include strengthened provisions relating to how and why partner agencies use our data.
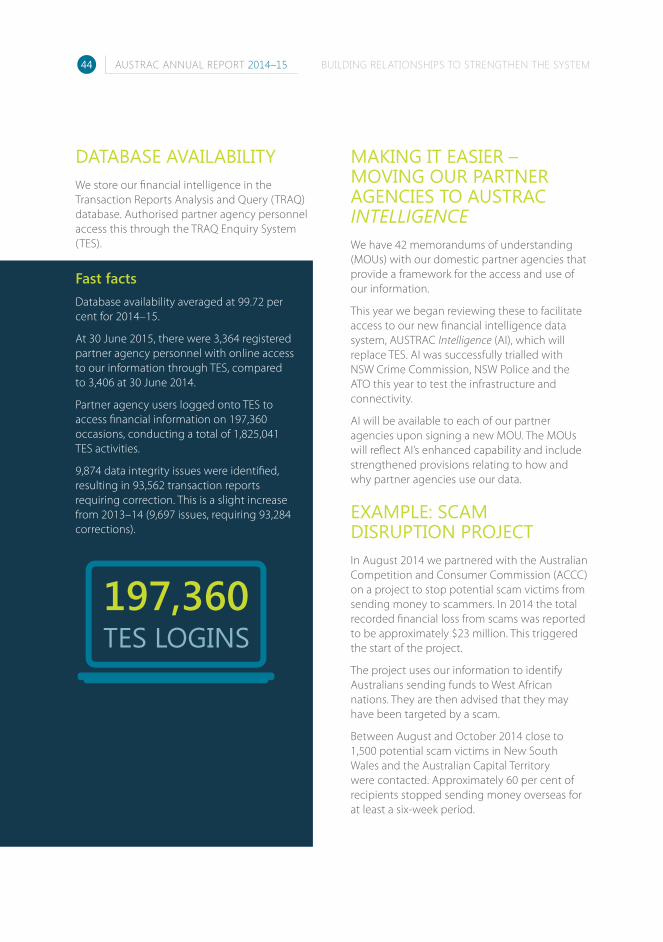
EXAMPLE: SCAM DISRUPTION PROJECTIn August 2014 we partnered with the Australian Competition and Consumer Commission (ACCC) on a project to stop potential scam victims from sending money to scammers. In 2014 the total recorded financial loss from scams was reported to be approximately $23 million. This triggered the start of the project.
The project uses our information to identify Australians sending funds to West African nations. They are then advised that they may have been targeted by a scam.
Between August and October 2014 close to 1,500 potential scam victims in New South Wales and the Australian Capital Territory were contacted. Approximately 60 per cent of recipients stopped sending money overseas for at least a six-week period.
197,360TES LOGINS
373DHS cases
Our info contributed to:$5.5millionin savings
Resulting in:
16,038ATO cases
Our info contributed to:$466millionin debt collection
Resulting in:
93,137SMRs/SUSTsdistributed
21%increase onlast year

AUSTRAC ANNUAL REPORT 2014–15BUILDING RELATIONSHIPS TO STRENGTHEN THE SYSTEM 45
EXAMPLE: PROJECT WICKENBYFrom 2006–15 we were involved in the cross-agency Project Wickenby taskforce, led by the ATO. Project Wickenby aimed to prevent people from promoting and participating in the abusive use of tax secrecy jurisdictions.
We analysed and disseminated financial transaction reports to Project Wickenby partner agencies to assist them to investigate and prosecute criminal activity, including tax evasion.
Our contribution included watching for patterns in money flows. Our analysis of funds flows to jurisdictions of risk – including tax havens –detected shifts in financial activity that allowed us to identify new destinations for funds – such as hubs – and identify emerging destinations for routing transactions.
One of the effectiveness measures for Project Wickenby was decreased funds flows to, and increased funds flows from, the 13 tax secrecy jurisdictions of interest to the taskforce. In 2014–15 our ongoing analysis of international funds flows between Australia and these secrecy jurisdictions showed:
• overall, global funds flows increased compared to the previous five years
• the net value of funds flowing into Australia from tax secrecy jurisdictions was $5 billion (incoming transfers worth $75 billion, outgoing transfers worth $70 billion).
From the reduction in outgoing funds flows, it is clear that individuals and entities who previously used these secrecy jurisdictions to avoid their tax obligations are abandoning these jurisdictions.
We continue to monitor the number of Australian entities transacting with the 13 tax havens.
At 30 June2015, Project Wickenby has recouped $985.67 million, including:
• $372.60 million in improved voluntary compliance
• $607.51 million in cash collections
• $5.56 million in other money recouped under proceeds of crime.
There have also been 76 people charged with indictable offences and 46 convictions.
The project concluded in June 2015. The total government investment was $507 million.
The Commonwealth’s approach to dealing with tax haven abuse and broader serious financial crime will continue the Serious Financial Crime Taskforce, with $128 million in funding over four years.
For more information on Project Wickenby refer to the ATO website.

AUSTRAC ANNUAL REPORT 2014–15 FEATURE: NATIONAL TASKFORCE ELIGO46
The Eligo National Taskforce is a special investigation into the misuse of remittance and informal value transfer systems by serious and organised crime.
The taskforce comprises the AFP, AUSTRAC and the ACC, in partnership with the Department of Immigration and Border Protection and state and territory police.
Our role involves:
• providing financial intelligence to identify money laundering risks in the remittance sector and identify targets for criminal investigation
• leading engagement with industry (particularly major banks and the remittance sector)
• using our regulatory powers to secure the compliance of high-risk remitters, and take reviewable decision actions to deal with remittance providers that pose a significant ML/TF risk.
In 2014–15 we:
• referred 39 SMRs to partner agencies
• distributed
• 40 financial intelligence reports to the Eligo Taskforce
• 9 data mining information reports.
FEATURE: ELIGO NATIONAL TASKFORCE

AUSTRAC ANNUAL REPORT 2014–15FEATURE: NATIONAL TASKFORCE ELIGO 47
The following two case studies are excerpts from the AUSTRAC typologies and case studies report 2014. They are examples of our involvement in Eligo Taskforce.
SUSPICIOUS MILLION DOLLAR TRANSFERS UNDID MAJOR METHAMPHETAMINE OPERATIONMultiple law enforcement agencies worked together to dismantle a major drug syndicate operating in Australia and Vietnam. The investigation uncovered one of the most elaborate methamphetamine operations in Victoria’s history and led to the arrest of eight suspects.
AUSTRAC information detailed international funds transfers undertaken by the syndicate.
Law enforcement targeted the drug syndicate after monitoring the financial activity and assets belonging to the suspects, most of whom were operating from Vietnam.
Analysis of AUSTRAC information by law enforcement showed that over a 12-month period, approximately $24 million was sent via international funds transfer instructions (IFTIs) to Vietnam. All IFTIs were paid for entirely with cash. The syndicate mainly used remittance dealers to send the outgoing IFTIs. Law enforcement also believed that the individuals sending the funds were using false driver licences and credit cards.
The syndicate was the subject of 53 SMRs. The majority of these were submitted by the remittance providers facilitating the outgoing IFTIs to Vietnam. The grounds for suspicion mainly related to the large amounts of cash possessed by the network and the transfer of funds to common beneficiaries in Vietnam.
Banking institutions also submitted four SMRs related to the syndicate, with the nominated grounds for suspicion including suspicious cash activity undertaken by the syndicate members, including apparent ‘structuring’ of account deposits and withdrawals. The SMRs noted that some of the beneficiary customers in Vietnam shared the same address and the large amounts of cash sent by the syndicate were inconsistent with the stated occupations of many of its members.
Eight members of the syndicate were arrested and charged with trafficking a large commercial quantity of methamphetamine. They were remanded in custody.
AUSTRAC ANNUAL REPORT 2014–15 FEATURE: NATIONAL TASKFORCE ELIGO48
INTERNATIONAL CRIME SYNDICATE USED UNDERGROUND BANKING TO LAUNDER MASSIVE DRUG PROFITSAUSTRAC assisted an investigation which disrupted a global crime syndicate involved in money laundering and the importation of more than 30 kilograms of methamphetamine into Australia.
Three suspects were arrested and charged with importing a commercial quantity of a border controlled drug.
The syndicate operated a ‘hawala’-type remittance system with cells based in Australia, the United Arab Emirates (UAE) and Nigeria. The syndicate head was located in Lebanon.
The cells in Australia were headed by an Iranian national (suspect A) and an Iraqi-born Australian citizen (suspect B). The head of the syndicate coordinated the distribution of cash payments from drug trafficking networks operating in Australia to suspects A and B.
Suspect A operated a business in the Iranian community facilitating the immigration of Iranians to Australia and other countries. Most of suspect A’s financial activity involved large cash deposits (reported to AUSTRAC as TTRs) and regular incoming IFTIs from companies in Canada, Iran, Slovenia, the UAE and Turkey.
TTRs received by AUSTRAC showed that, over a six-year period, suspect A received $715,000 in large cash deposits, while $63,000 cash was withdrawn from bank accounts associated with the suspect. Over that same period, the suspect and his company were the beneficiary of 41 incoming IFTIs totalling $521,000.
Suspect A was also the subject of two SMRs submitted by a bank. The SMRs described the various activities observed that gave it grounds for suspicion:
• suspect A’s unusual account activity
• funds being sent to/received from high-risk jurisdictions
• large cash deposits made at different bank branches on the same day
• third parties making cash deposits into suspect A’s account.
Over a one-year period suspect B was the ordering customer for 56 outgoing IFTIs totalling $244,000. Suspect B sent the funds to approximately 38 overseas-based beneficiary customers in 12 different countries, with the top five countries being the United States, Lebanon, China, Luxembourg and Syria. All but six IFTIs were conducted through remittance dealers. Over the one-year period suspect B conducted multiple ‘same-day’ IFTIs, on the majority of occasions conducting the transactions through different remitters.

AUSTRAC ANNUAL REPORT 2014–15FEATURE: NATIONAL TASKFORCE ELIGO 49
Suspect B was also the subject of two SMR reports submitted by a bank, detailing the following activity:
1. Suspect B deposited cash into third-party bank accounts, with one beneficiary account holder identified to be an Iranian national without any work entitlements in Australia.
2. The suspect’s trading account received regular large cash deposits, which were followed by cheque withdrawals issued to third parties.
3. Suspect B’s mortgage account exhibited unusual transaction behaviour, being used for very large cash deposits and withdrawals (worth hundreds of thousands of dollars).
4. The suspect made many large cash deposits; behaviour which was inconsistent with the suspect’s claimed occupation as a shop assistant.
Law enforcement also investigated the activities of a third suspect, suspect C, because of his involvement with a suspected money launderer. Authorities believe that suspect C arranged to transfer $300,000 to Mexico using the unregistered remittance service provided by suspect B. Suspect B was not registered with AUSTRAC as a remittance service provider.
Suspect C was arrested as he was departing Australia on a flight to Mexico. In his possession was USD9500, AUD660, two diamonds valued at $50,000 each and casino chips valued at $170,000.
A search of the AUSTRAC database showed that suspect C had a gambling turnover of $11 million over a three-month period. Suspect C was also the subject of four SMRs, which detailed his unusual gambling activity and practice of making cash deposits in amounts just below the $10,000 reporting threshold. The suspect conducted multiple, same-day gambling-related transactions on a regular basis. The gambling-related transactions were in close succession, which suggested the suspect was undertaking a bare minimum of gambling in between transactions.
The three suspects were arrested and charged with importing a commercial quantity of a border controlled drug contrary the Criminal Code Act 1995. Suspect C was also charged with dealing in money or property valued in excess of $100,000, which is believed to be the proceeds of crime, contrary to section 400.4 of the Criminal Code Act 1995.

AUSTRAC ANNUAL REPORT 2014–15 BUILDING RELATIONSHIPS TO STRENGTHEN THE SYSTEM50
The international nature of money laundering and terrorism financing requires a coordinated global response.
We support Australia’s international obligations to combat and address money laundering, financing of terrorism and financing of proliferation of weapons of mass destruction. We are at the forefront of international efforts and our international relationships are critical in achieving our outcomes.
INTERNATIONAL VISITORSThis year we hosted delegations from Japan, Nepal, Brazil, Cambodia, New Zealand, Peru, Canada and the United States.
While visiting, foreign delegates learn from our experience and knowledge. These visits also assist to further build our awareness of international AML/CTF issues, frameworks and operations.
INTERNATIONAL FINANCIAL INTELLIGENCE EXCHANGESWe witnessed a significant increase in international exchanges from the previous financial year – 857 exchanges, up from 301 in 2013–14. This was largely due to our involvement in joint initiatives.
The involvement in targeted financial intelligence exchanges has increased the amount of intelligence referred to us, with more than 500 pieces of intelligence received. The remaining exchanges are from requests to AUSTRAC, or requests we made on behalf of our partners.
OUR PARTICIPATION IN INTERNATIONAL FORUMSWe work closely with international organisations and have an active role in several international forums. Within these forums, we are seen as the global leader and are members of several project teams.
We are active leaders in three key international forums.
Financial Action Task Force (FATF)The global policy-making body that sets standards and promotes effective implementation of legal, regulatory and operational measures for combating money laundering, terrorism financing and other threats to the integrity of the international financial system.
Australia is a founding member of FATF and we, along with our partner agencies, play an important role. We participate in mutual evaluations of FATF members AML/CTF regimes and have provided an assessor for the evaluation of the United States of America, which commenced in March 2015.
STRENGTHENING OUR INTERNATIONAL TIES

AUSTRAC ANNUAL REPORT 2014–15BUILDING RELATIONSHIPS TO STRENGTHEN THE SYSTEM 51
Asia/Pacific Group on money laundering (APG)A FATF style regional body for the Asia-Pacific region, committed to the effective implementation and enforcement of international AML/CTF standards, in particular, the 40 recommendations of the FATF.
Our CEO leads the Australian delegation to the APG meetings and our Deputy CEO, Corporate is a co-chair of its Mutual Evaluation Working Group. We provide staff to the APG to conduct mutual evaluations and review the evaluation reports of various jurisdictions. In 2014–15 we provided an assessor for the mutual evaluation of Sri Lanka and a reviewer for the mutual evaluation report of Samoa.
Egmont Group of Financial Intelligence Units (Egmont Group)The key international body working to improve international cooperation for better information exchange, training and sharing of expertise. We are a founding member of the Egmont Group.
Our Deputy CEO, Operations was the Oceania Regional Representative and a member of the Egmont Committee, the consultative body to the Egmont heads of financial intelligence units (FIU)s, for six years until January 2015.
We led the recommendations for implementation of the Egmont Group Strategic Plan 2014–17 in collaboration with our international colleagues. We contributed to the framework, and to the governance and structure aspects of the strategy, including the proposed structure for the Egmont Secretariat.
In addition, we play a key role in the International Supervisory Forum (ISF). This comprises the ‘five eyes’ countries – Australia, New Zealand, Canada, the United Kingdom and the United States. The role of the ISF is to provide a mechanism for the sharing of information and operational practices. It is intended to improve the cooperation between members in the fight against money laundering, terrorist financing and other financial crimes, as well as strengthen domestic and international compliance regimes.
Our participation in these forums provides us with the most effective means to influence international thinking and decision making. It has a significant impact on not only our domestic AML/CTF framework, but also directly on us as an agency.

AUSTRAC ANNUAL REPORT 2014–15 BUILDING RELATIONSHIPS TO STRENGTHEN THE SYSTEM52
EXCHANGE INSTRUMENTS WITH OTHER COUNTRIESIn 2014–15 we supported international law enforcement and security interests by entering into seven new international MOUs for the exchange of financial intelligence.
The new MOUs are with:
• Anguilla
• Bahrain
• Curacao
• Gibraltar
• Russia
• Saint Vincent and the Grenadines
• Turks and Caicos Islands
Our total number of international MOUs for the exchange of financial intelligence is now 77, in addition to two MOUs for the exchange of regulatory information with counterpart regulators.
Bahrain is the first MOU signed with a Gulf State.
These relationships are important because criminals do not respect borders. Developing relationships with our financial intelligence counterparts throughout the world helps to deliver a coordinated, international response to transnational threats, including terrorism financing.
The full list of countries we have exchange instruments with is available on our website.
Countries in blue have signed MOUs with AUSTRAC.

AUSTRAC ANNUAL REPORT 2014–15BUILDING RELATIONSHIPS TO STRENGTHEN THE SYSTEM 53
The following case study is available on our online case studies hub. It shows how our MOU with Colombia helped to dismantle an international drug syndicate.
AUSTRALIA AND COLOMBIA JOIN FORCES TO BRING DOWN INTERNATIONAL DRUG SYNDICATEAustralian law enforcement worked together with Colombian counterparts to dismantle an international drug syndicate with links to Thailand, Ecuador, Italy, USA and France.
AUSTRAC provided financial intelligence which showed the flow of funds between entities and enabled law enforcement to identify and link individuals not previously known to be associated with the drug syndicate. Australian and Columbian authorities coordinated the execution of search warrants arresting syndicate members.
They were charged and convicted of aiding and abetting the importation of a marketable quantity of drugs. They received sentences ranging from two-and-a-half years to eight-and-a-half years imprisonment.
Investigation outlineThe syndicate used couriers to smuggle drugs from Colombia and the United States into Australia. Authorities also believed the syndicate had drug trafficking links in Thailand and Ecuador.
Authorities identified five Australian suspects and one Colombia-based suspect involved in the syndicate. The Colombia-based suspect supplied the drugs for importation from Colombia to Australia.
Industry contributionAML reporting by two banks, a remitter and foreign exchange dealer assisted with the investigation.
AUSTRAC received an SMR from a currency exchange service. A customer informed staff at the foreign exchange service that he was travelling to Colombia. When staff suggested the customer should use a cash passport in Euro currency, the customer insisted on exchanging Australian dollars for Euros. The funds exchanged were below the transaction reporting threshold. This SMR assisted authorities identify a drug courier recruited by the syndicate.
AUSTRAC contributionAUSTRAC analysed the financial activities of several of the suspects and prepared financial intelligence assessments.
In total, more than 360 AUSTRAC transaction reports were relevant to the investigation, consisting of:
• 270 IFTIs
• 90 TTRs
• one SMR.
Analysis of the IFTIs linked a number of Australian suspects and confirmed links to the Colombia-based suspect. AUSTRAC information showed that over a four-year period the Columbia-based suspect was the beneficiary customer of 44 IFTIs totalling $214,000, sent via two banks and a remitter. The funds were sent from a number of Australian accounts belonging to entities in Victoria and New South Wales. The IFTIs were sent to bank accounts held by the suspect in Thailand, Colombia, Italy and France, usually in amounts between $8,000 and $8,500.

AUSTRAC ANNUAL REPORT 2014–15 BUILDING RELATIONSHIPS TO STRENGTHEN THE SYSTEM54
AUSTRAC also received a TTR detailing how one suspect exchanged $11,000 for United States dollars at a foreign exchange service on the day she departed Australia for the United States. Authorities identified that the suspect was recruited as a ‘drug courier’ by a syndicate member. The suspect travelled to the United States and returned to Australia having internally concealed 140 grams of methamphetamine. The suspect was paid $11,000 for her ‘courier services’.
AUSTRAC information also showed that during the month prior to the importation of drugs from the United States one syndicate member sent three outgoing IFTIs totalling $10,000 to two beneficiaries in the United States. The IFTIs ranged in value from $200 to $8,000 and were sent via a bank and remittance services.
Authorities analysed AUSTRAC information and established that syndicate members used associates and family members to send international transfers in structured amounts to accounts in Colombia, Thailand and the United States. While some outgoing IFTIs were sent by associates and family members using false names, the majority were sent using their real names. The outgoing IFTIs ranged in value from $200 to $5,000 and were sent via banks and remittance services.
International cooperationAUSTRAC’s role as a financial intelligence unit and its information exchange agreements were used to share financial intelligence with counterpart authorities in the United States. This information assisted authorities to confirm drug syndicate associations in the United States.
OutcomeIn a coordinated operation, Australian and Columbian authorities executed search warrants across a number of premises and arrested the syndicate members.
The suspects were charged and convicted of aiding and abetting the importation of a marketable quantity of drugs. They received sentences ranging from two-and-a-half years to eight-and-a-half years imprisonment.

AUSTRAC ANNUAL REPORT 2014–15BUILDING RELATIONSHIPS TO STRENGTHEN THE SYSTEM 55
Figure 1 – Activities in Australia
Figure 2 – Activities in Colombia
Drug couriers intercepted by law enforcement on arrival at an
Australian airport
AUSTRACForeign exchange dealer
submits SMR
Associates and family members
44 IFTIs totalling AUD214,000
Suspect F to travel to Columbia to collect drugs
from Suspect A
Meant to meet drug couriers
Suspect C
Organised couriers
Bene�ciaries in United States
United States
Drugs carried internally into Australia
Travels to United States to collect drugs and
then returns to Australia with drugs internally concealed
TIR detailing exchange of 11,000 for USD
Suspect E
Suspect D
Suspect B
ColumbiaSuspect A in
ColumbiaSuspect D in contact with
Suspect A via telephone to inform about suspect F's
travel arrangements
Australia
Accounts
Thailand
Columbia
United States
Australian accounts
IFTIs ranging from AUD200 to AUD5,000
Three IFTIs totalling AUD10,000
Columbia
France
Thailand
Italy
Accounts held bySuspect A
Suspect F travel to Columbia to meet suspect A and collect drugs
Suspect F is arrested by Colombian authorities trying to board a �ight
back to Australia with cocaine internally concealed
Suspect F Suspect DAustralia
IFITI for AUD1,000
Suspect A has telephone conversation with suspect D
Suspect A
Suspect A account
Thailand Colombia

AUSTRAC ANNUAL REPORT 2014–15 BUILDING RELATIONSHIPS TO STRENGTHEN THE SYSTEM56
INTERNATIONAL TECHNICAL ASSISTANCE AND TRAININGOur international technical assistance and training (TA&T) programs strengthen AML/CTF regimes within the Asia Pacific region by building global capacity to combat serious transnational and organised crime.
Australian AML/CTF operations benefit through the international counterpart FIUs’ enhanced ability to:
• receive and analyse financial intelligence on AML/CTF
• disseminate analysis findings to domestic and international stakeholders, including AUSTRAC.
Our TA&T programs have been running for 10 years and have positioned us as a global leader in technical assistance. We provide partners with in-country mentoring and tailored bilateral training workshops.
These programs complement the work of international organisations such as FATF, the World Bank, the IMF and the APG.
In 2014–15 we engaged in five programs of technical assistance in South-East Asia, South Asia and the Pacific regions.
In focus: Our relationship with IndonesiaWe have a close and long-standing relationship with our Indonesian counterpart, Pusat Pelaporan Dan Analysis Transaksi Keuangan (PPATK).
We have been sharing financial intelligence since 2004. This assists both Australia and Indonesia to combat serious crimes such as people smuggling and terrorism financing.
We provide assistance through the PPATK/AUSTRAC Partnership Program (PAPP), which is funded by the DFAT to the value of $1,583,354.59. It aims to strengthen the institutional capacity and governance frameworks of PPATK and other AML/CTF stakeholders and is delivered by two AUSTRAC officers out posted in PPATK’s headquarters in Jakarta.
In 2014–15 the PAPP assisted in the successful campaign to have Indonesia removed from the FATF monitoring list. We also helped to prepare Indonesia’s first National ML/TF risk assessment, which will be launched by the Indonesian President Joko Widodo later in 2015.
The outcomes and methodologies of the PAPP are subject to periodic and independent review, commissioned by DFAT. These reviews have assessed PAPP to be highly successful.
Operational collaboration has ranged across many crime types over the past three years, with a recent focus on terrorist financing. In 2015 we began an operational exchange to combat the financing of ISIL and enhance regional understanding of foreign terrorist fighter funds flows. This exchange involves four week placements of senior analysts from AUSTRAC and PPATK to the respective agency.

AUSTRAC ANNUAL REPORT 2014–15BUILDING RELATIONSHIPS TO STRENGTHEN THE SYSTEM 57
The exchange of analysts helps to:
• facilitate rapid exchanges of high-quality intelligence between Australia and Indonesia
• produce detailed intelligence reports for dissemination to national law enforcement agencies in both Indonesia and Australia.
Find out more about our work to combat terrorism financing on page 61.
In addition, we run the Indonesian Alternative Remittance and Cash Couriers Program (IndoARCC). This is funded under the Australia-Indonesia Security Cooperation program for a total of $419,765 from 2014–16 and focuses on cash smuggling across borders.
We will continue to seek opportunities to work closely with our Indonesian partners to achieve outcomes of benefit to both agencies.
In focus: Our relationships in South Asia and South-East AsiaWe work closely with our partners in FIUs and corruption authorities in Thailand, Cambodia, the Philippines, Bangladesh, Nepal and Sri Lanka. We ran two DFAT funded TA&T programs in these regions in 2014–15.
Our Improving Governance in South-East Asia Program (IGiSEA) provided training to the FIUs, corruption authorities and AML regulators of Thailand, Cambodia and the Philippines.
The program focused on how financial intelligence can be used in cases of corruption, in line with FATF standards and the United Nations Convention against Corruption principles. The IGiSEA program will conclude in October 2015.
The Strengthening AML/CTF Regulation in South Asia (SARiSA) program aimed to strengthen:
• the AML/CTF supervision of securities and insurance sectors in Bangladesh, Nepal and Sri Lanka
• each country’s AML/ CTF regulatory regimes to detect and deter ML/TF risks that undermine the security of the region’s financial systems and markets.
The SARiSA program, which concluded in December 2014, saw:
• more than 600 people attend training workshops across the three years of the program, including 196 regulatory staff and 404 industry compliance officers
• the detection and reporting of suspicious transactions by capital market intermediaries and insurance companies in Sri Lanka and Bangladesh
• both the capital market and insurance regulators in Nepal issuing enforceable directives to industry, with our assistance
• the regulators in all three jurisdictions assessing industries under their supervision for money laundering risks to help inform their supervision response
• all regulators involved start AML/CTF supervision of their regulated community and update or write AML/CTF compliance manuals
• the Security Exchange Commission of Bangladesh establish a special money laundering unit to monitor the capital market intermediaries’ compliance
• all three jurisdictions able to show progress to FATF that they were addressing FATF Recommendation 23 on AML/CTF supervision, which assisted in each country being removed from the FATF International Cooperation Review Group.

O4PROTECTING THE NATIONAL INTEREST

wE COLLABORATE wITH INDUSTRY AND GOVERNMENT AGENCIES IN AUSTRALIA AND
OVERSEAS TO DEVELOP ACTIONABLE FINANCIAL INTELLIGENCE. wE IDENTIFY THREATS AND
CRIMINAL ABUSE OF OUR FINANCIAL SYSTEM AND wE ACT TO PROTECT AUSTRALIA’S ECONOMY.

AUSTRAC ANNUAL REPORT 2014–15 PROTECTING THE NATIONAL INTEREST 60
As Australia’s FIU, we collaborate with industry and government agencies in Australia and overseas to develop actionable financial intelligence. We identify threats and criminal abuse of our financial system and we act to protect Australia’s economy.
We have a critical role in keeping our nation and its citizens safe from the scourge of organised crime and terrorism financing. We take this responsibility seriously and will always ensure that everything we do is focused on serving Australia’s national interests.
This year we saw an increasing demand for financial intelligence to support law enforcement, national security and revenue objectives. With Australia’s growing attention on terrorism threats, our focus on countering the financing of terrorism also increased.
EXAMPLE: USING PROFILING FOR TARGETING MONEY LAUNDERING AND OTHER CRIMINAL ACTIVITY This year we developed 24 financial activity profiles targeting:
• money laundering
• drug trafficking
• border risks
• other criminal activity.
11 of the 24 financial profiles were developed in collaboration with partner agencies. There were a total of 180 disseminations relating to financial profiling outputs.
These profiles have initiated or supported a number of partner agency investigations and contributed to several law enforcement outcomes, including:
• the disruption of a major drug trafficking syndicate and the seizure of over 80kg of methamphetamines
• the restraint of over $3.26 million in assets linked to proceeds of crime.
Fast factsWhat is profiling?
The art of financial profiling involves applying analytical techniques such as pattern recognition and modelling to AUSTRAC data. This allows us to identify parties or networks who may be involved in money laundering, terrorism financing, tax evasion, drug trafficking or other criminal activity.
Profiling financial characteristics of foreign terrorist fighters
We are a core member of a multilateral information sharing project on the financing of foreign terrorist fighters (FTFs) in Syria and Iraq.
Under the Egmont group, we are leading the South-East Asia region to develop a regional profile of financial characteristics of FTFs.
This profiling will allow us to provide advice to Australian law enforcement, national security and intelligence agencies and industry about indicators of terrorism financing in Australia and internationally.
wORKING FOR THE NATIONAL GOOD

AUSTRAC ANNUAL REPORT 2014–15PROTECTING THE NATIONAL INTEREST 61
We are a member of Australia’s multi-agency Terrorism Financing Investigations Unit (TFIU) and in October 2014 we formally became a part of the national counter-terrorism governance arrangements.
We provide ongoing financial intelligence input to counter-terrorism priorities, including investigations and operations by all national intelligence agencies. We have been monitoring more than 100 people of interest and keep our partner agencies informed about their financial activities.
Currently, the volume of terrorism financing in Australia is linked to the number of Australians travelling to join terrorist groups in Syria and Iraq. Australians travelling to fight in the region may fund their own activities or receive financial support from Australian sympathisers.
Today’s security environment features less sophistication in attack planning and execution. This greatly reduces the cost of materials and associated logistics. Most recent incidents in Australia have been directed or inspired by individuals, or undertaken by lone actors – attracting minimal costs.
Terrorism financing usually involves low-value transactions, making it difficult for authorities and industry to differentiate suspicious transactions from legitimate ones.
Any suspicious matter report (SMR) that meets certain criteria for terrorism financing suspicion is immediately investigated.
Of the 81,074 SMRs received in 2014–15, 536 were relevant to partner agencies’ terrorism investigations. Approximately 98 per cent of resulting referrals were investigated further by the TFIU or ASIO.
These reports had a total associated value of approximately $53 million, with a cash component of $11 million.
The values attributed to SMRs should not be viewed as the true cost of terrorism. SMR values can relate to single transactions, but also individuals’ financial activity over months or years. Since funds related to terrorism are often comingled or disguised within legitimate financial transactions, a significant amount of SMR value is potentially unrelated.
Terrorism financing SMRs can provide crucial intelligence about behaviour or patterns from a financial perspective. Changes in financial activity assist in detecting terrorism financing.
In addition to funding individual attacks and operations, terrorism financing helps establish and maintain terrorist groups, and sustains the networks connecting them. It supports the less violent or obvious aspects of a group’s operations, such as living expenses, travel, training, propaganda activities, and compensation for wounded fighters or the families of terrorists who have died.
Information from reporting entities can be crucial in terrorism financing investigations; however the number of SMRs is an indicator only. We cannot tell the relevance of the information provided until analysis or investigation is undertaken by us or our partner agencies. Any suspicious matter reported may provide a small but critical piece of a larger puzzle, irrespective of whether terrorism financing is noted as a reason on the SMR.
Find out more about SMRs on page 65–67.
In October 2014, we received additional funding which has allowed us to enhance our analysis of individuals suspected to be involved in terrorism or terrorism financing. This information provides unique insights into characteristics that are distinct to terrorism financing.
We are committed to significantly expanding the current understanding of terrorism financing and its implications for Australia. We will continue to work with government, law enforcement and industry as we work together to detect and disrupt terrorism threats.
COUNTERING TERRORISM FINANCING

AUSTRAC ANNUAL REPORT 2014–15 PROTECTING THE NATIONAL INTEREST 62
NATIONAL SECURITY OPERATIONS TEAMOn 11 September 2014, the Prime Minister and Attorney-General announced $20 million funding for AUSTRAC as part of the Government’s counter-terrorism measures for a safer Australia. As a result, we formed a dedicated National Security Operations (NS Ops) team.
We established NS Ops to produce tactical and operational financial intelligence analysis to:
• help prevent individuals who have departed Australia to fight overseas from receiving financial support
• identify opportunities to disrupt attempts to undertake terrorism
• detect financial activity relating to foreign conflict zones
• identify terrorism financing risk, including the misuse of reporting entities.
NS Ops produces tactical financial intelligence products and analysis to contribute to partner agency investigations. This year we have referred over 500 tactical intelligence products to partners relating to counter-terrorism financing (including SMRs).
NS Ops has out-posted officers with key partner agencies working on counter-terrorism investigations and coordination. Remaining NS Ops team members perform data analytics and produce narrative intelligence from within the agency, contributing to domestic and international operations.
Since September 2014, NS Ops have produced eight unique operational intelligence products for national intelligence community partners’ counter-terrorism operations.
GLOBAL CTF EFFORTSWe are also contributing to global efforts to understand the financing of Islamic State, including contribution to FATF initiatives and international engagement with key partners and multilateral forums.
Since August 2014, we have accompanied the Counter-Terrorism Ambassador to Turkey, the European Union and Indonesia to deepen relationships and foster operational information exchange. We also led Australian contribution to the FATF report: Financing of the terrorist organisation Islamic State in Iraq and the Levant.
We are the lead representative for Australia to the Anti-Daesh Coalition, Counter-ISIL Financing Group.
In focus: Bisotel Rieh cancellationIn late 2014 we cancelled the registration of remittance provider Bisotel Rieh Pty Ltd, an independent remittance provider that operated in Lakemba and Liverpool, NSW.
This action was taken after we determined that the continued registration of Bisotel Rieh may involve a significant terrorism financing risk. This was the first cancellation we enforced due to concerns about possible terrorism financing risk.
In summary the grounds for cancellation were:
• the risk that Bisotel Rieh may be involved in, or utilised for terrorism financing
• a failure to comply with the AML/CTF Act.
Given the seriousness of the evidence, we saw the need to move quickly. On 26 September 2014 we advised Bisotel Rieh of our proposal to cancel its registration and offered 28 days to make a submission on why the cancellation should not proceed.
After considering the submissions presented by Bisotel Rieh, we remained sufficiently concerned that the continued registration of Bisotel Rieh may involve a terrorism financing risk. We cancelled their registration on 10 November 2014.

AUSTRAC ANNUAL REPORT 2014–15PROTECTING THE NATIONAL INTEREST 63
Ensuring that the AML/CTF Act and Rules contribute to the disruption of money laundering and terrorism activity is critical. We provide advice on technical amendments to the AML/CTF Act to enhance the administration and operation of the legal framework.
MUTUAL EVALUATION OF AUSTRALIA’S AML/CTF REGIMEIn April 2015 the FATF released a mutual evaluation report (MER) on Australia. It assessed Australia’s compliance against the international standards and the effectiveness of our AML/CTF regime.
At a high level, the report notes that Australia has a mature and sophisticated AML/CTF regime and a well-developed legal and institutional framework.
The report also highlighted areas that warrant our attention, including:
• the scope of industries that have AML/CTF responsibilities
• the extent of information held and available in relation to beneficial ownership
• the comprehensiveness of some of Australia’s laws that prevent money laundering and terrorism financing.
The release of the MER of Australia coincided with the statutory review of the AML/CTF regime The review takes into account the findings in the MER with a number of recommendations made to align more closely with the FATF standards.
REVIEW OF THE AML/CTF REGIMEAGD commenced the statutory review of the AML/CTF Act, regulations and AML/CTF Rules (AML/CTF regime) in December 2013. The review aims to ensure the operations of the regime remain effective and efficient, and the policy objectives stay relevant in a changing national and global environment.
The review of the AML/CTF regime provides a unique opportunity for us to explore ways to:
• reframe how our information is used, to maximise its use in combating and disrupting money laundering, terrorism financing and serious crime
• enable greater collaboration with our partner agencies and the private sector
• provide industry with greater clarity and certainty about their obligations and, where possible, simplify the regulatory regime
• enhance our compliance and enforcement toolkit
• enhance the scope of the regime to address deficiencies identified in the MER, such as the non-regulation of designated non-financial business and professions (for example, real estate agents, jewellers, high value dealers, trust and company service providers, accountants and lawyers).
MAINTAINING A STRONG AML/CTF REGIME

AUSTRAC ANNUAL REPORT 2014–15 PROTECTING THE NATIONAL INTEREST 64
Consultation with industry has highlighted a range of ideas and perspectives. In 2014–15 we worked closely with AGD to:
• assess more than 80 written submissions received from industry and government stakeholders
• participate in more than 25 roundtable meetings with industry and partner agency stakeholders, and representatives of not-for-profit organisations and privacy interest groups
• develop a draft report for further consultation with stakeholders in the second half of 2015.
The review is being conducted in the context of the government’s deregulation agenda, and minimising the compliance burden on industry is important. The report of the statutory review will be submitted to government in the first half of the 2015–16 financial year.
ONGOING DEVELOPMENT OF AML/CTF RULESWhen developing AML/CTF Rules, we consult extensively with industry, partner agencies, AGD, other areas of government, and public interest groups.
We release draft AML/CTF Rules on our website generally for a four-week consultation period, except those dealing with minor technical amendments. Notifications of draft AML/CTF Rules are published in E-news and are also emailed to interested stakeholders who have subscribed to receive updates.
In 2014–15 we registered 14 AML/CTF Rules relating to matters including:
• Rules for the renewal of registration on the Remittance Sector Register (including a new Chapter 70)
• continuing the exemption for registered remittance network providers and their registered remittance affiliates from compliance reporting obligations (amending Chapter 11)
• credit card issuers or acquirers who are not an authorised deposit-taking institution, bank, building society or credit union (including a new Chapter 71)
• the introduction of the AUSTRAC Industry Contribution (amendments to Chapters 63 and 65).
We also published:
• guidance on the Document Verification Service in April of 2015 as part of the AUSTRAC Compliance Guide. This was previously published for public consultation in October 2014, as a Draft guidance note: The Document Verification Service and individual customer and beneficial owner identification
• draft guidance on the key terms used in the ‘politically exposed person’ definition in the AML/CTF Rules. This was released for the first round of public consultation in January 2015.
ADVICE ON IDENTIFIED LAW IMPROVEMENTS PROVIDED TO GOVERNMENTWe provide timely and quality advice on proposed law improvements. In 2014–15, we provided advice to government resulting in technical amendments to the AML/CTF Act and the FTR Act, including:
• amending the secrecy and access provisions of the AML/CTF Act to assist the ATO in its data-matching functions
• prescribing new designated agencies, such as the Independent IBAC of Victoria
• realigning the framework to accommodate the AUSTRAC industry contribution
• repealing the account blocking provisions of the FTR Act.

AUSTRAC ANNUAL REPORT 2014–15PROTECTING THE NATIONAL INTEREST 65
Our role as Australia’s AML/CTF regulator is to improve, and where necessary enforce, the adoption by reporting entities of policies, practices, systems and controls designed to:
• protect the financial system from criminal abuse
• enable them to identify, collect and correctly report transactions.
This year we received a total of 96,369,657 transaction reports – a 5.74 per cent increase on last year.
These transaction reports are used to assist law enforcement investigations. Find out more in our case studies on pages 47–49 and 53.
SUSPICIOUS MATTER REPORTS AND SUSPECT TRANSACTION REPORTSA key source of information for our financial intelligence is suspicious matter reports (SMRs) from our partners in industry.
Reporting entities must submit SMRs to us when suspicion is formed ‘on reasonable grounds’. Entities must submit SMRs within three days of forming the suspicion, or within 24 hours if related to suspected terrorism financing. Similarly, cash dealers are required to submit suspect transaction reports (SUSTRs).
In 2014–15 we received 81,074 SMRs/SUSTRs – an increase of 16,998 (21 per cent) on last year. We received a significant increase in SMRs from the remittance sector, specifically RNPs.
We received a number of SMRs that suggested individuals may be about to travel to Syria or Iraq to fight with extremist groups. These SMRs were disseminated to law enforcement and contributed to existing intelligence holdings or new lead generation.
This year we saw an increase in the total number of SMR/SUSTRs. We suspect this is largely due to the effectiveness of our intelligence publications, as well as increased media coverage of terrorist activities, leading to awareness of reporting obligations.
CONTRIBUTION FROM OUR REPORTING ENTITIES
2014-152013-14
2012-13
81,074
64,076
44,062
Trend analysis – SMR/SUSTR reporting volumes


AUSTRAC ANNUAL REPORT 2014–15 PROTECTING THE NATIONAL INTEREST 68
THRESHOLD TRANSACTION REPORTS AND SIGNIFICANT CASH TRANSACTIONS
If a reporting entity provides a service involving the transfer of $10,000 or more, they must submit a threshold transaction report (TTR).
TTRs were introduced in December 2008 under the AML/CTF Act. For most entities, TTRs replaced significant cash transaction reports (SCTRs) submitted under the FTR Act.
In 2014–15 we received a total of 4,694,287 TTRs and SCTRs. This is a decrease of 414,599 (8.8 per cent) on last year, which is consistent with previous years. The effectiveness of our education campaigns has resulted in increased understanding of reporting obligations, resulting in reporting entities submitting TTRs more appropriately.
Of these:
• 2,650,581 were from major banks
• 237,128 were from other banks
• 1,806,578 were from other cash dealers.
INTERNATIONAL FUNDS TRANSFERS
If a reporting entity sends or receives an instruction to or from a foreign country, to transfer money or property, the reporting entity is required to submit an international funds transfer instruction (IFTI) report.
In 2014–15 we received a total of 91,423,681 IFTI reports. This is an increase of 5,602,257 (six per cent) on last year, which is consistent with previous years. This is likely due to improvements in technology which make it easier to send money around the world.
The total dollar value of these was $4,610,474,446,863.06 (an average of $50,664.92 per instruction).
Of these:
• 12,287,117 were from major banks
• 3,435,020 were from other banks
• 75,701,544 were from other cash dealers.
CROSS-BORDER MOVEMENT OF PHYSICAL CURRENCY
Cross-border movement of physical currency (CBM-PC) reports are submitted when currency of $10,000 or more is carried, mailed or shipped into or out of Australia. Reports are completed at the first Customs examination area upon entry into Australia or before leaving Australia.
In 2014–15 we received 48,272 CBM-PC forms.
CROSS-BORDER MOVEMENT OF BNIs
Persons entering or leaving Australia who are carrying bearer negotiable instruments (BNIs) must complete Cross-border movement of bearer negotiable instrument (CBM-BNI) reports if asked to by a Customs or police officer.
In 2014–15 we received 692 CBM-BNI forms.

AUSTRAC ANNUAL REPORT 2014–15PROTECTING THE NATIONAL INTEREST 69
Trend analysis – TTR/SCTR reporting volumes
Trend analysis – IFTI reporting volumes
Trend analysis – CBM-PC reporting volumes
Trend analysis – CBM-BNI reporting volumes
2014-152013-14
2012-13
4,694,287
5,210,418
5,224,751
2014-152013-14
2012-13
91,423,681
85,821,424
79,334,421
2014-152013-14
2012-13
48,272
39,720
30,725
2014-152013-14
2012-13
692
668
655

AUSTRAC ANNUAL REPORT 2014–15 PROTECTING THE NATIONAL INTEREST 70
AML/CTF PROGRAMSReporting entities must have an AML/CTF program to establish an operational framework to meet compliance obligations.
An AML/CTF program should specify how the reporting entity identifies, mitigates and manages the risk of its products or services being misused to facilitate money laundering or terrorism financing.
This year 96.7 per cent of reporting entities reported they had implemented a compliance program (a slight increase from 96.38 per cent last year).
ANNUAL SUPERVISORY PROGRAMIn 2014–15 the annual supervisory program monitored the compliance of reporting entities with obligations under the AML/CTF Act through:
• compliance assessments
• monitoring of corrective measures addressing compliance issues
• managing and undertaking formal interactions.
This year we focused on detailed assessment work to determine the effectiveness of entities’ processes and procedures to identify, manage and mitigate ML/TF risk.
Our compliance assessment activities arose from:
• identified non-compliance with AML/CTF Act obligations
• self-disclosure by reporting entities
• ML/TF risk
• external factors, such as partner agency requests.
We completed 100 assessments of entities identified on this basis, equating to 96 per cent of planned assessments in supervisory programs (exceeding the 95 per cent target). These included behavioural reviews, desk reviews and onsite assessments.
We aim to engage every high-risk reporting entity group at least once every three years. A target coverage ratio was established to measure the proportion of high-risk reporting entity groups we assess. This year the target coverage ratio was 45 per cent – an increase from the 40 per cent we have targeted in previous years.
We undertook data analysis to detect entities:
• that were not reporting
• whose reporting behaviour varied significantly from previous periods, or
• whose reporting behaviour was irregular when compared to industry peers.
We evaluated these entities and issued compliance assessment reports where concerns were identified. This included 46 compliance assessment reports with findings related to transaction reporting obligations for reporting entities to rectify.
At 30 June 2015, we had:
• issued a total of 72 compliance assessment reports requiring reporting entities to take remedial action for significant non-compliance
• issued 285 findings (including remediation requirements)
• made 162 recommendations to improve the robustness of AML/CTF programs.
The majority of compliance assessment reports requiring remedial action have now been rectified or are in the process of being rectified.
We also issued 12 notices of reviewable decisions relating to the registration of remittance providers, including concerns about transaction reporting.

AUSTRAC ANNUAL REPORT 2014–15PROTECTING THE NATIONAL INTEREST 71
APPLICATIONS FOR EXEMPTIONS AND MODIFICATIONSIn certain circumstances, our CEO may grant an exemption or modification from specified provisions of the AML/CTF Act. Exemptions and modifications may be granted to address an unintended or overly burdensome impact of the AML/CTF Act.
Decisions regarding the issuing of exemptions and modifications are based on the circumstances of each application and will only be issued where:
• we have the power to do so
• it will not compromise the integrity of Australia’s AML/CTF regime.
Careful consideration is given to issues of ML/TF risk, transparency, equity and competitive neutrality in issuing exemptions.
In 2014–15, we received 16 applications for exemption or modification. Of these, seven were granted, three were refused and six were invalid or withdrawn.
RISK PROFILINGWe apply more regulatory effort to supervise entities that provide services and products that have higher exposure and vulnerability to ML/TF risk. This approach aligns with FATF recommendations to regulate entities on a risk basis and at a corporate group level.
Four factors are taken into account in determining the ML/TF risk profile of reporting entity groups:
1. Whether the reporting entity group operates in an industry identified as a major or significant channel for money laundering.
2. The exposure of a reporting entity group to ML/TF risk. For example, larger reporting entity groups have relatively more customers and typically provide more complex products using multiple distribution channels in multiple jurisdictions. They are also relatively more important to the overall integrity of Australia’s financial system.
3. Special interest our Intelligence branch has in particular reporting entity groups or industry sectors.
4. Specific interest partner agencies have in particular reporting entity groups.
ENFORCEMENT OUTCOMESWe work with our partners in industry to safeguard our economy. If a breach occurs we look to see it was because of ignorance or wrongdoing in the first instance. Most reporting entities are doing the right thing and meeting their obligations.
If a high ML/TF risk entity is shown to have inadequate policies, practices, systems and controls in place to address its risk, the entity is prioritised for remediation or enforcement action. When the evidence supports action, we will use the full force of our powers.
Some significant outcomes from 2014–15 include:
• an Infringement Notice for $10,200 paid by ClassicBet Pty Limited for failing to enrol within the required time period
• a Remedial Direction issued to ClassicBet requiring it to appoint an external auditor to conduct an ML/TF risk assessment and develop a compliant AML/CTF program
• a written Notice (s162) issued to Canberra Southern Cross Club requiring the appointment of an external auditor to audit its compliance with its AML/CTF obligations.
In focus: MoneyGramThis year we also issued a record fine to one of the world’s largest remittance network providers for systemic contraventions of Australia’s AML/CTF laws.
MoneyGram Payment Systems Inc. paid a $336,600 infringement notice in May 2015 for providing money remittance services through unregistered remittance businesses. This followed a fine of $122,400 in January 2015 for the same type of contraventions, bringing the total to almost half a million dollars.
Both infringement notices arose from a compliance assessment in 2014.

O5MANAGEMENT AND ACCOUNTABILITY

wE ARE DETERMINED TO PROVIDE THE SERVICES AND PRODUCTS THAT INDUSTRY AND OUR GOVERNMENT PARTNERS EXPECT OF US.

AUSTRAC ANNUAL REPORT 2014–15 MANAGEMENT AND ACCOUNTABILITY74
Developing the capability of our people is a key focus from our change program. We are determined to provide the services and products that industry and our government partners expect of us.
Our effectiveness as a national and global leader in AML/CTF is underpinned by having skilled, motivated and supported people and the right systems and processes in place.
FOCUSING ON OUR WORKFORCEOur people are our most valuable resource. In December 2014 we conducted a national all-staff survey. The results from the survey identified five key areas for us to focus on:
• leadership
• communication
• people
• culture
• governance.
The Senior Executive group developed an action plan to address these key areas, which is updated monthly for staff to see and make comments on the progress made.
We will conduct another national staff survey at the end of 2015.
WORKPLACE DIVERSITY AND DISABILITY This year we continued to implement the 2013–17 diversity plan. Staff in Sydney, Canberra, Melbourne and Brisbane participated in Harmony Day, Reconciliation Day and the National Aboriginal and Islanders Day Observance Committee (NAIDOC) Week.
We continued to review our reconciliation action plan and made good progress on the development of our disability action plan. Next year we will develop and implement an indigenous employment strategy.
The Commonwealth Disability Strategy has been overtaken by the National Disability Strategy 2010–2020, which sets out a 10-year national policy framework to improve the lives of people with a disability, promote participation and create a more inclusive society.
A high-level two-yearly report will track progress against each of the six outcome areas of the strategy and present a picture of how people with disability are faring. These reports are available on the Department of Social Services website.
OUR PEOPLE

AUSTRAC ANNUAL REPORT 2014–15MANAGEMENT AND ACCOUNTABILITY 75
LEARNING AND DEVELOPMENTWe continued to implement the 70:20:10 leadership development program. This approach combines on-the-job and relationship-based learning, with face-to-face and e-learning.
We increased our e-learning options and provided an increased number of programs, including several compulsory training sessions.
We spent $408,171 on learning and development for employees. This included financial support of $39,907 for 20 employees enrolled in tertiary studies as part of our studies assistance scheme. The total number of hours committed for study leave as part of the scheme was 1038.8 hours (or 140 days), with an average of seven days per employee who studied.
We provided a total of 1,167 days of learning and development (both internal and external) to employees. This was an average of four and a half days per employee.
We will be developing our learning and development strategy in 2015–16. This will support a more targeted and focused approach to address identified skills gaps and capability development within the agency.
PERFORMANCE MANAGEMENTAll employees are required to participate in the agency’s performance management program.
We conducted training in core skills performance management development supporting further skill development by staff at all levels and ensuring a consistent approach to performance management across the agency.
To make this process easier for staff, we will move to an automated workflow system for the 2015–16 cycle.
ENTERPRISE AGREEMENTS, IFAs, DETERMINATIONS, COMMON LAW CONTRACTSAt 30 June 2015 enterprise bargaining was progressing to replace the current Enterprise Agreement, which covers 268 employees.
The use of section 24(1) determinations is limited to setting the remuneration and conditions for SES employees. Nine SES section 24(1) determinations are in operation and provide remuneration and conditions for those employees.
Since the implementation of the Enterprise Agreement on 3 May 2012, individual flexibility arrangements (IFAs) have been used in place of section 24(1) determinations for the purpose of supplementing the benefits or remuneration provided to non-SES employees. These arrangements are agreed between the employee and the CEO or delegate. As at 30 June 2015 there are 43 IFAs, with the majority relating to salary arrangements.
No employees were covered by common law contracts this year.

AUSTRAC ANNUAL REPORT 2014–15 MANAGEMENT AND ACCOUNTABILITY76
The AUSTRAC Service Charter outlines the standards of service that you can expect from us. We achieved our target response times during normal business periods, ensuring that phone enquiries were answered at point of call and email enquiries were answered within 48 hours. There were several peak periods, related
to the lodgement of compliance reports, where the target response times were not achieved due to the increased volume of calls.
This year our contact centre received 9,567 calls – an average of 51 calls per day. We also received 9,073 email enquiries.
SERVICE CHARTER
PRIVACY, SECURITY, INTEGRITY AND FRAUDPRIVACYIn 2014–15 we continued to ensure all employees were aware of their obligations under the Privacy Act 1988 (Privacy Act). We also held AUSTRAC Privacy Consultative Committee meetings, which allow our CEO to consider privacy issues in performing his functions. This committee includes external representation of civil society.
Since the 2014 privacy reforms our Privacy and Information Access team continued to support AUSTRAC staff with their privacy obligations by implementing:
• revised privacy e-Learning, which is mandatory for all staff
• providing further guidance materials available to all staff
• participating in Privacy Awareness Week coordinated by the Office of the Australian Information Commissioner.
The internal audit team conducted a review of our privacy practice. The review found that we comply with the reforms to the Privacy Act arising from the provisions of the Privacy Amendment (Enhancing Privacy Protection) Act 2012. This includes how our obligations interact with, and impact on, other enabling legislation.
We continued to participate in workshops, surveys and privacy network meetings facilitated by the Office of the Australian Information Commissioner and the Australian Government Solicitor.
No reports were served, determinations made or other action taken against us under the Privacy Act. We sought no public interest determinations from the Privacy Commissioner under the Privacy Act.
SECURITYWe are committed to applying security principles to ensure the effective delivery of programs and the secure conduct of government business.
AUSTRAC ANNUAL REPORT 2014–15MANAGEMENT AND ACCOUNTABILITY 77
We apply the Commonwealth’s Protective Security Policy Framework (PSPF) to protect our people, information and assets. This year we implemented the Australian Signals Directorate’s (ASD) Top 4 strategies to mitigate targeted cyber intrusions, which ensured we were fully compliant with the mandatory requirements of the PSPF.
We have been selected by the Australian National Audit Office (ANAO) to undergo a Cyber Security Performance Audit. This will assess our compliance with ASD’s mandatory ICT security strategies and related controls in the Australian Government Information Security Manual. The results are due to be tabled in parliament in the Spring sitting.
When the national terrorism public alert level was raised to ‘high’ on 12 September 2014, we reviewed our security risks and implemented new controls, including:
• increasing staff awareness to be alert to and report suspicious behaviour
• enhancing mail security measures
• engaging with local police and security providers
• reviewing and updating business continuity plans and measures
• reviewing and updating emergency procedures.
OUR INTEGRITY FRAMEWORKOur integrity is vital in maintaining the confidence of the Australian public, industry and domestic and international partners.
We have a well-developed integrity framework, underpinned by an honest, professional and fair workforce. This year our framework was strengthened by:
• collaborating with the Australian Commission for Law Enforcement Integrity and other Commonwealth law enforcement agencies on prevention and response measures
• completing a systematic assessment of fraud and corruption risks
• reviewing existing integrity-related controls and evaluating the effectiveness of current measures
• identification, categorisation and assessment of:
• agency systems and assets
• staff positions and teams
• indicators of inappropriate behaviour
• the effectiveness of existing controls
• meeting the reporting requirements of the Public Interest Disclosure Act 2013 and Law Enforcement Integrity Commissioner Act 2006.
FRAUD AND CORRUPTION CONTROLThe AUSTRAC CEO certifies that he is satisfied that AUSTRAC:
• has prepared a fraud and corruption risk assessment and a fraud control plan
• has in place appropriate fraud prevention, detection, investigation, reporting and data collection procedures and processes that meet the specific needs of the agency
• has taken all reasonable measures to minimise the incidence of fraud in the agency and to investigate and recover the proceeds of fraud against the agency.

AUSTRAC ANNUAL REPORT 2014–15 MANAGEMENT AND ACCOUNTABILITY78
Our CEO reports on the operations of the agency to the Attorney-General and the Minister for Justice, the Hon. Michael Keenan. Our transparency and accountability to the Parliament includes responding to questions on notice, publishing information under Senate Orders, and appearing before Parliamentary committees when required.
The Commonwealth Ombudsman, the Auditor-General or a Parliamentary committee did not issue any reports relating to AUSTRAC’s operations in 2014–15. There were no judicial decisions, decisions of administrative tribunals, or decisions by the Australian Information Commissioner that had, or may have, a significant impact on our operations.
EXTERNAL SCRUTINY
FREEDOM OF INFORMATIONINFORMATION PUBLICATION SCHEMEAgencies subject to the Freedom of Information Act 1982 (FOI Act) are required to publish information to the public as part of the Information Publication Scheme (IPS). This requirement is contained in Part II of the FOI Act and replaced a previous requirement for agencies to publish a ‘section 8’ statement in their annual reports.
Each agency must publish on its website a plan showing what information it publishes in accordance with IPS requirements. Our IPS, including our IPS Disclosure Log and IPS plan, is available at the IPS section of our website.
FREEDOM OF INFORMATION REQUESTSIn 2014–15 we received 105 freedom of information (FOI) requests for 24,966 pages.
We were fully compliant with the requirements of the FOI Act for 2014–15.
FOI requests and pages
Financial year
Requests received
Number of pages considered during the period
2014–15 105 24,966
2013–14 85 9,539
2012–13 89 5,581
2011–12 77 4,500
Further statistical information about FOI requests, including information about costs incurred, is published in the Freedom of Information Annual Report, which the Office of the Australian Information Commissioner is required to present to the Parliament, under section 93 of the FOI Act.

AUSTRAC ANNUAL REPORT 2014–15MANAGEMENT AND ACCOUNTABILITY 79
We continued to meet our obligations under the Environment Protection and Biodiversity Conservation Act 1999 by working towards implementing the targets of the Energy Efficiency in Government Operations policy.
OUR ENVIRONMENTAL PERFORMANCE

O6FINANCIAL PERFORMANCE


AUSTRAC ANNUAL REPORT 2014–15 FINANCIAL PERFORMANCE82
ANALYSIS OF FINANCIAL PERFORMANCEUnder section 43 of the Public Governance, Performance and Accountability Act 2013 (PGPA Act), AUSTRAC must include a copy of its audited financial statements and the Auditor-General’s report each year in its annual report.
Our financial statements have been prepared on an accrual basis in accordance with the Financial Reporting Rule and Australian Accounting Standards and are located in the Financial Statements section of this report on pages 86–139. As in previous reports, the Statement of Comprehensive Income relates to items of revenue and expenses where we are directly responsible for their administration and management.
In 2014–15 we produced a net operating deficit of $8.4 million, compared with a deficit of $4.2 million in 2013–14. The net operating deficit includes $8.0 million of unfunded depreciation and amortisation expenses.
Total revenue for 2014–15 was $59.3 million: a $2 million decrease over the previous year.
Our financial position at 30 June 2015 is shown in the Statement of Financial Position. This takes into account movements in assets, liabilities and equity. Total equity has decreased to $30.8 million in 2014–15 (2013–14: $36 million).
EVENTS OCCURRING AFTER BALANCE DATENo significant events have occurred after balance date which would have an effect on our ongoing structure and financial activities.
LEGAL EXPENDITUREThe total legal expenditure on legal services for the financial year ended on 30 June 2015 was $2,780,103.28 (exclusive of GST). In accordance with Office of Legal Services Coordination reporting requirements, this total expenditure includes the cost of providing internal as well as external legal services.
$930,374.99 (exclusive of GST) was spent on purchasing external legal services. $1,849,728.29 (exclusive of GST) was spent on purchasing internal legal services.
Prior to 2013–14, legal expenditure figures were reported inclusive of GST. For 2013–14 onwards, the Office of Legal Services Coordination requires legal expenditure to be reported exclusive of GST. This should be noted when comparing our legal expenditure to legal expenditure from years prior to 2013–14.
FINANCIAL MANAGEMENT

AUSTRAC ANNUAL REPORT 2014–15FINANCIAL PERFORMANCE 83
ASSET AND PROPERTY MANAGEMENTIn 2014–15 we managed and maintained approximately 6,097 m2 of leased office space for its Sydney, Melbourne and Canberra operations.
This year we completed the implementation of a multi-year strategy to rationalise our property management arrangements to better align with the Australian Government’s property management benchmark standards. This involved:
• a major fit-out of our Sydney office (funded by the building landlord under a new, reduced floor space, lease arrangement)
• concluding an existing arrangement for our Brisbane office.
The net effect of these changes resulted in progressively reducing our total national leased floor space profile by about 5.8 per cent, from approx. 6,450m2 to 6,097 m2, with 75 per cent of that leased space located outside CBD areas. We also improved the efficiency of our office design and reduced our overall annual property operating expenses.
Asset classes we maintained included furniture and fittings, ICT infrastructure and office equipment. The physical state of these assets has been validated through our annual asset stock take process. The most recent external valuation was conducted at 30 June 2014, and we have assessed that a three yearly update is appropriate to meet the fair value requirements imposed by Australian Accounting Standards.
ASSESSMENT OF PURCHASING AGAINST CORE POLICIES AND PRINCIPLESThe Public Governance, Performance and Accountability Act 2013 (PGPA Act) governs our use of Commonwealth resources and expenditure of public money.
Our procurement activities were supported by a dedicated Procurement and Contracts unit, which provided procurement and contracting strategic advice and support, and provided direct support to procurement projects.
We advertise an annual procurement plan on AusTender, which is reviewed and updated as required. Information relating to expenditure on contracts and consultancies is available on the AusTender website.

AUSTRAC ANNUAL REPORT 2014–15 FINANCIAL PERFORMANCE84
SUMMARY OF CONSULTANCY ARRANGEMENTS AND ENGAGEMENT POLICYWe engaged consultants where we requires specialist expertise or when independent research, review or assessment is required. Consultants are typically engaged to investigate or analyse a defined issue, carry out defined reviews or evaluations, or provide independent advice, information or solutions to assist in our decision making.
In 2014–15 decisions to engage consultants were made in accordance with the PGPA Act and related regulations, including our Accountable Authority Instructions and the Commonwealth Procurement Rules.
NEW AND ONGOING CONSULTANCY ARRANGEMENTSWe entered into 10 new consultancy contracts involving total actual expenditure of $517,846.60. In addition, four ongoing consultancy contracts were active during 2014–15, involving total actual expenditure of $492,205.44.
CONTRACTS AND CONSULTANCIES ON AUSTENDERInformation on the value of contracts and consultancies is available on the AusTender website.
EXEMPT CONTRACTSDuring 2014–15 AUSTRAC did not exempt any contracts valued more than $10,000 from publication on AusTender.
ANAO ACCESS CLAUSESWe entered into two contracts over the value of $100,000 that did not include a clause to provide the Auditor-General with access to the contractor’s premises.
CONSULTANTS, COMPETITIVE TENDERING AND CONTRACTING

AUSTRAC ANNUAL REPORT 2014–15FINANCIAL PERFORMANCE 85
Contracts over $100,000 not including Auditor-General access clauses
Entity nameContract value (inc. GST)
Contract purposeReason for standard access clause not included
DELV Pty Ltd $110,602.20Mobility Solution Software Service
Software contract utilised
ForgeRock identity platform
$139,196.37Provision of Software
Supplier contract utilised
INFORMATION AND COMMUNICATIONS TECHNOLOGY SERVICES MULTI-USE LIST We use an information and communications technology (ICT) services multi-use list to identify suppliers that can provide ICT support and to undertake development of new and existing ICT for the agency.
We advertised the ICT services multi-use list on AusTender and on our website, seeking applications from organisations and individuals who could provide appropriate expertise and skilled resources to meet the agency’s needs. We continue to achieve value-for-money outcomes through the ICT multi-use list, which has been extended until 9 June 2016.
ADVERTISING AND MARKET RESEARCHThere were no advertising campaigns undertaken during the 2014–15 reporting period.
We placed a number of recruitment advertisements during 2014–15, at a total cost of $77,638 (including GST), compared to $5,038 in 2013–14.
We engaged a direct marketing agency for the purposes of bulk email broadcasting and media monitoring. The cost of this service was $17,861 (including GST), compared to $7,920 in 2013–14.
SMALL BUSINESS CONTRACTSWe support small business participation in the Commonwealth Government Procurement Market. Small and Medium Enterprise (SMEs) and Small Enterprise participation statistics are available on the Department of Finance website.
Our procurement practices encourage competitive participation of SMEs in approaches to market through the use of standard documentation and conditions as well as non-complex offer processes. This ensures that SMEs can easily engage with us for business opportunities.

FINANCIAL STATEMENTS


AUSTRAC ANNUAL REPORT 2014–15 FINANCIAL STATEMENTS88

AUSTRAC ANNUAL REPORT 2014–15FINANCIAL STATEMENTS 89

AUSTRAC ANNUAL REPORT 2014–15 FINANCIAL STATEMENTS90

AUSTRAC ANNUAL REPORT 2014–15FINANCIAL STATEMENTS 91
STATEMENT OF COMPREHENSIVE INCOMEFOR THE PERIOD ENDED 30 JUNE 2015
Notes2015
$’0002014$’000
EXPENSES
Employee benefits 3A 32,885 33,155
Suppliers 3B 26,790 28,220
Depreciation and amortisation 3C 7,981 6,326
Losses from asset sales 3D 16 22
Write-down and impairment of assets 3E - 412
Total expenses 67,672 68,135
LESS:
OWN-SOURCE INCOME
Own-source revenue
Sale of goods and rendering of services 4A 4,167 8,029
Other revenue 4B 165 160
Total own-source revenue 4,332 8,189
Net cost of (contribution by) services 63,340 59,946
Revenue from Government 4C 54,959 53,142
Surplus (Deficit) attributable to the Australian Government (8,381) (6,804)
OTHER COMPREHENSIVE INCOME
Changes in asset revaluation reserves - 2,639
Total other income (loss) - 2,639
Total comprehensive income (loss) attributable to the Australian Government
(8,381) (4,165)
The above statement should be read in conjunction with the accompanying notes.
Australian Transaction Reports and Analysis Centre

AUSTRAC ANNUAL REPORT 2014–15 FINANCIAL STATEMENTS92
STATEMENT OF FINANCIAL POSITIONAS AT 30 JUNE 2015
Notes 2015$’000
2014$’000
ASSETSFinancial AssetsCash and cash equivalents 5A 1,818 1,714 Trade and other receivables 5B 13,884 14,200 Total financial assets 15,702 15,914
Non-Financial AssetsLand and buildings 6A,C 1,713 2,236 Property, plant and equipment 6B,C 9,588 11,891 Intangibles 6D,E 20,249 22,284 Other non-financial assets 6F 2,935 2,761 Total non-financial assets 34,485 39,172
Total assets 50,187 55,086
LIABILITIESPayablesSuppliers 8A 2,056 1,586 Other payables 8B 7,844 8,103 Total payables 9,900 9,689
ProvisionsEmployee provisions 9A 9,039 8,839 Other provisions 9B 448 514 Total provisions 9,487 9,353
Total liabilities 19,387 19,042 Net assets 30,800 36,044
EQUITYContributed equity 59,284 56,147 Reserves 3,994 4,083 Retained surplus (accumulated deficit) (32,478) (24,186)Total Equity 30,800 36,044 The above statement should be read in conjunction with the accompanying notes.
Australian Transaction Reports and Analysis Centre

AUSTRAC ANNUAL REPORT 2014–15FINANCIAL STATEMENTS 93
STATEMENT OF CHANGES IN EQUITYFOR THE PERIOD ENDED 30 JUNE 2015
Australian Transaction Reports and Analysis Centre
Retained earningsAsset revaluation
reserveContributed
equity/capitalTotal equity
2015$’000
2014$’000
2015$’000
2014$’000
2015$’000
2014$’000
2015$’000
2014$’000
Opening balanceBalance carried forward from previous period
(24,186) (16,296) 4,083 1,444 56,147 44,701 36,044 29,849
Adjusted opening balance
(24,186) (16,296) 4,083 1,444 56,147 44,701 36,044 29,849
Comprehensive incomeSurplus (Deficit) for the period
(8,381) (6,804) - - - - (8,381) (6,804)
Other comprehensive income
- - - 2,639 - - - 2,639
Total comprehensive income
(8,381) (6,804) - 2,639 - - (8,381) (4,165)
Transactions with ownersContributions by ownersEquity injection - Appropriations
- - - - 8,565 - 8,565
Departmental capital budget
- - - - 3,137 2,881 3,137 2,881
Sub-total transactions with owners
- - - - 3,137 11,446 3,137 11,446
Transfers between equity components
89 - (89) - - - - -
Prior period adjustments1
- (1,086) - - - - - (1,086)
Closing balance as at 30 June
(32,478) (24,186) 3,994 4,083 59,284 56,147 30,800 36,044
1. The prior period adjustments to retained earnings relates to the re-statement of operating lease expenditure on a straight-line basis. Refer to Note 1.9.The above statement should be read in conjunction with the accompanying notes.

AUSTRAC ANNUAL REPORT 2014–15 FINANCIAL STATEMENTS94
CASH FLOw STATEMENTFOR THE PERIOD ENDED 30 JUNE 2015
Australian Transaction Reports and Analysis Centre
Notes 2015$’000
2014$’000
OPERATING ACTIVITIES
Cash received
Appropriations 54,940 49,433
Sales of goods and rendering of services 4,700 12,435
Net GST received 2,702 3,103
Total cash received 62,342 64,971
Cash used
Employees 32,673 33,188
Suppliers 29,565 32,055
Total cash used 62,238 65,243
Net cash from (used by) operating activities 10 104 (272)
INVESTING ACTIVITIES
Cash used
Purchase of property, plant and equipment 1,719 6,032
Purchase of internally developed software 1,418 6,857
Total cash used 3,137 12,889
Net cash from (used by) investing activities (3,137) (12,889)
FINANCING ACTIVITIES
Cash received
Contributed equity 3,137 12,925
Total cash received 3,137 12,925
Net cash from (used by) financing activities 3,137 12,925
Net increase (decrease) in cash held 104 (236)
Cash and cash equivalents at the beginning of the reporting period 1,714 1,950
Cash and cash equivalents at the end of the reporting period 5A 1,818 1,714
The above statement should be read in conjunction with the accompanying notes.

AUSTRAC ANNUAL REPORT 2014–15FINANCIAL STATEMENTS 95
SCHEDULE OF COMMITMENTSAS AT 30 JUNE 2015
Australian Transaction Reports and Analysis Centre
2015$’000
2014$’000
BY TYPECommitments receivableNet GST recoverable on commitments1 (4,114) (4,671)Total commitments receivable (4,114) (4,671)
Commitments payableOther commitmentsOperating leases2 42,198 48,268 Contracts3 6,934 7,623 Total other commitments 49,132 55,891 Net commitments by type 45,018 51,220
BY MATURITYOther commitments receivableOne year or less (1,894) (1,959)From one to five years (1,578) (1,740)Over five years (642) (972)Total other commitments receivable (4,114) (4,671)
Commitments payableOperating lease commitmentsOne year or less 14,202 14,424 From one to five years 18,643 20,338 Over five years 9,353 13,506 Total operating lease commitments 42,198 48,268
Other CommitmentsOne year or less 6,931 7,529 From one to five years 3 94 Total other commitments 6,934 7,623 Total commitments payable 49,132 55,891 Net commitments by maturity 45,018 51,220 Notes: 1. Commitments are GST inclusive where relevant. 2. Operating leases included are effectively non-cancellable agreements and comprise: - Leases for office accommodation, outgoings and car parking: Lease payments are subject to the terms as detailed in the lease agreement. - Agreements for the provision of pooled motor vehicles: No contingent rentals exist and there are no renewal or purchase options available to the agency. 3. Contract agreements are effectively non-cancellable and mainly for the provision of IT services.This schedule should be read in conjunction with the accompanying notes.

AUSTRAC ANNUAL REPORT 2014–15 FINANCIAL STATEMENTS96
ADMINISTERED SCHEDULE OF COMPREHENSIVE INCOMEFOR THE PERIOD ENDED 30 JUNE 2015
ADMINISTERED SCHEDULE OF ASSETS AND LIABILITIESAS AT 30 JUNE 2015
Australian Transaction Reports and Analysis Centre
Australian Transaction Reports and Analysis Centre
Notes 2015$’000
2014$’000
EXPENSESOther expenses 15 559 134 Total expenses administered on behalf of Government 559 134
LESS:Non-taxation revenueFees and fines 16 44,659 28,048 Total non-taxation revenue 44,659 28,048 Total revenues administered on behalf of Government 44,659 28,048
Total comprehensive income (loss) 44,100 27,914 This schedule should be read in conjunction with the accompanying notes.
Notes 2015$’000
2014$’000
Assets administered on behalf of Government
Financial assetsTrade and other receivables 17 127 - Total financial assets 127 -
Total assets administered on behalf of Government 127 -
Net assets 127 - This schedule should be read in conjunction with the accompanying notes.

AUSTRAC ANNUAL REPORT 2014–15FINANCIAL STATEMENTS 97
ADMINISTERED RECONCILIATION SCHEDULEFOR THE PERIOD ENDED 30 JUNE 2015
Australian Transaction Reports and Analysis Centre
2015$’000
2014$’000
Opening administered assets less administered liabilities as at 1 July
- 1,775
Surplus (deficit) items:
Plus: Administered income 44,659 28,048
Administered transfers to/from Australian Government:
Special appropriation (unlimited) 82 665
Transfers to OPA (44,055) (30,354)
Less Administered expenses (other than Corporate Commonwealth entities)
(559) (134)
Closing administered assets less administered liabilities as at 30 June
127 -
This schedule should be read in conjunction with the accompanying notes.

AUSTRAC ANNUAL REPORT 2014–15 FINANCIAL STATEMENTS98
ADMINISTERED CASH FLOw STATEMENT FOR THE PERIOD ENDED 30 JUNE 2015
Australian Transaction Reports and Analysis Centre
Notes 2015$’000
2014$’000
Administered Cash Flows
OPERATING ACTIVITIES
Cash received
Fees and levies 43,360 30,260
Fines 695 94
Total Cash received 44,055 30,354
Cash used
Refunds of fees and levies (82) (665)
Total cash used (82) (665)
Net cash flows from (used by) operating activities 18 43,973 29,689
Net increase (decrease) in Cash Held 43,973 29,689
Cash and cash equivalents at the beginning of the reporting period - -
Cash from the Offical Public Account for:
Special appropriation (unlimited) 82 665
Cash to Official Public Account for:
Administered Receipts (44,055) (30,354)
(43,973) (29,689)
Cash and cash equivalents at the end of the reporting period - -
This schedule should be read in conjunction with the accompanying notes.

AUSTRAC ANNUAL REPORT 2014–15FINANCIAL STATEMENTS 99
SCHEDULE OF ADMINISTERED COMMITMENTS FOR THE PERIOD ENDED 30 JUNE 2015
Australian Transaction Reports and Analysis Centre
AUSTRAC has no administered commitments as at 30 June 2015 (2014: Nil)
This schedule should be read in conjunction with the accompanying notes.

AUSTRAC ANNUAL REPORT 2014–15 FINANCIAL STATEMENTS100
1.1 Objectives of AUSTRACThe Australian Transaction Reports and Analysis Centre (AUSTRAC) is a non-corporate Commonwealth entity, controlled by the Australian Government. The purpose of AUSTRAC is to protect the integrity of Australia’s financial system and to contribute to the administration of justice through its expertise in countering money laundering and the financing of terrorism.
AUSTRAC is Australia’s anti-money laundering and counter-terrorism financing (AML/CTF) regulator and specialist financial intelligence unit (FIU). As a regulator, AUSTRAC oversees industry compliance with obligations under the Anti-Money Laundering and Counter-Terrorism Financing Act 2006 (AML/CTF Act) and the Financial Transaction Reports Act 1988 (FTR Act). As Australia’s financial intelligence unit, AUSTRAC collects and transforms financial information into actionable intelligence for its Australian law enforcement partners.
AUSTRAC was established in 1989 under the FTR Act as a statutory authority within the Attorney-General’s portfolio and is continued in existence by Section 209 of the AML/CTF Act. The ongoing existence of AUSTRAC in its present form and with its present programs is dependent on Government policy and on continuing funding by Parliament for AUSTRAC’s administration and programs.
AUSTRAC activities contributing toward these outcomes are classified as either departmental or administered. Departmental activities involve the use of assets, liabilities, income and expenses controlled or incurred by the entity in its own right. Administered activities involve the management or oversight by the entity, on behalf of the Government, of items controlled or incurred by the Government.
1.2 Basis of Preparation of The Financial Statements
The financial statements are general purpose financial statements and are required by section 42 of the Public Governance, Performance and Accountability Act 2013 (PGPA Act).
The financial statements have been prepared in accordance with:
a) the Financial Reporting Rule (FRR) for reporting periods ending on or after 1 July 2014, and
b) Australian Accounting Standards and Interpretations issued by the Australian Accounting Standards Board (AASB) that apply for the reporting period.
The financial statements have been prepared on an accrual basis and in accordance with the historical cost convention, except for certain assets and liabilities at fair value. Except where stated, no allowance is made for the effect of changing prices on the results or the financial position.
The financial statements are presented in Australian dollars and values are rounded to the nearest thousand dollars unless otherwise specified.
Unless an alternative treatment is specifically required by an accounting standard or the FRR, assets and liabilities are recognised in the balance sheet when and only when it is probable that future economic benefits will flow to AUSTRAC or a future sacrifice of economic benefits will be required and the amounts of the assets or liabilities can be reliably measured. Liabilities and assets that are unrecognised are reported in the schedule of commitments or the schedule of contingencies.
Unless alternative treatment is specifically required by an accounting standard, income and expenses are recognised in the Statement of Comprehensive Income when and only when the flow, consumption or loss of economic benefits has occurred and can be reliably measured.
NOTE 01SUMMARY OF SIGNIFICANT ACCOUNTING POLICIES

AUSTRAC ANNUAL REPORT 2014–15FINANCIAL STATEMENTS 101
1.3 Significant Accounting Judgements and Estimates
No accounting assumptions and estimates have been identified that have a significant risk of causing a material adjustment to carrying amounts of assets and liabilities within the next accounting period.
1.4 New Australian Accounting Standards
Adoption of New Australian Accounting Standards Requirements
AASB 13 Fair Value Measurement amendments which provide relief to not for profit public sector entities from disclosing level 3 assets quantitative and qualitative information have been adopted earlier than the application date.
The following new, revised or amended standards and interpretations that were issued prior to the signing of the Statement by the Chief Executive Officer and Chief Finance Officer were applicable to the current reporting period and had a material effect on the entity’s financial statements:
Accounting Standard
Nature of change
Impact on AUSTRAC’s financial statements
AASB 1055 – Budgetary Reporting
New requirement to report budgetary information and explain significant variances between budget and actual at the individual entity level.
A new note is added to Notes forming part of the financial statements providing budget information and explaining major variances between budget and actual year-end outcome.
With the exception of AASB 1055 noted above, all new or revised standards and interpretations issued prior to the signing of the Statement by the Chief Executive Officer and Chief Finance Officer that were applicable to the current reporting period had no material financial impact on the agency, and are not expected to have a future financial impact.
Future Australian Accounting Standards Requirements
The following new standard was issued by the Australian Accounting Standards Board prior to the sign-off date, which may have a financial impact on the entity for future reporting periods:
Accounting Standard
Effective date
Nature of change
AASB 15 Revenue from Contracts with Customers
1 January 2017
Changes to Revenue from Contracts with Customers will change aspects of the accounting treatment for all departmental revenue other than Gains and Revenues from Government. These revisions first apply in the 2017-18 financial statements, but will require retrospective adjustments for affected accounting treatments for the 2016–17 comparative disclosures.
AASB 9 Financial Instruments
1 July 2017
Changes to the Financial Instruments standard will impact on classification and measurement of financial assets and liabilities of the department. These revisions are first effective in 2018–19, but will require retrospective adjustments for the 2017–18 comparative disclosures.

AUSTRAC ANNUAL REPORT 2014–15 FINANCIAL STATEMENTS102
Other new standards or revised standards that were issued prior to the sign-off date and are applicable to future reporting periods are not expected to have a future material financial impact.
1.5 RevenueRevenue from the sale of goods is recognised when:
a) the risks and rewards of ownership have been transferred to the buyer
b) AUSTRAC retains no managerial involvement or effective control over the goods
c) the revenue and transaction costs incurred can be reliably measured, and
d) it is probable that the economic benefits associated with the transaction will flow to AUSTRAC.
Revenue from rendering of services is recognised by reference to the stage of completion of contracts at the reporting date. The revenue is recognised when:
a) the amount of revenue, stage of completion and transaction costs incurred can be reliably measured, and
b) the probable economic benefits associated with the transaction will flow to the entity.
The stage of completion of contracts at the reporting date is determined by reference to the proportion that costs incurred to date bear to the estimated total costs of the transaction.
Receivables for goods and services, which have 30 day terms, are recognised at the nominal amounts due less any impairment allowance account. Collectability of debts is reviewed at the end of the reporting period. Allowances are made when collectability of the debt is no longer probable.
Revenue from Government
Amounts appropriated for departmental outputs for the year (adjusted for any formal additions and reductions) are recognised as revenue from government when AUSTRAC gains control of the appropriation, except for certain amounts that relate to activities that are reciprocal in nature, in which case revenue is recognised only when it has been earned.
Appropriations receivable are recognised at their nominal amounts.
Resources received free of charge are recognised as gains when, and only when, a fair value can be reliably determined and the services would have been purchased if they had not been donated. Use of those resources is recognised as an expense.
Resources received free of charge are recorded as either revenue or gains depending on their nature.
Contributions of assets at no cost of acquisition or for nominal consideration are recognised as gains at their fair value when the asset qualifies for recognition, unless received from another Government entity as a consequence of a restructuring of administrative arrangements (Refer to Note 1.7).
1.6 Gains
Sale of Assets
Gains from disposal of assets are recognised when control of the asset has passed to the buyer.
1.7 Transactions With The Government as Owner
Equity Injections
Amounts appropriated which are designated as ‘equity injections’ for a year (less any formal reductions) and Departmental Capital Budgets (DCBs) are recognised directly in contributed equity.

AUSTRAC ANNUAL REPORT 2014–15FINANCIAL STATEMENTS 103
Restructuring of Administrative Arrangements
Net assets received from or relinquished to another Australian Government entity under a restructuring of administrative arrangements are recorded at their book value directly against contributed equity.
1.8 Employee BenefitsLiabilities for ‘short-term employee benefits’ (as defined in AASB 119 Employee Benefits) and termination benefits due within twelve months of the end of reporting period are measured at their nominal amounts.
The nominal amount is calculated with regard to the rates expected to be paid on settlement of the liability.
Other long-term employee benefits are measured as the net total of the present value of the defined benefit obligation at the end of the reporting period.
Leave
The liability for employee benefits includes provisions for annual leave and long service leave. No provision has been made for sick leave as all sick leave is non-vesting and the average sick leave taken in future years by employees of AUSTRAC is estimated to be less than the annual entitlement for sick leave.
The leave liabilities are calculated on the basis of employees’ remuneration at the estimated salary rates that will be applied at the time the leave is taken, including AUSTRAC’s employer superannuation contribution rates and other employee benefits to the extent that the leave is likely to be taken during service rather than paid out on termination. Leave provisions are disclosed as being settled in more than 12 months as AUSTRAC does not expect all leave for all employees to be used wholly within 12 months of the end of the reporting period.
The liability for long service leave is the present value of employee entitlements based on the Australian Government shorthand method as per the FRR. The estimate of the present value of the liability takes into account attrition rates and pay increases through promotion and inflation.
Superannuation
The majority of AUSTRAC’s staff are members of the Commonwealth Superannuation Scheme (CSS), the Public Sector Superannuation Scheme (PSS) or the PSS accumulation plan (PSSap). A small number of staff are members of employee nominated superannuation funds, as allowed under AUSTRAC’s enterprise agreement.
The CSS and PSS are defined benefit schemes for the Australian Government. The PSSap and other employee nominated superannuation funds are defined contribution schemes.
The liability for defined benefits is recognised in the financial statements of the Australian Government and is settled by the Australian Government in due course. This liability is reported by the Department of Finance administered schedules and notes.
AUSTRAC makes employer contributions to the employees’ superannuation scheme at rates determined by an actuary to be sufficient to meet the current cost to the Government. AUSTRAC accounts for the contributions as if they were contributions to defined contribution plans.
The liability for superannuation recognised as at 30 June represents outstanding contributions for the final fortnight of the year.
Parental Leave
AUSTRAC received payments during the year under the Paid Parental Leave Scheme of $120,587 (2014: $85,194).

AUSTRAC ANNUAL REPORT 2014–15 FINANCIAL STATEMENTS104
1.9 LeasesA distinction is made between finance leases and operating leases. Finance leases effectively transfer from the lessor to the lessee substantially all the risks and rewards incidental to ownership of leased assets. An operating lease is a lease that is not a finance lease. In operating leases, the lessor effectively retains substantially all such risks and benefits.
Where an asset is acquired by means of a finance lease, the asset is capitalised at either the fair value of the lease property or, if lower, the present value of minimum lease payments at the inception of the contract and a liability is recognised at the same time and for the same amount.
The discount rate used is the interest rate implicit in the lease. Leased assets are amortised over the period of the lease. Lease payments are allocated between the principal components and the interest expense.
Operating lease payments are expensed on a straight-line basis which is representative of the pattern of benefits derived from the leased assets.
During 2014-15, adjustments were made to reflect the recognition of operating lease expenditure on a straight-line basis. This resulted in an adjustment to retained earnings and other payables in the comparative year disclosures.
Lease Incentives
Lease incentives taking the form of rent free periods are recognised as liabilities. These liabilities are reduced by allocating lease payments between rental expense and reduction of the liability over the remaining term of the lease.
1.10 CashCash comprises cash on hand and demand deposits. Cash is recognised at its nominal amount.
1.11 Financial Assets
Loans and Receivables
Receivables for goods and services are recognised at the nominal amounts due, less any provision for bad or doubtful debts. Collectability of debts is reviewed at balance date. Provisions are made when collectability of the debt is no longer probable.
Trade receivables and other receivables that have fixed or determinable payments that are not quoted in an active market are classified as ‘loans and receivables’.
1.12 Financial Liabilities
Other Financial Liabilities
Supplier and other payables are recognised at their nominal amounts. Liabilities are recognised to the extent that the goods or services have been received (irrespective of having been invoiced).
1.13 Contingent Liabilities and Contingent Assets
Contingent liabilities and contingent assets are not recognised in the balance sheet but are reported in the relevant notes. They may arise from uncertainty as to the existence of a liability or asset or represent an asset or liability in respect of which the amount cannot be reliably measured. Contingent assets are disclosed when settlement is probable but not virtually certain and contingent liabilities are disclosed when settlement is greater than remote.
1.14 Acquisition of AssetsAssets are recorded at cost on acquisition except as stated below. The cost of acquisition includes the fair value of assets transferred in exchange and liabilities undertaken. Financial assets are initially measured at their fair value plus transaction costs where appropriate.

AUSTRAC ANNUAL REPORT 2014–15FINANCIAL STATEMENTS 105
Assets acquired at no cost, or for nominal consideration, are initially recognised as assets and income at their fair value at the date of acquisition, unless acquired as a consequence of restructuring of administrative arrangements. In the latter case, assets are initially recognised as contributions by owners at the amounts at which they were recognised in the transferor’s accounts immediately prior to the restructuring.
1.15 Property, Plant and Equipment
Asset Recognition Threshold
Purchases of property, plant and equipment are recognised initially at cost in the balance sheet, except for purchases costing less than $2,000, which are expensed in the year of acquisition (other than where they form part of a group of similar items which are significant in total).
The initial cost of an asset includes an estimate of the cost of dismantling and removing the item and restoring the site on which it is located. This is also relevant to ‘make good’ provisions in property leases taken up by AUSTRAC where there exists an obligation to restore the property back to its original condition. These costs are included in the value of leasehold improvements with a corresponding recognition of a provision for restoration obligation.
Revaluations
Fair values for each class of asset are determined as shown below:
Asset class Fair value measured at
Leasehold improvements Depreciated replacement cost, adjusted for obsolescence
Infrastructure, plant and equipment
Depreciated replacement cost, adjusted for obsolescence
AUSTRAC has assessed a three year update is appropriate to meet this requirement.
Following initial recognition at cost, property, plant and equipment are carried at fair value less subsequent accumulated depreciation and accumulated impairment losses. Independent valuations are conducted with sufficient frequency to ensure that the carrying amounts of assets do not differ materially from the assets’ fair values as at the reporting date.
Revaluation adjustments are made on a class basis. Any revaluation increment is credited to equity under the heading of asset revaluation reserve except to the extent that it reverses a previous revaluation decrement of the same asset that was previously recognised in the surplus/deficit. Revaluation decrements for assets are recognised directly in the surplus/deficit except to the extent that they reverse a previous revaluation increment for that asset.
Any accumulated depreciation as at the revaluation date is eliminated against the gross carrying amount of the asset and the asset restated to the revalued amount. Depreciation is recalculated over the remaining estimated useful life of the asset.
Depreciation
Depreciable property, plant and equipment assets are written-off to their estimated residual values over their estimated useful lives to AUSTRAC using the straight-line method of depreciation. Leasehold improvements are depreciated on a straight-line basis over the lesser of the estimated useful life of the improvements or the unexpired period of the lease.
Depreciation rates (useful lives), residual values and methods are reviewed at each reporting date and necessary adjustments are recognised in the current, or current and future reporting periods, as appropriate.

AUSTRAC ANNUAL REPORT 2014–15 FINANCIAL STATEMENTS106
Depreciation rates applying to each class of depreciable asset are based on the following useful lives:
Asset class 2015 2014
Leasehold improvements
Lease term Lease term
Infrastructure, plant and equipment
3 to 10 years from date of
purchase
3 to 10 years from date of
purchase
Impairment
All assets were assessed for indications of impairment at 30 June 2015. Where indications of impairment exist, the asset’s recoverable amount is estimated and an impairment adjustment made if the asset’s recoverable amount is less than its carrying amount.
The recoverable amount of an asset is the fair market value less costs to sell and its value in use. Value in use is the present value of the future cash flows expected to be derived from the asset.
Derecognition
An item of property, plant and equipment is derecognised upon disposal or when no further future economic benefits are expected from its use or disposal.
1.16 IntangiblesAUSTRAC’s intangibles comprise purchased and internally developed software for internal use. These assets are carried at cost less accumulated amortisation and accumulated impairment losses.
Software is amortised on a straight-line basis over its anticipated useful life. The useful lives of AUSTRAC’s software are 3 to 10 years (2013-14: 3 to 10 years).
All software assets were assessed for indications of impairment as at 30 June 2015.
1.17 TaxationAUSTRAC is exempt from all forms of taxation except Fringe Benefits Tax (FBT) and the Goods and Services Tax (GST).
Revenues, expenses and assets are recognised net of GST except:
a) where the amount of GST incurred is not recoverable from the Australian Taxation Office, and
b) for receivables and payables.
1.18 Monitoring of Constitutional and Other Legal Requirements
The Australian Government continues to have regard to developments in case law, including the High Court’s most recent decision on Commonwealth expenditure in Williams v Commonwealth (2014) HCA 23, as they contribute to the larger body of law relevant to the development of Commonwealth programs. In accordance with its general practice, the Government will continue to monitor and assess risk and decide on any appropriate actions to respond to risks of expenditure not being consistent with constitutional or other legal requirements.

AUSTRAC ANNUAL REPORT 2014–15FINANCIAL STATEMENTS 107
1.19 Reporting of Administered Activities
Administered revenues, expenses, assets, liabilities and cash flows are disclosed in the schedule of administered items and related notes.
Except where otherwise stated below, administered items are accounted for on the same basis and using the same policies as for departmental items, including the application of Australian Accounting Standards.
Administered Revenue
AUSTRAC’s enabling legislation to facilitate supervisory levies was amended during the year ended 30 June 2015. The amendments replaced the previous supervisory levy and cost recovery arrangement with an Industry Contribution arrangement. The amended legislation comprises two Acts:
a) the Australian Transaction Reports and Analysis Centre Industry Contribution Act 2011, and
b) the Australian Transaction Reports and Analysis Centre Industry Contribution (Collections) Act 2011.
AUSTRAC has recognised administered revenues on an accrual basis.
Administered revenues comprise:
a) industry contribution levies invoiced by AUSTRAC under the Australian Transaction Reports and Analysis Centre Industry Contribution (Collections) Act 2011, and
b) collection of infringement notices issued under the AML/CTF Act by other Australian government agencies on behalf of the Australian government.
Revenue from industry contribution levies is stated net of any adjustments due to corrections made by entities to enrolment information that should have applied on the census day. Leviable entities may, in certain circumstances, apply to the AUSTRAC Chief Executive Officer for a waiver of payment. Where such waiver applications are granted (either in full or in part), the amount of the waiver is treated as an expense.
Administered Cash Transfers to and from the Official Public Account
Revenue collected by AUSTRAC for use by the Government rather than AUSTRAC is administered revenue. Collections are transferred to the Official Public Account (OPA) maintained by the Department of Finance. These transfers to the OPA are adjustments to the administered cash held by AUSTRAC on behalf of the Government and reported as such in the schedule of administered cash flow and in the administered reconciliation schedule.
AUSTRAC withdraws cash from the OPA in order to make payments under Parliamentary appropriation on behalf of Government. Such payments are made in accordance with the Australian Transaction Reports and Analysis Centre Industry Contribution (Collections) Act 2011.

AUSTRAC ANNUAL REPORT 2014–15 FINANCIAL STATEMENTS108
NOTE 02EVENTS AFTER THE REPORTING PERIOD
NOTE 03EXPENSES
DEPARTMENTAL:
AUSTRAC is not aware of any significant events that have occurred since reporting date which warrant disclosure in these statements.
ADMINISTERED:
AUSTRAC is not aware of any significant events that have occurred since reporting date which warrant disclosure in these statements.
2015$’000
2014$’000
Note 3A: Employee Benefits
Wages and salaries 24,878 24,762
Superannuation:
Defined contribution plans 2,114 2,104
Defined benefit plans 2,594 2,744
Leave and other entitlements 2,988 3,095
Separation and redundancies 311 450
Total employee benefits 32,885 33,155
Note 3B: Supplies
Goods and services
Contracted services 14,789 16,100
IT maintenance 2,758 3,225
Travel 1,835 1,524
Property and office maintenance 1,816 1,958
Telecommunications 1,067 1,123
Other 898 875
Total goods and services 23,163 24,805

AUSTRAC ANNUAL REPORT 2014–15FINANCIAL STATEMENTS 109
NOTE 03EXPENSES (CONT’D)
2015$’000
2014$’000
Goods and services are made up of:
Rendering of services – related entities 3,229 2,592
Rendering of services – external parties 19,934 22,213
Total goods and services 23,163 24,805
Other supplier expenses
Operating lease rentals – external parties:
Minimum lease payments 3,369 3,256
Workers compensation expenses 258 159
Total other supplier expenses 3,627 3,415
Total supplier expenses 26,790 28,220
Note 3C: Depreciation and Amortisation
Depreciation:
Property, plant and equipment 4,000 3,503
Leasehold Improvements 528 308
Total depreciation 4,528 3,811
Amortisation:
Intangibles 3,453 2,515
Total amortisation 3,453 2,515
Total depreciation and amortisation 7,981 6,326
Note 3D: Losses from Asset Sales
Property, plant and equipment:
Carrying value of assets sold or disposed 16 22
Total losses from asset sales 16 22
Note 3E: Write-down and Impairment of Assets
Asset write-down and impairments:
Revaluation decrement of assets - 412
Total write-down and impairment of assets - 412

AUSTRAC ANNUAL REPORT 2014–15 FINANCIAL STATEMENTS110
NOTE 04INCOME
NOTE 05FINANCIAL ASSETS
2015$’000
2014$’000
OWN-SOURCE REVENUENote 4A: Sale of Goods and Rendering of ServicesRendering of services - related entities 4,167 3,201 Rendering of services - external parties - 4,828
4,167 8,029
Note 4B: Other RevenueResources received free of charge 165 160
165 160 Total own source revenue 4,332 8,189
Note 4C: Revenue from GovernmentAppropriations:
Departmental appropriation 54,959 53,142 Total revenue from Government 54,959 53,142
2015$’000
2014$’000
Not 5A: Cash and Cash EquivalentsCash on hand or on deposit 1,818 1,714 Total cash and cash equivalents 1,818 1,714
Not 5B: Trade and Other ReceivablesGood and Services:
Goods and services - related entities 77 170 Goods and services - external parties 30 229
Total receivables for goods and services 107 399
Appropriations receivable:For existing programs 13,328 13,309
Total appropriations receivable 13,328 13,309

AUSTRAC ANNUAL REPORT 2014–15FINANCIAL STATEMENTS 111
NOTE 05FINANCIAL ASSETS (CONT’D)
NOTE 06NON-FINANCIAL ASSETS
2015$’000
2014$’000
Other receivables:GST receivable from the Australian Taxation Office 449 492 Total other receivables 449 492 Total trade and other receivables (net) 13,884 14,200
Receivables are expected to be recovered in:No more than 12 months 13,884 14,200 More than 12 months - -
Total trade and other receivables (net) 13,884 14,200
Receivables are aged as follows:Not overdue 13,881 14,175 Overdue by:
0 to 30 days 3 - 31 to 60 days - 25 61 to 90 days - - More than 90 days - -
Total receivables (gross) 13,884 14,200
2015$’000
2014$’000
Note 6A: Land and Buildings
Leasehold improvements:
Fair value 2,241 2,437
Accumulated depreciation (528) (201)
Total leasehold improvements 1,713 2,236
Total land and buildings 1,713 2,236
No indicators of impairment were found for leasehold improvements (2014: Nil).
No leasehold improvements are expected to be sold or disposed of within the next 12 months.

AUSTRAC ANNUAL REPORT 2014–15 FINANCIAL STATEMENTS112
NOTE 06NON-FINANCIAL ASSETS (CONT’D)
2015$’000
2014$’000
Note 6B: Property, Plant and Equipment
Other property, plant and equipment:
Fair value 15,047 14,065
Accumulated depreciation (5,459) (2,174)
Total other property, plant and equipment 9,588 11,891
No indicators of impairment were found for property, plant and equipment (2014: Nil).
Revaluations of non-financial assets
All revaluations were conducted in accordance with the revaluation policy stated at Note 1. The last revaluation was conducted by Preston Rowe Paterson, an independent qualified valuer, on 30 June 2014. The next revaluation will be completed for the year ending 30 June 2017.
Note 6C: Reconciliation of the Opening and Closing Balances of Property, Plant and Equipment (2014–15)
Leasehold improvements
at fair value$’000
Other property, plant &
equipment at fair value
$’000Total
$’000As at 1 July 2014Gross book value 2,437 14,065 16,502 Accumulated depreciation and impairment (201) (2,174) (2,375)Net book value at 1 July 2014 2,236 11,891 14,127 Additions
By purchase 5 1,713 1,718 Depreciation expense (528) (4,000) (4,528)
Asset disposals recognised in other comprehensive income
201 715 916
Accumulated depreciation on assets disposed (201) (715) (916)Other movements - (16) (16)
Net book value at 30 June 2015 1,713 9,588 11,301
Net book value at 30 June 2015 is represented by:Gross book value 2,241 15,047 17,288 Accumulated depreciation and impairment (528) (5,459) (5,987)
1,713 9,588 11,301

AUSTRAC ANNUAL REPORT 2014–15FINANCIAL STATEMENTS 113
NOTE 06NON-FINANCIAL ASSETS (CONT’D)
Note 6C (cont’d): Reconciliation of the Opening and Closing Balances of Property, Plant and Equipment (2013–14)
Leasehold Improvements
$’000
Other property, plant &
equipment$’000
Total$’000
As at 1 July 2013Gross book value 8,256 15,836 24,092 Accumulated depreciation and impairment (6,510) (7,881) (14,391)Net book value at 1 July 2013 1,746 7,955 9,701 Additions
By purchase 393 5,639 6,032 Depreciation expense (308) (3,503) (3,811)Reclassification:
Depreciation expense 5 (5) -Asset Cost (21) 21 -
Disposals:Impairments recognised in other comprehensive income
5,040 528 5,568
Other (5,040) (550) (5,590)Net Revaluation Increments / (Decrements):
Depreciation 1,572 8,687 10,259 Asset Cost (1,151) (6,881) (8,032)
Net book value at 30 June 2014 2,236 11,891 14,127
Net book value at 30 June 2014 is represented by:Gross book value 2,437 14,065 16,502 Accumulated depreciation and impairment (201) (2,174) (2,375)
2,236 11,891 14,127
Note 6D: Intangibles2015
$’0002014$’000
Computer software:Internally developed – in progress 818 12,447 Internally developed – in use 34,024 20,977 Purchased 2,362 2,362 Accumulated amortisation (16,955) (13,502)
Total computer software 20,249 22,284 Total intangibles 20,249 22,284 No indicators of impairment were found for intangible assets (2014: Nil).
No intangibles are expected to be sold or disposed of within the next 12 months.

AUSTRAC ANNUAL REPORT 2014–15 FINANCIAL STATEMENTS114
NOTE 06NON-FINANCIAL ASSETS (CONT’D)
Note E: Reconciliation of the Opening and Closing Balances of Intangibles (2014-15)Computer
software internally
developed$’000
Computer software
purchased$’000
Total$’000
As at 1 July 2014Gross book value 33,424 2,362 35,786 Accumulated amortisation and impairment (11,140) (2,362) (13,502)Net book value at 1 July 2014 22,284 - 22,284 Additions
By purchase or internally developed 818 - 818 Additions capitalised 600 - 600 Amortisation (3,453) - (3,453)
Net book value at 30 June 2015 20,249 - 20,249
Net book value as at 30 June 2015 represented by:Gross book value 34,842 2,362 37,204 Accumulated amortisation and impairment (14,593) (2,362) (16,955)
20,249 - 20,249
Note E (cont’d): Reconciliation of the Opening and Closing Balances of Intangibles (2013-14)Computer
software internally
developed$’000
Computer software
purchased$’000
Total$’000
As at 1 July 2013Gross book value 26,565 2,362 28,927 Accumulated amortisation and impairment (9,104) (1,883) (10,987)Net book value at 1 July 2013 17,461 479 17,940 Additions
By purchase or internally developed 5,921 - 5,921 Additions capitalised 938 - 938 Amortisation (2,036) (479) (2,515)
Net book value at 30 June 2014 22,284 - 22,284
Net book value as at 30 June 2014 represented by:Gross book value 33,424 2,362 35,786 Accumulated amortisation and impairment (11,140) (2,362) (13,502)
22,284 - 22,284

AUSTRAC ANNUAL REPORT 2014–15FINANCIAL STATEMENTS 115
NOTE 06NON-FINANCIAL ASSETS (CONT’D)
NOTE 07FAIR VALUE MEASUREMENTS
Note F: Other Non-Financial Assets
2015$’000
2014$’000
Prepayments 2,935 2,761
Total other non-financial assets 2,935 2,761
Total other non-financial assets - are expected to be recovered in:
No more than 12 months 2,468 2,086
More than 12 months 467 675
Total other non-financial assets 2,935 2,761
No indicators of impairment were found for other non-financial assets (2014: Nil).
The following tables provide an analysis of assets and liabilities that are measured at fair value.
The different levels of the fair value hierarchy are defined below.
Level 1: Quoted prices (unadjusted) in active markets for identical assets or liabilities that the entity can access at measurement date.
Level 2: Inputs other than quoted prices included within Level 1 that are observable for the asset or liability, either directly or indirectly.
Level 3: Unobservable inputs for the asset or liability.

AUSTRAC ANNUAL REPORT 2014–15 FINANCIAL STATEMENTS116
NOTE 07FAIR VALUE MEASUREMENTS (CONT’D)
Note 7A: Fair Value Measurements, Valuation Techniques and Inputs Used
Fair Value Measurements For Levels 2 and 3 Fair Value Measurements
Valuation
2015$’000
2014$’000
Category (Level 1, 2
or 31)*Valuation
technique(s)2 Inputs usedFinancial assets - -
Total financial assets - -
Non-financial assetsFitout leasehold improvements - recurring
1,713 2,236 3 Cost approach
Estimated replacement cost of similar assets adjusted for remaining useful life.
Hardware - recurring
6,016 7,163 3 Cost approach
Estimated replacement cost of similar assets adjusted for remaining useful life.
Software - recurring
3,335 4,383 3 Cost approach
Estimated replacement cost of similar assets adjusted for remaining useful life.
Office equipment - recurring
137 225 3 Cost approach
Estimated replacement cost of similar assets adjusted for remaining useful life.
Security equipment - recurring
100 120 3 Cost approach
Estimated replacement cost of similar assets adjusted for remaining useful life.
Total non-financial assets
11,301 14,127
Total fair value measurements of assets in the financial position
11,301 14,127
1. Recurring and non-recurring Level 3 fair value measurements - valuation processes
The estimated fair value of non-financial assets is based on appraisals performed by an independent, qualified valuer. The valuation process is undertaken every 3 years using significant inputs and assumptions that are developed in close consultation with management. The valuation processes and fair value changes are reviewed by the Audit and Risk Committee at each reporting date.
Non-financial assets comprise both specialised and more general operational assets that do not generally trade in the marketplace. AUSTRAC’s current use of these assets is therefore considered highest and best use. In the absence of observable market prices, assets are carried at cost. The determination of fair value is based on the cost approach (depreciated replacement cost), having regard to potential obsolescence and remaining economic life.2. No change in valuation technique occurred during the period.

AUSTRAC ANNUAL REPORT 2014–15FINANCIAL STATEMENTS 117
NOTE 07FAIR VALUE MEASUREMENTS (CONT’D)
Note 7B: Reconciliation for Recurring Level 3 Fair Value Measurements for the period ended 30 June 2015
The agency’s policy for determining when transfers between levels are deemed to have occurred can be found in Note 1.
The Level 3 reconciliation for non-financial assets is presented in Note 6C.
NOTE 8 PAYABLES
2015$’000
2014$’000
Note 8A: SuppliersTrade creditors and accruals 2,056 1,586 Total supplier payables 2,056 1,586
Supplier payables expected to be settled within 12 months:Related entities 321 98 External parties 1,735 1,488
Total 2,056 1,586 Settlement was usually made within 30 days (2014: 30 days).
Note 8B: Other PayablesSalaries and wages 947 950 Superannuation 167 151 Prepayments received/unearned income 5,128 5,500 Lease incentives 351 402 Operating leases1 1,239 1,086 Other 12 14 Total other payables 7,844 8,103
Total other payables are expected to be settled in:No more than 12 months 4,995 6,458 More than 12 months 2,849 1,645
Total other payables 7,844 8,103 1. The payable for operating leases relates to the recognition of operating lease expenditure on a straight-line basis. Comparative year figures have been adjusted - Refer to Note 1.9.

AUSTRAC ANNUAL REPORT 2014–15 FINANCIAL STATEMENTS118
2015$’000
2014$’000
Note 9A: Employee Provisions
Leave 9,039 8,839
Total employee provisions 9,039 8,839
Employee provisions are expected to be settled in:
More than 12 months 9,039 8,839
Total employee provisions 9,039 8,839
Note 9B: Other Provisions
Provision for contracted services 448 514
Total other provisions 448 514
Other provisions are expected to be settled in:
More than 12 months 448 514
Total other provisions 448 514
Other provision Total
$’000 $’000
Carrying amount 1 July 2014 514 514
Provision no longer required (66) -
Closing balance 2015 448 514
The agency currently has no agreement for the leasing of premises which requires the entity to restore the premises to its original condition (2014: no agreements).
NOTE 9 PROVISIONS

AUSTRAC ANNUAL REPORT 2014–15FINANCIAL STATEMENTS 119
NOTE 10 CASH FLOW RECONCILIATION
2015$’000
2014$’000
Reconciliation of cash and cash equivalents as per Statement of Financial Position to Cash Flow Statement
Cash and cash equivalents as per:
Cash flow statement 1,818 1,714
Statement of Financial Position 1,818 1,714
Difference - -
Reconciliation of net cost of services to net cash from operating activities:
Net cost of services (63,340) (59,946)
Add revenue from Government 54,959 53,142
Adjustments for non-cash items
Depreciation / amortisation 7,982 6,326
Loss on disposal of assets 16 22
Write-down and impairment of assets - 412
Adjustment to retained earnings1 - 1,086
Changes in assets / liabilities
Decrease / (Increase) in net receivables 318 (2,675)
(Increase) / decrease in prepayments (175) 103
(Decrease) / increase in employee provisions 199 (100)
(Decrease) / increase in supplier payables 469 (1,063)
(Decrease) / increase in other payables1 (258) 2,421
(Decrease) / increase in other provisions (66) -
Net cash from (used by) operating activities 104 (272)
1. The prior period adjustments to retained earnings relates to the re-statement of operating lease expenditure on a straight-line basis. Refer to Note 1.9.

AUSTRAC ANNUAL REPORT 2014–15 FINANCIAL STATEMENTS120
NOTE 11 CONTINGENT LIABILITIES AND ASSETS
Quantifiable contingencies
There are no quantifiable contingencies as at 30 June 2015 (2014 Nil).
Unquantifiable contingenciesThere are no unquantifiable contingencies as at 30 June 2015 (2014 Nil).Significant Remote Contingencies
There are no remote contingencies as at 30 June 2015 (2014 Nil).
NOTE 12 SENIOR MANAGEMENT PERSONNEL REMUNERATION
2015$
2014$
Short-term employee benefits:
Salary 2,704,529 2,600,788
Other allowances 24,865 24,079
Total short-term employee benefits 2,729,394 2,624,867
Post-employment benefits:
Superannuation 402,894 495,387
Total post-employment benefits 402,894 495,387
Other long-term employee benefits:
Long-service leave 67,583 77,984
Annual leave accrued 201,289 219,869
Total other long-term employee benefits 268,873 297,853
Separation payments 129,206 -
Total senior executive remuneration expenses 3,530,367 3,418,107
The total number of senior management personnel included in the above table is 13 (2014: 12).
The total number of senior management positions included in the above table is 11 (2014: 11). The difference between the number of roles and the number of personnel arises in circumstances where more than one person occupies a role during part or all of the financial year.

AUSTRAC ANNUAL REPORT 2014–15FINANCIAL STATEMENTS 121
NOTE 13 FINANCIAL INSTRUMENTS
Note 13A: Categories of Financial Instruments
2015$'000
2014$'000
Financial Assets
Held-to-maturity:
Cash and cash equivalents 1,818 1,714
Total 1,818 1,714
Loans and receivables:
Goods and services 107 399
Total 107 399
Carrying amount of financial assets 1,925 2,113
Financial Liabilities
At amortised cost:
Trade creditors 2,056 1,586
Total 2,056 1,586
Carrying amount of financial liabilities 2,056 1,586
No Financial assets or liabilities are held at fair value (loans and receivables are at amortised cost; financial liabilities are held at amortised cost).
Note 13B: Credit Risk
AUSTRAC's exposure to credit risk was minimal as loans and receivables were cash and trade receivables. The following table illustrates the entity's gross exposure to credit risk, excluding any collateral or credit enhancements.
2015$'000
2014$'000
Financial assets
Cash and cash equivalents 1,818 1,714
Receivables - goods and services 107 399
Total 1,925 2,113
Financial liabilities
Trade Creditors 2,056 1,586
Total 2,056 1,586
No collateral is held in relation to the entity's gross credit risk.

AUSTRAC ANNUAL REPORT 2014–15 FINANCIAL STATEMENTS122
NOTE 13FINANCIAL INSTRUMENTS (CONT’D)
Credit quality of financial instruments not past due or individually determined as impaired
Not past due or impaired
2015$’000
Not past due or impaired
2014$’000
Past due or impaired
2015$’000
Past due or impaired
2014$’000
Cash and cash equivalents 1,818 1,714 - -
Receivables - goods and services 107 374 - 25
Total 1,925 2,088 - 25
Ageing of financial assets that were past due but not impaired for 2014
0 to 30 days
$’000
31 to 60days
$’000
61 to 90days
$’000
90+days
$’000Total
$’000
Receivables - goods and services - 2 23 - 25
Total - 2 23 - 25
Note 13C: Liquidity Risk
AUSTRAC’s financial liabilities are supplier payables. The exposure to liquidity risk is based on the notion that AUSTRAC will encounter difficulty in meeting its financial obligations associated with financial liabilities. This was highly unlikely as AUSTRAC is appropriated funding from the Australian Government and AUSTRAC manages its budgeted funds to ensure it has adequate funds to meet payments as they fall due. In addition, other funding mechanisms which exist and internal policies and procedures (such as Accountable Authority Instructions) are in place to ensure effective stewardship of AUSTRAC’s resources.
Maturities for non-derivative financial liabilities 2015
Ondemand
$’000
within 1year
$’000
1 to 2years$’000
2 to 5years$’000
> 5years$’000
Total$’000
Trade Creditors - 2,056 - - - 2,056
Total - 2,056 - - - 2,056
Maturities for non-derivative financial liabilities 2014
Ondemand
$’000
within 1year
$’000
1 to 2years$’000
2 to 5years$’000
> 5years$’000
Total$’000
Trade Creditors - 1,586 - - - 1,586
Total - 1,586 - - - 1,586
AUSTRAC has no derivative financial liabilities in both the current and prior year.

AUSTRAC ANNUAL REPORT 2014–15FINANCIAL STATEMENTS 123
NOTE 14FINANCIAL ASSETS RECONCILIATION
NOTE 15ADMINISTERED - EXPENSES
Notes2015
$’0002014$’000
Financial assets
Total financial assets as per Statement of Financial Position 15,702 15,914
Less: non-financial instrument components:
Appropriations receivable 5B 13,328 13,309
GST Receivable 5B 449 492
Total non-financial instrument components 13,777 13,801
Total financial assets as per financial instruments note 1,925 2,113
2015$’000
2014$’000
Expenses
Write down of Receivables
Bad and doubtful debts expense 6 13
Waivers 553 -
Other expenses - 121
Total expenses 559 134

AUSTRAC ANNUAL REPORT 2014–15 FINANCIAL STATEMENTS124
NOTE 16ADMINISTERED - INCOME
NOTE 17ADMINISTERED - FINANCIAL ASSETS
2015$’000
2014$’000
OWN-SOURCE REVENUE
Taxation Revenue
Levies and FinesIndustry contribution levies 43,584 - Supervisory cost recovery levies 380 27,728 Fines 695 320
Total fees and fines 44,659 28,048
2015$’000
2014$’000
FINANCIAL ASSETS
Taxation Receivables
Other receivables:Industry contribution levies 127 -
Total other receivables - - Total trade and other receivables - -
127 - Total trade and other receivables 127 -
Receivables are expected to be recovered in:No more than 12 months 127 -
Total trade and other receivables 127 -
Receivables were aged as follows:Overdue by:
31 to 60 days 127 - Total receivables 127 -

AUSTRAC ANNUAL REPORT 2014–15FINANCIAL STATEMENTS 125
NOTE 18ADMINISTERED - CASH FLOW RECONCILIATION
2015 $’000
2014 $’000
Reconciliation of cash and cash equivalents as per Administered Schedule of Assets and Liabilities to Administered Cash Flow Statement
Cash and cash equivalents as per:
Schedule of administered cash flows - -
Schedule of administered assets and liabilities - -
Difference - -
Reconciliation of net cost of services to net cash from operating activities:
Net cost of services 44,659 28,048
Adjustment for non-cash items
Net write down of financial assets (559) (134)
Changes in assets / liabilities
(Increase)/decrease in net receivables (127) 1,775
Increase/(decrease) in net payables - -
43,973 29,689

AUSTRAC ANNUAL REPORT 2014–15 FINANCIAL STATEMENTS126
NOTE 20ADMINISTERED - CONTINGENT ASSETS AND LIABILITIES
Quantifiable contingenciesThere are no quantifiable contingencies as at 30 June 2015 (2014: Nil).
Unquantifiable contingenciesThere are no unquantifiable contingencies as at 30 June 2015 (2014: Nil).
Significant Remote ContingenciesThere are no remote contingencies as at 30 June 2015 (2014: Nil).
NOTE 19ADMINISTERED - ASSETS RECONCILIATION
Notes2015
$’0002014$’000
Financial assets
Total financial assets as per Schedule of Administered Assets and Liabilities
17 127 -
Less: non-financial instrument components Industry Levy (127) -
Total non-financial instrument components (127) -
Total financial assets which are financial instruments - -

AUSTRAC ANNUAL REPORT 2014–15FINANCIAL STATEMENTS 127
NOTE 21COST RECOVERY SUMMARY
2015$’000
2014$’000
Expenses
Departmental - 31,853
Administered - 134
Total expenses - 31,987
Revenue
Departmental - -
Administered 380 28,048
Total revenue 380 28,048
Receivables
Departmental - -
Administered - -
Total receivables - -
Amounts written off
Departmental - -
Administered - 13
Total amounts written off - 13
Cost recovered activities:AUSTRAC’s cost recovery levy arrangement ceased on 30 June 2014 and was replaced by the Industry Contribution levy arrangements, effective 1 July 2014.
The cost recovery revenue reported for the year ended 30 June 2015 comprises amended cost recovery invoices for prior financial years. Revised invoices were issued to a small number of reporting entities in response to those entities providing updated enrolment information that should have been reflected on the Reporting Entities Roll on the census dates for those years.

AUSTRAC ANNUAL REPORT 2014–15 FINANCIAL STATEMENTS128
NOTE 22APPROPRIATIONS
Tabl
e A:
Ann
ual A
ppro
pria
tions
(‘Re
cove
rabl
e G
ST e
xclu
sive
’)
201
5 A
ppro
pria
tion
s App
ropr
iatio
n Ac
tPG
PA A
ct
Tota
l ap
prop
riat
ion
$’00
0
App
ropr
iati
on
appl
ied
in
2015
(cur
rent
an
d pr
ior
year
s)$’
000
Vari
ance
3
$’00
0
Sect
ion
51
dete
rmin
atio
ns4
$’00
0
Ann
ual
App
ropr
ia-
tion
1,2
$’00
0A
FM$’
000
Sect
ion
74$’
000
Sect
ion
75$’
000
DEP
ART
MEN
TAL
Ord
inar
y an
nual
se
rvic
es58
,005
-
4,62
6 -
62,6
31
62,6
46
(16)
-
Oth
er s
ervi
ces
Equi
ty -
- -
- -
- -
-
Loan
s -
- -
- -
- -
-
Tota
l dep
artm
enta
l58
,005
-
4,62
6 -
62,6
31
62,6
46
(16)
-
1. T
here
are
no
appr
opria
tions
that
hav
e be
en q
uara
ntin
ed.
2. T
here
wer
e no
adj
ustm
ents
that
met
the
reco
gniti
on c
riter
ia o
f a fo
rmal
add
ition
or r
educ
tion
in re
venu
e (in
acc
orda
nce
with
FRR
Par
t 6 D
iv 3
) but
as
a la
w th
e ap
prop
riatio
n ha
d no
t bee
n am
ende
d be
fore
the
end
of th
e re
port
ing
perio
d.
3. V
aria
nce
rela
tes
to p
rior y
ear d
raw
n A
ppro
pria
tion
and
cash
bal
ance
s on
han
d at
yea
r end
.
4. T
here
was
no
appr
opria
tion
that
con
stitu
ted
a pe
rman
ent l
oss
of c
ontr
ol u
nder
Sec
tion
51 o
f the
Pub
lic G
over
nanc
e, P
erfo
rman
ce a
nd
Ac
coun
tabi
lity
Act 2
013
(PG
PA A
ct).

AUSTRAC ANNUAL REPORT 2014–15FINANCIAL STATEMENTS 129
NOTE 22APPROPRIATIONS (CONT’D)
Tabl
e A:
Ann
ual A
ppro
pria
tions
(‘Re
cove
rabl
e G
ST e
xclu
sive
’) (c
ont’d
)
2014
App
ropr
iatio
ns
Appr
opria
tion
Act
FMA
Act
Tota
l ap
prop
riatio
n$’
000
App
ropr
iatio
n ap
plie
d in
201
4 (c
urre
nt a
nd p
rior
year
s)$’
000
Varia
nce2
$’00
0
Ann
ual
App
ropr
ia-
tion1
$’00
0A
FM$’
000
Sect
ion
31$’
000
Sect
ion
32$’
000
DEP
ART
MEN
TAL
Ord
inar
y an
nual
se
rvic
es56
,114
- 11
,812
- 67
,926
65
,021
2,
905
Oth
er s
ervi
ces
Equi
ty8,
565
-
-
- 8,
565
10,0
44
(1,4
79)
Loan
s
-
- -
-
-
-
-
Prev
ious
yea
rs’
outp
uts
-
-
-
-
-
-
-
Tota
l dep
artm
enta
l64
,679
- 11
,812
- 76
,491
75
,065
1,
426
1. T
here
are
no
appr
opria
tions
that
hav
e be
en q
uara
ntin
ed.
2. V
aria
nce
rela
tes
to p
rior y
ear d
raw
n A
ppro
pria
tion
and
cash
bal
ance
s on
han
d at
yea
r end
.
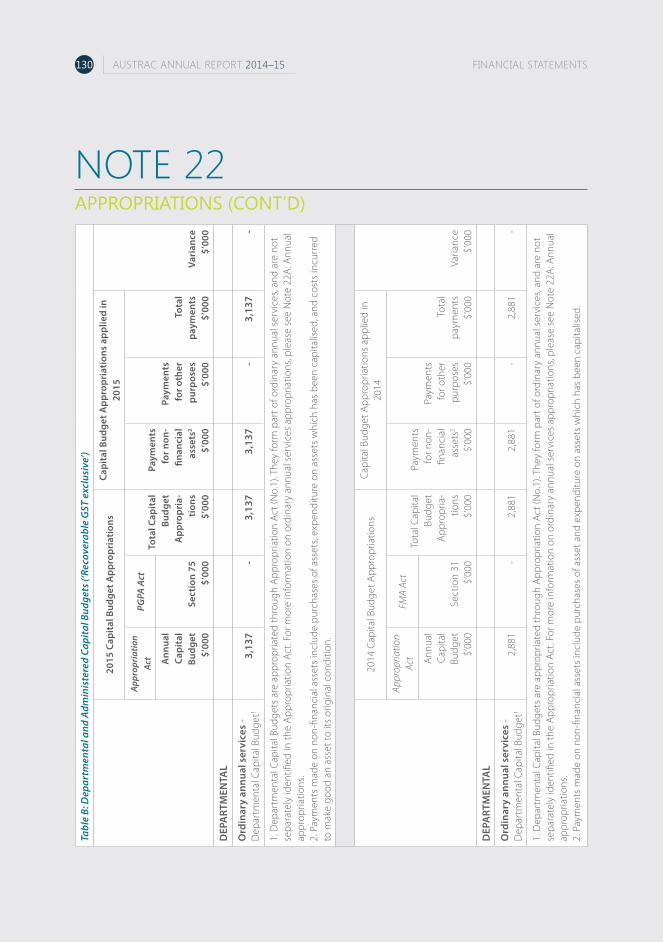
AUSTRAC ANNUAL REPORT 2014–15 FINANCIAL STATEMENTS130
NOTE 22APPROPRIATIONS (CONT’D)
Tabl
e B:
Dep
artm
enta
l and
Adm
inis
tere
d Ca
pita
l Bud
gets
(‘Re
cove
rabl
e G
ST e
xclu
sive
’)
2015
Cap
ital
Bud
get A
ppro
pria
tion
sCa
pita
l Bud
get A
ppro
pria
tion
s ap
plie
d in
20
15
Vari
ance
$’00
0
App
ropr
iatio
n Ac
tPG
PA A
ctTo
tal C
apit
al
Budg
et
App
ropr
ia-
tion
s$’
000
Paym
ents
fo
r non
-fin
anci
al
asse
ts2
$’00
0
Paym
ents
fo
r oth
er
purp
oses
$’00
0
Tota
l pa
ymen
ts
$’00
0
Ann
ual
Capi
tal
Budg
et$’
000
Sect
ion
75$’
000
DEP
ART
MEN
TAL
Ord
inar
y an
nual
ser
vice
s -
Dep
artm
enta
l Cap
ital B
udge
t13,
137
-3,
137
3,13
7 -
3,13
7 -
1. D
epar
tmen
tal C
apita
l Bud
gets
are
app
ropr
iate
d th
roug
h A
ppro
pria
tion
Act (
No.
1). T
hey
form
par
t of o
rdin
ary
annu
al s
ervi
ces,
and
are
not
sepa
rate
ly id
entifi
ed in
the
App
ropr
iatio
n Ac
t. Fo
r mor
e in
form
atio
n on
ord
inar
y an
nual
ser
vice
s ap
prop
riatio
ns, p
leas
e se
e N
ote
22A
: Ann
ual
appr
opria
tions
.2.
Pay
men
ts m
ade
on n
on-fi
nanc
ial a
sset
s in
clud
e pu
rcha
ses
of a
sset
s, ex
pend
iture
on
asse
ts w
hich
has
bee
n ca
pita
lised
, and
cos
ts in
curr
ed
to m
ake
good
an
asse
t to
its o
rigin
al c
ondi
tion.
2014
Cap
ital B
udge
t App
ropr
iatio
nsCa
pita
l Bud
get A
ppro
pria
tions
app
lied
in
2014
Varia
nce
$’00
0
Appr
opria
tion
Act
FMA
Act
Tota
l Cap
ital
Budg
et
App
ropr
ia-
tions
$’00
0
Paym
ents
fo
r non
-fin
anci
al
asse
ts2
$’00
0
Paym
ents
fo
r oth
er
purp
oses
$’00
0
Tota
l pa
ymen
ts
$’00
0
Ann
ual
Capi
tal
Budg
et$’
000
Sect
ion
31$’
000
DEP
ART
MEN
TAL
Ord
inar
y an
nual
ser
vice
s -
Dep
artm
enta
l Cap
ital B
udge
t12,
881
-2,
881
2,88
1 -
2,88
1 -
1. D
epar
tmen
tal C
apita
l Bud
gets
are
app
ropr
iate
d th
roug
h A
ppro
pria
tion
Act (
No.
1). T
hey
form
par
t of o
rdin
ary
annu
al s
ervi
ces,
and
are
not
sepa
rate
ly id
entifi
ed in
the
App
ropr
iatio
n Ac
t. Fo
r mor
e in
form
atio
n on
ord
inar
y an
nual
ser
vice
s ap
prop
riatio
ns, p
leas
e se
e N
ote
22A
: Ann
ual
appr
opria
tions
.2.
Pay
men
ts m
ade
on n
on-fi
nanc
ial a
sset
s in
clud
e pu
rcha
ses
of a
sset
and
exp
endi
ture
on
asse
ts w
hich
has
bee
n ca
pita
lised
.

AUSTRAC ANNUAL REPORT 2014–15FINANCIAL STATEMENTS 131
NOTE 22APPROPRIATIONS (CONT’D)
Table C: Unspent Departmental Annual Appropriations (‘Recoverable GST exclusive’)
Authority2015
$’0002014$’000
Appropriation Act No.1 2013-14 - 15,023
Appropriation Act No.1 2014-151 15,146 -
Total 15,146 15,023
1. The balances for Appropriation Act No.1 2014-15 include cash at bank of $1,818 (2014: $1,714), which is treated as appropriations unspent and available for use.
Table D: Special Appropriations (‘Recoverable GST exclusive’)
Authority Type Purpose
Appropriation applied
2015$’000
2014$’000
Section 77, Public Governance, Performance and Accountability Act 2013
Refund To provide an appropriation where an Act or other law requires or permits the repayment of an amount received by the Commonwealth and apart from this section there is no specific appropriation for the repayment
82 -
Section 28, Financial Management and Accountability Act 19971
Refund To provide an appropriation where an Act or other law requires or permits the repayment of an amount received by the Commonwealth and apart from this section there is no specific appropriation for the repayment
- 665
Total 82 665
1. Comparative amounts were updated to reflect the cash payments made from this special appropriation.

AUSTRAC ANNUAL REPORT 2014–15 FINANCIAL STATEMENTS132
NOTE 23REPORTING OF OUTCOMES
NOTE 24NET CASH APPROPRIATION ARRANGEMENTS
Net Cost of Outcome Delivery
Outcome 1 Total
2015$’000
2014$’000
2015$’000
2014$’000
Departmental
Expenses (67,672) (68,135) (67,672) (68,135)
Own source income 4,332 8,189 4,332 8,189
Other Gains - - - -
Administered
Expenses (559) (134) (559) (134)
Revenue - fees and levies 44,659 28,048 44,659 28,048
Net cost/(contribution) of outcome delivery (19,240) (32,032) (19,240) (32,032)
Outcome 1 is described in Note 1.1. Net costs shown included intra-government costs that were eliminated in calculating the actual Budget Outcome. Refer to Outcome 1 Resourcing Table on page 147 of this annual report.
2015$’000
2014$’000
Total comprehensive income / (loss) less depreciation/amortisation expenses previously funded through revenue appropriations1
(400) 2,161
Plus: depreciation/amortisation expenses previously funded through revenue appropriation
(7,981) (6,326)
Total comprehensive income (loss) - as per the Statement of Comprehensive Income
(8,381) (4,165)
1. From 2010-11, the Government introduced net cash appropriation arrangements, where revenue appropriations for depreciation/amortisation expense ceased. Entities now receive a separate capital budget provided through equity appropriations. Capital budgets are to be appropriated in the period when cash payment for capital expenditure is required.

AUSTRAC ANNUAL REPORT 2014–15FINANCIAL STATEMENTS 133
NOTE 25BUDGETARY REPORTS AND EXPLANATIONS OF MAJOR VARIANCESThe following tables provide a comparison of the original budget as presented in the 2014-15 Portfolio Budget Statements (PBS) and the 2014-15 final outcome as presented in these financial statements. The Budgets are not audited.Note 25A: Departmental Budgetary ReportsStatement of Comprehensive Income for not-for-profit Reporting Entities for the period ended 30 June 2015
Notes
Actual OriginalBudget
Variance1
2015 $’000
2015 $’000
2015 $’000
NET COST OF SERVICESExpenses 25C (1)
Employee benefits 32,885 34,182 (1,297)Suppliers 26,790 21,228 5,562 Depreciation and amortisation 7,981 7,575 406 Losses from asset sales 16 - 16
Total expenses 67,672 62,985 4,687
Own-Source Income
Own-source revenueOther revenue 25C (2) 4,167 1,557 2,610
Total own-source revenue 4,167 1,557 2,610
GainsOther gains 165 135 30
Total gains 165 135 30 Total own-source income 4,332 1,692 2,640 Net cost of / (contribution by) services 63,340 61,293 2,047 Revenue from Government 25C (2) 54,959 53,718 1,241 Surplus/(Deficit) attributable to the Australian Government
(8,381) (7,575) (806)
OTHER COMPREHENSIVE INCOMEItems not subject to subsequent reclassification to net cost of services
Changes in asset revaluation surplus - - -Total other comprehensive income before income tax - - -Total comprehensive income/(loss) - - -Total comprehensive income (8,381) (7,575) (806)Total comprehensive income/(loss) attributable to the Australian Government
(8,381) (7,575) (806)
1. Explanations of major variances are provided in Note 25C, in sections corresponding to the number shown by way of note.

AUSTRAC ANNUAL REPORT 2014–15 FINANCIAL STATEMENTS134
NOTE 25BUDGETARY REPORTS AND EXPLANATIONS OF MAJOR VARIANCES (CONT’D)Statement of Financial Position for not-for-profit Reporting Entities as at 30 June 2015
Notes
Actual OriginalBudget
Variance1
2015 $’000
2015 $’000
2015 $’000
ASSETS 25C (3)Financial assets
Cash and cash equivalents 1,818 1,950 (132)Trade and other receivables 13,884 12,989 895
Total financial assets 15,702 14,939 763
Non-financial assetsLand and buildings 1,713 - 1,713 Property, plant and equipment 9,588 11,707 (2,119)Intangibles 20,249 17,959 2,290 Other non-financial assets 2,935 2,864 71
Total non-financial assets 34,485 32,530 1,955 Total assets 50,187 47,469 2,718
LIABILITIES 25C (4)Payables
Suppliers 2,056 2,338 (282)Other payables 7,844 4,527 3,317
Total payables 9,900 6,865 3,035
ProvisionsEmployee provisions 9,039 10,371 (1,332)Other provisions 448 15 433
Total provisions 9,487 10,386 (899)Total liabilities 19,387 17,251 2,136 Net assets 30,800 30,218 582
EQUITYParent entity interest
Contributed equity 59,284 59,284 -Reserves 3,994 1,444 2,550 Retained surplus/(Accumulated deficit) (32,478) (30,510) (1,968)
Total parent entity interest 30,800 30,218 582
Total equity 30,800 30,218 582 1. Explanations of major variances are provided in Note 25C, in sections corresponding to the number shown by way of note.

AUSTRAC ANNUAL REPORT 2014–15FINANCIAL STATEMENTS 135
NOTE 25BUDGETARY REPORTS AND EXPLANATIONS OF MAJOR VARIANCES (CONT’D)
Stat
emen
t of C
hang
es in
Equ
ity
for n
ot-f
or-p
rofit
Rep
ortin
g En
titie
s fo
r the
per
iod
ende
d 30
June
201
5Re
tain
ed e
arni
ngs
Ass
et re
valu
atio
n su
rplu
sCo
ntri
bute
d eq
uity
/cap
ital
Tota
l equ
ity
Act
ual
Orig
inal
Budg
etVa
rianc
e1A
ctua
lO
rigin
alBu
dget
Varia
nce1
Act
ual
Orig
inal
Budg
etVa
rianc
e1A
ctua
lO
rigin
alBu
dget
Varia
nce1
201
5 $’
000
201
5 $’
000
201
5 $’
000
201
5 $’
000
201
5 $’
000
201
5 $’
000
201
5 $’
000
201
5 $’
000
201
5 $’
000
201
5 $’
000
201
5 $’
000
201
5 $’
000
Open
ing b
alan
ce
Balan
ce ca
rried
forw
ard fro
m pre
vious
perio
d(2
4,18
6)(2
2,93
5)(1
,251
) 4
083
1,44
4 2,
639
56,1
47
56,1
47
-36
,044
34
,656
1,
388
Adju
sted o
peni
ng ba
lanc
e(2
4,18
6)(2
2,93
5)(1
,251
)4,
083
1,44
4 2,
639
56,1
47
56,1
47
-36
,044
34
,656
1,
388
Com
preh
ensiv
e inc
ome
Surpl
us/(D
eficit
) for
the p
eriod
(8,3
81)
(7,5
75)
(806
) -
- -
- -
-(8
,381
)(7
,575
)(8
06)
Tota
l com
preh
ensiv
e inc
ome
(8,3
81)
(7,5
75)
(806
) -
- -
- -
-(8
,381
)(7
,575
)(8
06)
Total
comp
rehen
sive i
ncom
e att
ributa
ble to
Austr
alian
Go
vern
ment
(8,3
81)
(7,5
75)
(806
) -
- -
- - - -
-(8
,381
)(7
,575
)(8
06)
Tran
sact
ions
with
owne
rs
Cont
ribut
ions
by ow
ners
Trans
fers b
etwee
n equ
ity
comp
onen
ts89
-
89
(89)
-(8
9) -
- -
- -
-
Depa
rtmen
tal ca
pital
budg
et -
- -
- -
-3,
137
3,13
7 -
3,13
7 3,
137
-To
tal t
rans
actio
ns w
ith
owne
rs89
-
89
(89)
-(8
9)3,
137
3,13
7 -
3,13
7 3,
137
-
Closin
g bal
ance
as at
30 Ju
ne(3
2,47
8)(3
0,51
0)(1
,968
)3,
994
1,44
4 2,
550
59,2
84
59,2
84
-30
,800
30
,218
58
2 Clo
sing b
alan
ce at
tribu
tabl
e to
Aus
tralia
n Gov
ernm
ent
(32,
478)
(30,
510)
(1,9
68)
3,99
4 1,
444
2,55
0 59
,284
59
,284
-
30,8
00
30,2
18
582
1. E
xpla
natio
ns o
f maj
or v
aria
nces
are
pro
vide
d in
Not
e 25
C, in
sect
ions
cor
resp
ondi
ng to
the
num
ber s
how
n by
way
of n
ote.
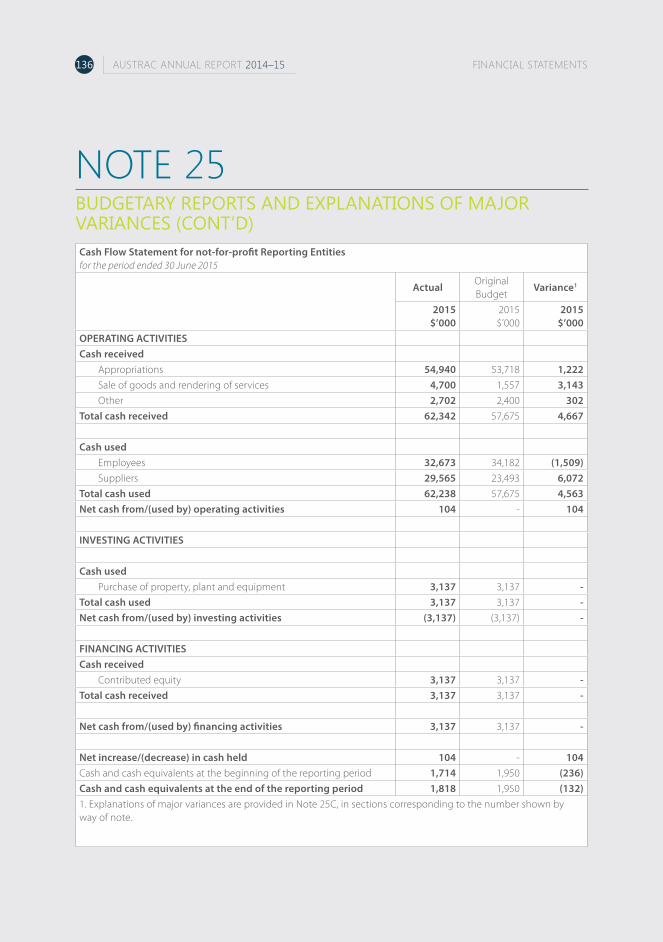
AUSTRAC ANNUAL REPORT 2014–15 FINANCIAL STATEMENTS136
NOTE 25BUDGETARY REPORTS AND EXPLANATIONS OF MAJOR VARIANCES (CONT’D)Cash Flow Statement for not-for-profit Reporting Entitiesfor the period ended 30 June 2015
ActualOriginalBudget
Variance1
2015 $’000
2015 $’000
2015 $’000
OPERATING ACTIVITIESCash received
Appropriations 54,940 53,718 1,222 Sale of goods and rendering of services 4,700 1,557 3,143 Other 2,702 2,400 302
Total cash received 62,342 57,675 4,667
Cash usedEmployees 32,673 34,182 (1,509)Suppliers 29,565 23,493 6,072
Total cash used 62,238 57,675 4,563 Net cash from/(used by) operating activities 104 - 104
INVESTING ACTIVITIES
Cash usedPurchase of property, plant and equipment 3,137 3,137 -
Total cash used 3,137 3,137 -Net cash from/(used by) investing activities (3,137) (3,137) -
FINANCING ACTIVITIESCash received
Contributed equity 3,137 3,137 -Total cash received 3,137 3,137 -
Net cash from/(used by) financing activities 3,137 3,137 -
Net increase/(decrease) in cash held 104 - 104 Cash and cash equivalents at the beginning of the reporting period 1,714 1,950 (236)Cash and cash equivalents at the end of the reporting period 1,818 1,950 (132)1. Explanations of major variances are provided in Note 25C, in sections corresponding to the number shown by way of note.

AUSTRAC ANNUAL REPORT 2014–15FINANCIAL STATEMENTS 137
NOTE 25BUDGETARY REPORTS AND EXPLANATIONS OF MAJOR VARIANCES (CONT’D)
Note 25B: Administered Budgetary Reports
Administered Schedule of Comprehensive Income for not-for-profit Reporting Entities for the period ended 30 June 2015
Notes
ActualOriginalBudget
Variance1
2015 $’000
2015 $’000
2015 $’000
Non-taxation revenue 25C (5)
Fees and fines 695 30 665
Other revenue 43,964 42,845 1,119
Total non-taxation revenue 44,659 42,875 1,784
Total expenses 559 - 559
Net cost of / (contribution by) services (44,100) (42,875) (1,225)
Surplus/(Deficit) after income tax 44,100 42,875 1,225
Total comprehensive income/(loss) 44,100 42,875 1,225
Administered Schedule of Assets and Liabilities for not-for-profit Reporting Entities as at 30 June 2015
Notes
ActualOriginalBudget
Variance1
2015 $’000
2015 $’000
2015 $’000
ASSETS
Financial assets
Trade and other receivables 25C (6) 127 - 127
Total financial assets 127 - 127
Total assets administered on behalf of Government 127 - 127
LIABILITIES
Total liabilities administered on behalf of Government - - -
Net assets/(liabilities) 127 - 127
1. Explanations of major variances are provided in Note 25C, in sections corresponding to the number shown by way of note.

AUSTRAC ANNUAL REPORT 2014–15 FINANCIAL STATEMENTS138
NOTE 25BUDGETARY REPORTS AND EXPLANATIONS OF MAJOR VARIANCES (CONT’D)
Note 25C: Explanations of Major VariancesNotes 25A and 25B provide a comparison of the original budget as presented in the 2014-15 Portfolio Budget Statements (PBS) and the 2014-15 final outcome as presented in these financial statements. The following analysis is to provide the reader with information on those variances that may be relevant to assessing the performance of AUSTRAC, including the accountability for the resources entrusted to it.
Australian Accounting Standard AASB 1055 Budgetary Reporting requires variance explanations of major variances between the original budget as presented in the 2014-15 Portfolio Budget Statements and the actual outcome as reported in these financial statements. It should be noted that the original budget was prepared before the 2013-14 actual figures could be known. As a consequence the opening balance of the 2014-15 Statement of Financial Position needed to be estimated and in some cases variances between 2014-15 actual and budget numbers can be at least in part attributed to unanticipated movements in the prior period figures.
Variances attributable to factors which would not reasonably have been identifiable at the time of the budget preparation, such as revaluation or impairment of assets or reclassifications of asset reporting categories have not been included as part of the analysis.
AUSTRAC considers that major variances are those greater than 10% of the original estimate. Variances below this threshold are not included unless considered significant by their nature.
Variances relating to cash flows and equity are a result of the factors detailed under expenses, own source income, assets or liabilities. Unless otherwise individually significant, no commentary has been included.
The Budgets are not audited.
General Commentary
In accordance with the Commonwealth budget framework, AUSTRAC updates estimates during the year for a number of reasons, including Government decisions and policy, prior year outcomes, current year trends, the effects of price and growth and transfers to and from other Commonwealth entities. The revised estimates for the 2014-15 financial year are published in the 2014-15 Portfolio Additional Estimates Statements (PAES) and the 2015-16 PBS. Reference has been made to the revised estimates where appropriate.
During 2014-15 AUSTRAC received additional appropriation as a result of a new National Security measure that provided funding for counter-terrorism activities. This new measure (totalling $0.969m for 2014-15) comprises the main factor underlying the increase in revenue and expenditure that is shown in the revised budget. This has caused an increase in several financial statement and cash flow line items including appropriations, employee benefits, suppliers and employee provisions.
Net of unfunded depreciation and amortisation, AUSTRAC realised a modest operating deficit in 2014-15.

AUSTRAC ANNUAL REPORT 2014–15FINANCIAL STATEMENTS 139
NOTE 25BUDGETARY REPORTS AND EXPLANATIONS OF MAJOR VARIANCES (CONT’D)
Departmental
Statement of Comprehensive Income
1) Departmental Expenses
The total variation in departmental expenses for 2014-15 between the original estimate published in the 2014-15 PBS and the actual outcome is $4.5m greater than the original estimate (7.2%). The primary factors for this variance were additional expenses incurred as a result of additional activity generated by new budget measures announced by Government during 2014-15 ($1.0m), as well as an increase in depreciation and amortisation charges ($0.4m). The agency also funded additional activity through an increase in own source revenue of $2.6m.
2) Departmental Appropriation, Own Source Revenue and Other Gains
The total variation in departmental revenue for 2014-15 between the original estimate published in the 2014-15 PBS and the actual outcome is $3.9m greater than the original estimate (7.0%). The primary reasons for this variance are additional appropriation received as a result of the new budget measures outlined above ($1.0m), as well as a net increase in own source revenue ($2.6m). The increase in own source revenue was for the purpose of enhancing data provided to certain partner agencies.
Statement of Financial Position
3) Departmental Assets
The total variation in departmental assets for 2014-15 between the original estimate published in the 2014-15 PBS and the actual outcome is $2.7m greater than the original estimate (5.7%). The variance has occurred within the non-financial asset category of intangibles, and reflects an increase in the rate of delivery of internally developed projects.
4) Departmental Liabilities
The total variation in departmental liabilities for 2014-15 between the original estimate published in the 2014-15 PBS and the actual outcome is $2.1m greater than the original estimate (12.4%). The variance is associated with the increase in own source revenue, a portion of which is held against unearned revenue for recognition in the 2015-16 financial year, and with the re-statement of operating lease expenditure and liabilities on a straight-line basis. Refer to Note 1.9.
Cash Flow Statement
The variances in cash received and cash used in operating activities reflect the changes in comprehensive income and financial position that are outlined above.
Administered
5) Statement of Comprehensive Income
The total variation in administered revenue for 2014-15 between the original estimate published in the 2014-15 PBS and the actual outcome is $1.8m greater than the original estimate. The main factors for this variance were additional revenue collected under the AUSTRAC Industry Contribution arrangements as a result of the increase in funding for new budget measures ($0.7m), as well as an increase in fees and fines collected under the AUSTRAC Infringement Notice Scheme ($0.4m).
Statement of Financial Position
6) Administered Assets
There is no budget (either original or revised) for AUSTRAC to administer assets on behalf of the Commonwealth. The receivables balance ($0.1m) outstanding at 30 June 2015 comprises a small number of unpaid Industry Contribution levy amounts from the 2014-15 financial year.

...APPENDIXES, ABBREVIATIONS & INDEXES


AUSTRAC ANNUAL REPORT 2014–15 APPENDIXES, ABBREVIATIONS & INDEXES142
Our human resource statistics show operative and paid inoperative employees and unpaid inoperative employees at the end of the last five financial years.
Operative and paid inoperative employeesState 2009–10 2010–11 2011–12 2012–13 2013–14 2014–15
Sydney 172 183 188 159 156 151
Melbourne 88 88 87 74 69 71
Canberra 19 25 22 19 19 24
Brisbane 21 21 18 21 17 12
Perth 2 3 2 2 3 2
Adelaide 2 2 2 2 2 2
Total 304 322 319 277 266 262
Unpaid inoperative employees
State 2009–10 2010–11 2011–12 2012–13 2013–14 2014–15
Sydney 7 4 6 2 1 4
Melbourne 5 3 5 2 1 3
Canberra - - - - 0 0
Brisbane - - 1 - 0 0
Perth - - - - 0 1
Adelaide - - - - 0 0
Total 12 7 12 4 2 8
Note:
• non-ongoing, casual and part-time employees are included in the statistics, with part-time employees shown as full-time equivalents
• tables relating to operative and paid inoperative employees report actual occupancy as at 30 June each year – this means when an employee was on paid leave on 30 June and another employee acted in the role, the table records two employees for the one role
• tables include employees engaged under the Public Service Act 1999
• numbers have been rounded up to whole numbers.
APPENDIX ASTAFFING STATISTICS

AUSTRAC ANNUAL REPORT 2014–15APPENDIXES, ABBREVIATIONS & INDEXES 143
Employee figures at 30 June 2015The table below provides a summary by classification and shows details of employees engaged under the Public Service Act 1999.
Public office holder
Senior Executive
Service (SES)
AUSTRAC Band 2 (EL2)
AUSTRAC Band 1 (EL1)
AUSTRAC Broadband 2 (APS levels
5–6)
AUSTRAC Broadband 1 (APS levels
1–4)Total
Office M F M F M F M F M F M F
Sydney 1 3 2 17 13 15 29 26 31 3 11 151Melbourne - - 1 2 6 5 4 13 20 17 1 2 71Canberra - - 1 1 2 3 6 4 1 6 - - 24
Brisbane - - - - 1 1 1 - 2 5 - 2 12Perth - - - - - - - - - 2 - - 2Adelaide - - - - - - - 1 1 - - - 2Total 1 5 5 26 22 26 47 50 61 4 15 262
The table includes full-time and part-time employees, and non-ongoing and casual employees, as well as paid inoperative employees and those acting in a higher position at 30 June 2015.
It also includes the CEO who is engaged under the AML/CTF Act.
* One employee from each Melbourne and Sydney were out posted in Indonesia for 2014–15 as part of the PAPP. Read more about the program on page 56–57 of this report.
Part-time and non-ongoing employees at 30 June 2015
The table below provides a summary of part-time and non-ongoing employees by classification and state.
State Classification group Part-time 2014–15 Non-ongoing 2014–15
M F Total M F Total
SydneySenior officer grades and equivalent 5 10 15 - - -APS 1–6 and equivalent 1 6 7 - - -
MelbourneSenior officer grades and equivalent - 5 5 - - -APS 1–6 and equivalent 2 6 8 - - -
Canberra Senior officer grades and equivalent - - - - - -APS 1–6 and equivalent - - - - - -
Brisbane Senior officer grades and equivalent - - - - - -APS 1–6 and equivalent - 2 2 - - -
PerthSenior officer grades and equivalent - - - - - -APS 1–6 and equivalent - - - - 1 1
Adelaide Senior officer grades and equivalent - - - - - -APS 1–6 and equivalent - - - - - -
Total 8 29 37 1 1
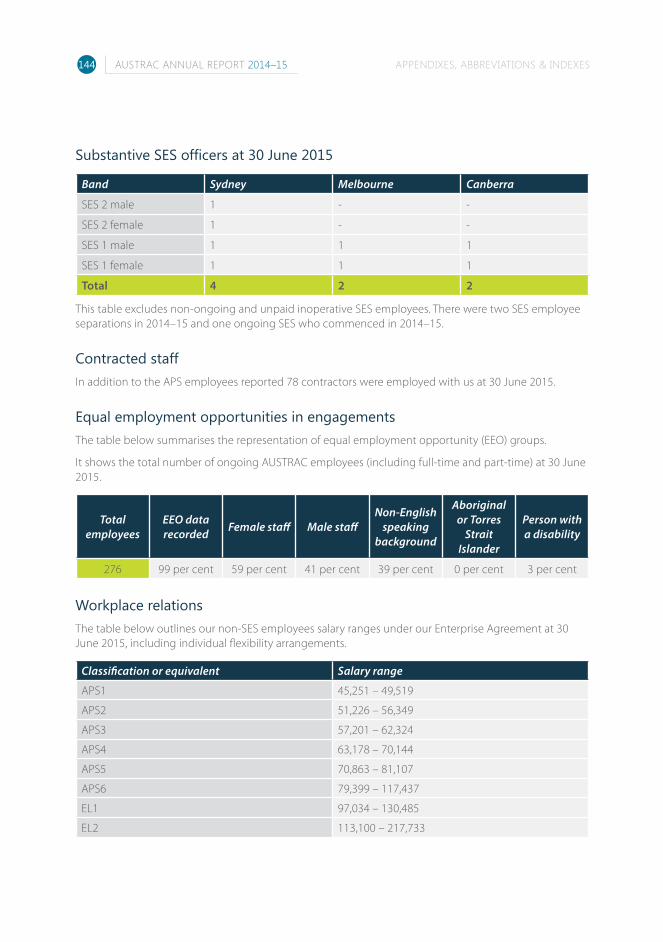
AUSTRAC ANNUAL REPORT 2014–15 APPENDIXES, ABBREVIATIONS & INDEXES144
Substantive SES officers at 30 June 2015
Band Sydney Melbourne Canberra
SES 2 male 1 - -
SES 2 female 1 - -
SES 1 male 1 1 1
SES 1 female 1 1 1
Total 4 2 2
This table excludes non-ongoing and unpaid inoperative SES employees. There were two SES employee separations in 2014–15 and one ongoing SES who commenced in 2014–15.
Contracted staff In addition to the APS employees reported 78 contractors were employed with us at 30 June 2015.
Equal employment opportunities in engagementsThe table below summarises the representation of equal employment opportunity (EEO) groups.
It shows the total number of ongoing AUSTRAC employees (including full-time and part-time) at 30 June 2015.
Total employees
EEO data recorded
Female staff Male staff Non-English
speaking background
Aboriginal or Torres
Strait Islander
Person with a disability
276 99 per cent 59 per cent 41 per cent 39 per cent 0 per cent 3 per cent
Workplace relationsThe table below outlines our non-SES employees salary ranges under our Enterprise Agreement at 30 June 2015, including individual flexibility arrangements.
Classification or equivalent Salary range
APS1 45,251 – 49,519
APS2 51,226 – 56,349
APS3 57,201 – 62,324
APS4 63,178 – 70,144
APS5 70,863 – 81,107
APS6 79,399 – 117,437
EL1 97,034 – 130,485
EL2 113,100 – 217,733
AUSTRAC ANNUAL REPORT 2014–15APPENDIXES, ABBREVIATIONS & INDEXES 145
Performance payNo performance pay was payable to SES or non-SES employees during 2014–15.
Work health and safety (WHS)We support WHS through:
• consultation by the Health and Safety Committee
• reviewing and updating WHS policies and processes
• maintaining a network of trained office duty holders
• continuing to communicate agency and individual WHS responsibilities
• promoting the agency’s Employee Assistance Program
• promoting a healthy work environment and work practises – including many staff receiving vaccinations as part of AUSTRAC’s influenza vaccination program.
We use a computer-based risk management system. This supports a database for recording and analysing WHS risks and incidents. The system has assisted with detailed analysis of incidents in the workplace and implementation of improved preventative measures. In 2014–15 17 incidents were recorded.
This year we have had three notifications of notifiable incidents as required by Comcare (section 38 notifications (OHS Act section 68)).
We had zero:
• investigations by Comcare
• issue of improvement notices – by HSRs (section 95 notices (OHS Act section 29))
• issue of improvement notices – by Comcare (part 10: section 191 notices (OHS Act section 47))
• power to issue prohibition notices (part 10: section 195 notices (OHS Act section 46))
• power to direct that workplace not be disturbed (part 10: section 198 notices (OHS directions section 45)).
Workforce planning and retentionWe continued with the development of an agency-wide strategic workforce plan. We will commence development of operational-level plans in 2015–16.
This year 35 staff left AUSTRAC – 23 leaving the APS and 12 transferring within the APS or to a Commonwealth non-APS employer.
Our attrition rate was 14 per cent – partly due to the closure of our Brisbane office.

AUSTRAC ANNUAL REPORT 2014–15 APPENDIXES, ABBREVIATIONS & INDEXES146
APPENDIX BAGENCY RESOURCE STATEMENTS 2014–15
Actual available appropriations
for 2014–15$’000
(a)
Payments made 2014–15
$’000(b)
Balance remaining
$’000(a-b)
Ordinary Annual Services
Prior year appropriation1 15,023 (15,161) -
Departmental appropriation2, 3 & 4 58,005 (42,859) 15,146
Section 74 Agency receipts per 2013–14 Portfolio Budget Statements 4,914 (4,914) -
Additional section 74 receipts (288) 288 -
Total 77,792 (62,646) 15,146
Total ordinary annual services 77,792 (62,646) 15,146
Departmental non-operating
Equity injections - - -
Equity injections - - -
Previous years inputs - - -
Total - - -
Total Resourcing and Payments 77,792 (62,646) 15,146
1. Appropriation Act No.1 2013–14 2. Appropriation Act No.1 2014–153. Appropriation Act No.1 DCB 2014–154. Appropriation Act No.3 2014–15

AUSTRAC ANNUAL REPORT 2014–15APPENDIXES, ABBREVIATIONS & INDEXES 147
APPENDIX CEXPENSES AND RESOURCES FOR OUTCOME FOR 2014–15
Outcome 1: A financial environment hostile to money laundering, financing of terrorism, major crime and tax evasion through industry regulation and the collection, analysis and dissemination of financial intelligence
*Budget 2014–15
$’000(a)
Actual expenses 2014–15
$’000(b)
Variation$’000(a)-(b)
Administered expenses
Expenses not requiring appropriation in the Budget year - 559 (559)
Departmental expenses
Ordinary annual services (Appropriation Bill No.1) 56,855 55,343 1,512
Revenues from independent sources (section 74) 4,914 4,167 747
Expenses not requiring appropriation in the Budget year 7,575 8,162 (1,146)
Subtotal for Outcome 1 69,344 68,231 554
Total for Outcome 1
Departmental 69,344 67,672 1,113
Administered - 559 (559)
2014–15 2013–14
Average staffing level (number) 267 262
* Full year budget including any subsequent made to the 2014–15 budget

AUSTRAC ANNUAL REPORT 2014–15 APPENDIXES, ABBREVIATIONS & INDEXES148
APPENDIX DCORRECTION OF ERRORS IN PREVIOUS REPORTS
There were two errors in the 2013–14 annual report:
1. The external and internal legal expenditure figures on page 100 were stated in the wrong order.
An erratum was included in the report to fix this error.
2. The omission of the 2013-14 column of the Notices issued to AUSTRAC under the WHS Act on page 92. In 2013–14 we conducted zero investigations.
ABBREVIATIONSAbbreviations DescriptionACC Australian Crime CommissionACCC Australian Competition and Consumer CommissionAFP Australian Federal PoliceAGD Attorney-General’s DepartmentAI AUSTRAC Intelligence (system)AML anti-money launderingAML/CTF anti-money laundering and counter-terrorism financingAML/CTF Act Anti-Money Laundering and Counter-Terrorism Financing Act 2006ANAO Australian National Audit OfficeAPG Asia/Pacific Group on Money LaunderingAPM Australian Police MedalAPS Australian Public ServiceASIC Australian Securities and Investments CommissionATO Australian Taxation OfficeAUSTRAC Australian Transaction Reports and Analysis CentreCBM-BNI cross-border movement of bearer negotiable instrumentCBM-PC cross-border movement of physical currencyCDD customer due diligence

AUSTRAC ANNUAL REPORT 2014–15APPENDIXES, ABBREVIATIONS & INDEXES 149
Abbreviations DescriptionCEO Chief Executive OfficerCTF counter-terrorism financingDFAT Department of Foreign Affairs and TradeDHS Department of Human ServicesEEO equal employment opportunityEGM Executive General ManagerFATF Financial Action Task ForceFIU financial intelligence unitFMA Act Financial Management and Accountability Act 1997FOI Freedom of InformationFTR Act Financial Transaction Reports Act 1988IBAC Independent Broad-based Anti-corruption Commission of VictoriaICT information and communications technologyIFA individual flexibility arrangementIFTI international funds transfer instructionIMF International Monetary FundIPS Information Publication SchemeKPI key performance indicatorMER Mutual Evaluation ReportML/TF money laundering/terrorism financingMOU memorandum of understandingOAIC Office of the Australian Information CommissionerPAPP PPATK-AUSTRAC partnership programPBS Portfolio Budget StatementsPPATK Pusat Pelaporan dan Analisis Transaksi Keuangan (Indonesian FIU)PSPF Protective Security Policy FrameworkRNP Remittance Network ProviderSCTR significant cash transaction reportSES Senior Executive ServiceSMR Suspicious Matter reportSUSTR suspect transaction reportTA&T technical assistance and trainingTES TRAQ Enquiry SystemTRAQ database Transaction Reports Analysis and Query (TRAQ) databaseTTR threshold transaction reportWHS work health and safetyWHS Act Work Health and Safety Act 2011
ABBREVIATIONS

AUSTRAC ANNUAL REPORT 2014–15 APPENDIXES, ABBREVIATIONS & INDEXES150
INDEXTO ANNUAL REPORT REQUIREMENTS
Description of information Requirement Page no.Letter of transmittal Mandatory 3Table of contents Mandatory 4Index Mandatory 153–159Glossary/list of acronyms Mandatory 148–149Contact officer(s) Mandatory 160Internet home page address and internet address for report Mandatory 160Review by SecretaryReview by departmental secretary (CEO) Mandatory 8–11Summary of significant issues and developments Suggested 8–11Overview of department’s performance and financial results Suggested 8–11Outlook for following year Suggested 11
Significant issues and developments – portfolioPortfolio departments – suggested
N/A
Departmental overviewRole and functions Mandatory 14Organisational structure Mandatory 15Outcome and program structure Mandatory 20Where outcome and program structures differ from PB Statements/PAES or other portfolio statements accompanying any other additional appropriation bills (other portfolio statements), details of variation and reasons for change
Mandatory N/A
Portfolio structurePortfolio departments – mandatory
N/A
Report on performanceReview of performance during the year in relation to programs and contribution to outcomes
Mandatory 8–11
Actual performance in relation to deliverables and KPIs set out in PB Statements/PAES or other portfolio statements
Mandatory 21–29
Where performance targets differ from the PBS, details of both former and new targets, and reasons for the change
Mandatory N/A
Narrative discussion and analysis of performance Mandatory 32–71Trend information Mandatory 32–71Significant changes in nature of principal functions/services Suggested N/A
Performance of purchaser/provider arrangementsIf applicable, suggested
N/A
Factors, events or trends influencing departmental performance Suggested N/AContribution of risk management in achieving objectives Suggested N/A

AUSTRAC ANNUAL REPORT 2014–15APPENDIXES, ABBREVIATIONS & INDEXES 151
Description of information Requirement Page no.Performance against service charter customer service standards, complaints data, and the department’s response to complaints
If applicable, mandatory
76
Discussion and analysis of the department’s financial performance Mandatory 82Discussion of any significant changes in financial results from the prior year, from budget or anticipated to have a significant impact on future operations
Mandatory 82
Agency resource statement and summary resource tables by outcomes Mandatory 146–147Management and accountabilityCorporate governanceAgency heads are required to certify their agency’s actions in dealing with fraud
Mandatory 77
Statement of the main corporate governance practices in place Mandatory 33Names of the senior executive and their responsibilities Suggested 16–19Senior management committees and their roles Suggested 33Corporate and operational plans and associated performance reporting and review
Suggested 75
Internal audit arrangements including approach adopted to identifying areas of significant financial or operational risk and arrangements to manage those risks
Suggested N/A
Policy and practices on the establishment and maintenance of appropriate ethical standards
Suggested N/A
How nature and amount of remuneration for SES officers is determined Suggested N/AExternal scrutinySignificant developments in external scrutiny Mandatory 78Judicial decisions and decisions of administrative tribunals and by the Australian Information Commissioner
Mandatory 78
Reports by the Auditor-General, a Parliamentary Committee, the Commonwealth Ombudsman or an agency capability review
Mandatory 78
Management of human resourcesAssessment of effectiveness in managing and developing human resources to achieve departmental objectives
Mandatory 74
Workforce planning, staff retention and turnover Suggested 145Impact and features of enterprise or collective agreements, individual flexibility arrangements (IFAs), determinations, common law contracts and Australian Workplace Agreements (AWAs)
Suggested 75
Training and development undertaken and its impact Suggested 75Work health and safety performance Suggested 145Productivity gains Suggested N/AStatistics on staffing Mandatory 142–145
INDEXTO ANNUAL REPORT REQUIREMENTS

AUSTRAC ANNUAL REPORT 2014–15 APPENDIXES, ABBREVIATIONS & INDEXES152
Description of information Requirement Page no.Statistics on employees who identify as Indigenous Mandatory 142Enterprise or collective agreements, IFAs, determinations, common law contracts and AWAs
Mandatory 75
Performance pay Mandatory 145Assets management
Assessment of effectiveness of assets managementIf applicable, mandatory
83
PurchasingAssessment of purchasing against core policies and principles Mandatory 83ConsultantsSummary statement detailing the number of new consultancy services contracts let during the year; the total actual expenditure on all new consultancy contracts let during the year (inclusive of GST); the number of ongoing consultancy contracts that were active in the reporting year; and the total actual expenditure in the reporting year on the ongoing consultancy contracts (inclusive of GST). The annual report must include a statement noting that information on contracts and consultancies is available through the AusTender website
Mandatory 84–85
Absence of provisions in contracts allowing access by the Auditor-General
Mandatory 84
Contracts exempted from publication in AusTender Mandatory 84Procurement initiatives to support small business Mandatory 85Financial Statements Mandatory 88–139Other mandatory informationWork health and safety (Schedule 2, Part 4 of the Work Health and Safety Act 2011)
Mandatory 145
Advertising and Market Research (Section 311A of the Commonwealth Electoral Act 1918) and statement on advertising campaigns
Mandatory 85
Ecologically sustainable development and environmental performance (Section 516A of the Environment Protection and Biodiversity Conservation Act 1999)
Mandatory 79
Compliance with the agency’s obligations under the Carer Recognition Act 2010
If applicable, mandatory
N/A
Grant programs Mandatory N/ADisability reporting – explicit and transparent reference to agency-level information available through other reporting mechanisms
Mandatory 74
Information Publication Scheme statement Mandatory 78
Correction of material errors in previous annual reportIf applicable, mandatory
148
Agency Resource Statements and Resources for Outcomes Mandatory 146List of Requirements Mandatory 150
INDEXTO ANNUAL REPORT REQUIREMENTS

AUSTRAC ANNUAL REPORT 2014–15APPENDIXES, ABBREVIATIONS & INDEXES 153
INDEXAaccountability of agency, 14, 78
advertising, 85
aim of agency, 6, 14
AML/CTF Act, 6, 14
exemption and modification applications, 71
statutory review, 23, 33, 42, 63–4
AML/CTF compliance reports, 26, 39–40
AML/CTF domestic risks, 28
AML/CTF framework, reshaping of, 33
AML/CTF obligations
industry awareness, 38, 39
industry compliance, 26
industry understanding, 27
AML/CTF programs, 70
AML/CTF regime
FATF evaluation, 28, 32, 33, 42, 63
statutory review of AML/CTF Act, 63–4
AML/CTF regulator role, strategy, 20
AML/CTF Rules
development and registration, 7, 23, 64
statutory review, 63–4
annual supervisory program, 22, 70
Anti-Daesh Coalition, Counter-ISIL Financing Group, 62
Anti-Money Laundering and Counter-Terrorism Financing Act 2006 see AML/CTF Act
Asia/Pacific Group on Money Laundering, 51
asset management, 83
Audit and Risk Committee, 33
AusTender, 83, 84
AUSTRAC Compliance Guide, 21, 23, 41, 64
AUSTRAC Industry Contribution, 40, 64
AUSTRAC Intelligence (AI) database, 7, 24, 44
AUSTRAC Service Charter, 76
AUSTRAC Typologies and Case Studies Report 2014, 41, 47
AUSTRAL supervisory levy, 40
Australia–Indonesia Security Cooperation program, 57
Australian Accounting Standards, 83
Australian Competition and Consumer Commission (ACCC), 44, 46
Australian Crime Commission (ACC), 43
Australian Customs and Border Protection Service (ACBPS), 43
Australian Federal Police (AFP), 43, 46
Australian Signals Directorate (ASD), 77
Australian Taxation Office (ATO)
data matching, 23, 42
operations for, 28, 67
reports from AUSTRAC, 43
use of AI database, 44

AUSTRAC ANNUAL REPORT 2014–15 APPENDIXES, ABBREVIATIONS & INDEXES154
INDEXBbearer negotiable instruments, CBM reports, 68
Bisotel Rieh, 62
CCanberra Southern Cross Club, 71
case studies
dismantling of international drug syndicate, 53–5
report, 25, 41, 47
Cash Transaction Reports Act 1988, 14
centre of excellence for financial intelligence, 33
Centrelink program cases, 28, 43
change program, 32–3
ClassicBet Pty Limited, 71
Colombian drug syndicate, dismantling of, 53–5
Combating Corruption – Strengthening the Financial System against Money Laundering and Recovering Proceeds of Crime in Papua New Guinea, 29
Commonwealth Disability Strategy, 74
compliance
rectification of non-compliance, 27
reporting obligations, 26
use of remedial powers, 22
compliance assessment activities, 70
consultants, arrangements and engagement policy, 84
contracts
ANAO Access clauses, 84–5
consultancy contracts, 84
exemptions, 84
small business contracts, 85
Criminal Code Act 1995, 49
cross-agency taskforces, 42
cross-border movement reports
bearer negotiable instruments(CBM-BNI), 68
physical currency (CBM-PC), 68
culture of agency, 16
customer due diligence (CDD), 28, 40
cyber intrusions, 77
Cyber Security Performance Audit, 77
Ddata matching, 23, 42
deliverables, 21–5
Department of Foreign Affairs and Trade (DFAT), funding for TA&T programs, 57
Department of Human Services (DHS)
Centrelink program, 28, 43, 67
reports received from AUSTRAC, 43
Department of Immigration and Border Protection, 46
Document Verification Service, 23, 64
Draft guidance note: The Document Verification Service, 64

AUSTRAC ANNUAL REPORT 2014–15APPENDIXES, ABBREVIATIONS & INDEXES 155
INDEXEe-learning programs, 75
education and awareness programs for industry, 21
Egmont Group of FIUs, 51, 60
Eligo National Task Force, 28, 46–9
Energy Efficiency in Government Operations policy, 79
enforcement outcomes, 71
Enterprise Agreement, 75
enterprise bargaining, 75
Environment Protection and Biodiversity Conservation Act 1999, 79
environmental performance, 79
equity, 82
events occurring after balance date, 82
exchange instruments, 51–2
Executive Committee, 33
Executive Officers, 17–19
Executive structure, 15
external scrutiny, 78
FFinancial Action Task Force (FATF), 50
International Cooperation Review Group, 57
Mutual Evaluation Report (MER) on Australia, 28, 32, 33, 42, 63
financial intelligence, proposed centre of excellence, 33
financial intelligence unit (FIU)
exchanges with counterparts, 29, 50, 53–5
international exchange instruments, 7, 25
strategy, 20
Financial Management and Accountability Act 1997 (FMA Act), 82
financial performance, 82
financial profiling, 60
financial sector environment, 14
financial statements, 82
financial transaction reporting to AUSTRAC, 29–30
Financial Transactions Reports Act 1988 (FTR Act), 23
footprint of agency, 33
foreign terrorist fighters (FTFs), financial characteristics, 60
fraud and corruption control, 77
Gglobal CTF efforts, 62
governance framework, 33
H‘hawala’- type remittance system, 48
history of agency, 14
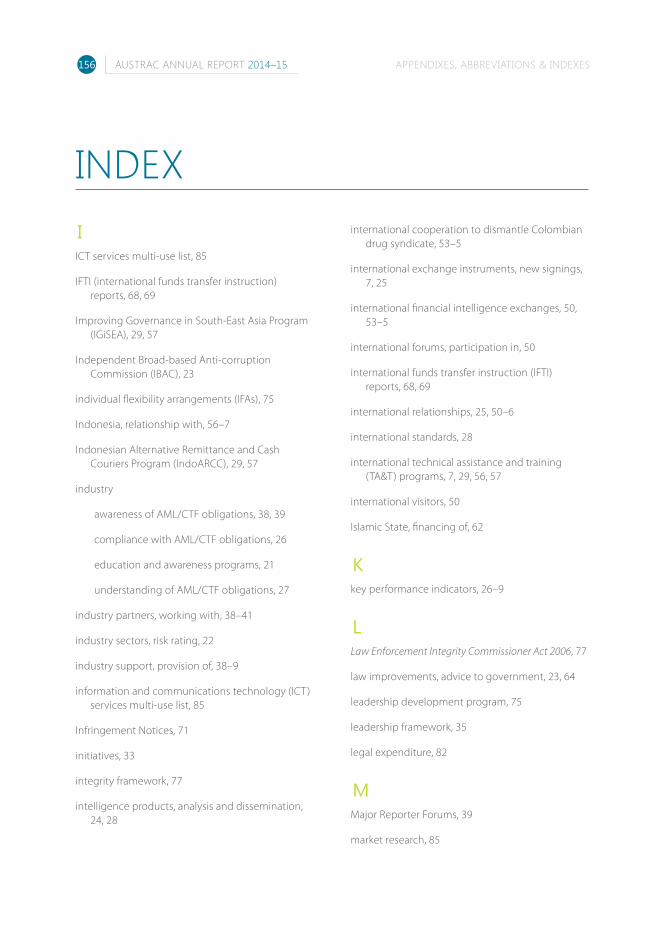
AUSTRAC ANNUAL REPORT 2014–15 APPENDIXES, ABBREVIATIONS & INDEXES156
INDEXIICT services multi-use list, 85
IFTI (international funds transfer instruction) reports, 68, 69
Improving Governance in South-East Asia Program (IGiSEA), 29, 57
Independent Broad-based Anti-corruption Commission (IBAC), 23
individual flexibility arrangements (IFAs), 75
Indonesia, relationship with, 56–7
Indonesian Alternative Remittance and Cash Couriers Program (IndoARCC), 29, 57
industry
awareness of AML/CTF obligations, 38, 39
compliance with AML/CTF obligations, 26
education and awareness programs, 21
understanding of AML/CTF obligations, 27
industry partners, working with, 38–41
industry sectors, risk rating, 22
industry support, provision of, 38–9
information and communications technology (ICT) services multi-use list, 85
Infringement Notices, 71
initiatives, 33
integrity framework, 77
intelligence products, analysis and dissemination, 24, 28
international cooperation to dismantle Colombian drug syndicate, 53–5
international exchange instruments, new signings, 7, 25
international financial intelligence exchanges, 50, 53–5
international forums, participation in, 50
international funds transfer instruction (IFTI) reports, 68, 69
international relationships, 25, 50–6
international standards, 28
international technical assistance and training (TA&T) programs, 7, 29, 56, 57
international visitors, 50
Islamic State, financing of, 62
Kkey performance indicators, 26–9
LLaw Enforcement Integrity Commissioner Act 2006, 77
law improvements, advice to government, 23, 64
leadership development program, 75
leadership framework, 35
legal expenditure, 82
MMajor Reporter Forums, 39
market research, 85

AUSTRAC ANNUAL REPORT 2014–15APPENDIXES, ABBREVIATIONS & INDEXES 157
INDEXmemorandums of understanding (MOUs)
domestic, 7, 44
international, 51, 52
methamphetamine-related investigations, 47–9
ML/TF risk, profiling of, 71
Money laundering by legal practitioners brief, 41
money laundering of drug profits, 48–9
Money laundering in the real estate sector brief, 41
MoneyGram Payment System Inc, 71
MOUs see memorandums of understanding (MOUs)
NNational Disability Strategy 2010–20, 74
National Security Operations (NS Ops), 62
net operating deficit, 82
non-compliance, rectification, 27
Notices served, 71
NSW Crime Commission, 44
NSW Police, 44
Ooperating model, 33
Operations Committee, 33
Organisational Health Committee, 33
organisational structure, 15, 34
outcome strategy, 20
PPapua New Guinea, 29
partner agencies
cross-agency taskforces, 42
data sharing, 43
MOUs, 7, 44
number and distribution, 66–7
reports to, 7, 28
trialling of AI database, 7, 24, 44
use of TES, 44
whole-of-government forums, 42
performance scorecard, 20
PGPA Act (Public Governance, Performance and Accountability Act 2013), 83, 84
physical currency, CBM reports, 68
policy development, 28
politically exposed persons, 23, 40, 64
PPATK–AUSTRAC Partnership Program (PAPP), 29, 56
Privacy Act 1988, 76
Privacy Amendment (Enhancing Privacy Protection) Act 2012, 76
Privacy Consultative Committee, 33, 76
privacy obligations, 76
procurement plan and practices, 83, 85
Procurements and Contracts unit, 83

AUSTRAC ANNUAL REPORT 2014–15 APPENDIXES, ABBREVIATIONS & INDEXES158
profiling
financial profiling, 60
foreign terrorist fighters, 60
ML/TF risk profiling, 71–2
program structure and outcome, 20
Project Wickenby, 28, 45
property management, 83
Protective Security Policy Framework (PSPF), 77
Public Governance, Performance and Accountability Act 2013 (PGPA Act), 83, 84
Public Interest Disclosure Act 2013, 77
publications, 41
purchasing, assessment of, 83
Pusat Pelaporan Dan Analysis Transaksi Keuangan (PPATK), 56
Rregional capacity building, 56
Remedial Directions, 71
remedial powers, use to promote compliance, 22
Remittance Sector Register, 21, 39
reporting entities
AML/CTF programs, 70
enrolments, 7, 38
registration activity, 38
reports to AUSTRAC
number of, 66
results 2014-15, 67
types of, 65, 68
resources, 41
revenue, 82
risk profiling, 71–2
role of agency, 6, 14, 20
Sscam disruption project, 44
SCTRs (significant cash transaction reports), 68, 69
security, risks and controls, 76–7
Security Exchange Commission of Bangladesh, 57
Serious Financial Crime Taskforce, 45
service delivery levels, 76
significant cash transaction reports (SCTRs), 68, 69
small business contracts, 85
SMRs see suspicious matter reports
South Asia, relationships with, 57
South-East Asia, relationships with, 57
staff learning and development, 75
staff performance management program, 75
staff statistics, 7
staff survey, 74
stakeholders, communication with, 41
Statement of Comprehensive Income, 82
Statement of Financial Position, 82
strategic analysis briefs, 41
strategic direction of agency, 14, 32
strategic plan, 33
Strengthening AML/CTF Regulation in South Asia Program (SARiSA), 29, 57

AUSTRAC ANNUAL REPORT 2014–15APPENDIXES, ABBREVIATIONS & INDEXES 159
supervision, annual supervisory program, 22, 70
suspect transaction reports (SUSTRs)
reporting volumes, 65
requirements, 65
to partner agencies, 43
suspicious matter reports (SMRs)
reasons for suspicion, 66
reporting volumes, 65
requirements, 65
terrorism financing, 7, 61
to partner agencies, 43
SUSTRs see suspect transaction reports
TTechnical Assistance & Training (TA&T) programs,
29
terrorism financing
countering, 61–2
methods, 60
offence types, 67
Terrorism financing in Australia 2014 report, 41
TES see TRAQ Enquiry System (TES)
Terrorism Financing Investigations Unit (TFIU), 61
threshold transaction reports (TTRs), 68, 69
transaction reporting
action against non-compliance, 21
increase, 7
responsibilities, 26
volume and quality, 26
Transaction Reports Analysis and Query (TRAQ) database, 44
TRAQ Enquiry System (TES)
availability of, 7, 24
use by partner agencies, 24, 25, 44
TTRs (threshold transaction reports), 68, 69
Twitter, 41
typologies, 25, 41, 47
UUnited Nations Convention against Corruption, 57
Vvision of agency, 14, 32
Wwhole-of-government forums, 42
workplace diversity, 74

AUSTRAC ANNUAL REPORT 2014–15 APPENDIXES, ABBREVIATIONS & INDEXES160
CONTACT USENQUIRIESFor enquiries about AUSTRAC, the legislation we administer, or other related information, contact the AUSTRAC Contact Centre:
• Telephone: 1300 021 037 (local call cost within Australia)
• Facsimile: 03 8636 0508
• Email: [email protected]
• Website: www.austrac.gov.au
For enquiries about the annual report contact [email protected]
OUR OFFICES
SydneyLevel 7, Tower A, Zenith Centre 821 Pacific Highway Chatswood NSW 2067
PO Box 5516 West Chatswood NSW 1515
Ph: 02 9950 0055 Fax: 02 9950 0054
MelbourneLevel 30 140 William Street Melbourne VIC 3000
PO Box 13173 Law Courts PO Melbourne VIC 8010
Ph: 03 8636 0500 Fax: 03 8636 0501
CanberraLevel 2 4 National Circuit Barton ACT 2600
Mail to: AUSTRAC C/-Attorney-General’s Department 3-5 National Circuit Barton ACT 2600
Ph: 02 6120 2600 Fax: 02 6120 2601
PerthGPO Box 586 West Perth WA 6872
Ph: 02 9950 0055 Fax: 02 9950 0054
NATIONAL RELAY SERVICECallers who are deaf or have a hearing or speech impairment can contact AUSTRAC through the National Relay Service.
TTY or computer with modem users: Phone 133 677 and then ask for ‘1300 021 037’.
Speak and listen (speech-to-speech relay) users: Phone 1300 555 727 and then ask for ‘1300 021 037’.
FREEDOM OF INFORMATIONContact details and procedures for applications made under the Freedom of Information Act 1982 are in the ‘Management and accountability’ chapter of this report.
Information is also available on the AUSTRAC website:
www.austrac.gov.au/freedom_of_information.html.