Embed Size (px)
Citation preview

72!-1
18 7 8.
VICTORIA.
AUSTRALASIAN STATISTICS
FOR THE YEAR 1877,
COMPILED FROM OFFICIJ.L RETURNS;
'\I<'ITH
INTRODUCTORY REPORT
PRESEN'l'ED TO BOTH HOUSES OF PARLIAMEN'l' BY HIS EXCELLENCY'S COMMAND.
13!! '!utf)orttv: .JOHN FRRRES, GOVER~~!ENT l'RINTER, MELDOURNE,
No. 69.

730
Preparation-Not given. Printing (1,12> copies)
Al'l'ROXIMATE COST OF PAPER. £ s. d,
26 10 0

CONTENTS.
GENERAL SUMMARY
INTRODUCTORY REPORT
TABLE I.-POPULATION
"
"
"
II.-BIHTHS, DEATHS, AND MARRIAGES
IlL-IMMIGRATION AND EMIGRATION .••
IV.-PUBLIC REVENUE AND EXPENDITURE
V.-PUBLIC DEBT
VI.-IMPORTS AND EXPORTS
VII.-SHIPPING
, VIII.-RAILWAYS AND ELECTRIC TELEGRAPHS
IX.-CROWN LANDS ALIENATED
" X.-AGRICULTURAL STATISTICS-LAND IN CULTIVATION
XI.-"
PRODUCE OF CROPS
XII.-LIV~; STOCK
l'age 5
7
9
9
9
10
10
10
11
l1
11
12
12
Ul
7Hl

7R2

Name o! Colony.
Victoria
New South Wa.lea
Queens!and
South Australia
Westeru Australia
Tasmanin.
New Ze;;hnd •••
NJUne n1 Co!ony.
Victoria.
New South \"\'ales
Queensland
South Ausirnlin.
New Zea.lnnd t
105,34-2 -<
li I
Total Cnltl.va.t:on.
SUMMARY OF AUSTRALASIAN STATISTICS, FROM 1873 TO 1877 INCLUSIVE.
Pollul:l.tion ou the
3tRtDeceruher.''
Pnbllc Debt on the
11n Deeember.~
£ 12,445,7:1.1. IJ,ggo,SSJ 13,9951:93 l7"0lt,J82 l7 10t819I3
ro,S.p..41) 101516,:;;r JI 1470,6j7 Ir,7)9,_)19 II,724,419
2,174·900 1.1989,750 J1j2o,6oo :;,8:;?,100 4.737,200
£ r6,533t856 I 6,953,985 r6,685)S74 I),]Oj,Jj4 r6,.:;62,304
rr ,oSS,JS8 ll 129J,739 l3,490,200 13,672..776 l4,6o6,594
2,88),499 1,g62.439 J,J28,oog J,I26,559 4.o68~68z
2.97.3 2 8 364-,263 349,8A.o j86,o37 j62j707
£ I 5,302,454 I5,44Ifi09 14,766,g74 14-.196.487 rs,rs;,687
165,117 428,837 391,1.17 397,2 93 373.352
89),556
j,Oji 4.9i2 4.55'4 4,16-.t-
775
~~~ . 784 7IJ
+.373 4-,385 4.670 ~)78 2,127,725 4166z 2,237}981
l,151 3)2.,)24 11370 577.·750 I 1699 764,ih r,B49 874.342 2,104 956,8.;.4
1,531 515,640 r,4-4o 534-SSO 1,634 6J 1,381 1~771 73 2 ,330 1,707 6j2,j;6
287 J40,237 I]Z,h7 134,161 154,u6 I5I,IJ3
594
r,s6s 40,150 %'34 93.608
JOj,t67 IOo,I68 ri4.978 10j,855 uo,376 lllt950
:~s,srs
;;;&a; 32 t459
JO /50 JS 763 JS 766 JS 1,159 68 1,567
45 '9' 45 19!
150 396 '72 1 6J5 172! I 754
'%.,389 . z,6jz r:l,66z,6z 5 3,1 56 Ij,116,405 3,!70 lj,6f4-,966 3,307 l.f..,470,52C
Horses. C'.at:tle Sheep.
l80,j4l. 88],763 I I,JZj,o8o J80,2)4. 958f6j8 1l1Z2.I 10j6 196,18+ 1,0)~598 rt,749t5J2
194,;68 I,I28,26) u,z78,893 2.0),150 1;'74,176 IO,ll4,267
jZS,o14 2,7IO,J74 19,928,590 346,691 z,S56,699 2.2,872,8&2 357,696 31J34,o8.S 14-,jh,5}6 ]66,703 3,J3I~Clj 24,503,38& JZ8,I)O :t!746,j85 zo,962,244
99,243 7,2.6&,946 107,507 7,1&0.792 l2lt497 7,ZZ7,774 llJ,62.5 7·JI5,074 140;1/4 6,z;z,766
87,455 s,617,4I9 9J,lZZ. 6,1201 2.11
107,164 6,179.395 106,9oj 6,I3J,29l 110,6&4 6,o98,359
z6,290 748,Sj6 z6,636 777,861 2g,J79 88!,861 JJ,502 899·+94 ;o,691 797,1)6
zz,6n. lJ4·9~·746 2J,10& r,724,953 23,473 1,j31,j2j 2),67.2. l,i68.7S5 22.,195 1,hs,us
9'},859 494J917111',704,8$1
101719.901 l2~91j,666 I),SOO,l44 I9t8S9,6)t 23,86j,j88
1,669,369 J,7j6,414 I,9J2,1'ilo 2.,102/)20 2,55I,6J4.
s.B7S,s69 6,o84,o69 6,374.701 9,044,824" 9,904,0071
l,50i,651 1,593.401 I,64o,396 l 16j61886 1 17J6,:ur
71347t395 8,194,026 9,5t0,6:Z.J
PigL
87,)36 78,ot9
100,)62.
ii ):02,195 104,j27
U3,92.1
• Where rusterisks oeeur the info:rma.tion l:.:'ul not boon ruru:shed.
: i~~:~~l~~ ~;~ds ~~~le~e.;:~~.:'::ftt !~tt}:~i~~~~~N:V .1f~~be ~~:;es e:tcept tresie.rn Aullta!L\1, \i.·bm gh:·Ml !orhtte la lncluded with hay, and New Zealand. ~t footnotC!I (t RId 7) tO 'Til.ble X.,po5L
: ~ci~;1Wa~n~1~~0r':t~0o;e0~!!~ :~~~e~:tt;~e11~/J1 t:t~~c,1~~t"~· other co~ooic~ itt claned with cetn tonge, i~t r.ot ctmdl!ted aa tlnder eultlntlon. See footnote t7) to Table L, fad•
for whitl! IUeb

INTHODUCTOHY HEPOH1~.
On'ICE OI<' 'rHE GovERNMENT STATIST,
Melbourne, Ist November I 878.
I have the lwnor to forward herewith the Au:stralasiau :Statistics tor the year 1877, preceded by a summary of those statistics for the quinquennial period ended with that year.
2. The Governments of the neighboring colonies were on the present occasion, as usual, requested to send their respective contributions to the Australasian Statistics by the 3oth June, and the possibility of the information being made ready about that date was proved by the circumstance that a few days thereafter a sheet containing almost similar particulars relating to Victoria was forwarded to the only one of the other colonies which publishes statistics of the group.
J. It was, however, found necessary to make repeated applicntions to several of the other colonies before they coulJ be induced to make the necessary effort to furnish the returns. From the resp0ctivc colonies these were t-ventually received at the following dates :-
'V cstem Australia New Zealand Queensland Tasmania New South 'Vales South Australia
24th June. I 5th July. 29th .July. Joth July. 11th October. 22nd October.
4- The compilation of the returns having previously been advanced as much as possible, no thnc was lost, :.:~Iter the receipt of the last statement, iu completing the tables and forwarding the whole for publication.
5· The latest of the statements fortunately arrived in time to admit of the figures being inserted in the Summary of Australasian Statistics attached to the Victorian YeaT-Book, I 87 just published. Throughout the pages of that work ample comments on the returns of the previous year wi11 he found distributed, and in the next issue I hope to dcnl no lt>ss exh:mstin·ly with the f~wts embodied in the following tables.
I have the houor to be, Sil',
The Honorable the Chief Secretary, &c.: &c.: &c.
Your most obedient servant,
HENRY HEYLYN HAYTER,
Government Statist.
7Rfi

7Rn
AUSTRALASIAN STATISTICS, 1877.
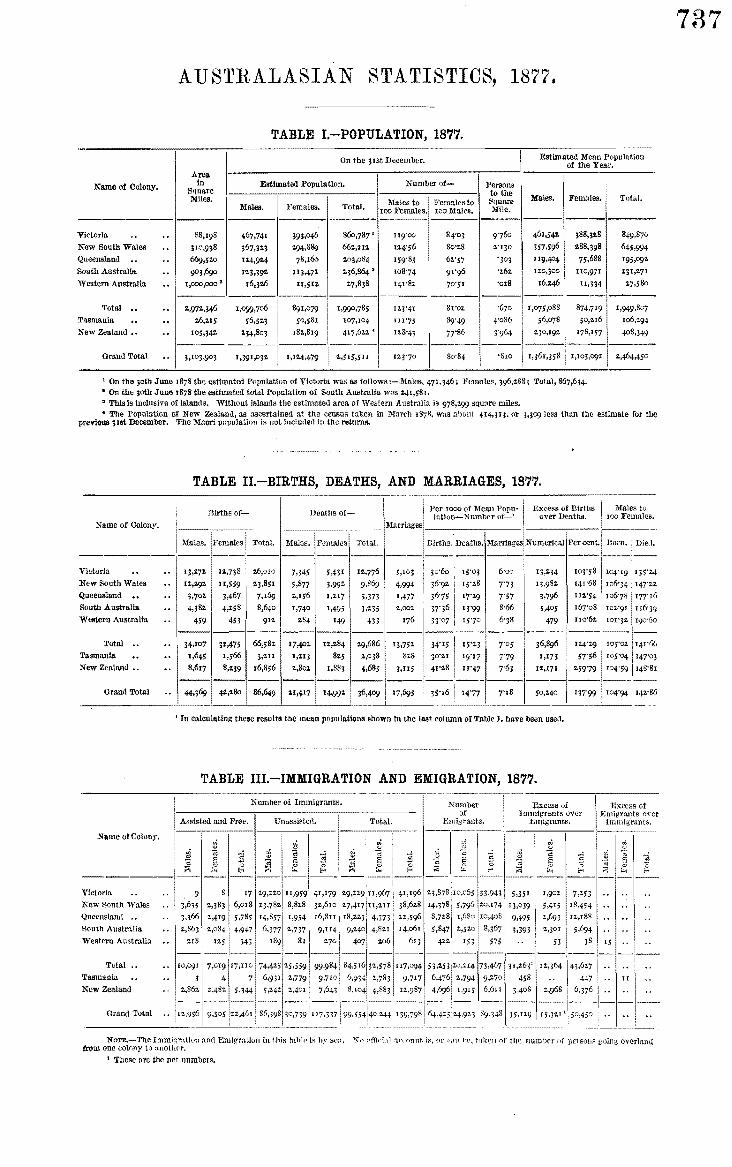
TABLE I.-POPULATION, 1877.
On the )tat December. Estimated Mean Population of the Year.
A reo. Persona • Name of Colony. In Estimated Population. Number of-
Square to the l\IIlea. Males to Females to Square :Males. Females. •
Mal ea. Females. Total. too Females. 1ool\l.nlea. Mile. -------- -------- -----Victoria .. .. 88,198 467,741 393,046 86<>,787' 119'00 84'03 9'76o 461,54'/- ;88,)2.8
New South Wales .. 310,938 367,3:1.3 :1.94.889 66z,211. 1:1.4')6 8o'1.8 •. 130 357.596 ?.88,398
Queensland .. .. 669,5:1.0 12.4,9:1.4 78,r6o 1.0j,084 159'83 61'57 'J03 I19,404 75,688
South Australia .. 903.69<> 1•3.39' 11347• 2.36,864. 108'74 91'96 '1.6:1. U.0,300 110,971
Western AustrallD. .. r,ooopoo:J 16,;::.6 u,;n :1.7,838 141'81 7o·sr ·o•8 !6,::.46 11,334
Tot!\! .. .. :1.,97•,346 1,099,7o6 891,079 1,990,785 lt3'4l 81'02 '670 1,075,o88 874.719 Tagmania .. .. ::.6,?.15 56.523 50,581 I07,I04 111'75 39'49 4'086 ;6,o78 I 50,.16
New Zealand .. .. 105,34:1. :l.J4,80j 18?.,819 417,62.2 <!' 128'4> 77'86 r964 2JO,I91; 178,157
Grand Total .. ),IOJ,903 1,391,032.
•
1,12.4,479 2.,515,511 12.3'70 80'84 •810 1,)6I,j58 11,103,091.
' On the 30lh June 1878 the estimated Population of VIctoria was as follows :-Males, 471,346; FcmnleB, 396,::.88; Total, 867,634· • On the 30th June 1878 the estimated total Population of South Australia wns 2,41,)8!. ' Thlsls Inclusive of Islands. Without islands the estimated area of Western Australia is 978,2.99 square miles.
Total.
849,870
645.994
195.09• 2.)1,2.71
•7.580
1,949,807
106,29-!
408,349
::.,464.450
• The Population of New Zealand, as ascertained at the census taken in l\fm-ch 1878. wns abont 414,JI3, or 3.309 loss thnn the estimate for the prevlOUSJISt December. The Maor! popuJatio11 iR not lnclmlefl In the return.•.
TABLE 11.-BIRTHS, DEATHS, AND MARRIAGES, 1877. ---------------,---········------·-··--;--··-····-----;---------
Births of- Deaths of-Name of Colony.
Victoria IJ,2.72. 12.,7J8 z6,oro 7.345 5.431 12.,776 5,10) 6·oo 13,~34
New South Wales 1:1.,"'92. 11,559 •;,851 5,877 3,992. 9,869 4,994 7'73 13,98:1. Queensland 3,702. ),467 7,169 2.,156 1)2.17 3.373 1,477 7'57 3,796 South Australia 4,)82. 4,•58 8,640 1,740 1,495 ),2.35 z,oo:. 8·66 5,405
Western Australia 459 453 9U 2.84 149 433 6•38 479 II0'62
---------Total .. 34.107 31,475 66,582. 17,402.
______ I __
7·05 36,896 I 12.4·29 Tasmania 1,645 1,566 J,Z.II 1,'1.1] 7'79 1,173 ' 5T56 !'few Zealand .. 8,617 8,2.39 16,856 :z.,Soz 7'63 12.,171
---------- -----Grand Total 44.369 4'/-,<.So 86,649 u,.p7
' In calculating these results the mean pojlnlations shown In the last column of Table I. have been userl.
TABLE III.-IMMIGRATION AND EMIGRATION, 1877.
Number of Immigrants,
Assisted and Free. Unassisted.
Name of Colony.
~ Vlctor:---•• --.. -~--9 New South Wales I 3,635 Queensland . . , 3, 366
South Australia
Western Australia
Total ..
Tasmania
New Zealand
Grand Total
17 ::.,383 6,or8
2,419
Total.
Number of
,gmigrants.
"' '" '2
" § 15
"" "' 33.943 :1.0,174
I,68o 10~408
2.,52.0
Excess of Immigrants over
}..:.migrrmtfl.
m ~
'" " ~ "" § "' ~ ~ "' s,JSt 1,902 7,25)
13,039 5,415 18,454
9.4951 2,~3 12,188
3.393 I :1.1)0!
1 Males to : too li'emales.
NOTE.-The Immi;:;rntton nnd l~m1gratlon in lhiR tnhlf' Is hy scrr. ~o r•ffidal n,econnt. i~<, 0r l';ln ht~. t:1k('n nf t1J(' numl;er of 11erson~ going- overland ttom one colony to anotlwr.
' These ore the net numbers.
737

10 AL"STRALASIAN STATISTICS, 1877.
TABLE IV.-PUBLIO REVENUE AND EXPENDITURE, 1877.
PulJlie Hevcnuc. l'l~r Head of 'Mean Population.'::
Xamc ol Colony. ··-~~~--~···--·-----·-
Taxation. Total I E rt -... JtevC11::_ ~~
d. £ "· d. I £ s. d. Victoria" ••• : 3oth .Tune "·953,192' 2 2' 5 12 6~ 5 3 10 I
:Xew South Wales ···)JISt Dec. I,2J5,021 •h5IJ,224 I I8 2} 8 17 11·~ 7 3 3l Queensland ... 3oth.June 6o9,861 826,721 5 2! 7 13 6" 7 7 9i T
South .Australia ... 3ISt Dec. ·~99,88 5 9•J.I,516 3 2-' 6 4 7i: 6 4 Ioi , Western .Australia JIStDec. 81,286 84,12.6 18 I I i 5 I<j II?J 6 12 8
-----Total 9,318,779 IJ,$Ij,5I7 3 5} 6 I<) I I~ 6 4 2}
'fasmania 4 6~ 3 8 oil 6 4~: New Zealand ... 5 9i: 9 11 9! 9 7 2!
----- -----Grand Total 7 2g· 7 si 6 12 2~
1 The amounts in this column arc marle up of Customs duties, cxclush-e of duties on the export of gold, druwbacks, &c.; also of excise duties, !nc1udtng licenses Imposed for revenue purposes; stamps~ nther than those for fees of office; lrgaty, sucees:;ion, and probate duties; property nnd income taxes; antl auy other impost, payable to the General Government, levied distinctly ns n tax; but cxcludlng ft>e"t licenses, aud chargeR for special services rendered.
!.l In cnleulnting the so amounts the a~eragc population of Victoria tluring the year ended joth ,J unc 1 877 (8 39,493) and tho population of Queensland on the rst ~January 1877 (t871IOO) ha.ve been taken~ For the ut her colonies: the figures o[ menu po}mlatiun shown iu the last (';Olumn of Tuble I. have bel'll used.
3 A<'eording to n. return made up in the Treasury, hut not audited up to the time of' this going to pressJ the flgurea for Victoria during the year ended 30th June 1878 were as foUow:-Rcvenuc raise<l by taxation, £1.711.,9H; revenue not so raiscU, £1.,791,462.t total revenue, £4,S04t4IS; total t~xpeuditurc, £4,614,448. The estimated mean populati<>n durlng the :o.a.mo period was 85912.35; lhercf'ore the rcvmme per head wns £; 4S~ I*l.; Uw •·xj>enrliturc J>Cr lleatl was £s 7•· Jo~d.; and tllo taxation per llmtd wos £1 198. IO~tl.
1 ()f this nmori'nt £ztC,IJ9 00nslsted of reconps from lonns of Pxpenditnre prc·donRly dt'frayrd {lnt of vot('f'.
TABLE V.-PUBLIC DEBT, 1877. --.~~---·~- -- -·------·-·---------
Same of Colony.
~--·-····---~·
Victoria" New South Wales Queensland South .Australia ·west ern .Australia
Total
Tasmania New 7-ealand •
Grand Total
On tbc 31st December.
Totru Amonnt of lnde1Jtedncss per Hentl o! flublk Debt. l)O})UlatiOll. 1
.£ .£ ,..,., tl . 17,0I8,913 I9 15 s I I,72•J.,419 17 14 Ik 7,68 5·3 so 37 16 Ioi +,737,200 20 0 0
161,000 5 15 s
4I,326,S82 20 IS 2{
I .ss9,705 14 !6 Jot 20,691,I 11 49 IO IO'f
-----63,607,698 2.S 5 gs.
4
1 111 calculating thes:e result$ the potmlations on the }1St December shown in the finh t'o1umn of Table L have been m;;cd.
' On the JOtll June 1878 tile Public Debt of Victoria was £t7,ou,o6s. At the same date the estimated population was 867,634. The nmount of hHiebte<lness per beml was thus £19 us. 4~d.
• The Investetl Sinking Fnn<l of New 7.tenlaml flmQnntcll on the Hft l)('fi'mher to £t,4J~J\1~· Tllf' tntnl clrht :-:lt<Hll<l tltPrefore be re(lueml bs thnt amount to show the net linbi\it.,-.
TABLE VI.-IMPORTS AND EXPORTS, 1877.
Total Value o{--I
Value per Hen<J of )lean Population of- 1
:s'nme of Colony. ! Tmports. F.xport~. ]~nth. Import<:~. Exportf!l. lloth.
£ .j; .£ £ .... d . £ ..... d. £ s. d. Victoria I6,J62,J04 I 5,157,687 ,';!, 5 I ~h99 I I9 5 o;! • 16 8' , 37 I 9 New South Wales q,6o6,594 I J,I25,819 27,732,413 22 n 2~- 20 6 4~ 42 IS 7! Queensland 4,068,682 4,361,275 8,429,957 20 17 I _I 22 7 It 43 4 2! ~
~outh Australia 4,625,5I I 4,626,53I 9·252,042 20 0 0 20 0 I} 40 0 I1 we~tern AuRtralia 362,707 373.352 736,059 I" o' I3 10 8~ 26 I3 9 ·' ·(
Totttl 40,0Z5,798 37,6++,664 77·670.462 20 10 6~ 19 6 I:} 39 I6 8~
Tasmania I,J08,67I 1,4I6,975 12 6 3 13 6 7} 25 I2 IOl New Zealand 6,973.4I 8 6,327,472 17 61 15 9 IO~· 32 II s:t
Grand Totn.l 48,3o7,887 45,389,II I I9 12 oi IS 8 4t 38 0 4i

AUSTRALASIAN STATISTICS, 1877. 11
TABLE VII.-SHIPPING, 1877.
Inwards. Outwards. Total.
Name of Colony. -~----- ---
Vessels. Tons. Vessels. Tons. Vessels. Tons.
------------------- ---------- -------- --------------Victoria ... ... 2,192 939,661 2,219 935.324 4.411 1,874.98 5 New South Wales ... 2,361 I,IJ6,2o6 2,301 1,101,775 4,662. 2,237,981 QueE-nsland ... ... 1,055 490,077 1,049 466,767 2,104 956,844 South Australia ... 864 340,201 843 332,575 1,707 672,776 Western Australia ...
~-~-73.~ 148 77·537 I 290 151,133 ------~------ -------,---
Total ... ... 6,614 2,979.741 6,56o 2,913,978 [ 13,17+ 5,893,719
Tasmania ... ... ; 678 159.308 68o 160,209 I 1,358 319,517 New Zealand ... ... 1 812. 388,568 848 400,609 1,66o 789,177
r---~--- ------------~---.-Grand Total ... I 8,104 I 3,527,617 8,o88 3.474.796 I 16,192 I 7,002,413
TABLE VIII.-RAILWAYS AND ELECTRIC TELEGRAPHS, 1877.
On the 31st December.
Number of Miles of Railway. Number of Mlleo of Electric Telegraph.
Name of Colony. i Line (Poles).
Open I In course Total. Wire Open. of ConsLructlon. In course
Open. of Construction. Total.
--~--- ------- ------ -------- -------------
Victoria ... ... 9501 ! 193 1,143 2,885 44 2,929 5,200 New South Wales ... 643 217! 86oi 6,ooo 1,758 7.758 9,761 Queensland ... ... 357 168 52.5 5,0J3 . .. 5,0J3 6,778 South Australia ... 328 404 732 4,061 lOO 4,161
I 5. 153 Western Australia ... 68 25 93 1,567 ... 1,567
I 1,567.
-------- ------ ·------ -------- ------------~----Total ... ... 2,346 1,oo7i 3.3531 19,546 1,902 21,448 ! 28.459
I
Tasmania ... ... 172} . .. 172~ 754. 55 809 I 976. New Zealand ... ... 954 219 1,173 -'""--- _....:..:..:_ __ 3,307 I 7,5JO ------ ------- ------
---::~!----;,~ Grand Total ... JA-72~ 1,2.2.6!} 4·699! 23,607 1,957 I
1 Consisting of 174 miles of double and 776 miles of E~lngle line. s The number of miles of tDif'e in Western Aufltralia has not beE"n returned. It has therefore been assumed to be equal to the number or miles or line. s Including 133 mlles of poles and wire belonging to the Main Line Rallway Company.
TABLE IX.-CROWN LANDS ALIENATED, 1877.
Acres Granted and Sold. 1 Amount realized on Land Sales.
'-- ------------- --- ---------- --.----------- i I l Total. Averaue per Acre " I Extent
.Name of Colony. Area In 1 I • · 1 Unalu~ua1ed at Statute Acres. 'll'rior t D rin' ---- - tnd of 1877· 3 0 u g 1 'l'ota!. I ' I
I 187.'· l877. 'I I Prior to During 1
1
l'rlor to l Durln~ I I ' I 1877. I 1877. Total. 1877- 1877-o Total. :
------1--------1------------'--1 I I £ I £ I £ £ '· d. I £ •· d. £ •· d. I ne• es.
Victoria .. 56,446,7:2.0 10,8'2.7,779 32.3,341 11,151,1'2.0 118,001,113 375,494 118,376,607 I 13 3 I I 3 3 I 1'2. II! 45,2.95,600 New South Wales 199,0oo,ooo 23,301,566 3,933.596 27,235,162
1
19,889,651 \3,976,q7 123,865,788 I o 17 o£ I 1 o 24 o 17 6! 171,764,838 Queensland 428.492,8oo 2,o6o,322 655-152 I 2,715,474 2,1o2,62o 449,oq 112,551,634 I o 5 I o 13 8~ o 18 91 425,777,326 South Australia 578,361,6oo I 6,839,236 638,675 I 7.477,911 9,044,824 I 859,183 9 904,007 1 6 5~ 1
I 6 10:t 1 6 5'l; I 570,883,689 Western Australia ~,ooo,~ 1,968,~ ~~I 1,988,~ __ * _____ 7,~ 1 __ • __
1
__ *_ ~~ __ *_l~38,on,983
Total 1,902,301,120 44.997,090 5,570.594 so.s67,684 • • 5,667,062 I .. . . I 0 4 . . I 1,851,733.436
Tasmania 16,777,6oo I 4,051,815 39,836 I 4,0<J1,651 1,676,886 59,335 \1,736,221 I o 8 3! I 9 94 o 8 Si , 12,685,949 New Zealand I 67,418,88o lq,644,966' 825.554 14,470,520 8,194,026 1,316.597 ' 9.510,623 I o 12 o 1 11 !Of o 13 1~ i 52,948,36o
~rand TotalJ-~986~~~93,871 --~4~5,984 1
1
6<J,129,;; --_-__ =-~~-4:·994 :---~--- -~-~-~ ---~·~~6~ 1 The flgures for Yictoriu do not include lund of which the purchase was not completed, which mwmnted at the end of 1877 to 7,055,045 acre!:!.
'rhe :figures for New .South 'Yale~ antl Hontll Au!:ltruliu. do include such lo.ud, but tbe urta hus not been given. l>ortion of this land might revert to the Crown in consequence of non-fulfilment of conditions, &c.
~ To compute the amounts in these colunms the money realized ho.s lJeen divided by the sum of tlJe acres granted and sold. 'fhe amount:-~ therefore express the average price realized for all the laud paned willl, inclulliug not only tllat for wh1ch money wus paid, but that which wa.!:l gruutcd without payment.
3 In Victoria the land in process of alienation is included under this head. See note 1. " Including not only the extent ulienuted out of lauds ul·qaired by tile Crown, but, 1,371,470 acres of confiscated land!:! also solll or otherwise
disposed of. • Where asterisks occur the information has not been furuished, or is incomplete.
No. 69. B
73!)

740 12 AUSTRALASIAN STATISTICS, 1877.
TABLE X.-AGRICULTURAL STATISTICS, 1877-8.-LAND IN CULTIVATION.
•.• 'l'llc Agricultural. Stati~Hes In most of the colonies are collected jn the months of Fcbrunry a.cd ~fnrch of each year. The present returns nrc for thosEmonths of 1878. In {'U.lculating the rates of tiUagc JX:r head the population at the 3 rst. December 1877 ha.s been taken.
Ntttnber of Acres under Tillage. Number of Acres under-
Xame of Colony. Per Head
Total, of Wheat. Oats. Barley. :Maize. Hay.
Victoria I 1,420,502 New South Wales , S+6,ss6 Queensland ! 105,049 South Australia x,828,II5 'Vcstern Australia 50,591
Total 3.950,813
Tasmania 348,84I New Zealand 959.528'
Grand Total 5,259,182 2'09
1 Including be8..ns and pensc, except in the case of !>.~w South Wales.
Vines.
103,20)4
JO,J6I'
2+5I 3" 375·430
594
534,103
11 In addition to crops sown for the purpose of being cut green for cattle this column contains the following areas laid down in pcrmt~ncnt artificial grass in the colonies named :-Victoria, }18~-197 acres; New South Wales, 49~469 acres~ South Australia, :14175'1 acres; Tasmania, 1!8,711 aeres.
3 In the returns of some of the colon1es this column embraces lnnd in fallow as weH as land under crop. The follo"Wing nre t11c nrea.s in fallow included in the returns of such colonies :-Yictorin., 75,675 acres; Queensland, 5,158 acres; South Australla, JS6,SIS acres; Tasmanla, '-S.469 acres; New Zealand, '-7Z.,6o5 acres.
"' InclmHng 785 acres under turnips, carrots, parsnips, cabbttgn, ·and beet, which produced1 4,618 tons; 1,)10 acres under mnngcl wurzel, which produced 1S46S tons; 8r6 acres nndcr onions, which proitucP.d J,o;; tons; 1,317 acres under tobacco, which produced 15,82.7 cwt.; 2.74ncref!. under hope,. which proliucell 218 848 lbs.; 1,846 acres und~r grass seedst which produced 28,840 bushels, &c.
~Including 7,o67 acres unfler sugar.cnnc, ot whlch 3,132 acres were productive, aud yielded lS0,744 cwt. of sugar; sz acres under arrowroot, which produced 83,554 llJs.; and 399 acres under tobacco, which produced 3,049 cwt.
c Inclu(ling I:5,Z1o acres unt1er suJ,::nr-canc, 100 acres under arrowroot, 376 acres under bananas, 16o acres under oranges, 170 acres under pineapples,._ 1.76 acres under cotton, 53 acres under tobacco.
for New Zealand tbc land under permanent artificial grass, amounting to -z.s6J,749 acres-of which I,OJ!t,364 acres had been, and not been, prcviou8ly ptoughrd-is not entered ns green forage, ot• included in the total area under tillage, as in the other coionies.
it would briug the land undt!r tillage up to 3,52.3~:t77 acres, or to 8·44 ncrcs per head of the population.
TABLE XL-AGRICULTURAL STATISTICS, 1877-8.-PRODUCE OF CROPS.
I I :Bushets raised of- Tons raised of-
Gallons Name of Colony. of
Whent •. J I Other Wine tnade.
Oats. Barley. Maize. Cereals.1 Potatoes. Hay. .. -··- ·-
:1.,040,486 l Victoria ... . .. 7,oi8,257 i 378,706 I 22,050 25o,8 59 II),419 207,251 4 57.535 New South Wales ... :1.,445.5071 358,853 : 99,48 5 3,551,8o6 33,309 34,958 154,076 708,431 Queensland ... ... 92,941 748 1 10,758 I 1,z62,o18 ... 8,778 12,9I9 87,051 South Australia .•• ... 9,034,692 42,039 I 143,586 ... 46,Z78 I I 3,45:1. :1.53.374 339,:1.77 Western Australia ... :1.)1,174 18,o6o ' 77,324 920 8,789 708 t8,o1J ...
Total ... . .. I8,8p.,)71 2,460,I 86 709,859 4,836,794 339,235 173.315 645,633 '·592,294-
Tasmania ... . .. 846.420 488,350 86,840 ... 90,104 :1.7,106 3 3,3 3 I .. . New Zealand ... ... 6,336,369 6,029,962 576,8:1.3 ... . .. 94·478 5s,671 .. .
Grand Total ... 26,o25,36o 8,g78,498 1,373,5:1.2 4,836,794 429,339 :1.94,899 737,635 I,592,294
BusheLs per Aere of- Tons per Acre of-
Name of Colony.
Wheat. Oats. Jlarley. Maize. Other Ce,..,.ls.' Potatoes. Hay.
Victoria ... ... 12'41 19'39 19'8 I 18'15 13'66 3'II 1'17 New South Wales ... 13'84 19'3 I I9'68 33'66 2274 2'52 1'22 Queensland ... ... I0'63 IO'II J6'86 28'22 . .. I'91 I'30 South Australia ... ... 7'76 II'96 11'97 ... 12'08 :1.'51 1'I 3 Western Australia. ... II'Oo I4'00 IJ'OO 20'"00 Il'OO z•oo t•oo
Total ... ... 9'73 19'12 16'6I 31'93 13'64 2'83 1'16
Tasmania ... ... 18'IZ 22'32 20'28 I ... I5'39 3':1.5 1'13 New Zealand ... ... :1.6'03 31'68 25'40 . .. ... 5'38
i 1'30
Grand Total ... 11'69 26'34 19'69 I 3 I'93 13'97 ns 1'17
' Iucludiug beans Q.nd pease except in the cnsc of New South Wales.

AUSTRALASIAN STATISTICS, 1877. 13
TABLE XII.-LIVE STOCK, 1877-8.
•.• '!'be Live Stock Btatlotica in mos~ of the colonies are collected with the Agricultural Statistics iu the months or :February ud l!arcb. The present returns sre for those months of 1878.
Name of ColOIIY.
ictoria' ... ew South Wales
V N Q So w
ueenaland ... uth Australia eatern Australia
Total ... asmania T
N ...
ew Zealand ~ •••
Grand Total
~-
Horses. Cattle.
-···
... 203,150 1,174,176 ... 328,150 2,746,385 ... 140,174 2,299,582 ... I 10,684 230,679 ... 30,691 52,057
. .. 812,849 6,5o2,879
... 22,195 u6,882 ... 99,859 494.917
... 934>903 7·124,678
Number of-
I Sbeep. Pigs. I Total.
10,II4,267 183,391 u,674,984 20,962,244 191,677 24,228,456 6,272,766 52,074 8,764,596 6,o98,359 104,527 6,544,249
797,156 18,942 898,846
44.244.792 550,6II 52,III,I31
t,S18,n5 55,657. z,o22,854 II,7o4,853 123,921 12,4:1.3.550
57.767,770 730,184 66,557>535
' The returns of Live Stock in VIctoria ate pattlally derived from estimates, which can only be verified at a general censUL • The uumben ef Live Btoel< in New Zealtuld are those returned at the census taken on the 1s' March, 1874-
By Authority : JonH FERBEs, Government Printer, MelbourDe.
Total Number of Stock of
all Descriptions to tbe Square Mile.
132'37 I 77'92
13"09 7'24
'90
17'53
77'16 ll7'94
l 21'44
741