Embed Size (px)
Citation preview
Australia & NZ
Disability Income Experience
This paper was written by Edward FabrizioDeputy General Manager and Chief ActuaryGeneral Reinsurance Life Australia Ltd for ICA 2006 and updated by Brent Walker for IAAHS Cape Town 2007
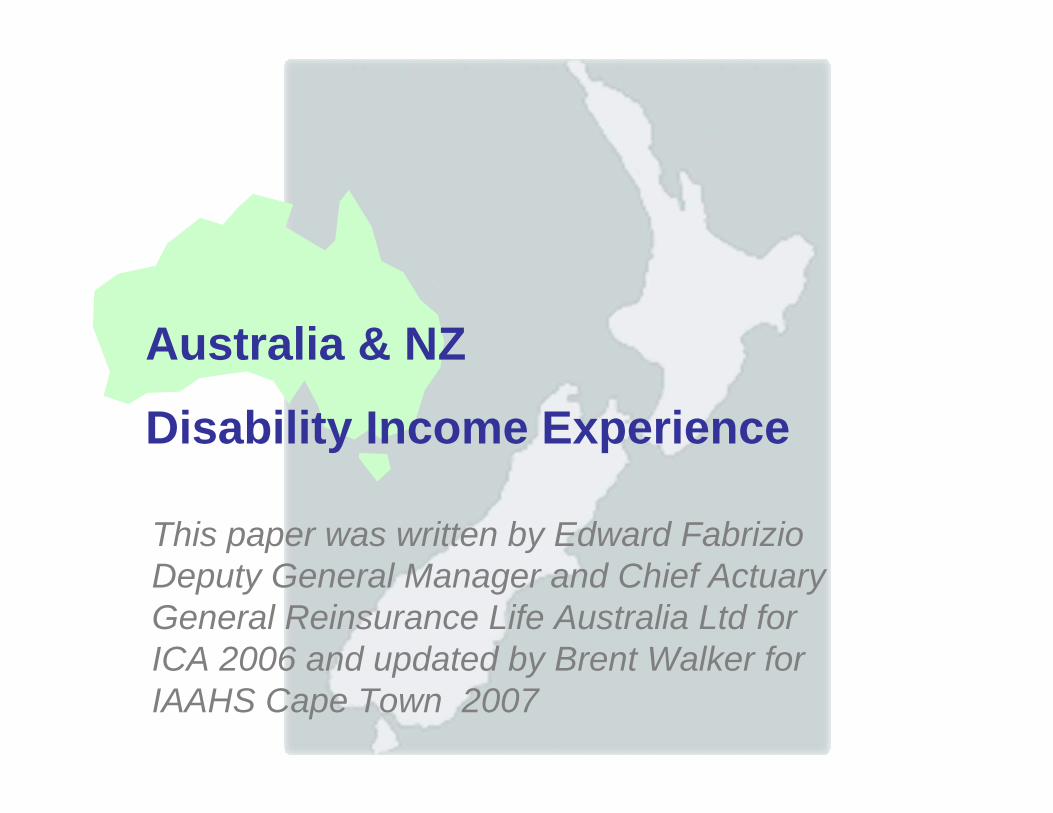
Australian & NZ Market
• Benefit is a monthly annuity style benefit whilst person remains disabled
• Benefit based on income at time of underwriting (generally to max of 75% replacement) and is taxable
• Majority (90%) is annual renewal business (age rated based on age at renewal)
• Non-guaranteed rates
• Full offset if person earns income whilst disabled
• Agreed Value and Indemnity benefits are available
Australian & NZ Market
• Most common deferment periods are 30 and 90 day
• Benefit period is generally to Age 65, but 2 and 5 year periods also common for blue collar workers
• Many extras added :
– Hospital benefit (pays benefit whilst in hospital during deferment period)
– Rehabilitation benefits
– Payment of minimum benefit period on certain accidents / illnesses
IAD 89-93 Standard Table
• Experience Reports for Australia and New Zealand are done on basis of comparing actual results to a standard table – IAD89-93
• IAD89-93 developed by the IAAust based on the Australian disability income experience for this period
• Incidence rates graduated by age/sex and 4 occupation classes
• Termination rates based on % of the US CIDA85 termination rate tables
IAD 89-93 Standard Table
• 4 Occupation classes
– A : Professional and white collar
– B : Other sedentary (light manual technical)
– C : Light Manual (qualified trades persons)
– D : Moderate to Heavy Manual
Australian Experience
• WARNING
Experience results presented for Australia are preliminary. A final report has been written but is not yet published. Generally, the final report results show slightly more favourable trends that those indicated in this paper.
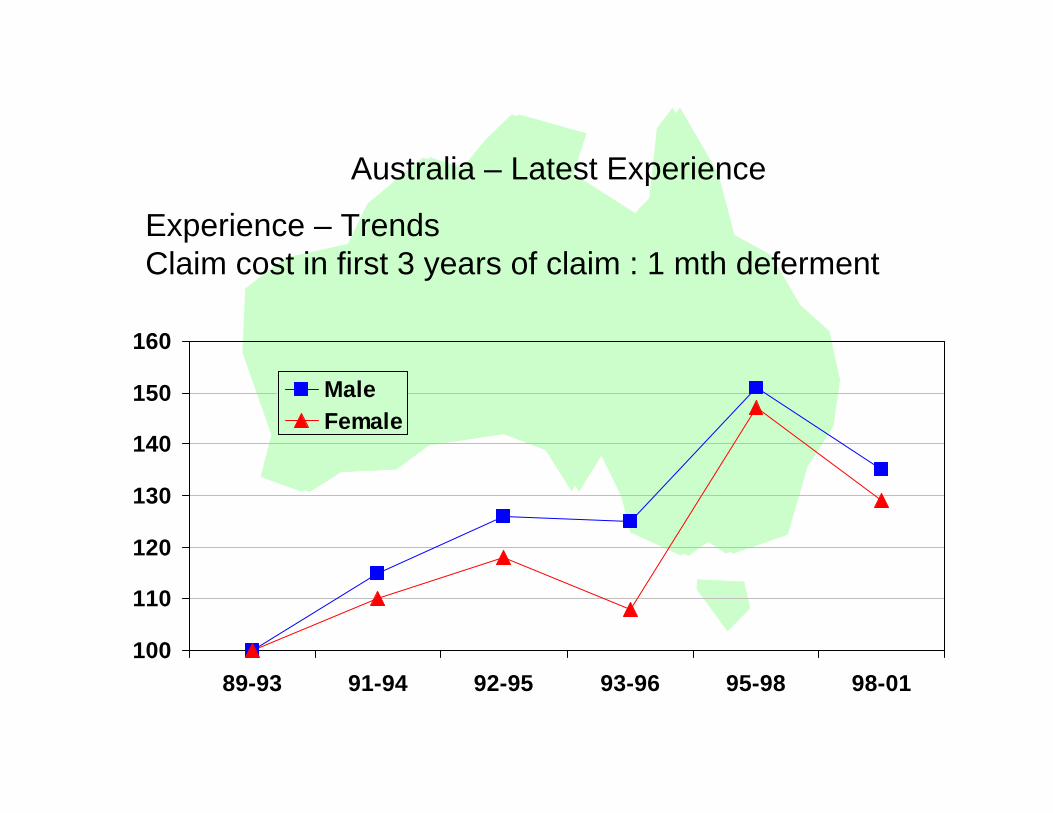
Australia – Latest Experience
Experience – TrendsClaim cost in first 3 years of claim : 1 mth deferment
100
110
120
130
140
150
160
89-93 91-94 92-95 93-96 95-98 98-01
MaleFemale
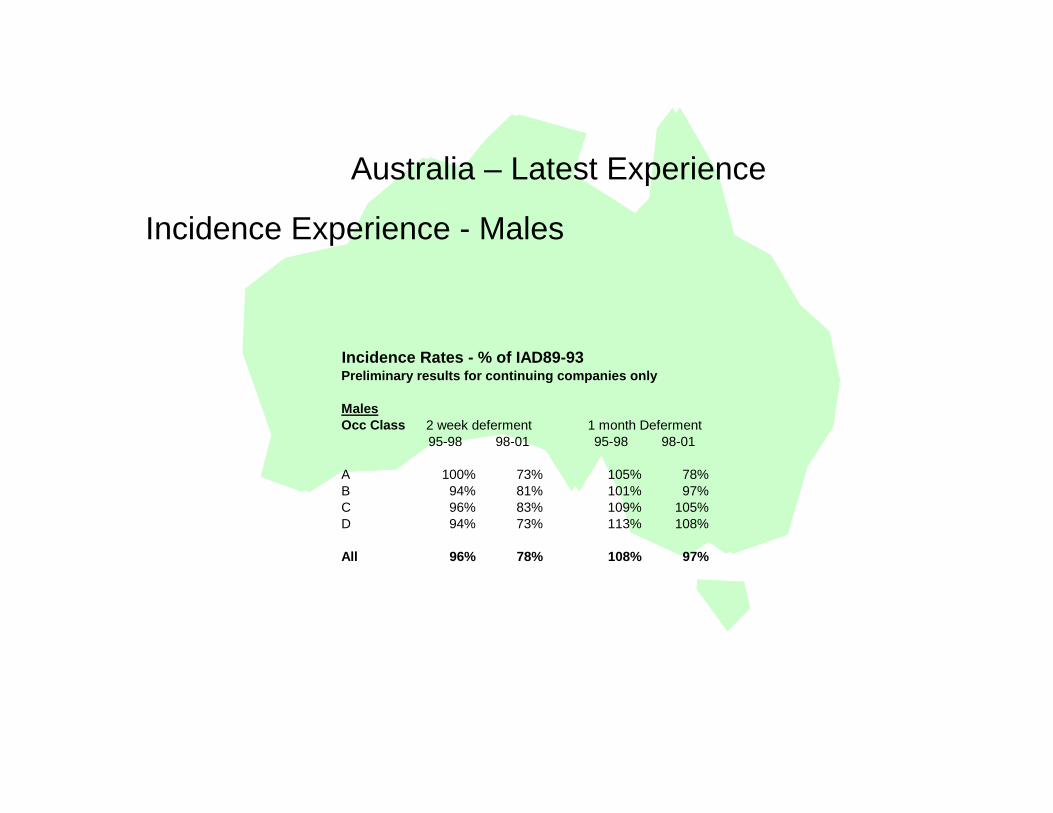
Australia – Latest Experience
Incidence Rates - % of IAD89-93Preliminary results for continuing companies only
MalesOcc Class
95-98 98-01 95-98 98-01
A 100% 73% 105% 78%B 94% 81% 101% 97%C 96% 83% 109% 105%D 94% 73% 113% 108%
All 96% 78% 108% 97%
2 week deferment 1 month Deferment
Incidence Experience - Males
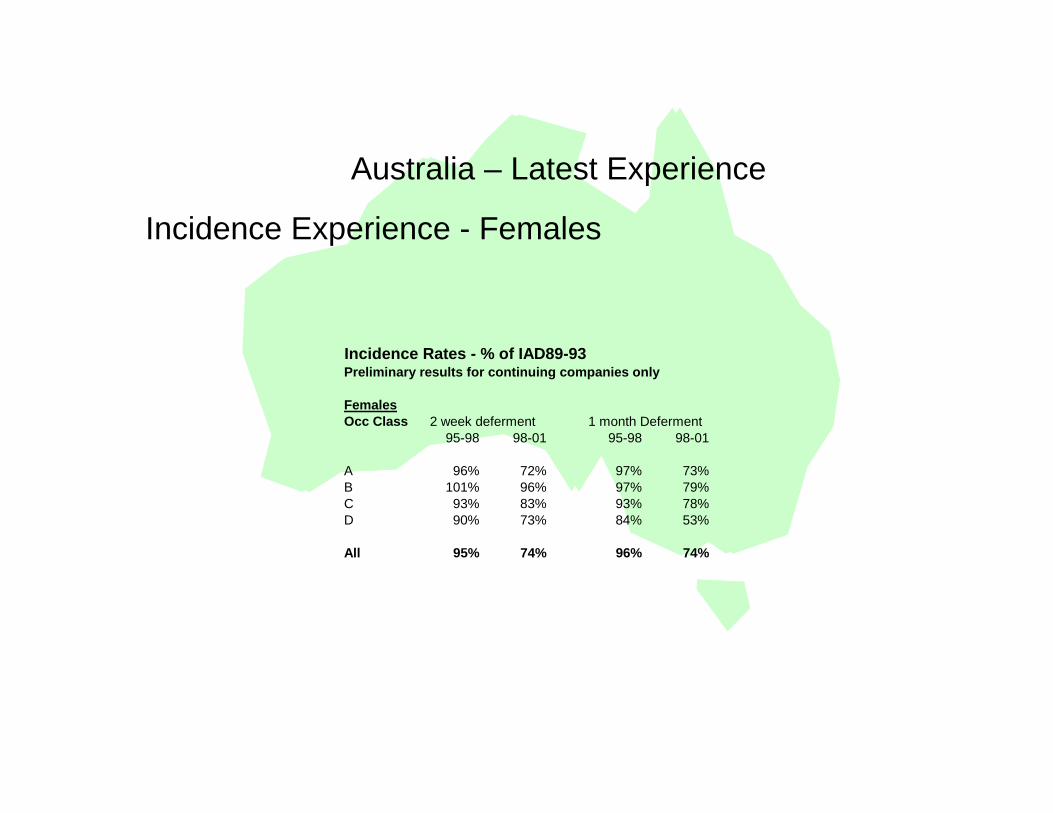
Australia – Latest Experience
Incidence Rates - % of IAD89-93Preliminary results for continuing companies only
FemalesOcc Class
95-98 98-01 95-98 98-01
A 96% 72% 97% 73%B 101% 96% 97% 79%C 93% 83% 93% 78%D 90% 73% 84% 53%
All 95% 74% 96% 74%
2 week deferment 1 month Deferment
Incidence Experience - Females
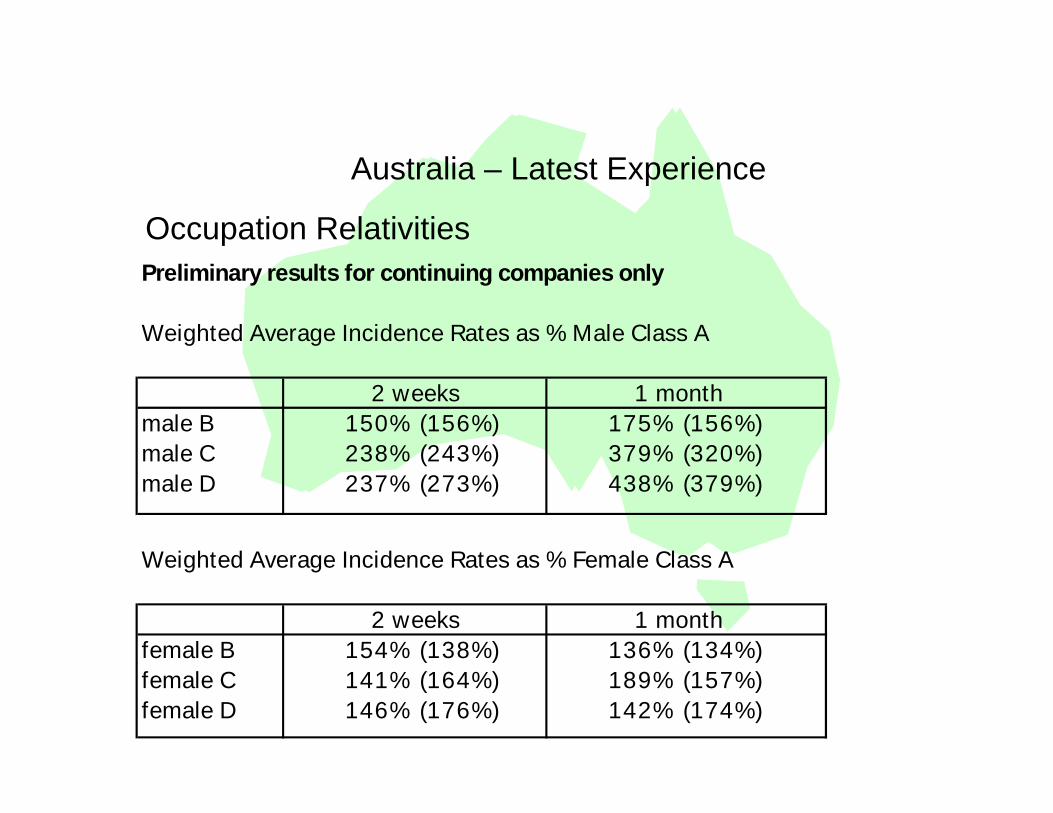
Australia – Latest Experience
Preliminary results for continuing companies only
Weighted Average Incidence Rates as % Male Class A
male B 150% (156%) 175% (156%)male C 238% (243%) 379% (320%)male D 237% (273%) 438% (379%)
Weighted Average Incidence Rates as % Female Class A
female B 154% (138%) 136% (134%)female C 141% (164%) 189% (157%)female D 146% (176%) 142% (174%)
2 weeks 1 month
2 weeks 1 month
Occupation Relativities
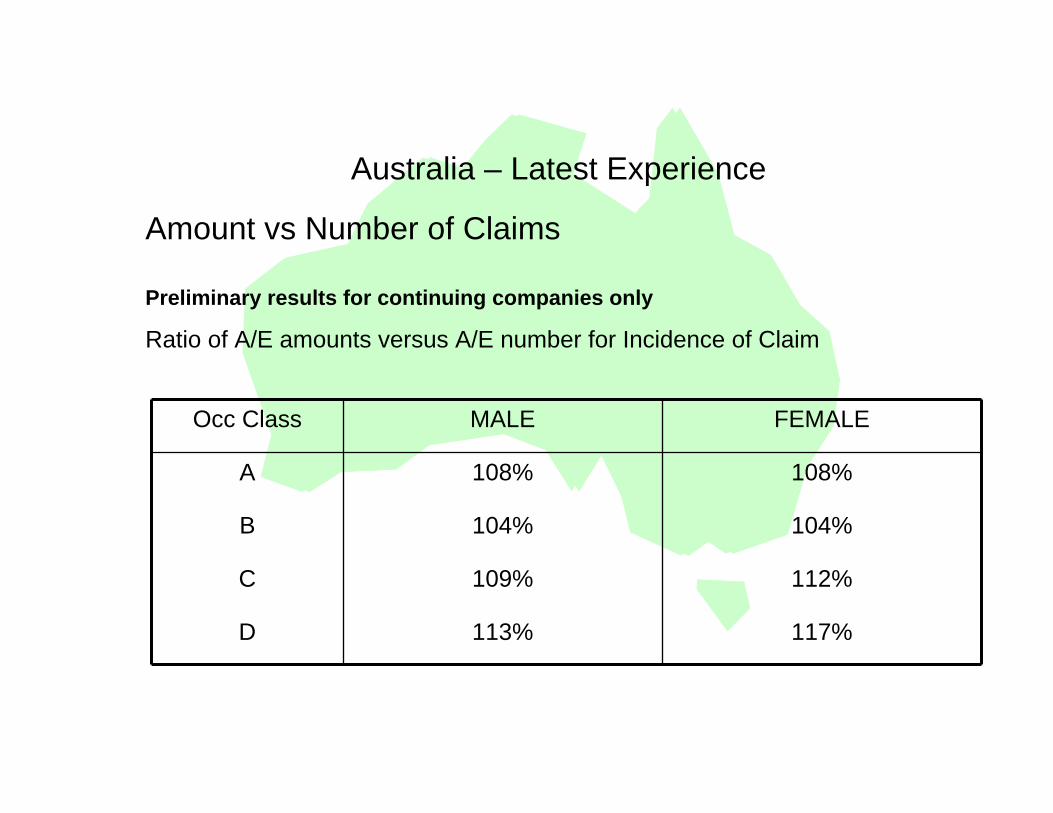
Australia – Latest Experience
Amount vs Number of Claims
Preliminary results for continuing companies only
Ratio of A/E amounts versus A/E number for Incidence of Claim
Occ Class MALE FEMALE
A 108% 108%
B 104% 104%
C 109% 112%
D 113% 117%
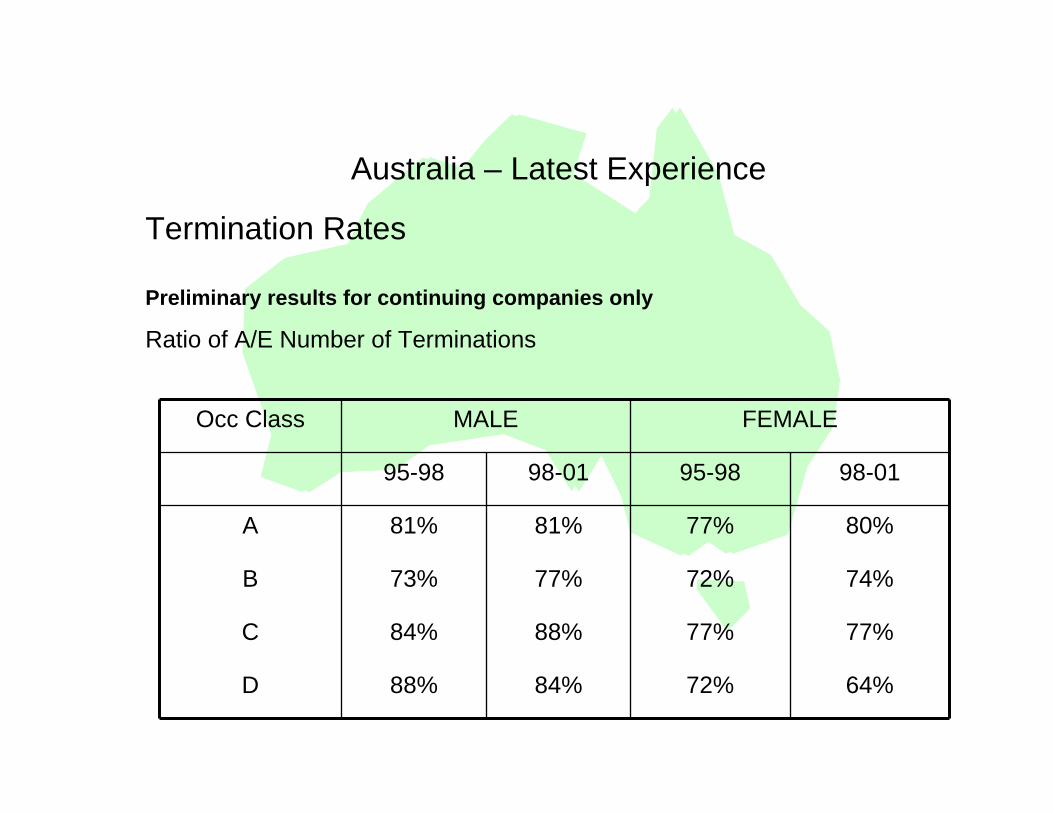
Australia – Latest Experience
Termination Rates
Preliminary results for continuing companies only
Ratio of A/E Number of Terminations
Occ Class MALE FEMALE
95-98 98-01 95-98 98-01
A 81% 81% 77% 80%
B 73% 77% 72% 74%
C 84% 88% 77% 77%
D 88% 84% 72% 64%
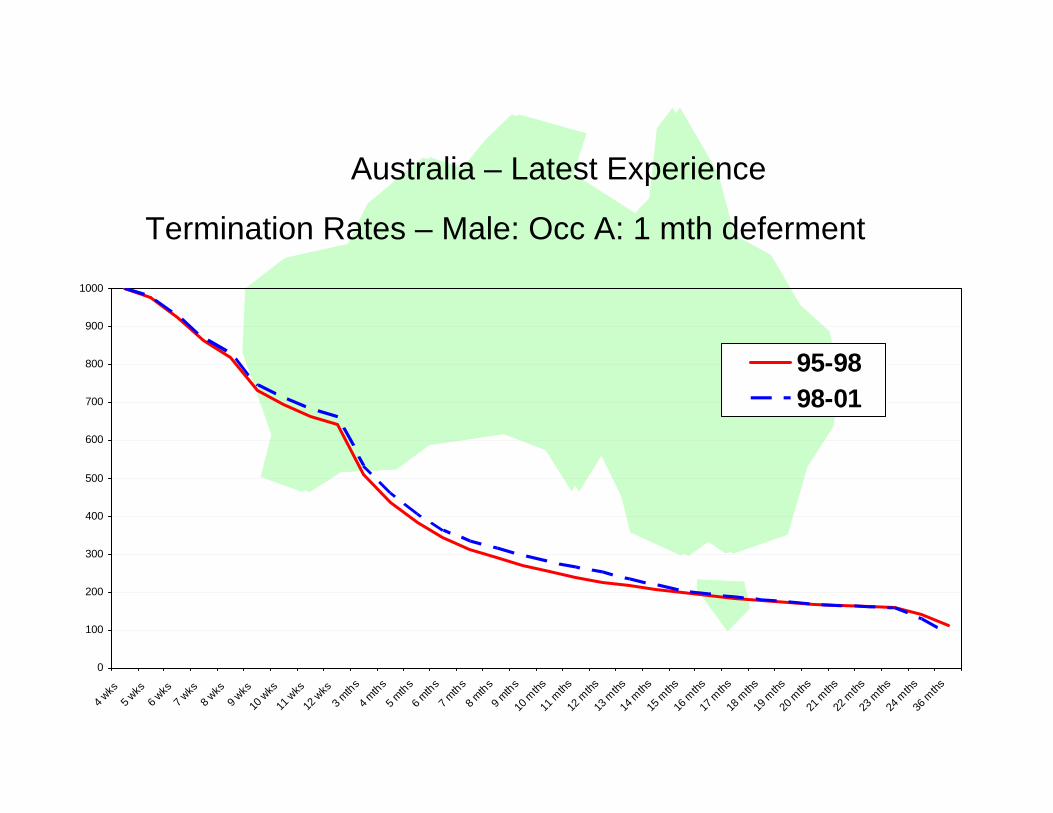
Australia – Latest Experience
Termination Rates – Male: Occ A: 1 mth deferment
0
100
200
300
400
500
600
700
800
900
1000
4 wks
5 wks
6 wks
7 wks
8 wks
9 wks
10 w
ks11
wks
12 w
ks3 m
ths4 m
ths5 m
ths6 m
ths7 m
ths8 m
ths9 m
ths10
mths
11 m
ths12
mths
13 m
ths14
mths
15 m
ths16
mths
17 m
ths18
mths
19 m
ths20
mths
21 m
ths22
mths
23 m
ths24
mths
36 m
ths
95-9898-01
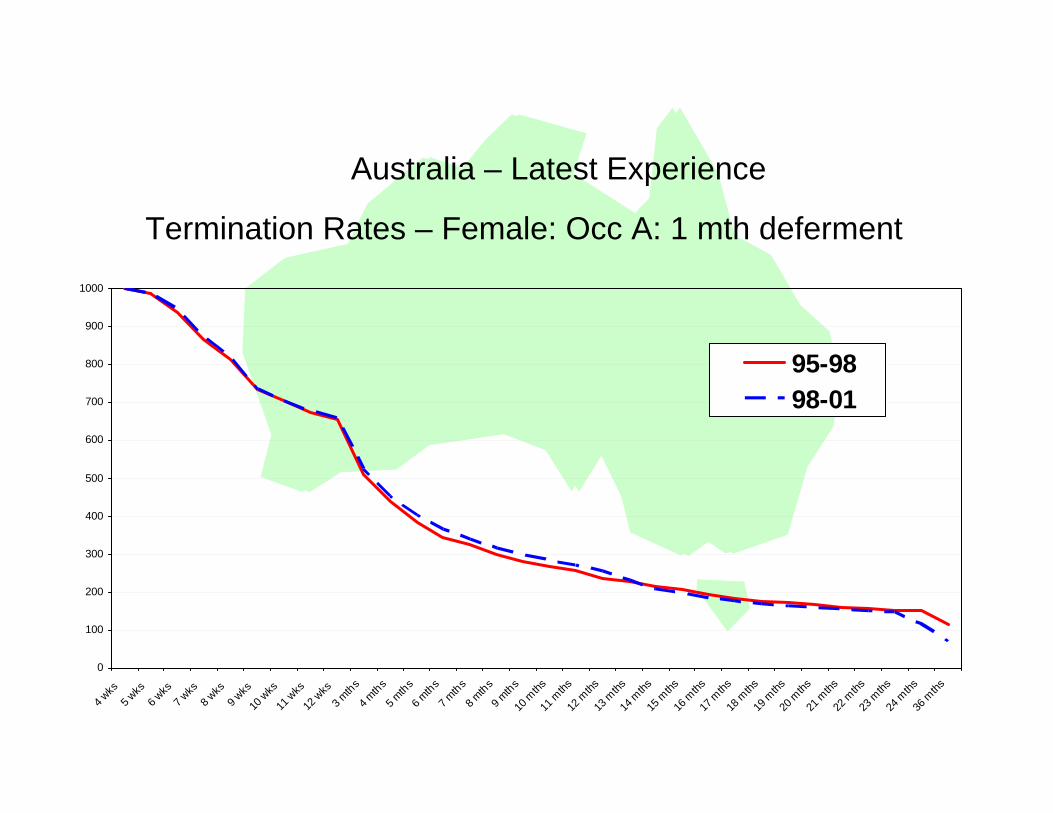
Australia – Latest Experience
Termination Rates – Female: Occ A: 1 mth deferment
0
100
200
300
400
500
600
700
800
900
1000
4 wks
5 wks
6 wks
7 wks
8 wks
9 wks
10 w
ks11
wks
12 w
ks3 m
ths4 m
ths5 m
ths6 m
ths7 m
ths8 m
ths9 m
ths10
mths
11 m
ths12
mths
13 m
ths14
mths
15 m
ths16
mths
17 m
ths18
mths
19 m
ths20
mths
21 m
ths22
mths
23 m
ths24
mths
36 m
ths
95-9898-01
Australia – Latest Experience
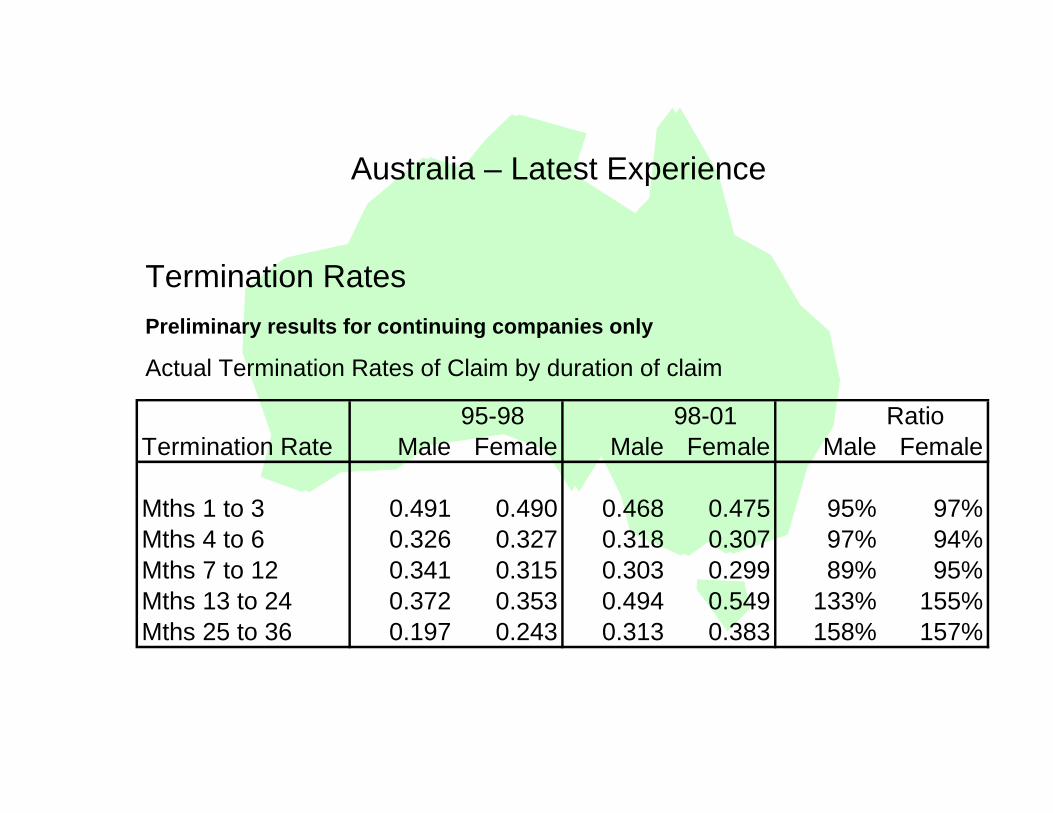
Termination Rates
95-98 98-01 RatioTermination Rate Male Female Male Female Male Female
Mths 1 to 3 0.491 0.490 0.468 0.475 95% 97%Mths 4 to 6 0.326 0.327 0.318 0.307 97% 94%Mths 7 to 12 0.341 0.315 0.303 0.299 89% 95%Mths 13 to 24 0.372 0.353 0.494 0.549 133% 155%Mths 25 to 36 0.197 0.243 0.313 0.383 158% 157%
Preliminary results for continuing companies only
Actual Termination Rates of Claim by duration of claim
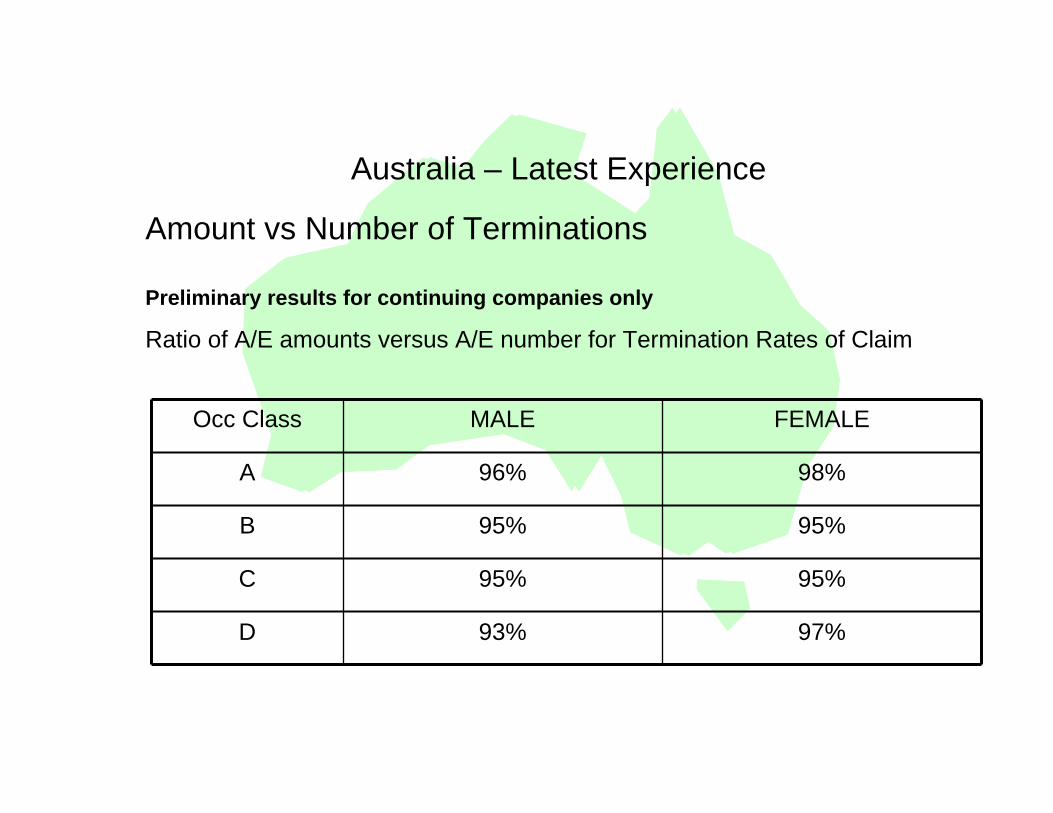
Australia – Latest Experience
Amount vs Number of Terminations
Preliminary results for continuing companies only
Ratio of A/E amounts versus A/E number for Termination Rates of Claim
Occ Class MALE FEMALE
A 96% 98%
B 95% 95%
C 95% 95%
D 93% 97%
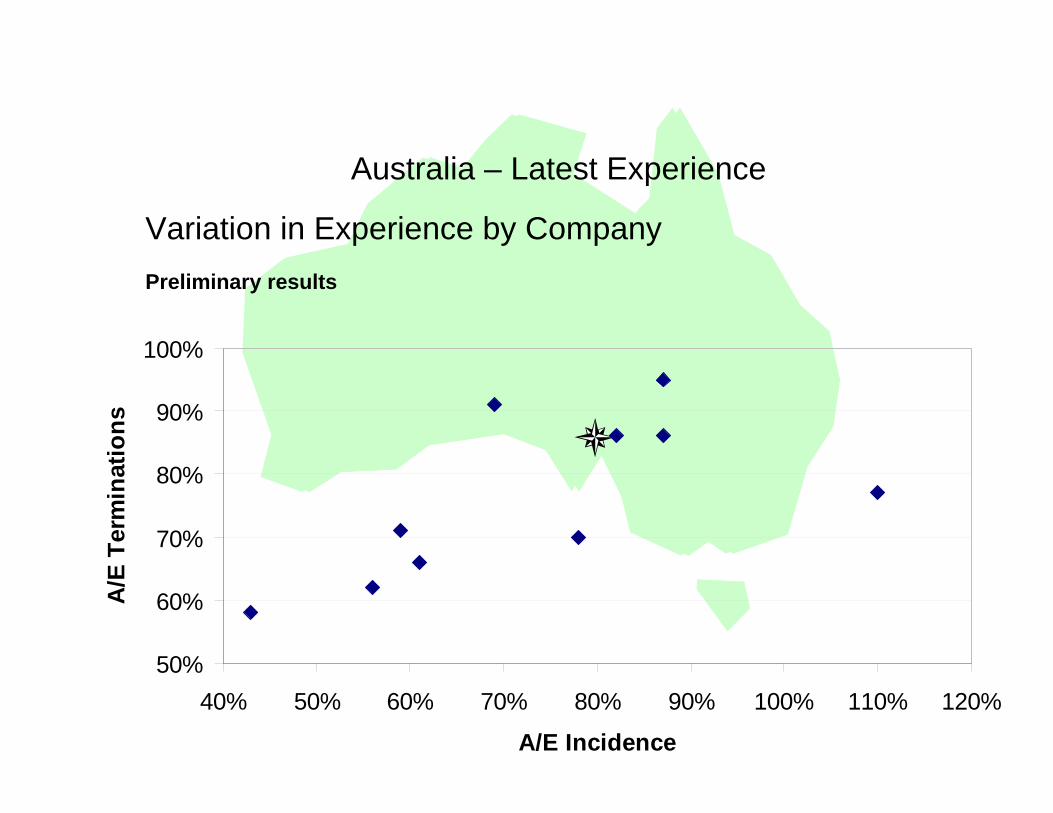
Australia – Latest Experience
Variation in Experience by CompanyPreliminary results
50%
60%
70%
80%
90%
100%
40% 50% 60% 70% 80% 90% 100% 110% 120%
A/E Incidence
A/E
Ter
min
atio
ns
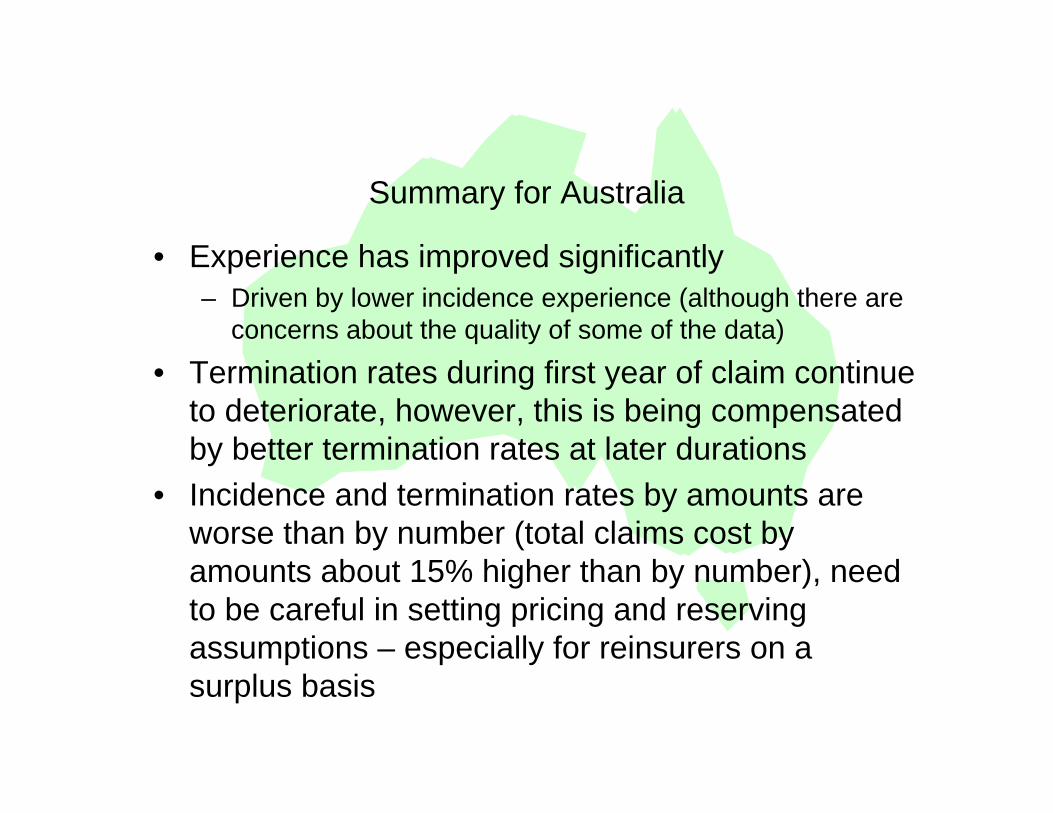
Summary for Australia
• Experience has improved significantly– Driven by lower incidence experience (although there are
concerns about the quality of some of the data)
• Termination rates during first year of claim continue to deteriorate, however, this is being compensated by better termination rates at later durations
• Incidence and termination rates by amounts are worse than by number (total claims cost by amounts about 15% higher than by number), need to be careful in setting pricing and reserving assumptions – especially for reinsurers on a surplus basis
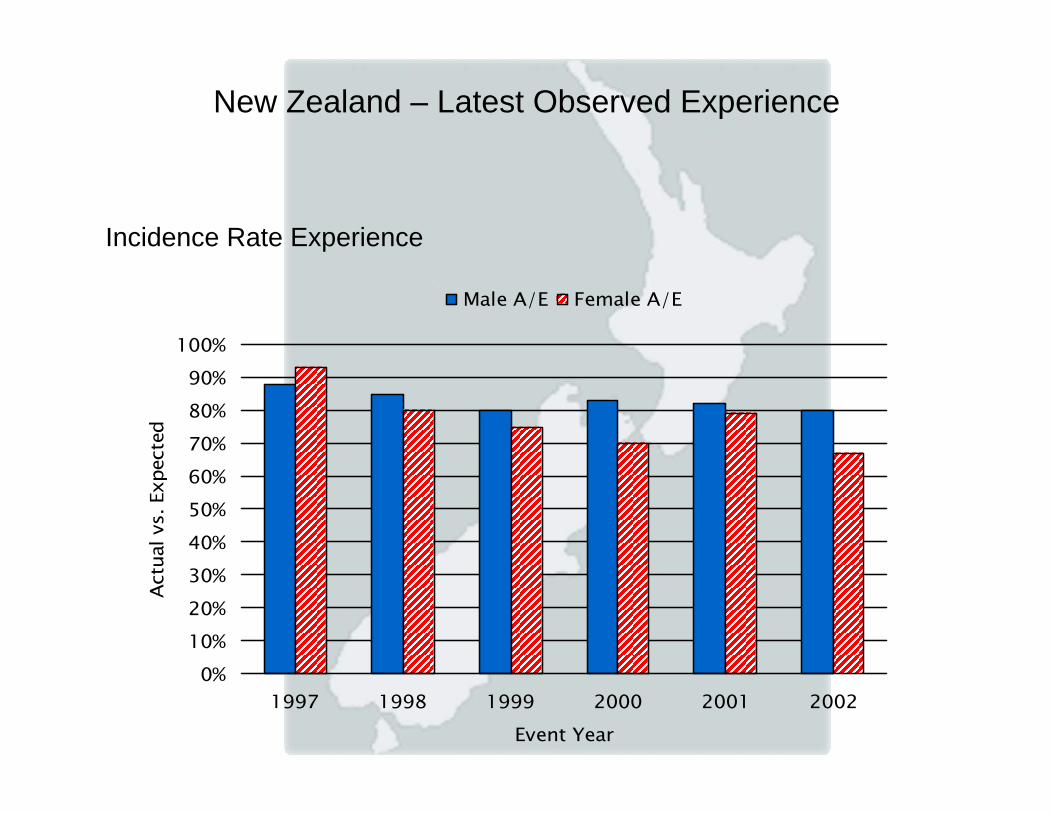
New Zealand – Latest Observed Experience
Incidence Rate Experience
0%10%20%30%40%50%60%70%80%90%
100%
1997 1998 1999 2000 2001 2002Event Year
Actu
al v
s. E
xpec
ted
Male A/E Female A/E
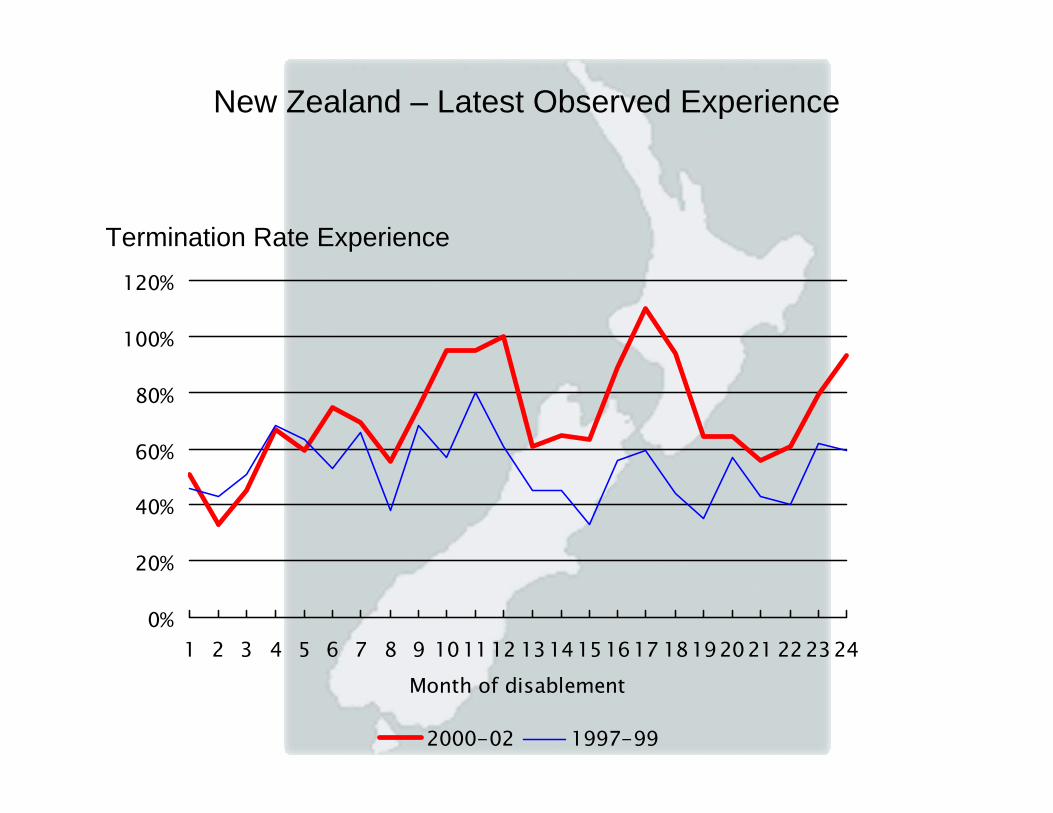
New Zealand – Latest Observed Experience
Termination Rate Experience
0%
20%
40%
60%
80%
100%
120%
1 2 3 4 5 6 7 8 9 101112 1314151617 18192021 222324Month of disablement
2000-02 1997-99
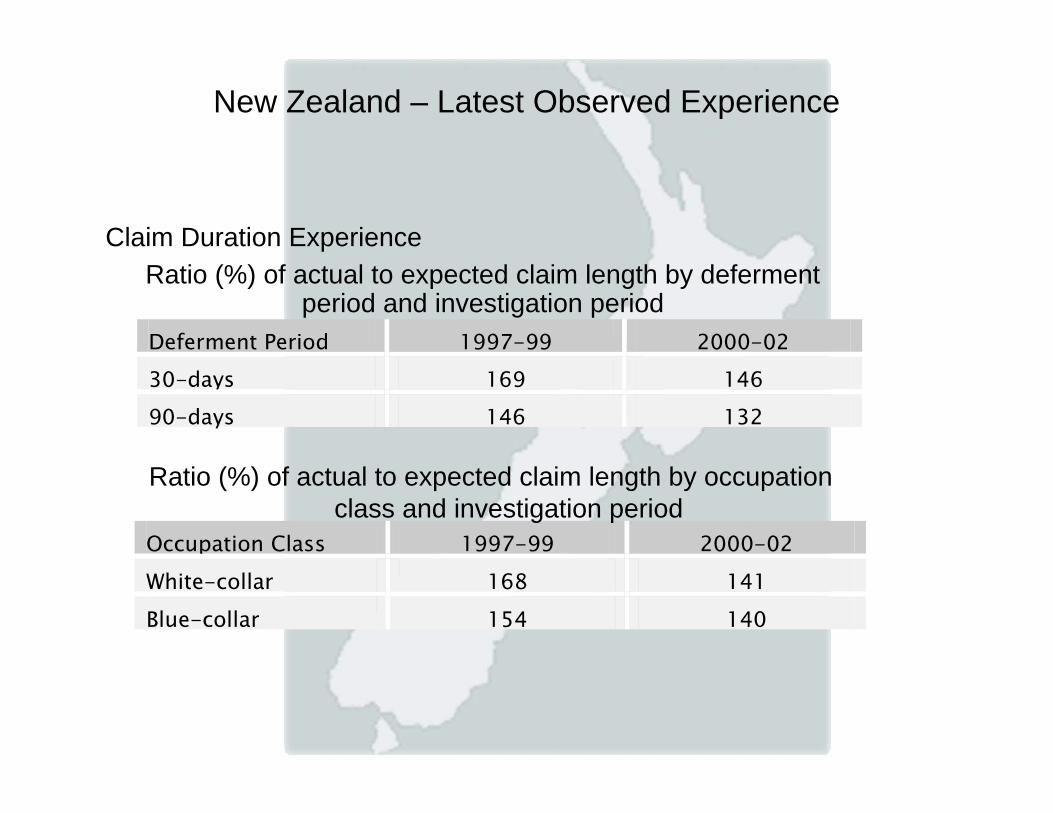
New Zealand – Latest Observed Experience
Claim Duration Experience
Deferment Period 1997-99 2000-02 30-days 169 146 90-days 146 132
Occupation Class 1997-99 2000-02 White-collar 168 141 Blue-collar 154 140
Ratio (%) of actual to expected claim length by deferment period and investigation period
Ratio (%) of actual to expected claim length by occupation class and investigation period
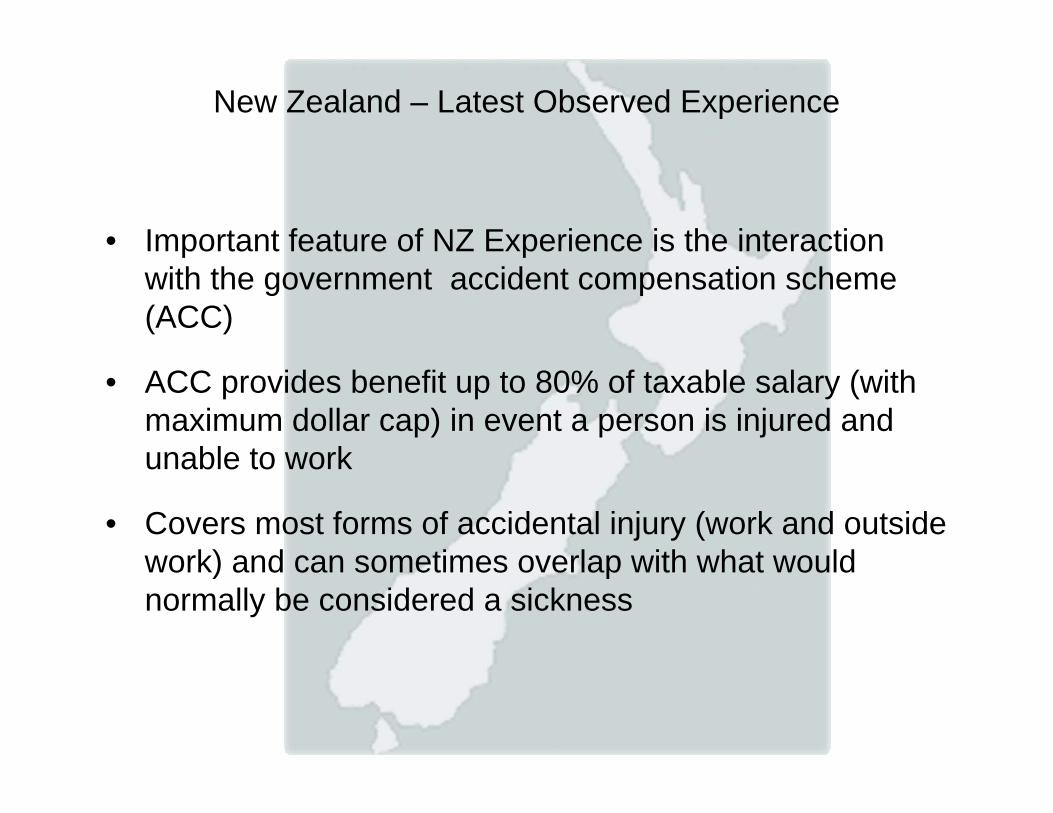
New Zealand – Latest Observed Experience
• Important feature of NZ Experience is the interaction with the government accident compensation scheme (ACC)
• ACC provides benefit up to 80% of taxable salary (with maximum dollar cap) in event a person is injured and unable to work
• Covers most forms of accidental injury (work and outside work) and can sometimes overlap with what would normally be considered a sickness
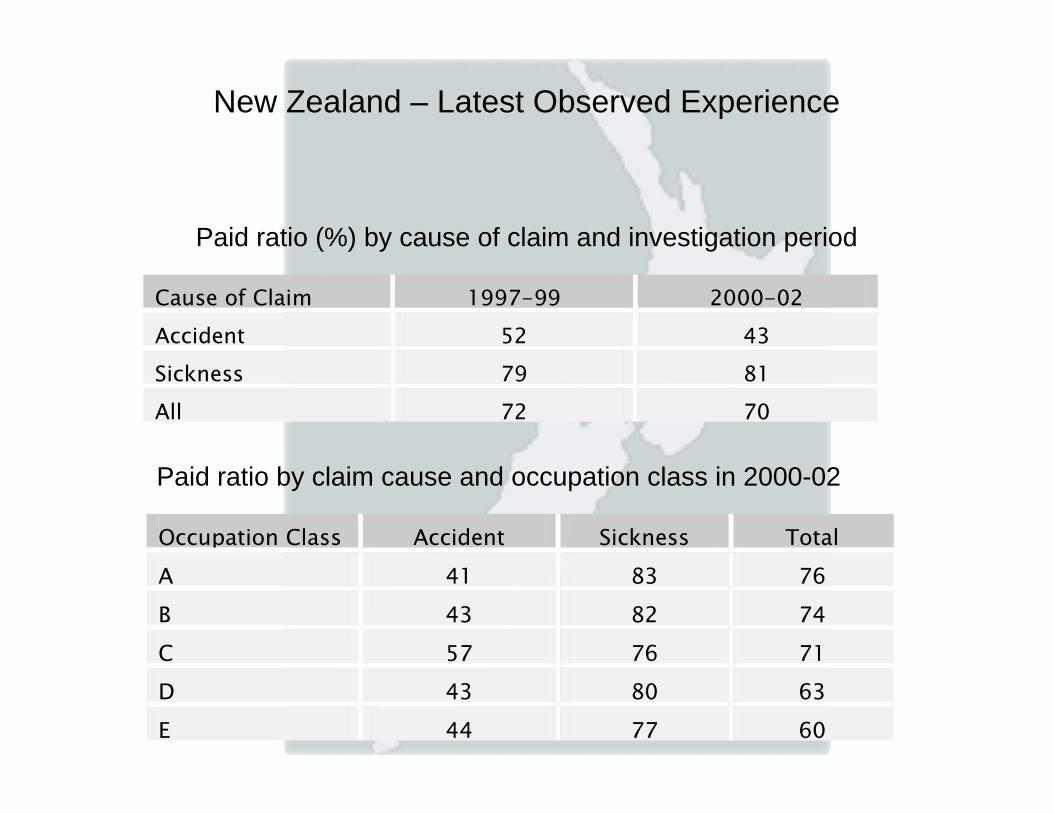
New Zealand – Latest Observed Experience
Paid ratio (%) by cause of claim and investigation period
Paid ratio by claim cause and occupation class in 2000-02
Cause of Claim 1997-99 2000-02 Accident 52 43 Sickness 79 81 All 72 70
Occupation Class Accident Sickness Total A 41 83 76 B 43 82 74 C 57 76 71 D 43 80 63 E 44 77 60
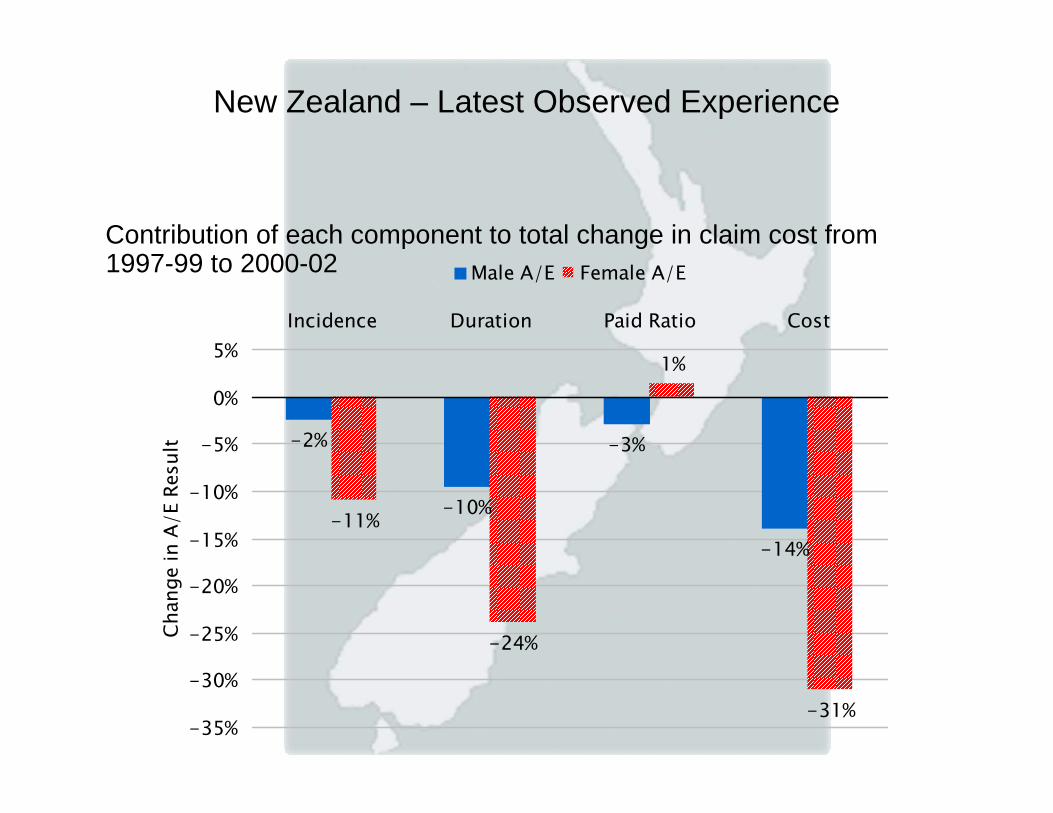
New Zealand – Latest Observed Experience
Contribution of each component to total change in claim cost from 1997-99 to 2000-02
-2%
-10%
-3%
-14%-11%
-24%
1%
-31%-35%
-30%
-25%
-20%
-15%
-10%
-5%
0%
5%Incidence Duration Paid Ratio Cost
Chan
ge in
A/E
Res
ult
Male A/E Female A/E
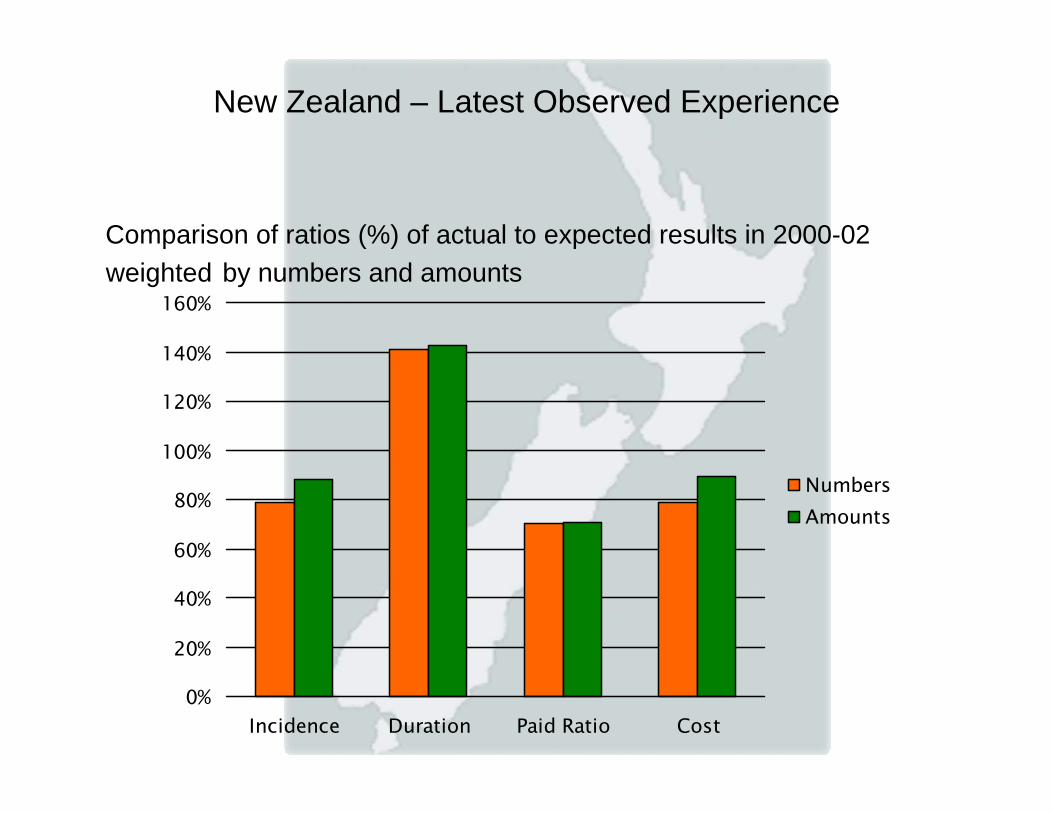
New Zealand – Latest Observed Experience
Comparison of ratios (%) of actual to expected results in 2000-02 weighted by numbers and amounts
0%
20%
40%
60%
80%
100%
120%
140%
160%
Incidence Duration Paid Ratio Cost
NumbersAmounts
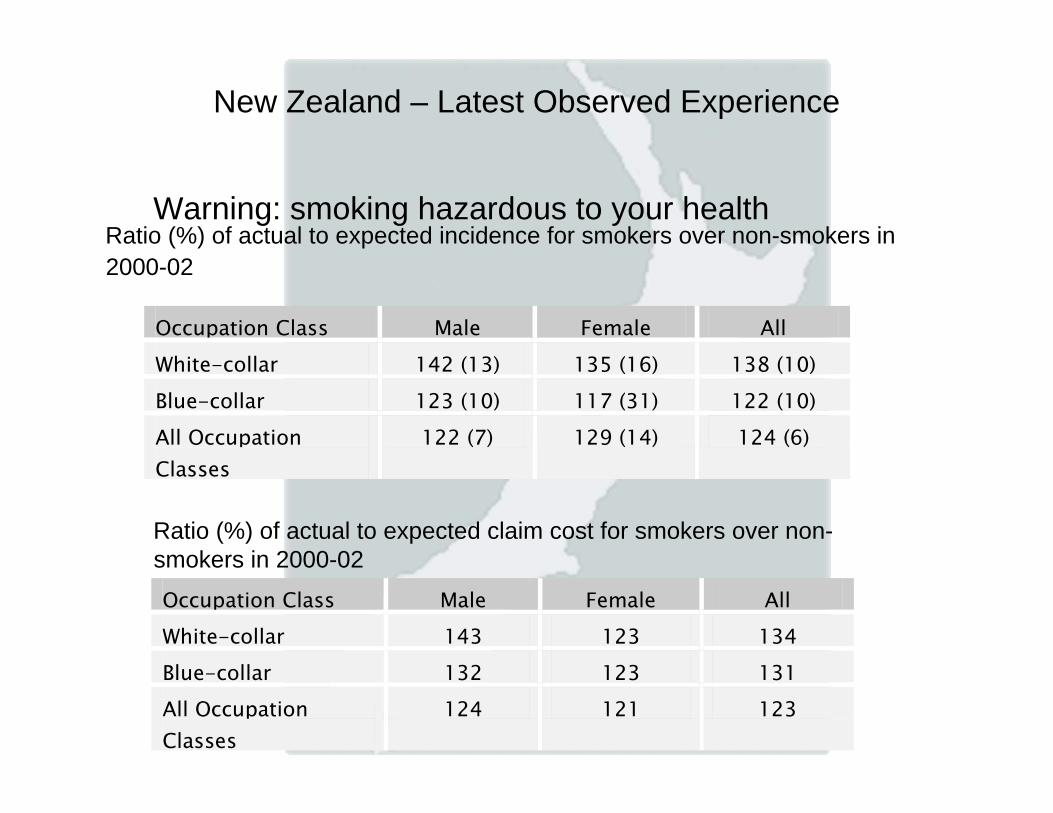
New Zealand – Latest Observed Experience
Ratio (%) of actual to expected incidence for smokers over non-smokers in 2000-02
Warning: smoking hazardous to your health
Occupation Class Male Female All White-collar 142 (13) 135 (16) 138 (10) Blue-collar 123 (10) 117 (31) 122 (10) All Occupation Classes
122 (7) 129 (14) 124 (6)
Ratio (%) of actual to expected claim cost for smokers over non-smokers in 2000-02Occupation Class Male Female All White-collar 143 123 134 Blue-collar 132 123 131 All Occupation Classes
124 121 123
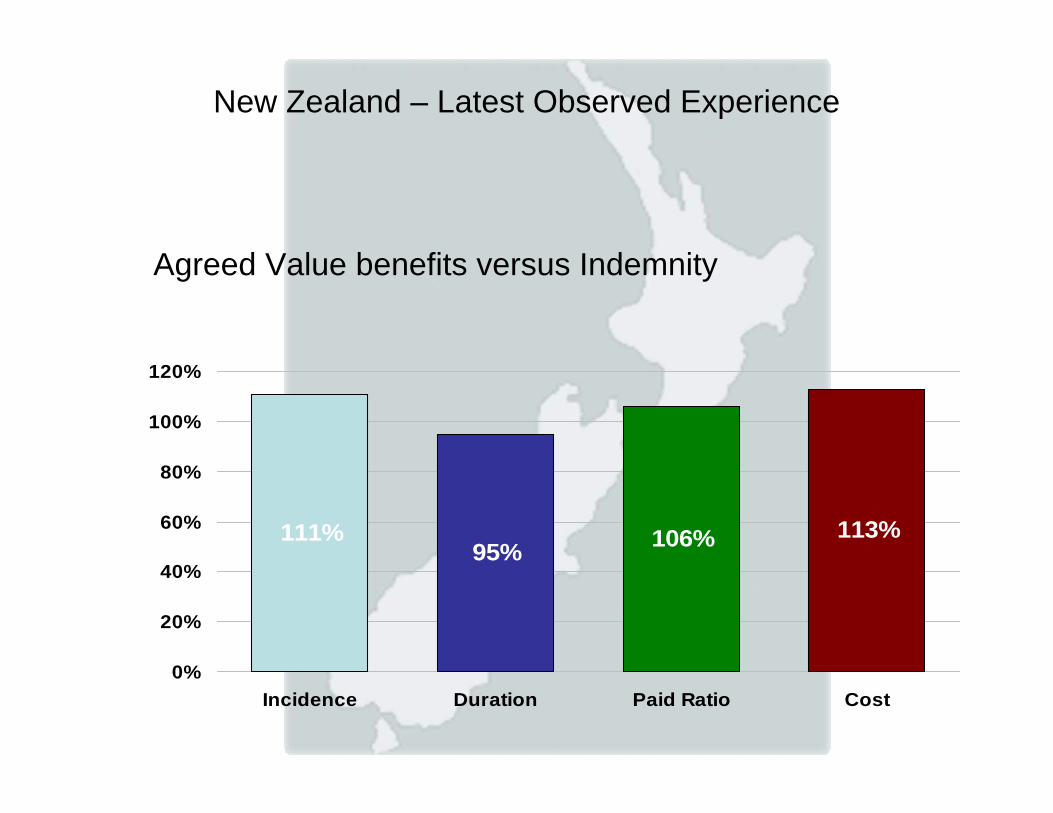
New Zealand – Latest Observed Experience
111%95% 106% 113%
0%
20%
40%
60%
80%
100%
120%
Incidence Duration Paid Ratio Cost
Agreed Value benefits versus Indemnity
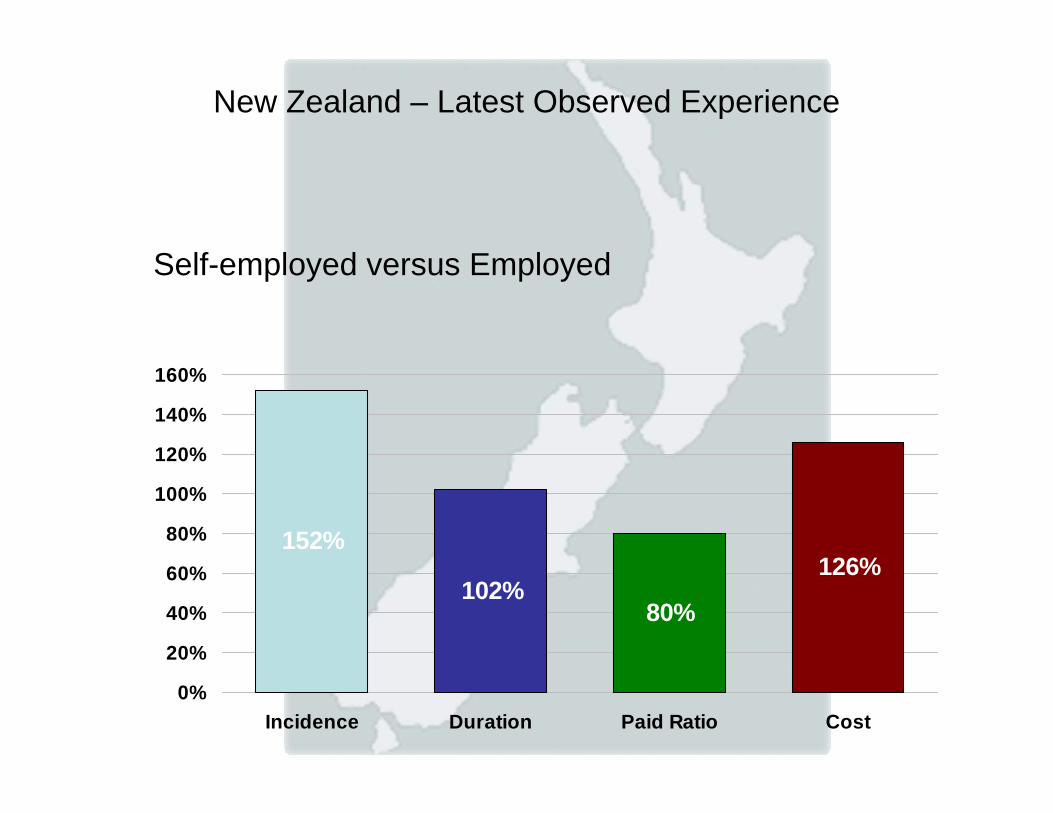
New Zealand – Latest Observed Experience
Self-employed versus Employed
152%
102%80%
126%
0%
20%
40%
60%
80%
100%
120%
140%
160%
Incidence Duration Paid Ratio Cost
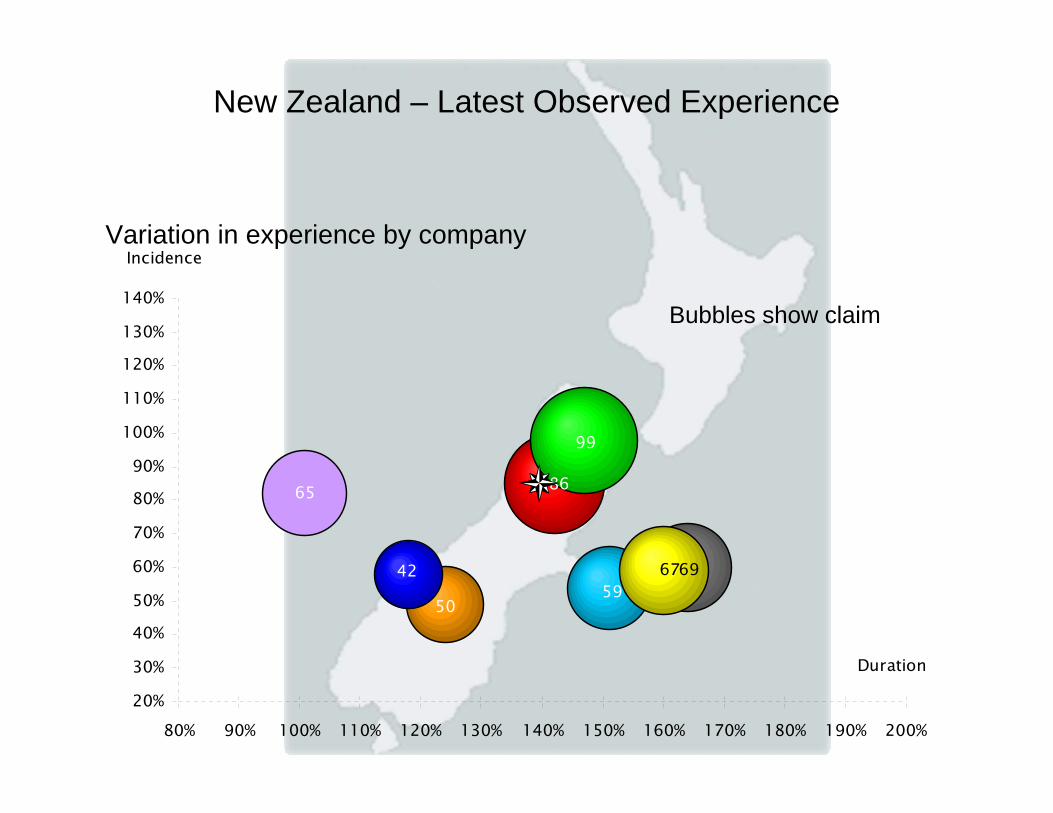
New Zealand – Latest Observed Experience
Variation in experience by company
86
50
69
99
5942 67
65
20%
30%
40%
50%
60%
70%
80%
90%
100%
110%
120%
130%
140%
80% 90% 100% 110% 120% 130% 140% 150% 160% 170% 180% 190% 200%
Duration
Incidence
Bubbles show claim cost
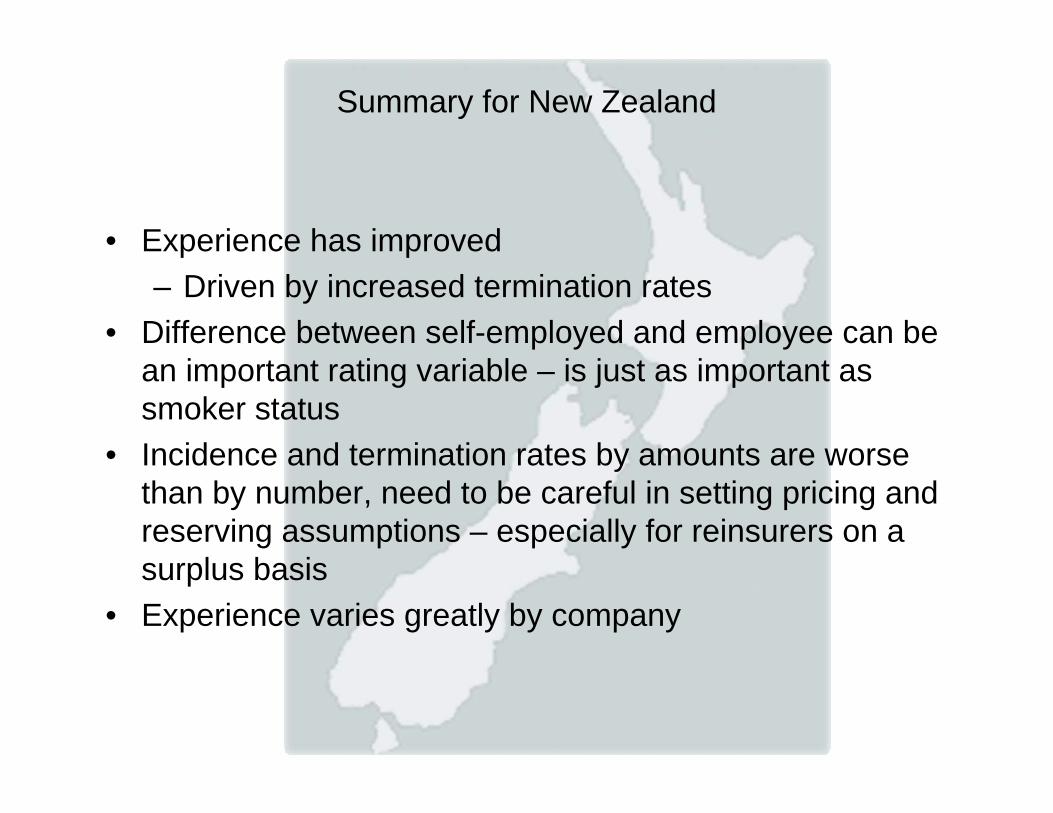
Summary for New Zealand
• Experience has improved– Driven by increased termination rates
• Difference between self-employed and employee can be an important rating variable – is just as important as smoker status
• Incidence and termination rates by amounts are worse than by number, need to be careful in setting pricing and reserving assumptions – especially for reinsurers on a surplus basis
• Experience varies greatly by company


![Potential Use of Tropical Grass for Deferment in Semi-Arid ... · Santos and Cavalcante [2] stated that the most suitable forage plants for deferment those which prwere e-sented low](https://img.pdfslide.net/doc/110x75/5e4e5dd24103fd29117c82e6/potential-use-of-tropical-grass-for-deferment-in-semi-arid-santos-and-cavalcante.jpg)