Embed Size (px)
Citation preview
Australia’s International Business Survey 2017

2
3
AIB
S 2017
Table of contents
Research team and partners ................................................................................................................. 4
Glossary of terms ..................................................................................................................................... 5
Executive summary ................................................................................................................................. 6
1 Introduction ..................................................................................................................................... 10
2 1) The diversity of Australia’s international business activity ........................................... 14
2.1 Internationalbusinessactivities......................................................................................................16
2.2 Internationalrevenuefrominternationalactivity.................................................................... 24
2.3 Internationaltradeambitions......................................................................................................... 32
3 2) Australia’s international business activity in focus .......................................................... 34
3.1 Accesstofinance................................................................................................................................ 37
3.2Australia’sfreetradeagreement(FTA)activity...................................................................... 39
3.3Barrierstocommencinginternationaltrade............................................................................. 57
3.4Trade-relatedfactorsInfluencingInternationalrevenue..................................................... 60
4 3) Innovation in Australia’s international business activity, and future outlook ........... 62
4.1 Innovationbusinessactivityandexportsales..........................................................................64
4.2Internationaloperations–futureoutlook..................................................................................66
Appendix A – AIBS methodology ...................................................................................................... 69
Appendix B - Who responded? .......................................................................................................... 71
Reference list .......................................................................................................................................... 77
4
Research team and partners
Research investigators
AssociateProfessorRenuAgarwal
AssociateProfessorChrisBajada
ProfessorRoyGreen
DrHussainRammal
DrMoiraScerri
Research associates
MsKatrinaSkellern
Research assistants
MsSamanthaLuff
MrStephenSoco
DrMikhailShashnov
Contributing authors
LisaMcAuley
GeirKristiansen
Citation
Agarwal,R.,Bajada,C.,Green,R.,Rammal,H.,Scerri,M.(2017).Australia’sInternationalBusinessSurvey2017,UniversityofTechnologySydney.
For further information about this research study, please contact Associate Professor Renu Agarwal at email address: [email protected].
5
AIB
S 2017
Glossary of terms
AANZFTA ASEAN-Australia-NewZealandFreeTradeArea
Austrade AustralianTradeandInvestmentCommission
ABS AustralianBureauofStatistics
AMR AdvancedMarketingResearch
ANZSIC AustralianandNewZealandStandardIndustrialClassification
CBSI CentreforBusinessandSocialInnovation
CoO CertificateofOrigin
DFAT DepartmentofForeignAffairsandTrade
ECA ExportCouncilofAustralia
Efic ExportFinanceandInsuranceCorporation
FTA FreeTradeAgreement
GVCs GlobalValueChains
IP IntellectualProperty
LNG LiquefiedNaturalGas
MRA MutualRecognitionAgreement
RoO RulesofOrigin
SMEs SmalltoMediumEnterprises
UTS UniversityofTechnologySydney
6
Executive summary
Australianbusinessescontributesignificantlytoeconomicgrowththroughcommercialactivityininternationalmarkets.Theseareasofactivityinclude:foreigndirectinvestment,tradeingoodsandservices,andotherinternationalactivities–suchasmanufacturingproductsoverseasthroughlicensing,undertakingR&Doverseasandemploymentoftemporarystaff.
Since2014,Australia’sInternationalBusinessSurvey(AIBS)hasaidedintheunderstandingofAustralia’sinternationalbusinessactivity,aswellinevaluatingtheimpactofinternationaleconomictrendsonAustralianbusinesses.
Thisyear,theExportCouncilofAustralia(ECA)commissionedtheCentreforBusinessandSocialInnovation(CBSI)attheUniversityofTechnologySydney(UTS)toconducttheresearchstudyandproducetheAIBS2017Report.
Atotalof1068AustralianbusinessesweresurveyedforAIBS2017,ofwhich941wereengagedininternationalbusinessactivity.Theremaining127respondentswerenotcurrentlyinvolvedininternationalbusinessactivity,andinsteadrespondedbyhighlightingareasthatcouldassisttheminengaginginsuchactivities.
ThisreportanalysesAIBS2017responsesinthecontextofthefollowingareas:
1) ThediversityofAustralia’sinternationalbusinessactivity
2) Australia’sinternationalbusinessactivityinfocus
3) InnovationinAustralia’sinternationalbusinessactivity,andfutureoutlook
7
AIB
S 2017
Diversity of international business activity
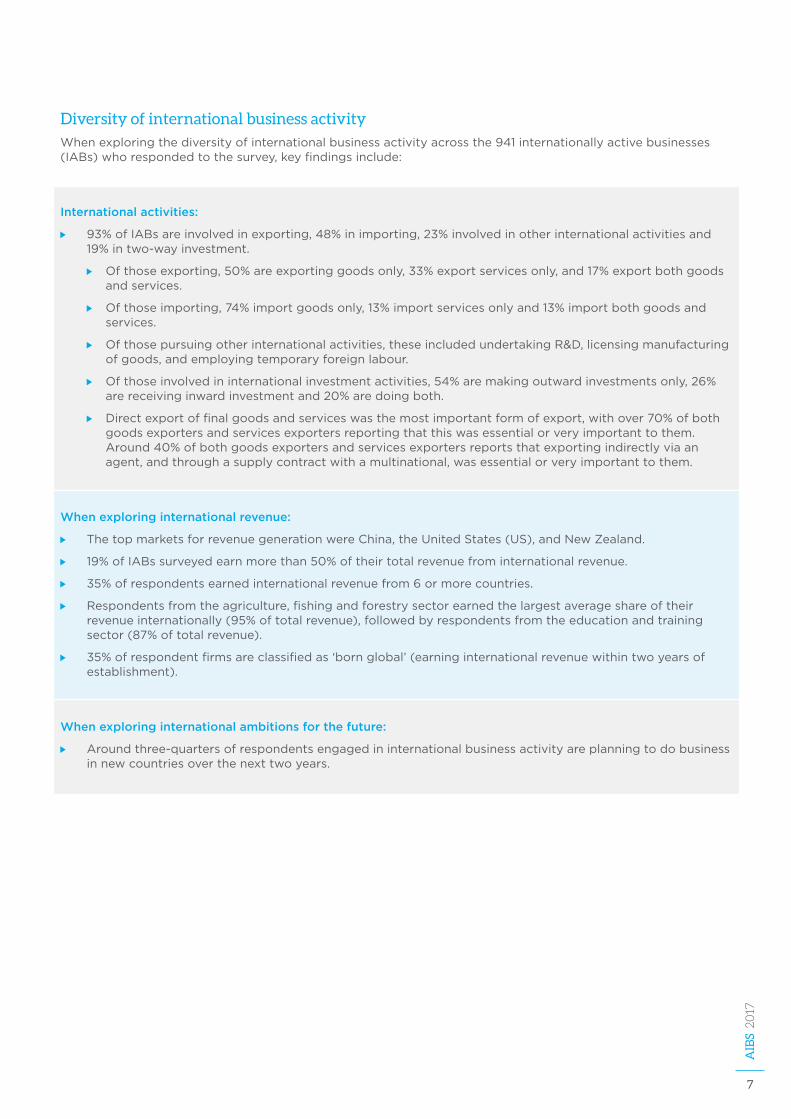
Whenexploringthediversityofinternationalbusinessactivityacrossthe941internationallyactivebusinesses(IABs)whorespondedtothesurvey,keyfindingsinclude:
International activities:
93%ofIABsareinvolvedinexporting,48%inimporting,23%involvedinotherinternationalactivitiesand19%intwo-wayinvestment.
Ofthoseexporting,50%areexportinggoodsonly,33%exportservicesonly,and17%exportbothgoodsandservices.
Ofthoseimporting,74%importgoodsonly,13%importservicesonlyand13%importbothgoodsandservices.
Ofthosepursuingotherinternationalactivities,theseincludedundertakingR&D,licensingmanufacturingofgoods,andemployingtemporaryforeignlabour.
Ofthoseinvolvedininternationalinvestmentactivities,54%aremakingoutwardinvestmentsonly,26%arereceivinginwardinvestmentand20%aredoingboth.
Directexportoffinalgoodsandserviceswasthemostimportantformofexport,withover70%ofbothgoodsexportersandservicesexportersreportingthatthiswasessentialorveryimportanttothem.Around40%ofbothgoodsexportersandservicesexportersreportsthatexportingindirectlyviaanagent,andthroughasupplycontractwithamultinational,wasessentialorveryimportanttothem.
When exploring international revenue:
ThetopmarketsforrevenuegenerationwereChina,theUnitedStates(US),andNewZealand.
19%ofIABssurveyedearnmorethan50%oftheirtotalrevenuefrominternationalrevenue.
35%ofrespondentsearnedinternationalrevenuefrom6ormorecountries.
Respondentsfromtheagriculture,fishingandforestrysectorearnedthelargestaverageshareoftheirrevenueinternationally(95%oftotalrevenue),followedbyrespondentsfromtheeducationandtrainingsector(87%oftotalrevenue).
35%ofrespondentfirmsareclassifiedas‘bornglobal’(earninginternationalrevenuewithintwoyearsofestablishment).
When exploring international ambitions for the future:
Aroundthree-quartersofrespondentsengagedininternationalbusinessactivityareplanningtodobusinessinnewcountriesoverthenexttwoyears.
8
Australia’s international trade in focus
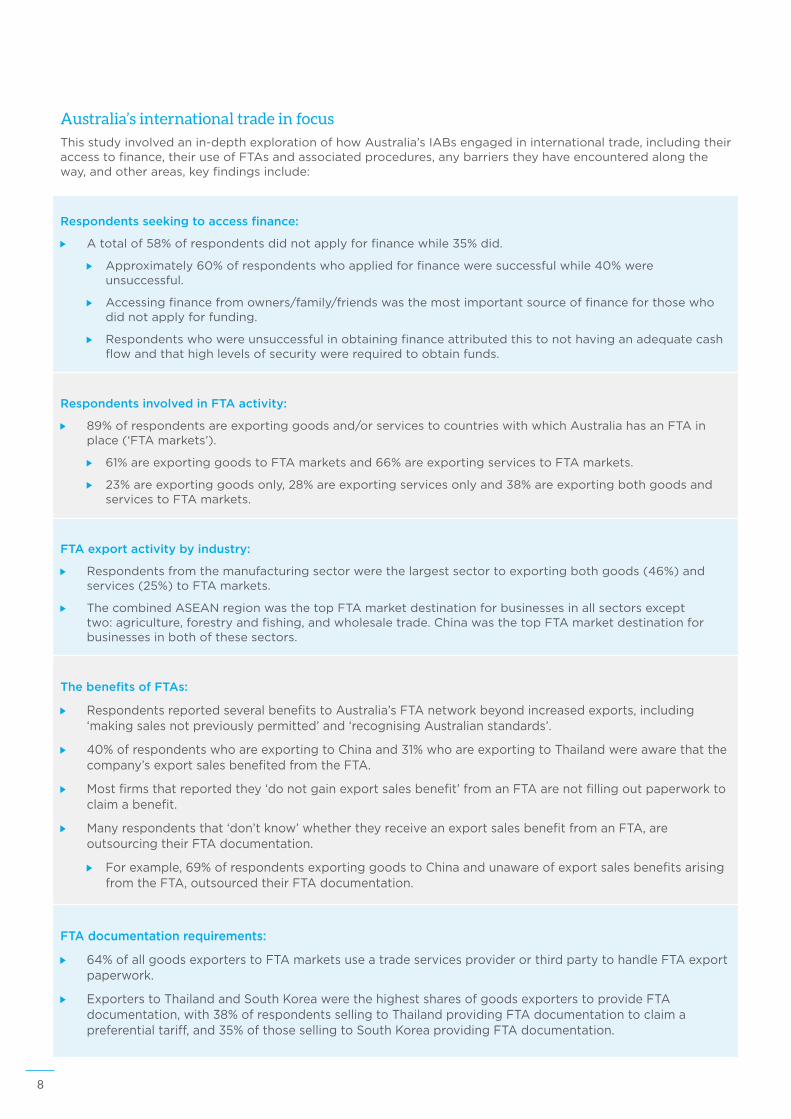
Thisstudyinvolvedanin-depthexplorationofhowAustralia’sIABsengagedininternationaltrade,includingtheiraccesstofinance,theiruseofFTAsandassociatedprocedures,anybarrierstheyhaveencounteredalongtheway,andotherareas,keyfindingsinclude:
Respondents seeking to access finance:
Atotalof58%ofrespondentsdidnotapplyforfinancewhile35%did.
Approximately60%ofrespondentswhoappliedforfinanceweresuccessfulwhile40%wereunsuccessful.
Accessingfinancefromowners/family/friendswasthemostimportantsourceoffinanceforthosewhodidnotapplyforfunding.
Respondentswhowereunsuccessfulinobtainingfinanceattributedthistonothavinganadequatecashflowandthathighlevelsofsecuritywererequiredtoobtainfunds.
Respondents involved in FTA activity:
89%ofrespondentsareexportinggoodsand/orservicestocountrieswithwhichAustraliahasanFTAinplace(‘FTAmarkets’).
61%areexportinggoodstoFTAmarketsand66%areexportingservicestoFTAmarkets.
23%areexportinggoodsonly,28%areexportingservicesonlyand38%areexportingbothgoodsandservicestoFTAmarkets.
FTA export activity by industry:
Respondentsfromthemanufacturingsectorwerethelargestsectortoexportingbothgoods(46%)andservices(25%)toFTAmarkets.
ThecombinedASEANregionwasthetopFTAmarketdestinationforbusinessesinallsectorsexcepttwo:agriculture,forestryandfishing,andwholesaletrade.ChinawasthetopFTAmarketdestinationforbusinessesinbothofthesesectors.
The benefits of FTAs:
RespondentsreportedseveralbenefitstoAustralia’sFTAnetworkbeyondincreasedexports,including‘makingsalesnotpreviouslypermitted’and‘recognisingAustralianstandards’.
40%ofrespondentswhoareexportingtoChinaand31%whoareexportingtoThailandwereawarethatthecompany’sexportsalesbenefitedfromtheFTA.
Mostfirmsthatreportedthey‘donotgainexportsalesbenefit’fromanFTAarenotfillingoutpaperworktoclaimabenefit.
Manyrespondentsthat‘don’tknow’whethertheyreceiveanexportsalesbenefitfromanFTA,areoutsourcingtheirFTAdocumentation.
Forexample,69%ofrespondentsexportinggoodstoChinaandunawareofexportsalesbenefitsarisingfromtheFTA,outsourcedtheirFTAdocumentation.
FTA documentation requirements:
64%ofallgoodsexporterstoFTAmarketsuseatradeservicesproviderorthirdpartytohandleFTAexportpaperwork.
ExporterstoThailandandSouthKoreawerethehighestsharesofgoodsexporterstoprovideFTAdocumentation,with38%ofrespondentssellingtoThailandprovidingFTAdocumentationtoclaimapreferentialtariff,and35%ofthosesellingtoSouthKoreaprovidingFTAdocumentation.
9
AIB
S 2017
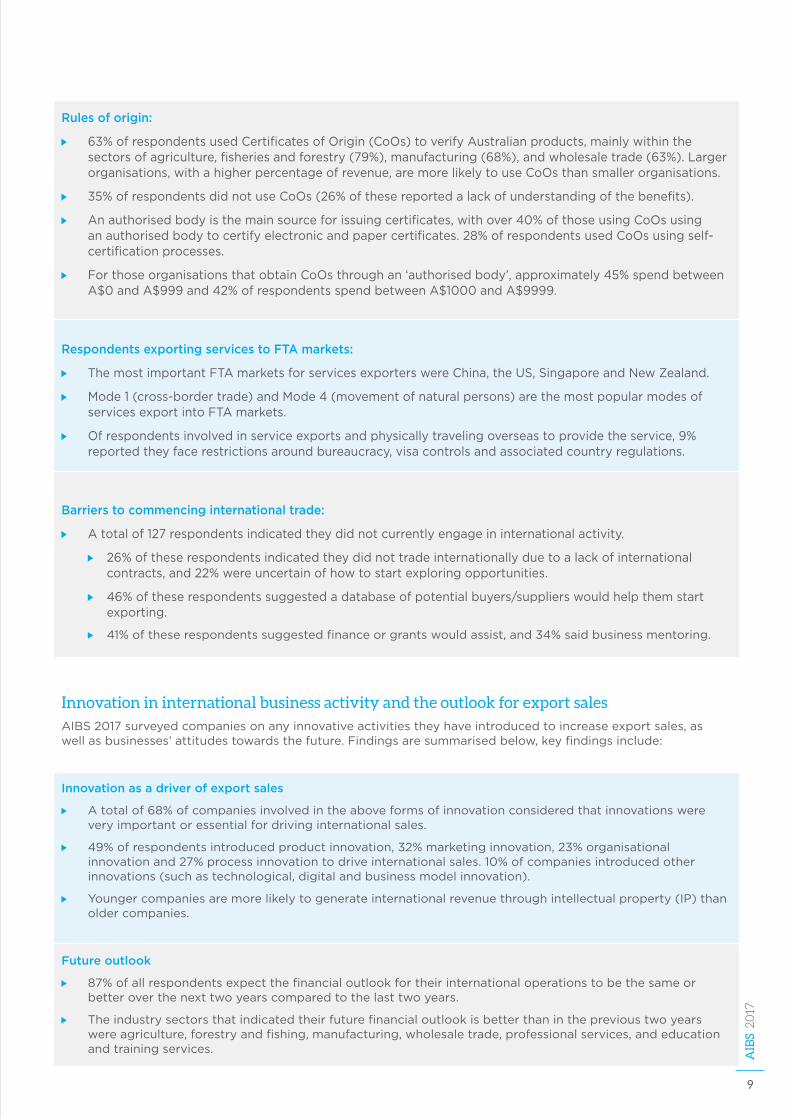
Rules of origin:
63%ofrespondentsusedCertificatesofOrigin(CoOs)toverifyAustralianproducts,mainlywithinthesectorsofagriculture,fisheriesandforestry(79%),manufacturing(68%),andwholesaletrade(63%).Largerorganisations,withahigherpercentageofrevenue,aremorelikelytouseCoOsthansmallerorganisations.
35%ofrespondentsdidnotuseCoOs(26%ofthesereportedalackofunderstandingofthebenefits).
Anauthorisedbodyisthemainsourceforissuingcertificates,withover40%ofthoseusingCoOsusinganauthorisedbodytocertifyelectronicandpapercertificates.28%ofrespondentsusedCoOsusingself-certificationprocesses.
ForthoseorganisationsthatobtainCoOsthroughan‘authorisedbody’,approximately45%spendbetweenA$0andA$999and42%ofrespondentsspendbetweenA$1000andA$9999.
Respondents exporting services to FTA markets:
ThemostimportantFTAmarketsforservicesexporterswereChina,theUS,SingaporeandNewZealand.
Mode1(cross-bordertrade)andMode4(movementofnaturalpersons)arethemostpopularmodesofservicesexportintoFTAmarkets.
Ofrespondentsinvolvedinserviceexportsandphysicallytravelingoverseastoprovidetheservice,9%reportedtheyfacerestrictionsaroundbureaucracy,visacontrolsandassociatedcountryregulations.
Barriers to commencing international trade:
Atotalof127respondentsindicatedtheydidnotcurrentlyengageininternationalactivity.
26%oftheserespondentsindicatedtheydidnottradeinternationallyduetoalackofinternationalcontracts,and22%wereuncertainofhowtostartexploringopportunities.
46%oftheserespondentssuggestedadatabaseofpotentialbuyers/supplierswouldhelpthemstartexporting.
41%oftheserespondentssuggestedfinanceorgrantswouldassist,and34%saidbusinessmentoring.
Innovation in international business activity and the outlook for export sales
AIBS2017surveyedcompaniesonanyinnovativeactivitiestheyhaveintroducedtoincreaseexportsales,aswellasbusinesses’attitudestowardsthefuture.Findingsaresummarisedbelow,keyfindingsinclude:
Innovation as a driver of export sales
Atotalof68%ofcompaniesinvolvedintheaboveformsofinnovationconsideredthatinnovationswereveryimportantoressentialfordrivinginternationalsales.
49%ofrespondentsintroducedproductinnovation,32%marketinginnovation,23%organisationalinnovationand27%processinnovationtodriveinternationalsales.10%ofcompaniesintroducedotherinnovations(suchastechnological,digitalandbusinessmodelinnovation).
Youngercompaniesaremorelikelytogenerateinternationalrevenuethroughintellectualproperty(IP)thanoldercompanies.
Future outlook
87%ofallrespondentsexpectthefinancialoutlookfortheirinternationaloperationstobethesameorbetteroverthenexttwoyearscomparedtothelasttwoyears.
Theindustrysectorsthatindicatedtheirfuturefinancialoutlookisbetterthanintheprevioustwoyearswereagriculture,forestryandfishing,manufacturing,wholesaletrade,professionalservices,andeducationandtrainingservices.
10
1 | IntroductionInternationalbusinessisessentialtosustainingAustralia’songoingeconomicprosperity.Technological,political,socialandculturalchange,togetherwithinternationaltrade,havemadeiteasierfororganisations,largeandsmall,toincreasetheirmarketshareforproductsandservices.Acomprehensiveunderstandingofthecriticalchallenges,andsuccessfactors,thatcontributetoAustralianbusinesssuccessinglobalmarketsisessentialtodeliverbetterstrategiesandsupportforAustralianbusiness.
ThisreportaimstobetterunderstandtheinternationalbusinessactivityofAustralianfirms,throughtheresultsofanextensivesurveyofbusinessestradingwithandinoverseasmarkets.
Since2014,Australia’sInternationalBusinessSurvey(AIBS)1hashighlightedkeyinsightsandissuesforAustralia’sinternationalbusinesscommunity,atthesametimepresentingoveralleconomictrends.In2017,theExportCouncilofAustralia(ECA)hascommissionedtheCentreforBusinessandSocialInnovation(CBSI)attheUniversityofTechnologySydney(UTS)toproducethe2017Australia’sInternationalBusinessSurvey(AIBSReport).
11
AIB
S 2017
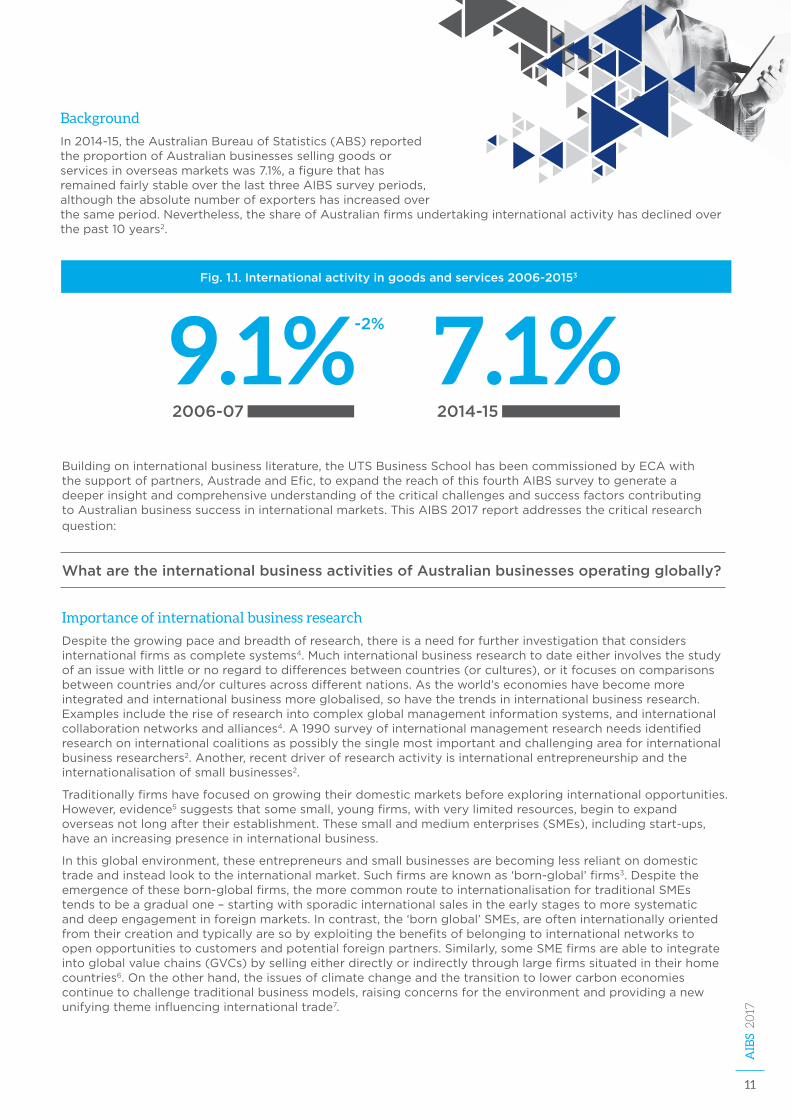
Background
In2014-15,theAustralianBureauofStatistics(ABS)reportedtheproportionofAustralianbusinessessellinggoodsorservicesinoverseasmarketswas7.1%,afigurethathasremainedfairlystableoverthelastthreeAIBSsurveyperiods,althoughtheabsolutenumberofexportershasincreasedoverthesameperiod.Nevertheless,theshareofAustralianfirmsundertakinginternationalactivityhasdeclinedoverthepast10years2.
Buildingoninternationalbusinessliterature,theUTSBusinessSchoolhasbeencommissionedbyECAwiththesupportofpartners,AustradeandEfic,toexpandthereachofthisfourthAIBSsurveytogenerateadeeperinsightandcomprehensiveunderstandingofthecriticalchallengesandsuccessfactorscontributingtoAustralianbusinesssuccessininternationalmarkets.ThisAIBS2017reportaddressesthecriticalresearchquestion:
What are the international business activities of Australian businesses operating globally?
Importance of international business research
Despitethegrowingpaceandbreadthofresearch,thereisaneedforfurtherinvestigationthatconsidersinternationalfirmsascompletesystems4.Muchinternationalbusinessresearchtodateeitherinvolvesthestudyofanissuewithlittleornoregardtodifferencesbetweencountries(orcultures),oritfocusesoncomparisonsbetweencountriesand/orculturesacrossdifferentnations.Astheworld’seconomieshavebecomemoreintegratedandinternationalbusinessmoreglobalised,sohavethetrendsininternationalbusinessresearch.Examplesincludetheriseofresearchintocomplexglobalmanagementinformationsystems,andinternationalcollaborationnetworksandalliances4.A1990surveyofinternationalmanagementresearchneedsidentifiedresearchoninternationalcoalitionsaspossiblythesinglemostimportantandchallengingareaforinternationalbusinessresearchers2.Another,recentdriverofresearchactivityisinternationalentrepreneurshipandtheinternationalisationofsmallbusinesses2.
Traditionallyfirmshavefocusedongrowingtheirdomesticmarketsbeforeexploringinternationalopportunities.However,evidence5suggeststhatsomesmall,youngfirms,withverylimitedresources,begintoexpandoverseasnotlongaftertheirestablishment.Thesesmallandmediumenterprises(SMEs),includingstart-ups,haveanincreasingpresenceininternationalbusiness.
Inthisglobalenvironment,theseentrepreneursandsmallbusinessesarebecominglessreliantondomestictradeandinsteadlooktotheinternationalmarket.Suchfirmsareknownas‘born-global’firms3.Despitetheemergenceoftheseborn-globalfirms,themorecommonroutetointernationalisationfortraditionalSMEstendstobeagradualone–startingwithsporadicinternationalsalesintheearlystagestomoresystematicanddeepengagementinforeignmarkets.Incontrast,the‘bornglobal’SMEs,areofteninternationallyorientedfromtheircreationandtypicallyaresobyexploitingthebenefitsofbelongingtointernationalnetworkstoopenopportunitiestocustomersandpotentialforeignpartners.Similarly,someSMEfirmsareabletointegrateintoglobalvaluechains(GVCs)bysellingeitherdirectlyorindirectlythroughlargefirmssituatedintheirhomecountries6.Ontheotherhand,theissuesofclimatechangeandthetransitiontolowercarboneconomiescontinuetochallengetraditionalbusinessmodels,raisingconcernsfortheenvironmentandprovidinganewunifyingthemeinfluencinginternationaltrade7.
Fig. 1.1. International activity in goods and services 2006-20153
9.1%2006-07
7.1%2014-15
-2%
12
Thereare,forexample,jointventuresbetweenAustralianandinternationalfirmsinresearchanddevelopmentintorenewableenergy,biotechnologies(especiallypharmaceuticals),precisionelectronics(computerchips),smartmanufacturingandvariousagri-businesses,openingthedoortopotentiallyveryprofitablecommercialopportunitiesforAustralianbusinesses.
Despitethenarrowfocusofmostinternationalbusinessresearch,therealchallengefacedbybusinessesoperatinginternationallynowisintegrationofinternationalactivities8.Astheproducts,productionprocessesandmarketsofmodernglobalmanagementbecomeincreasinglydiversified,integrationoftheseactivitiesgrowsinimportance.JohnDunning8notesthesignificanceofthisforinternationalbusinessresearchers:‘Duetobothexogenousandendogenousfactors,thepracticeofinternationalbusinessisinvolvinganincreasingratiooftransactiontototalcosts.Butinordertostudyandexplainthisphenomenon,internationalbusinessscholarsneednotonlytodrawupondifferentdisciplinesbuttodosoinacoordinatedway’.Newmodesofresearchstudyareneededthatconsiderholisticandsystem-basedapproaches,includingtheinterdisciplinaryaspectsoftheinternationalfirms.Dynamicvaluechains,forexample,arekeytotheintegrationandalignmentoftheneedsofcustomers,consumers,end-users,suppliersandthirdpartiesthroughcollaborationforcreatinganddelivering9.Adynamicapproachaimstodevelopnewbusinessmodelsandnetworks9basedonwhatinternationalcustomerswant.Thisisachangeinmindsetfromfunctionalspecialisationtowardsembeddingtheprinciplesandpracticesofthesupplychain,andvalue-networkthinking,withinthephilosophyofthefirm.
About this survey
ThisreportanalysestheinternationalbusinessresponsesofAIBS2017facilitatedbyAMRbetweenAprilandJune2017.Asaresult,thisreportprovidesinsightsgatheredfrom941Australianinternationally-activebusinessesdrawnfrom19industrysectorsandoperatingacrossmorethan90internationalmarkets.Thesesurveyrespondentswereinvolvedacrossarangeofinternationaltradingsettingsincludingtheexportandimportofgoodsandservices,makingoutwardinvestments,receivinginwardinvestments,earningrevenuefromintellectualpropertyandundertakinginternationalresearchanddevelopmentactivities.Keyfeaturesandhighlightsinclude:
a) anexaminationoftheimportanceofinternationalmarketsandthediversityandtypesofinternationalbusinessactivity,
b) thekeyimpactsofAustralia’sFTAsonexportearningsandpotentialforgrowthininternationalmarkets,
c) thechangingnatureofinternationalbusinessactivityanditsimplicationsforthefutureofAustralianbusinesses,
d) thebarrierstoandopportunitiesforinternationalbusinessactivities,
e) thecontributionthatinnovationmakestointernationalbusinessactivityandtrade,and
f) theexistingchannelsofsupportandassistanceprovidedtointernationalbusinesseswhenoperatingininternationalmarkets.
AIBS2017alsocaptured127responsesfrombusinessesthatarenotcurrentlyengagedininternationalactivities,mainlyduetoalackofinternationalbusinessawarenessandacurrentconcentrationondomesticoperations.Inthiscontext,AIBS2017providesanin-depthunderstandingofthesuccessfactorsandchallengesexperiencedbyAustralianfirmswhenengagingacrossmultipleinternationalsettings.
AIBS2017isacriticalcontributiontoprovidinginsightsintothe941internationallyactivebusinesseswhorespondedtothesurveyandthe127respondentswhoarenotengagedininternationalbusinessactivity.Whilsttheaboverecommendationsandsuggestionsaimtosteereffortstowardsassistinginternationalbusinessesgrow,furtherresearchcouldbeundertakenonsomeofthecriticaltradeinfluencingfactorsthatunderpinsuccessforinternationalbusinesses.
13
AIB
S 2017
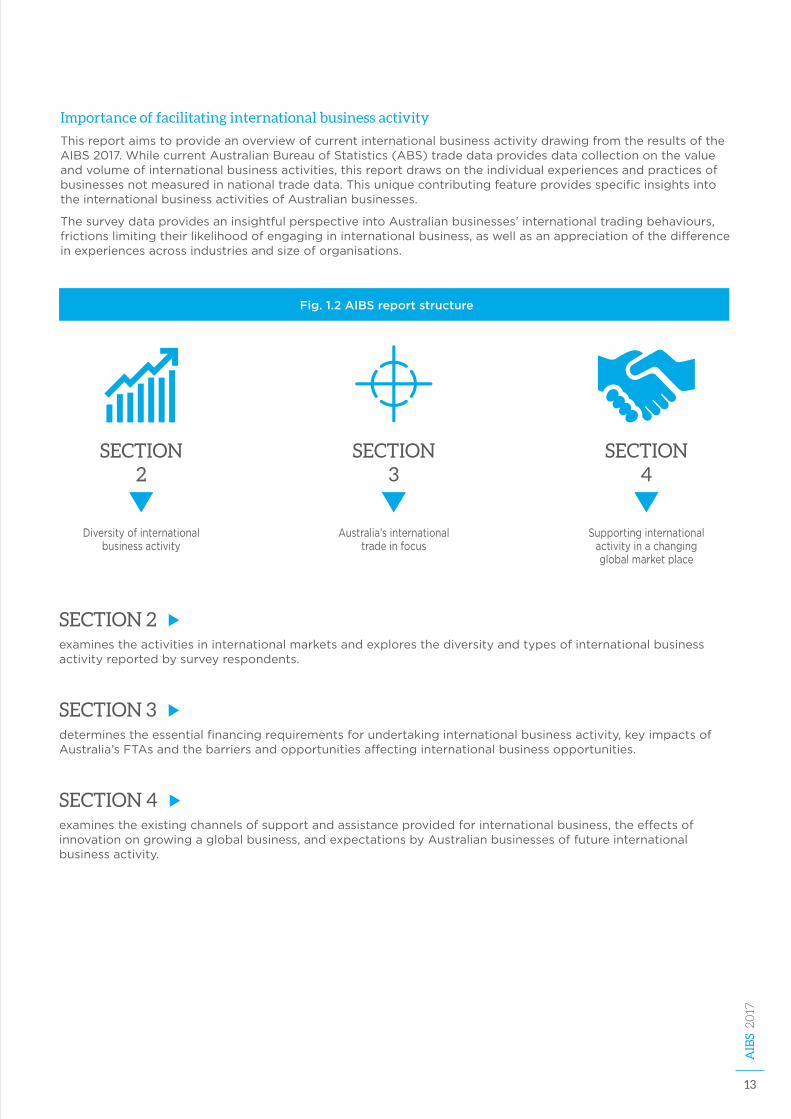
Fig. 1.2 AIBS report structure
Diversityofinternationalbusinessactivity
SECTION 2
Australia’sinternationaltradeinfocus
SECTION 3
Supportinginternationalactivityinachangingglobalmarketplace
SECTION 4
SECTION 2 examinestheactivitiesininternationalmarketsandexploresthediversityandtypesofinternationalbusinessactivityreportedbysurveyrespondents.
SECTION 3 determinestheessentialfinancingrequirementsforundertakinginternationalbusinessactivity,keyimpactsofAustralia’sFTAsandthebarriersandopportunitiesaffectinginternationalbusinessopportunities.
SECTION 4 examinestheexistingchannelsofsupportandassistanceprovidedforinternationalbusiness,theeffectsofinnovationongrowingaglobalbusiness,andexpectationsbyAustralianbusinessesoffutureinternationalbusinessactivity.
Importance of facilitating international business activity
ThisreportaimstoprovideanoverviewofcurrentinternationalbusinessactivitydrawingfromtheresultsoftheAIBS2017.WhilecurrentAustralianBureauofStatistics(ABS)tradedataprovidesdatacollectiononthevalueandvolumeofinternationalbusinessactivities,thisreportdrawsontheindividualexperiencesandpracticesofbusinessesnotmeasuredinnationaltradedata.ThisuniquecontributingfeatureprovidesspecificinsightsintotheinternationalbusinessactivitiesofAustralianbusinesses.
ThesurveydataprovidesaninsightfulperspectiveintoAustralianbusinesses’internationaltradingbehaviours,frictionslimitingtheirlikelihoodofengagingininternationalbusiness,aswellasanappreciationofthedifferenceinexperiencesacrossindustriesandsizeoforganisations.

14
The diversity of Australia’s international business activity2
What the survey says
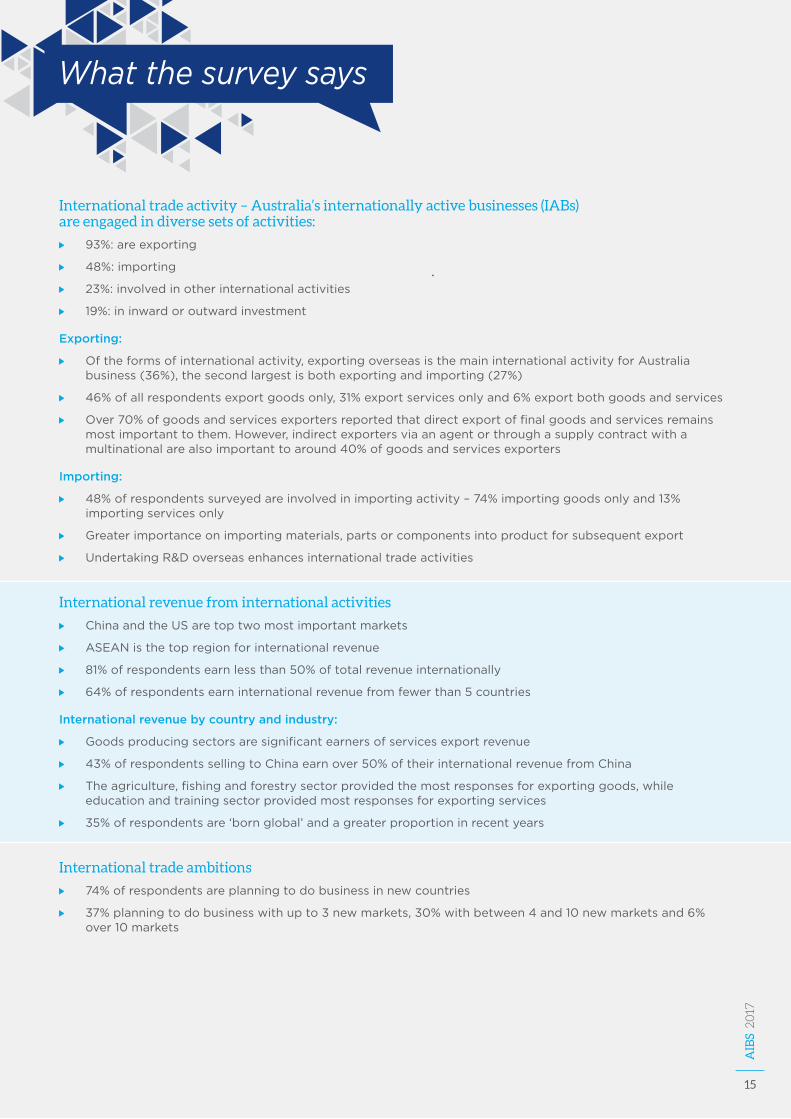
International trade activity – Australia’s internationally active businesses (IABs) are engaged in diverse sets of activities:
93%:areexporting
48%:importing
23%:involvedinotherinternationalactivities
19%:ininwardoroutwardinvestment
Exporting:
Oftheformsofinternationalactivity,exportingoverseasisthemaininternationalactivityforAustraliabusiness(36%),thesecondlargestisbothexportingandimporting(27%)
46%ofallrespondentsexportgoodsonly,31%exportservicesonlyand6%exportbothgoodsandservices
Over70%ofgoodsandservicesexportersreportedthatdirectexportoffinalgoodsandservicesremainsmostimportanttothem.However,indirectexportersviaanagentorthroughasupplycontractwithamultinationalarealsoimportanttoaround40%ofgoodsandservicesexporters
Importing:
48%ofrespondentssurveyedareinvolvedinimportingactivity–74%importinggoodsonlyand13%importingservicesonly
Greaterimportanceonimportingmaterials,partsorcomponentsintoproductforsubsequentexport
UndertakingR&Doverseasenhancesinternationaltradeactivities
International revenue from international activities
ChinaandtheUSaretoptwomostimportantmarkets
ASEANisthetopregionforinternationalrevenue
81%ofrespondentsearnlessthan50%oftotalrevenueinternationally
64%ofrespondentsearninternationalrevenuefromfewerthan5countries
International revenue by country and industry:
Goodsproducingsectorsaresignificantearnersofservicesexportrevenue
43%ofrespondentssellingtoChinaearnover50%oftheirinternationalrevenuefromChina
Theagriculture,fishingandforestrysectorprovidedthemostresponsesforexportinggoods,whileeducationandtrainingsectorprovidedmostresponsesforexportingservices
35%ofrespondentsare‘bornglobal’andagreaterproportioninrecentyears
International trade ambitions
74%ofrespondentsareplanningtodobusinessinnewcountries
37%planningtodobusinesswithupto3newmarkets,30%withbetween4and10newmarketsand6%over10markets
15
AIB
S 2017
16
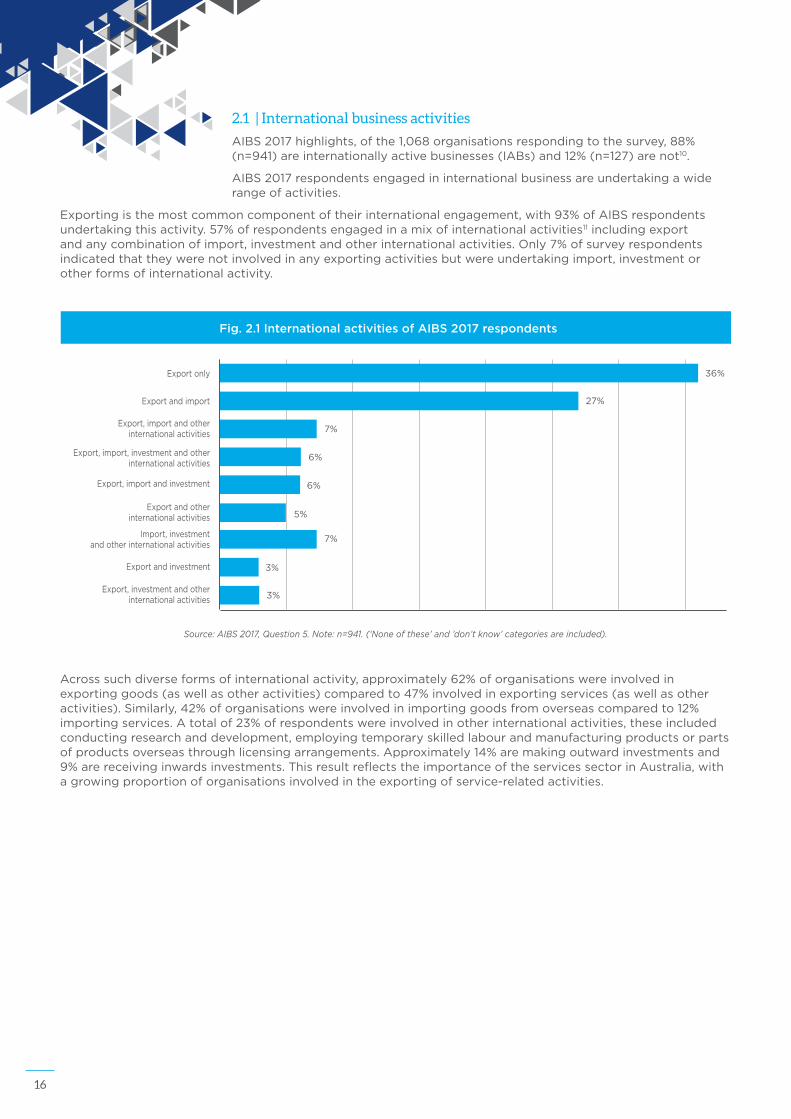
2.1 | International business activities
AIBS2017highlights,ofthe1,068organisationsrespondingtothesurvey,88%(n=941)areinternationallyactivebusinesses(IABs)and12%(n=127)arenot10.
AIBS2017respondentsengagedininternationalbusinessareundertakingawiderangeofactivities.
Exportingisthemostcommoncomponentoftheirinternationalengagement,with93%ofAIBSrespondentsundertakingthisactivity.57%ofrespondentsengagedinamixofinternationalactivities11includingexportandanycombinationofimport,investmentandotherinternationalactivities.Only7%ofsurveyrespondentsindicatedthattheywerenotinvolvedinanyexportingactivitiesbutwereundertakingimport,investmentorotherformsofinternationalactivity.
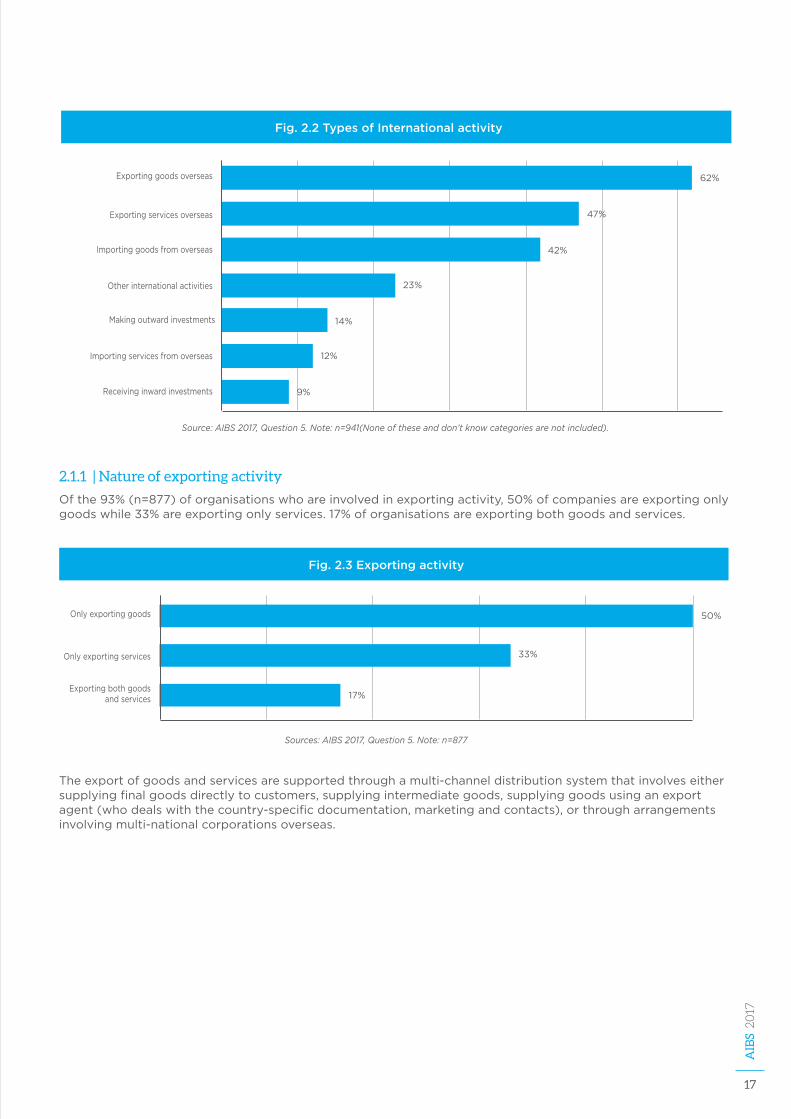
Acrosssuchdiverseformsofinternationalactivity,approximately62%oforganisationswereinvolvedinexportinggoods(aswellasotheractivities)comparedto47%involvedinexportingservices(aswellasotheractivities).Similarly,42%oforganisationswereinvolvedinimportinggoodsfromoverseascomparedto12%importingservices.Atotalof23%ofrespondentswereinvolvedinotherinternationalactivities,theseincludedconductingresearchanddevelopment,employingtemporaryskilledlabourandmanufacturingproductsorpartsofproductsoverseasthroughlicensingarrangements.Approximately14%aremakingoutwardinvestmentsand9%arereceivinginwardsinvestments.ThisresultreflectstheimportanceoftheservicessectorinAustralia,withagrowingproportionoforganisationsinvolvedintheexportingofservice-relatedactivities.
Fig. 2.1 International activities of AIBS 2017 respondents
Exportonly
Exportandimport
Export,importandotherinternationalactivities
Export,import,investmentandotherinternationalactivities
Export,importandinvestment
Exportandotherinternationalactivities
Import,investmentandotherinternationalactivities
Exportandinvestment
Export,investmentandotherinternationalactivities
27%
7%
6%
6%
5%
7%
3%
3%
36%
Source: AIBS 2017, Question 5. Note: n=941. (‘None of these’ and ’don’t know’ categories are included).
17
AIB
S 2017
Fig. 2.2 Types of International activity
Exportinggoodsoverseas
Exportingservicesoverseas
Importinggoodsfromoverseas
Otherinternationalactivities
Makingoutwardinvestments
Importingservicesfromoverseas
Receivinginwardinvestments
62%
47%
42%
23%
14%
12%
9%
Source: AIBS 2017, Question 5. Note: n=941(None of these and don’t know categories are not included).
2.1.1 | Nature of exporting activity
Ofthe93%(n=877)oforganisationswhoareinvolvedinexportingactivity,50%ofcompaniesareexportingonlygoodswhile33%areexportingonlyservices.17%oforganisationsareexportingbothgoodsandservices.
Theexportofgoodsandservicesaresupportedthroughamulti-channeldistributionsystemthatinvolveseithersupplyingfinalgoodsdirectlytocustomers,supplyingintermediategoods,supplyinggoodsusinganexportagent(whodealswiththecountry-specificdocumentation,marketingandcontacts),orthrougharrangementsinvolvingmulti-nationalcorporationsoverseas.
Fig. 2.3 Exporting activity
Onlyexportinggoods 50%
Onlyexportingservices 33%
Exportingbothgoodsandservices 17%
Sources: AIBS 2017, Question 5. Note: n=877
18
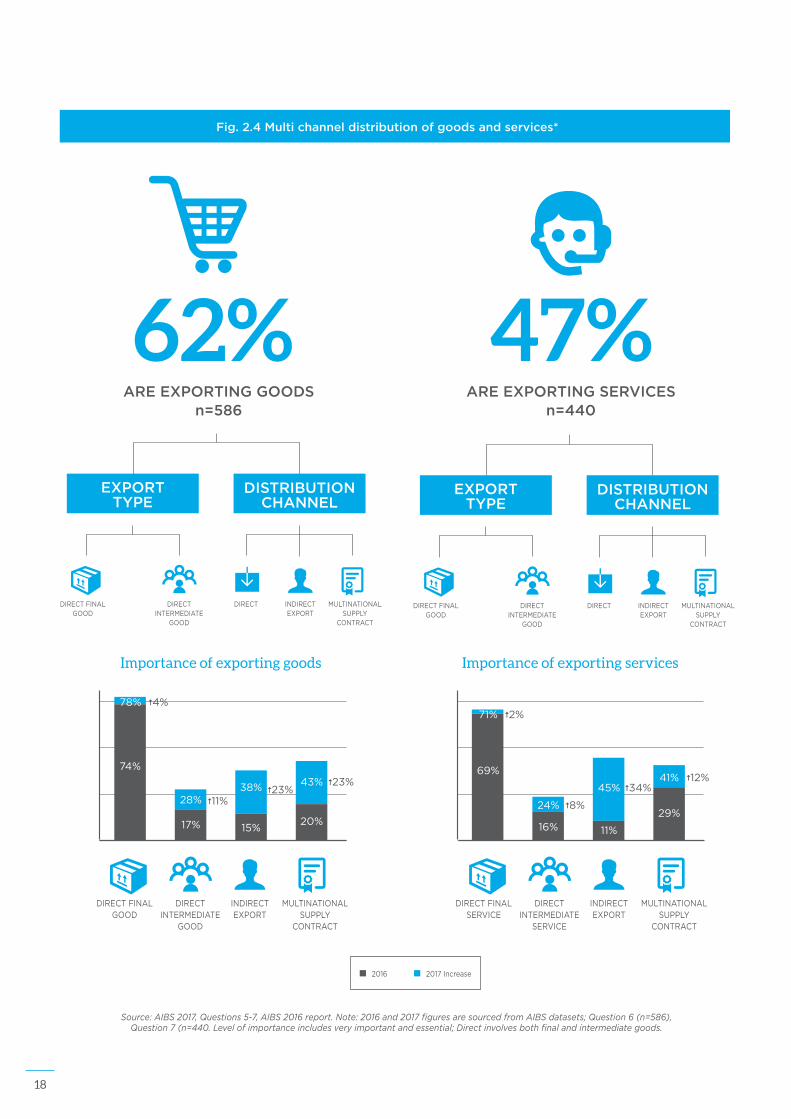
Source: AIBS 2017, Questions 5-7, AIBS 2016 report. Note: 2016 and 2017 figures are sourced from AIBS datasets; Question 6 (n=586), Question 7 (n=440. Level of importance includes very important and essential; Direct involves both final and intermediate goods.
Fig. 2.4 Multi channel distribution of goods and services*
2016 2017Increase
62%ARE EXPORTING GOODS
n=586
DIRECTFINALGOOD
DIRECTINTERMEDIATE
GOOD
DIRECT INDIRECTEXPORT
MULTINATIONALSUPPLY
CONTRACT
EXPORT TYPE
DISTRIBUTION CHANNEL
47%ARE EXPORTING SERVICES
n=440
EXPORT TYPE
DISTRIBUTION CHANNEL
DIRECTFINALGOOD
DIRECTINTERMEDIATE
GOOD
DIRECT INDIRECTEXPORT
MULTINATIONALSUPPLY
CONTRACT
DIRECTFINALSERVICE
DIRECTINTERMEDIATE
SERVICE
INDIRECTEXPORT
MULTINATIONALSUPPLY
CONTRACT
69%
71%
16%
24%
11%
45%
29%
41%
2%
8%
34%12%
Importance of exporting services
DIRECTFINALGOOD
DIRECTINTERMEDIATE
GOOD
INDIRECTEXPORT
MULTINATIONALSUPPLY
CONTRACT
74%
17%
28%
15%
38%
20%
4%
11%23%
43% 23%
Importance of exporting goods
78%
19
AIB
S 2017
Services,andgoods,canbedistributedaseitherafinalorintermediategoodorservice.However,finalgoodsandservicesreachthecustomerthroughavarietyofdifferentdistributionchannels.
Forthe93%ofsurveyrespondentswhoareexporting,exportingoffinalgoodswasthemostcommonmodeofexporting,with78%ofsurveyrespondentsindicatingthatfinalgoodsexportsdirectlytocustomerswasimportantincontributingtotheirinternationalrevenue,upfrom74%in201612.
Dealingdirectlywithcustomerstoexportfinalgoodsisagrowingtrendespeciallysincecustomersarebecomingincreasinglyaccustomedtosourcinggoodsdirectlyfromoverseas.Thishasenabledopportunitiesfor‘smart’andinnovativefirmstoprovideservicesinsupportofthesepurchases.Inaddition,opportunitiestobuildbrandsanddeepencustomerrelationshipsthroughimprovedbusinessintelligenceanddataanalyticshasbecomepossiblethroughthedirectdealingwithcustomersmodeofdistribution.Improvedunderstandingof,andsharingofinformationabout,thewaysAustralianfirmsareengagingdirectlywithitscustomers,iscriticaltoenablingmorefirmstoexpandtheirexportmarkets.
Similarly,importingfinalservicesisthemostcommonformforexportingservices,where71%ofsurveyrespondentsindicatedthatfinalservicesexportsdirectlytocustomerswasveryimportantincontributingtotheirinternationalrevenue.Thisfigureisupfrom69%in2016.(Note: whilst a comparison with AIBS 2016 highlights an increase in the proportion of respondents’ importance, the organisational sample types differ from those of the 2017 survey).
Usingexportagentsasadistributionchannelrankedthirdfordistributinggoodsimportance(38%)andsecondfordistributingservicesimportance(45%)incontributingtointernationalearnings.Anagentisgenerallypaidbytheexporterbasedonacommissionofsalesvaluegenerated13.Academicliterature14,suggestsorganisationsemployagentstoovercometheir“smallness”,languageissuesandsocialproblemsthatmaybeexperiencedwhendealinginforeigncountries.
Exportinggoodsusingsupplycontractsinvolvingoverseasmultinationalcompanieswasconsideredtobeveryimportantandessentialby43%ofrespondents(41%forservices).ThisisanincreasefromAIBS2016of23%forgoodsand12%forservices.Withmorecompaniesengagingwithmulti-nationalcorporationsanddrawingupontheservicesofagents,theseindirectdistributionchannelsareexpectedtoplayanincreasinglysignificantroleinsupportinginternationalbusiness.Organisationsdivestingresponsibilitiestothirdpartieswillbenefitthroughimprovedawarenessandknowledgeregardingmarketaccess,FTAarrangementsandotherrelevantconsiderationsinvolvedininternationaltransactions.Theincreasinginvolvementofmulti-nationalcorporationsalsosignalspotentialopportunitiesfornetworking,collaborationandaccessintonewmarkets.
20
Fig. 2.5 Distribution channels – manufacturing sector
Fig. 2.5 Importance of manufacturing distribution channels
Finalgood 79%
Intermediategood 30%
Incountryagent 37%
Multi-national 45%
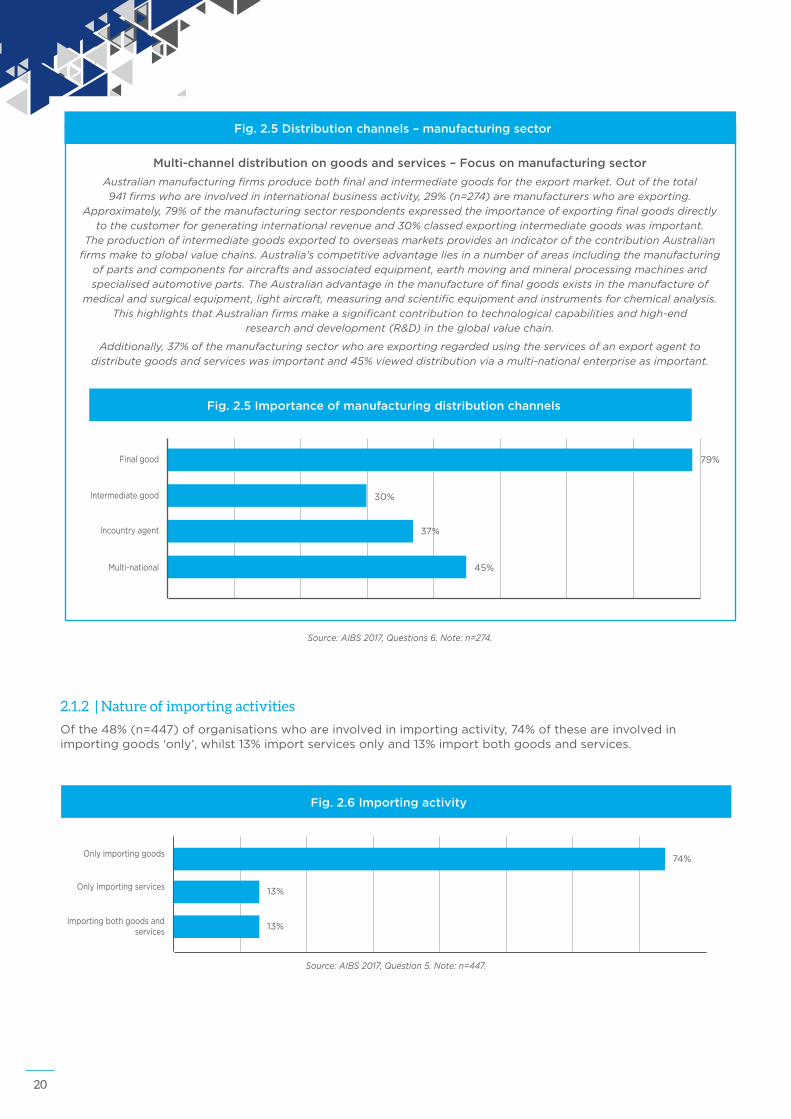
Multi-channel distribution on goods and services – Focus on manufacturing sector
Australian manufacturing firms produce both final and intermediate goods for the export market. Out of the total 941 firms who are involved in international business activity, 29% (n=274) are manufacturers who are exporting.
Approximately, 79% of the manufacturing sector respondents expressed the importance of exporting final goods directly to the customer for generating international revenue and 30% classed exporting intermediate goods was important.
The production of intermediate goods exported to overseas markets provides an indicator of the contribution Australian firms make to global value chains. Australia’s competitive advantage lies in a number of areas including the manufacturing
of parts and components for aircrafts and associated equipment, earth moving and mineral processing machines and specialised automotive parts. The Australian advantage in the manufacture of final goods exists in the manufacture of
medical and surgical equipment, light aircraft, measuring and scientific equipment and instruments for chemical analysis. This highlights that Australian firms make a significant contribution to technological capabilities and high-end
research and development (R&D) in the global value chain.
Additionally, 37% of the manufacturing sector who are exporting regarded using the services of an export agent to distribute goods and services was important and 45% viewed distribution via a multi-national enterprise as important.
Source: AIBS 2017, Questions 6. Note: n=274.
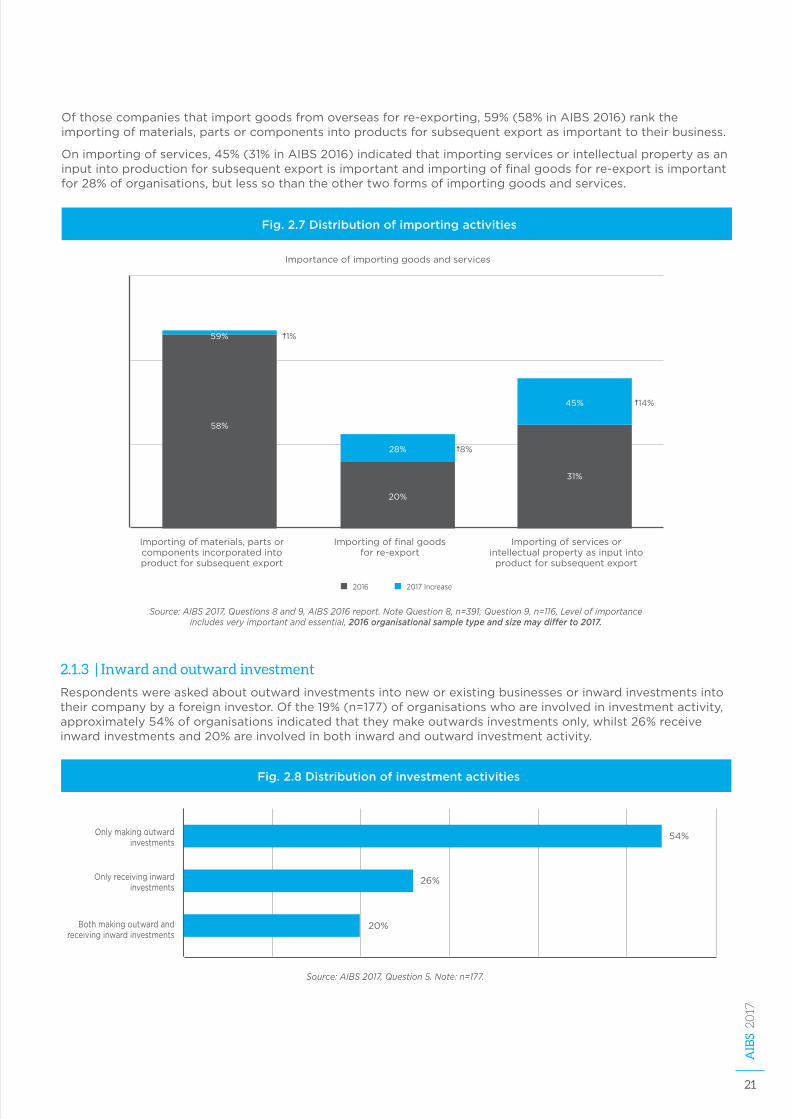
2.1.2 | Nature of importing activities
Ofthe48%(n=447)oforganisationswhoareinvolvedinimportingactivity,74%oftheseareinvolvedinimportinggoods‘only’,whilst13%importservicesonlyand13%importbothgoodsandservices.
Fig. 2.6 Importing activity
Onlyimportinggoods74%
Onlyimportingservices 13%
Importingbothgoodsandservices
13%
Source: AIBS 2017, Question 5. Note: n=447.
21
AIB
S 2017
Ofthosecompaniesthatimportgoodsfromoverseasforre-exporting,59%(58%inAIBS2016)ranktheimportingofmaterials,partsorcomponentsintoproductsforsubsequentexportasimportanttotheirbusiness.
Onimportingofservices,45%(31%inAIBS2016)indicatedthatimportingservicesorintellectualpropertyasaninputintoproductionforsubsequentexportisimportantandimportingoffinalgoodsforre-exportisimportantfor28%oforganisations,butlesssothantheothertwoformsofimportinggoodsandservices.
2.1.3 | Inward and outward investment
Respondentswereaskedaboutoutwardinvestmentsintoneworexistingbusinessesorinwardinvestmentsintotheircompanybyaforeigninvestor.Ofthe19%(n=177)oforganisationswhoareinvolvedininvestmentactivity,approximately54%oforganisationsindicatedthattheymakeoutwardsinvestmentsonly,whilst26%receiveinwardinvestmentsand20%areinvolvedinbothinwardandoutwardinvestmentactivity.
Fig. 2.8 Distribution of investment activities
Onlymakingoutwardinvestments
Onlyreceivinginwardinvestments
Bothmakingoutwardandreceivinginwardinvestments
54%
26%
20%
Source: AIBS 2017, Question 5. Note: n=177.
Source: AIBS 2017, Questions 8 and 9, AIBS 2016 report. Note Question 8, n=391; Question 9, n=116, Level of importance includes very important and essential, 2016 organisational sample type and size may differ to 2017.
Fig. 2.7 Distribution of importing activities
58%
1%
20%
28% 8%
31%
45% 14%
Importingofmaterials,partsorcomponentsincorporatedintoproductforsubsequentexport
Importingoffinalgoodsforre-export
Importingofservicesorintellectualpropertyasinputinto
productforsubsequentexport
Importanceofimportinggoodsandservices
2016 2017Increase
59%
22
Fig. 2.9 Importance of investment activity in generating international revenue
21%
34%
26%
58%
52%
72%
13%
32%
20%
Investinginanexistingoverseasbusinessi.e.viaa
merger/acquisition
Receivingcapitalfromanoverseasinvestor
Investinginanewoverseasoperationeg.salesbranch,subsidiary,manufacturing
facility
2016 2017Increase
Importanceofinternationalinvestment
Source: AIBS 2017, Questions 10-12. Note: Question 10, n=131; Question 11, n=81. Level of importance includes very important and essential; 2016 data from AIBS 2016 report.2016 organisational sample type and size may differ to 2017.
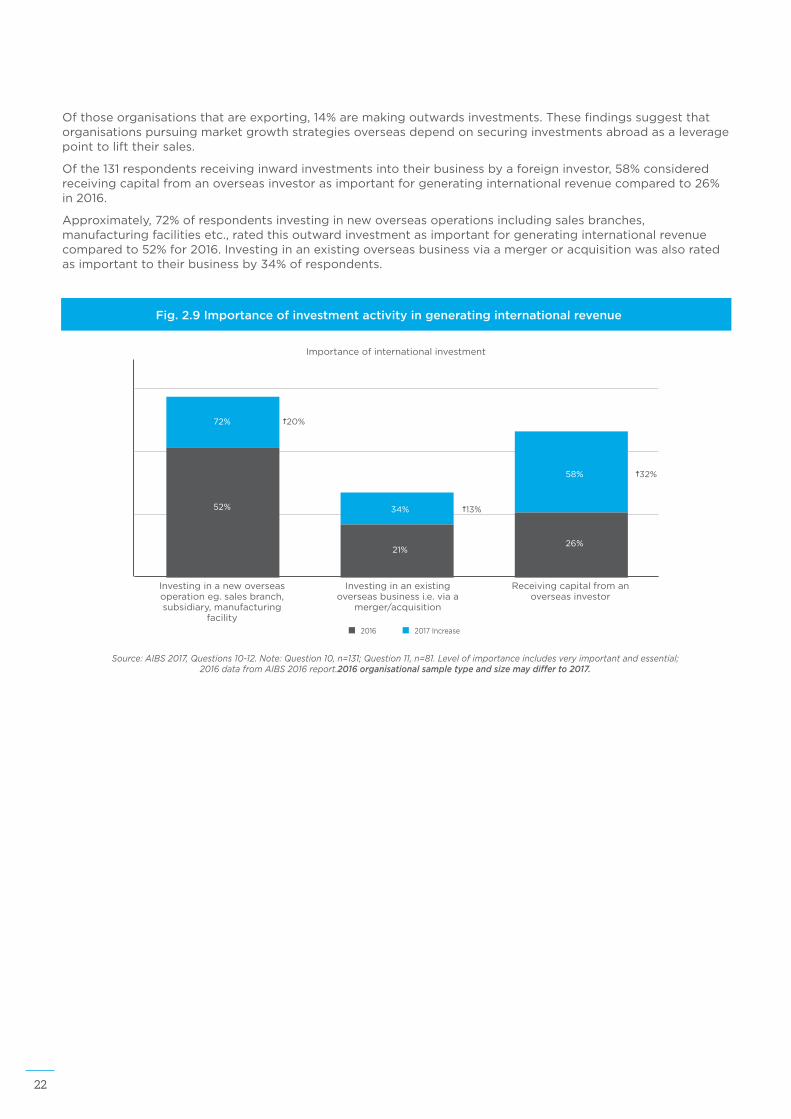
Ofthoseorganisationsthatareexporting,14%aremakingoutwardsinvestments.Thesefindingssuggestthatorganisationspursuingmarketgrowthstrategiesoverseasdependonsecuringinvestmentsabroadasaleveragepointtolifttheirsales.
Ofthe131respondentsreceivinginwardinvestmentsintotheirbusinessbyaforeigninvestor,58%consideredreceivingcapitalfromanoverseasinvestorasimportantforgeneratinginternationalrevenuecomparedto26%in2016.
Approximately,72%ofrespondentsinvestinginnewoverseasoperationsincludingsalesbranches,manufacturingfacilitiesetc.,ratedthisoutwardinvestmentasimportantforgeneratinginternationalrevenuecomparedto52%for2016.Investinginanexistingoverseasbusinessviaamergeroracquisitionwasalsoratedasimportanttotheirbusinessby34%ofrespondents.
23
AIB
S 2017
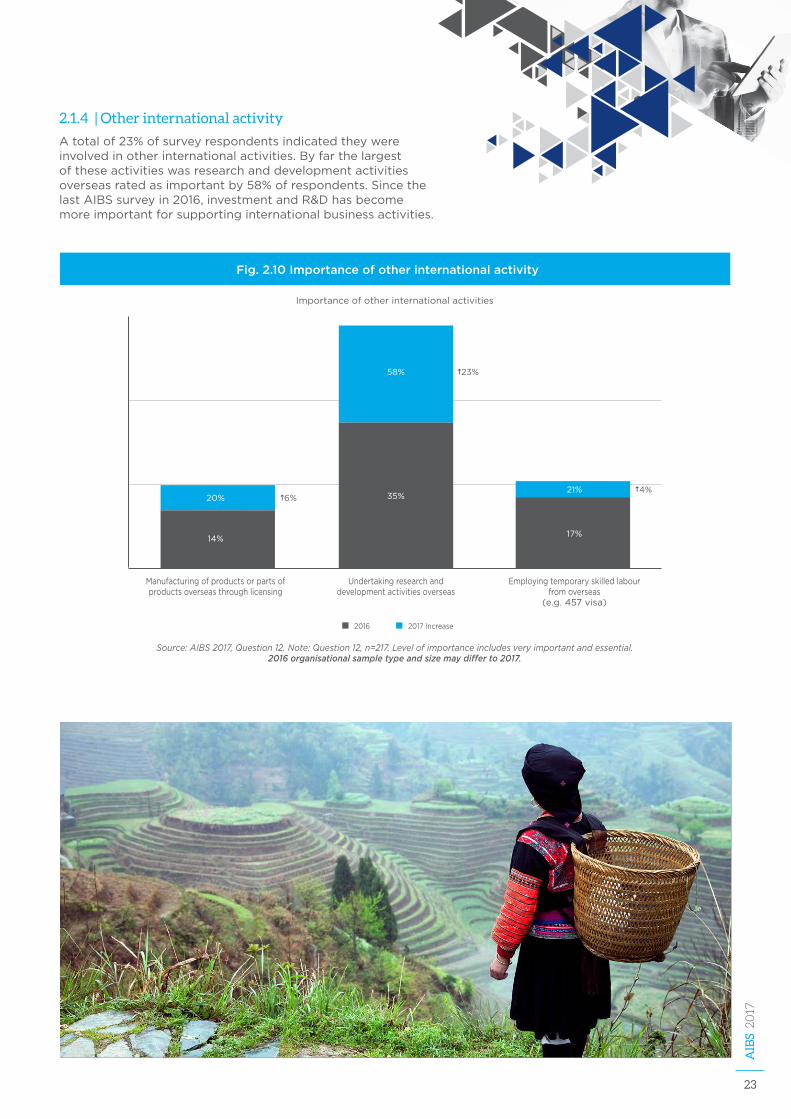
2.1.4 | Other international activity
Atotalof23%ofsurveyrespondentsindicatedtheywereinvolvedinotherinternationalactivities.Byfarthelargestoftheseactivitieswasresearchanddevelopmentactivitiesoverseasratedasimportantby58%ofrespondents.SincethelastAIBSsurveyin2016,investmentandR&Dhasbecomemoreimportantforsupportinginternationalbusinessactivities.
Fig. 2.10 Importance of other international activity
Manufacturingofproductsorpartsofproductsoverseasthroughlicensing
Undertakingresearchanddevelopmentactivitiesoverseas
Employingtemporaryskilledlabourfromoverseas
(e.g.457visa)
14%
20% 35%
58%
17%
21%6%
23%
4%
2016 2017Increase
Importanceofotherinternationalactivities
Source: AIBS 2017, Question 12. Note: Question 12, n=217. Level of importance includes very important and essential. 2016 organisational sample type and size may differ to 2017.
24
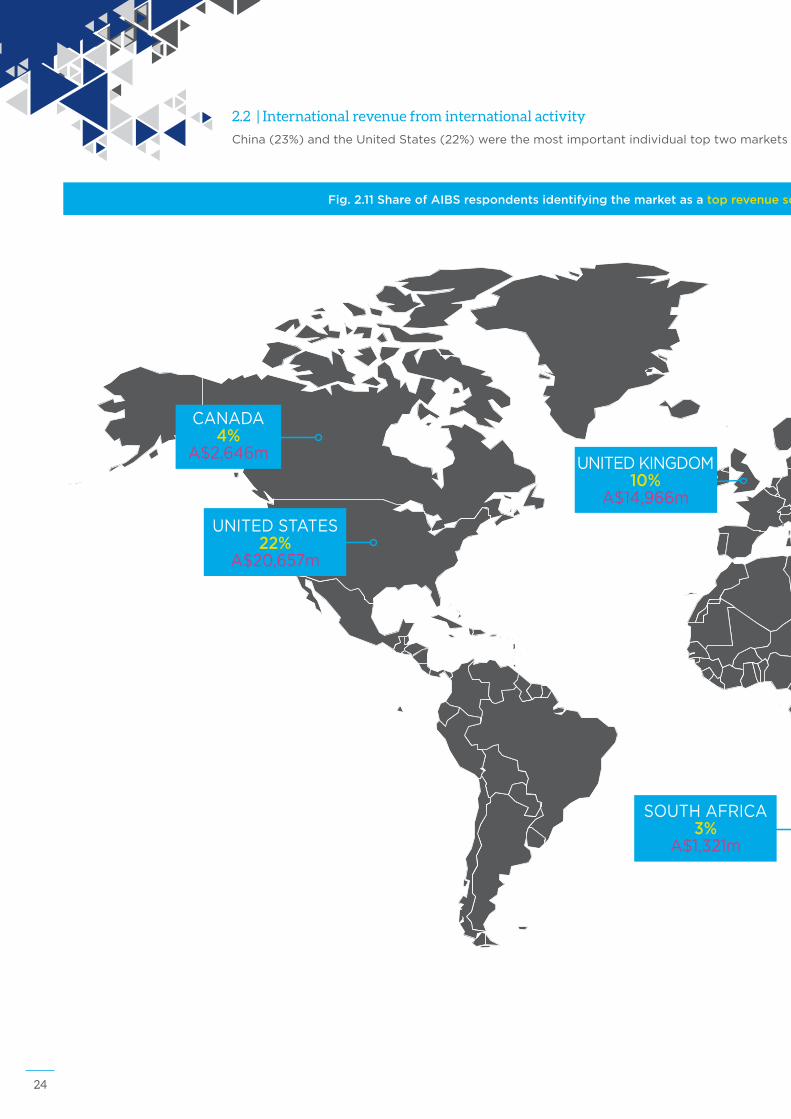
2.2 | International revenue from international activity
China(23%)andtheUnitedStates(22%)werethemostimportantindividualtoptwomarketsforAIBSrespondents,followedbyNewZealand(12%),Singapore(10%)andtheUnitedKingdom(10%).
Fig. 2.11 Share of AIBS respondents identifying the market as a top revenue source (%) and dollar value of total Australian exports to the market ($m)
CANADA4%
A$2,646m
UNITEDSTATES22%
A$20,657m
UNITEDKINGDOM10%
A$14,966m
SOUTHAFRICA3%
A$1,321m
25
AIB
S 2017
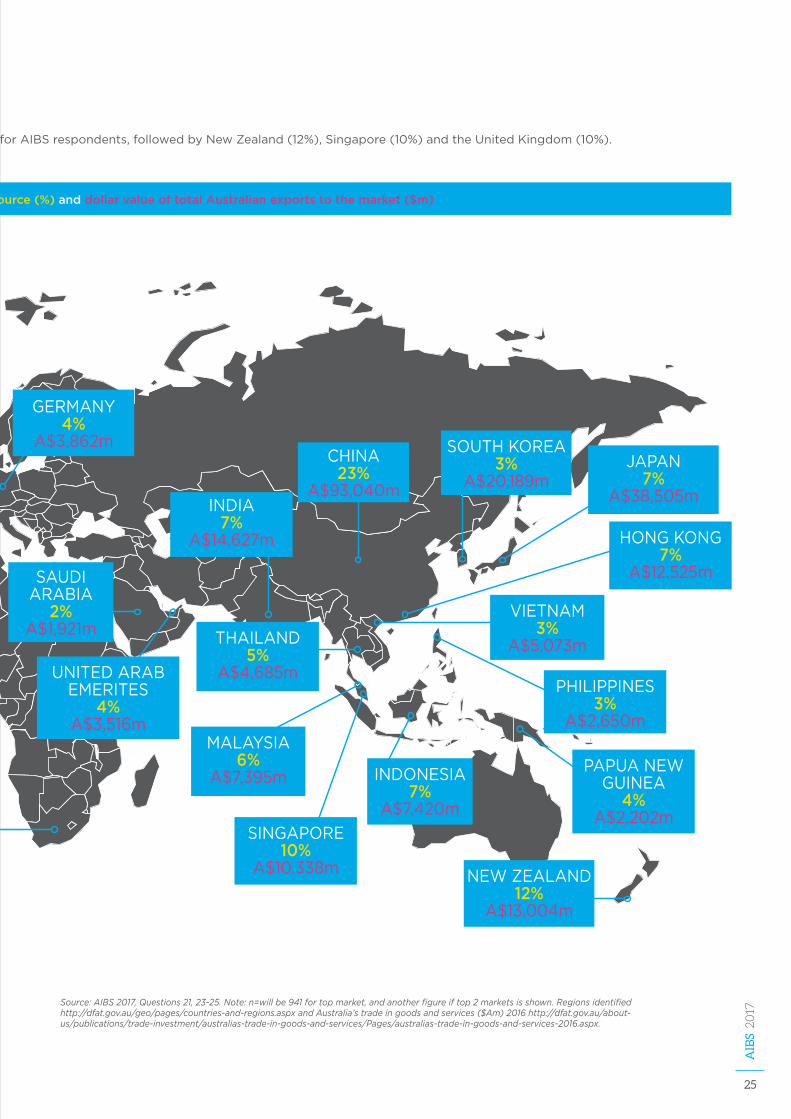
2.2 | International revenue from international activity
China(23%)andtheUnitedStates(22%)werethemostimportantindividualtoptwomarketsforAIBSrespondents,followedbyNewZealand(12%),Singapore(10%)andtheUnitedKingdom(10%).
Source: AIBS 2017, Questions 21, 23-25. Note: n=will be 941 for top market, and another figure if top 2 markets is shown. Regions identified http://dfat.gov.au/geo/pages/countries-and-regions.aspx and Australia’s trade in goods and services ($Am) 2016 http://dfat.gov.au/about-us/publications/trade-investment/australias-trade-in-goods-and-services/Pages/australias-trade-in-goods-and-services-2016.aspx.
Fig. 2.11 Share of AIBS respondents identifying the market as a top revenue source (%) and dollar value of total Australian exports to the market ($m)
GERMANY4%
A$3,862m
SAUDIARABIA
2% A$1,921m
UNITEDARABEMERITES
4% A$3,516m
INDIA7%
A$14,627m
CHINA23%
A$93,040m
SOUTHKOREA3%
A$20,189mJAPAN
7% A$38,505m
HONGKONG7%
A$12,525m
PHILIPPINES3%
A$2,650m
INDONESIA7%
A$7,420m
THAILAND5%
A$4,685m
PAPUANEWGUINEA
4% A$2,202m
NEWZEALAND12%
A$13,004m
VIETNAM3%
A$5,073m
SINGAPORE10%
A$10,338m
MALAYSIA6%
A$7,395m
26
Additionally,AIBS2017highlightsthatbycombiningtheASEANregioncountriesofBrunei,Cambodia,Indonesia,Malaysia,Philippines,Singapore,Thailand,Laos,MyanmarandVietnam,thesemarketsaccountfor29%ofrespondent’stoptwointernationalrevenues(basedontoptwomarkets)earned,exceedingtheshareoffirmsearningtheirhighestrevenuesfromChinaandtheUSrespectively.
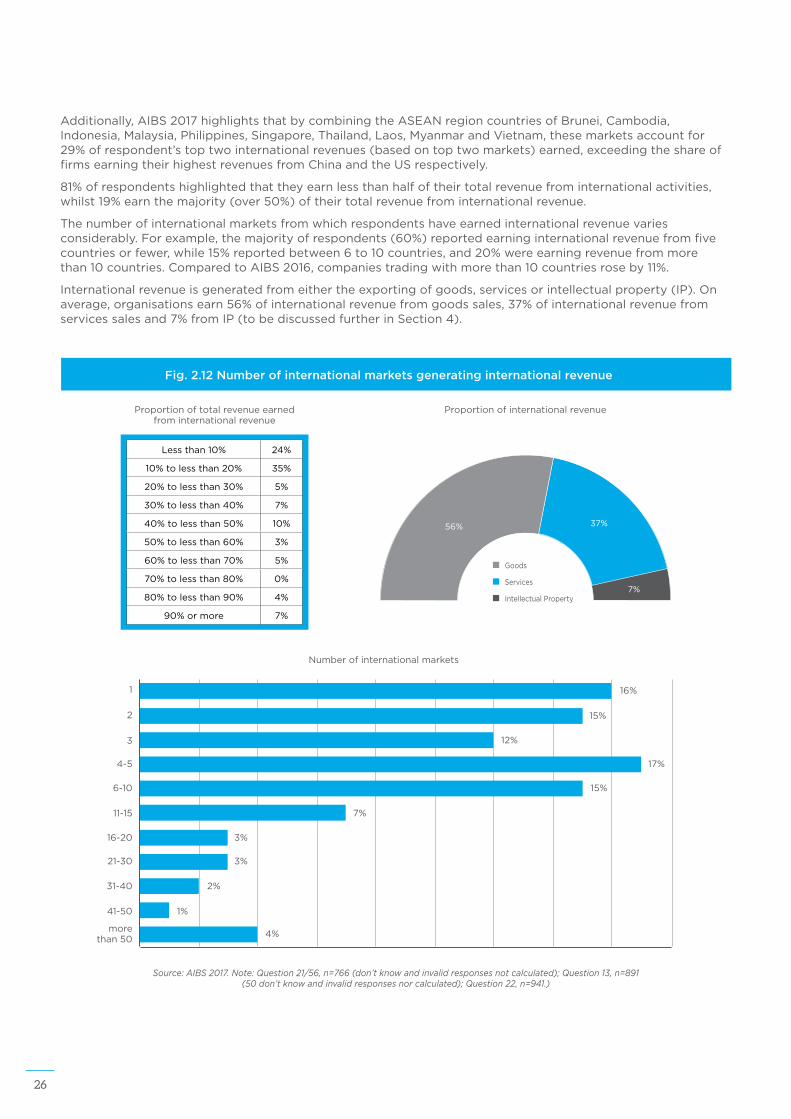
81%ofrespondentshighlightedthattheyearnlessthanhalfoftheirtotalrevenuefrominternationalactivities,whilst19%earnthemajority(over50%)oftheirtotalrevenuefrominternationalrevenue.
Thenumberofinternationalmarketsfromwhichrespondentshaveearnedinternationalrevenuevariesconsiderably.Forexample,themajorityofrespondents(60%)reportedearninginternationalrevenuefromfivecountriesorfewer,while15%reportedbetween6to10countries,and20%wereearningrevenuefrommorethan10countries.ComparedtoAIBS2016,companiestradingwithmorethan10countriesroseby11%.
Internationalrevenueisgeneratedfromeithertheexportingofgoods,servicesorintellectualproperty(IP).Onaverage,organisationsearn56%ofinternationalrevenuefromgoodssales,37%ofinternationalrevenuefromservicessalesand7%fromIP(tobediscussedfurtherinSection4).
Fig. 2.12 Number of international markets generating international revenue
1
2
3
4-5
6-10
11-15
16-20
21-30
morethan50
31-40
41-50
16%
15%
12%
17%
15%
7%
3%
3%
4%
2%
1%
Numberofinternationalmarkets
Lessthan10% 24%
10%tolessthan20% 35%
20%tolessthan30% 5%
30%tolessthan40% 7%
40%tolessthan50% 10%
50%tolessthan60% 3%
60%tolessthan70% 5%
70%tolessthan80% 0%
80%tolessthan90% 4%
90%ormore 7%
Proportionoftotalrevenueearnedfrominternationalrevenue
7%
37%56%
Goods
Services
IntellectualProperty
Proportionofinternationalrevenue
Source: AIBS 2017. Note: Question 21/56, n=766 (don’t know and invalid responses not calculated); Question 13, n=891 (50 don’t know and invalid responses nor calculated); Question 22, n=941.)
27
AIB
S 2017
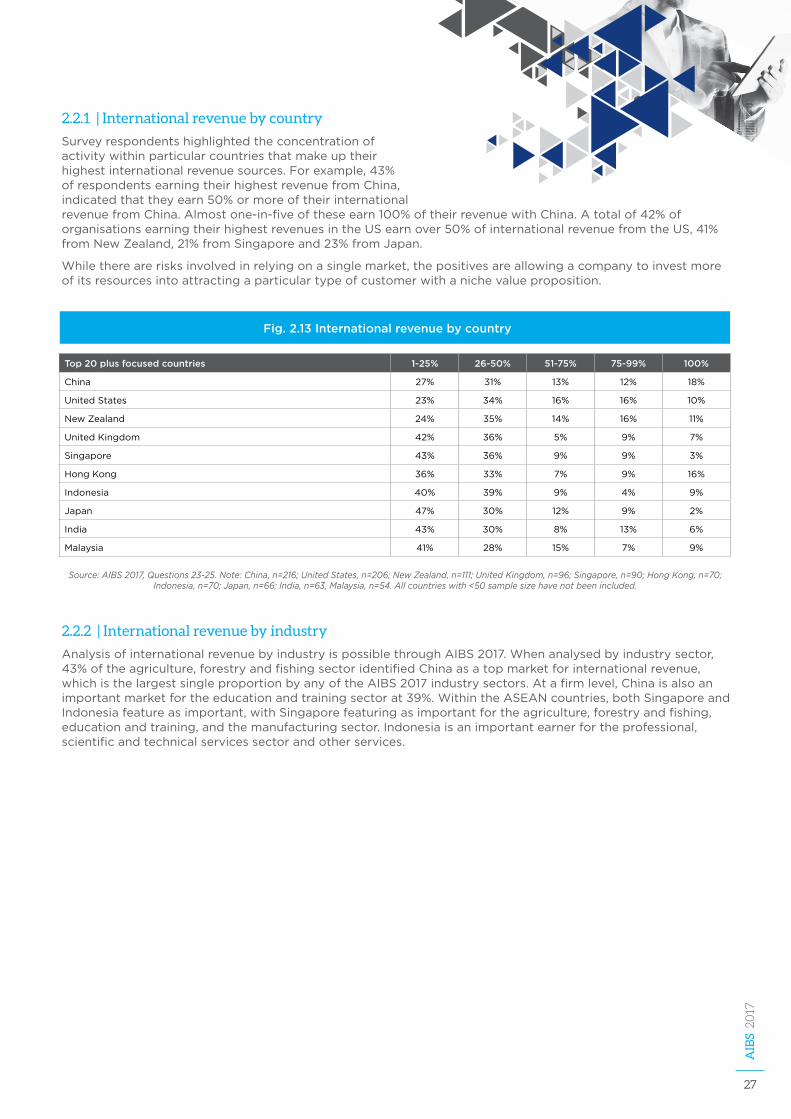
2.2.1 | International revenue by country
Surveyrespondentshighlightedtheconcentrationofactivitywithinparticularcountriesthatmakeuptheirhighestinternationalrevenuesources.Forexample,43%ofrespondentsearningtheirhighestrevenuefromChina,indicatedthattheyearn50%ormoreoftheirinternationalrevenuefromChina.Almostone-in-fiveoftheseearn100%oftheirrevenuewithChina.Atotalof42%oforganisationsearningtheirhighestrevenuesintheUSearnover50%ofinternationalrevenuefromtheUS,41%fromNewZealand,21%fromSingaporeand23%fromJapan.
Whiletherearerisksinvolvedinrelyingonasinglemarket,thepositivesareallowingacompanytoinvestmoreofitsresourcesintoattractingaparticulartypeofcustomerwithanichevalueproposition.
2.2.2 | International revenue by industry
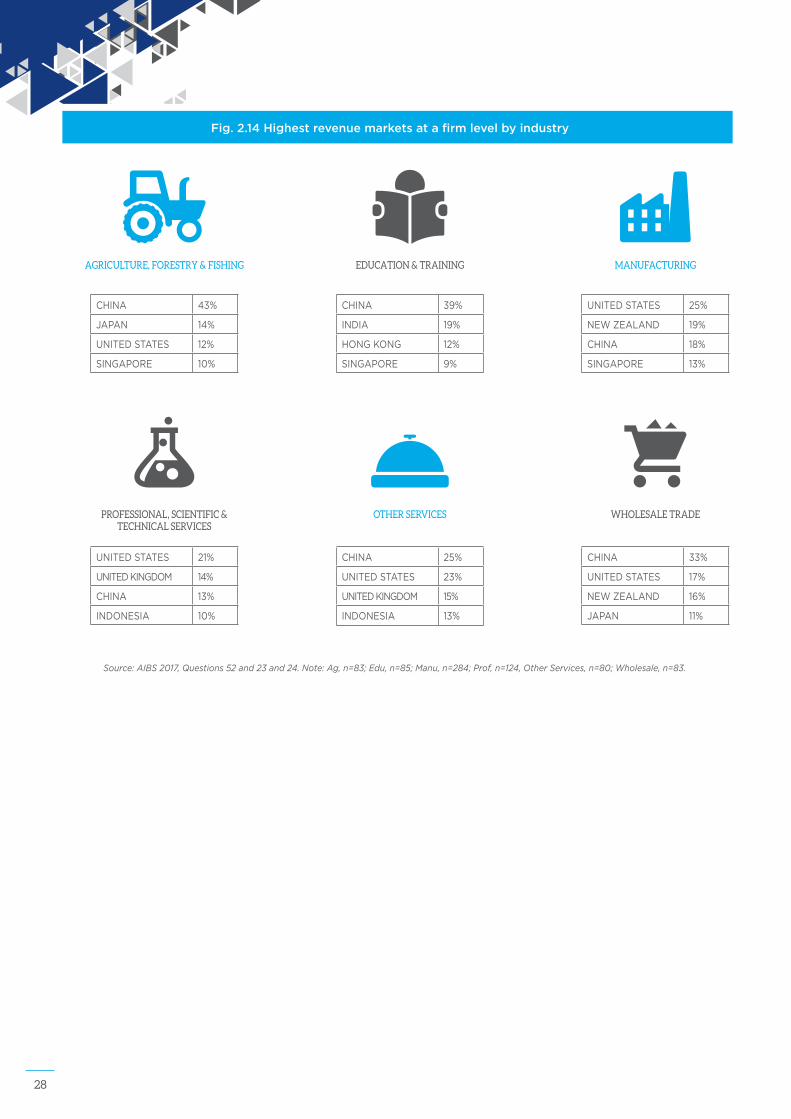
AnalysisofinternationalrevenuebyindustryispossiblethroughAIBS2017.Whenanalysedbyindustrysector,43%oftheagriculture,forestryandfishingsectoridentifiedChinaasatopmarketforinternationalrevenue,whichisthelargestsingleproportionbyanyoftheAIBS2017industrysectors.Atafirmlevel,Chinaisalsoanimportantmarketfortheeducationandtrainingsectorat39%.WithintheASEANcountries,bothSingaporeandIndonesiafeatureasimportant,withSingaporefeaturingasimportantfortheagriculture,forestryandfishing,educationandtraining,andthemanufacturingsector.Indonesiaisanimportantearnerfortheprofessional,scientificandtechnicalservicessectorandotherservices.
Fig. 2.13 International revenue by country
Top 20 plus focused countries 1-25% 26-50% 51-75% 75-99% 100%
China 27% 31% 13% 12% 18%
UnitedStates 23% 34% 16% 16% 10%
NewZealand 24% 35% 14% 16% 11%
UnitedKingdom 42% 36% 5% 9% 7%
Singapore 43% 36% 9% 9% 3%
HongKong 36% 33% 7% 9% 16%
Indonesia 40% 39% 9% 4% 9%
Japan 47% 30% 12% 9% 2%
India 43% 30% 8% 13% 6%
Malaysia 41% 28% 15% 7% 9%
Source: AIBS 2017, Questions 23-25. Note: China, n=216; United States, n=206; New Zealand, n=111; United Kingdom, n=96; Singapore, n=90; Hong Kong, n=70; Indonesia, n=70; Japan, n=66; India, n=63, Malaysia, n=54. All countries with <50 sample size have not been included.
28
Fig. 2.14 Highest revenue markets at a firm level by industry
CHINA 43%
JAPAN 14%
UNITEDSTATES 12%
SINGAPORE 10%
AGRICULTURE, FORESTRY & FISHING
CHINA 39%
INDIA 19%
HONGKONG 12%
SINGAPORE 9%
EDUCATION & TRAINING
UNITEDSTATES 25%
NEWZEALAND 19%
CHINA 18%
SINGAPORE 13%
MANUFACTURING
UNITEDSTATES 21%
UNITEDKINGDOM 14%
CHINA 13%
INDONESIA 10%
PROFESSIONAL, SCIENTIFIC & TECHNICAL SERVICES
CHINA 25%
UNITEDSTATES 23%
UNITEDKINGDOM 15%
INDONESIA 13%
OTHER SERVICES
CHINA 33%
UNITEDSTATES 17%
NEWZEALAND 16%
JAPAN 11%
WHOLESALE TRADE
Source: AIBS 2017, Questions 52 and 23 and 24. Note: Ag, n=83; Edu, n=85; Manu, n=284; Prof, n=124, Other Services, n=80; Wholesale, n=83.
29
AIB
S 2017
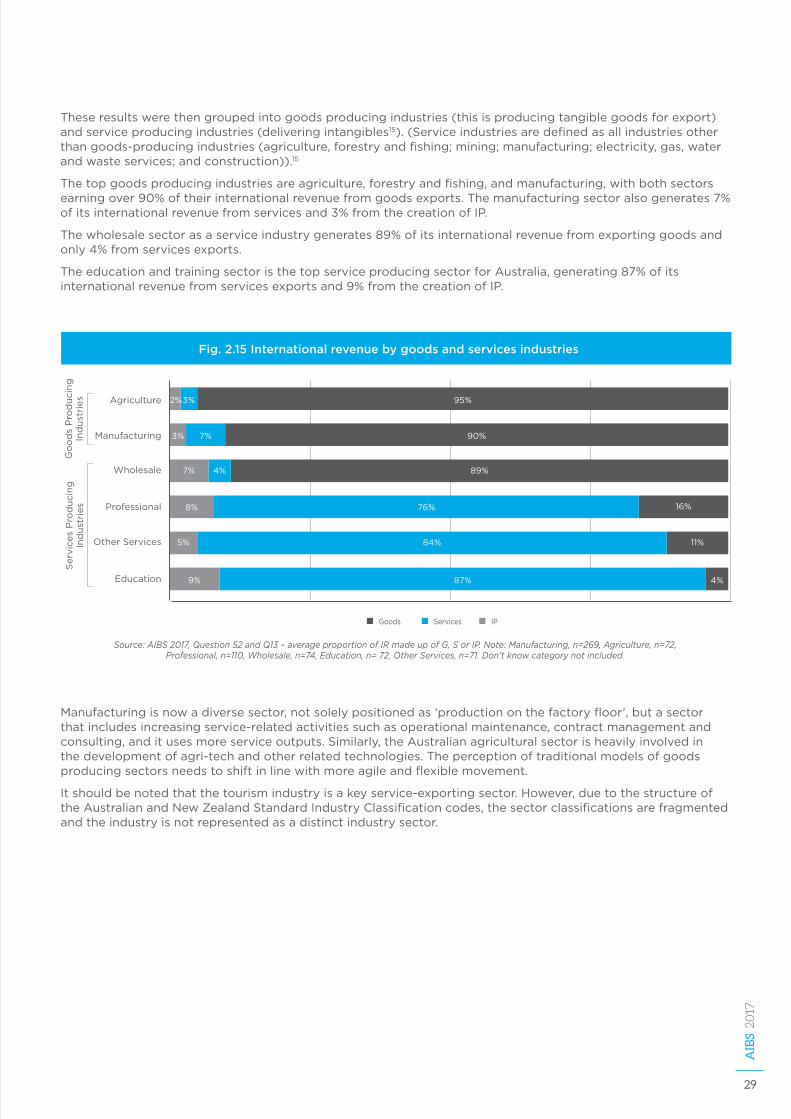
Theseresultswerethengroupedintogoodsproducingindustries(thisisproducingtangiblegoodsforexport)andserviceproducingindustries(deliveringintangibles15).(Serviceindustriesaredefinedasallindustriesotherthangoods-producingindustries(agriculture,forestryandfishing;mining;manufacturing;electricity,gas,waterandwasteservices;andconstruction)).15
Thetopgoodsproducingindustriesareagriculture,forestryandfishing,andmanufacturing,withbothsectorsearningover90%oftheirinternationalrevenuefromgoodsexports.Themanufacturingsectoralsogenerates7%ofitsinternationalrevenuefromservicesand3%fromthecreationofIP.
Thewholesalesectorasaserviceindustrygenerates89%ofitsinternationalrevenuefromexportinggoodsandonly4%fromservicesexports.
TheeducationandtrainingsectoristhetopserviceproducingsectorforAustralia,generating87%ofitsinternationalrevenuefromservicesexportsand9%fromthecreationofIP.
Manufacturingisnowadiversesector,notsolelypositionedas‘productiononthefactoryfloor’,butasectorthatincludesincreasingservice-relatedactivitiessuchasoperationalmaintenance,contractmanagementandconsulting,anditusesmoreserviceoutputs.Similarly,theAustralianagriculturalsectorisheavilyinvolvedinthedevelopmentofagri-techandotherrelatedtechnologies.Theperceptionoftraditionalmodelsofgoodsproducingsectorsneedstoshiftinlinewithmoreagileandflexiblemovement.
Itshouldbenotedthatthetourismindustryisakeyservice-exportingsector.However,duetothestructureoftheAustralianandNewZealandStandardIndustryClassificationcodes,thesectorclassificationsarefragmentedandtheindustryisnotrepresentedasadistinctindustrysector.
Fig. 2.15 International revenue by goods and services industries
95%3%2%
90%7%3%
89%4%7%
87%9%
84%5%
76%8% 16%
11%
4%
Goods Services IP
Agriculture
Manufacturing
Wholesale
Professional
OtherServices
Education
Go
od
sP
rod
ucin
g
Ind
ust
ries
Serv
ices
Pro
du
cin
g
Ind
ust
ries
Source: AIBS 2017, Question 52 and Q13 – average proportion of IR made up of G, S or IP. Note: Manufacturing, n=269, Agriculture, n=72, Professional, n=110, Wholesale, n=74, Education, n= 72, Other Services, n=71. Don’t know category not included.
30
2.2.3 | Born global companies
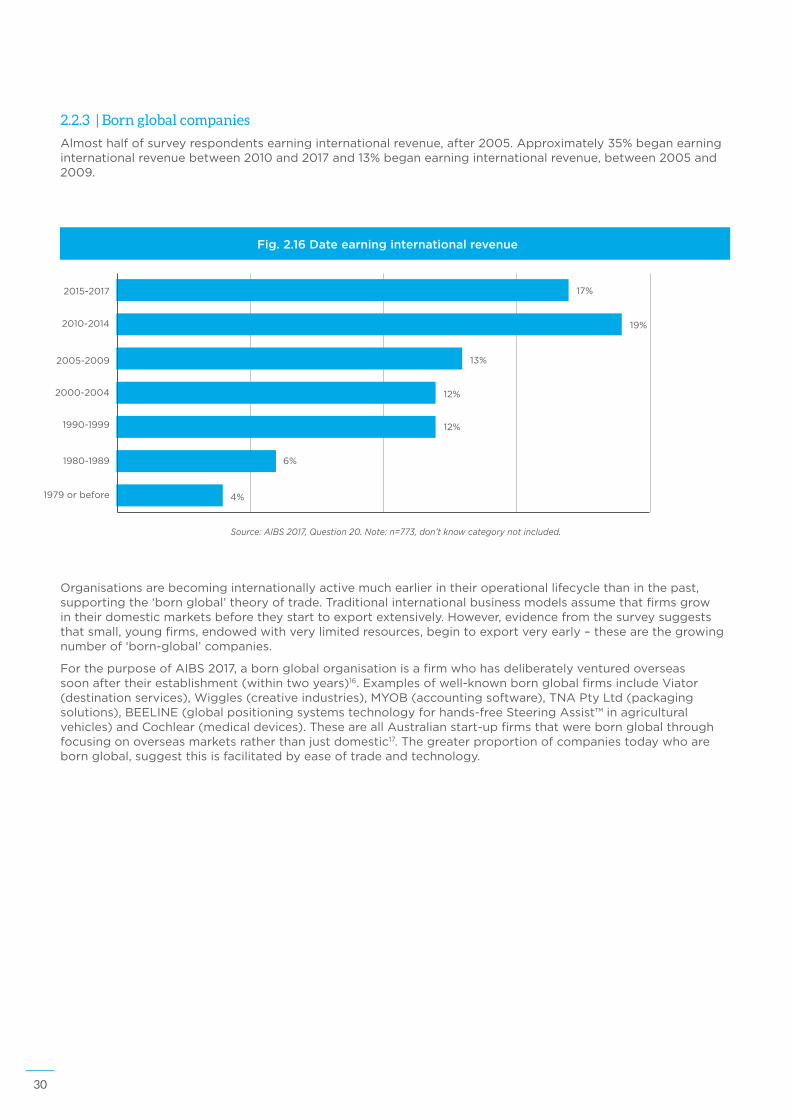
Almosthalfofsurveyrespondentsearninginternationalrevenue,after2005.Approximately35%beganearninginternationalrevenuebetween2010and2017and13%beganearninginternationalrevenue,between2005and2009.
Fig. 2.16 Date earning international revenue
2015-2017
2010-2014
2005-2009
2000-2004
1990-1999
1980-1989
1979orbefore
17%
19%
13%
12%
12%
6%
4%
Source: AIBS 2017, Question 20. Note: n=773, don’t know category not included.
Organisationsarebecominginternationallyactivemuchearlierintheiroperationallifecyclethaninthepast,supportingthe‘bornglobal’theoryoftrade.Traditionalinternationalbusinessmodelsassumethatfirmsgrowintheirdomesticmarketsbeforetheystarttoexportextensively.However,evidencefromthesurveysuggeststhatsmall,youngfirms,endowedwithverylimitedresources,begintoexportveryearly–thesearethegrowingnumberof‘born-global’companies.
ForthepurposeofAIBS2017,abornglobalorganisationisafirmwhohasdeliberatelyventuredoverseassoonaftertheirestablishment(withintwoyears)16.Examplesofwell-knownbornglobalfirmsincludeViator(destinationservices),Wiggles(creativeindustries),MYOB(accountingsoftware),TNAPtyLtd(packagingsolutions),BEELINE(globalpositioningsystemstechnologyforhands-freeSteeringAssist™inagriculturalvehicles)andCochlear(medicaldevices).TheseareallAustralianstart-upfirmsthatwerebornglobalthroughfocusingonoverseasmarketsratherthanjustdomestic17.Thegreaterproportionofcompaniestodaywhoarebornglobal,suggestthisisfacilitatedbyeaseoftradeandtechnology.
31
AIB
S 2017
Fig. 2.17 Born global organisations
16%MANUFACTURING
14%WHOLESALE TRADE
12%AGRICULTURE, FORESTRY AND FISHING
10%OTHER SERVICES
14%PROFESSIONAL,
SCIENTIFIC AND TECHNICAL SERVICES
TOP INDUSTRIES
OF THE SAMPLE ARE BORN GLOBAL COMPANIES
6% EARN ALL TOTAL REVENUE FROM INTERNATIONAL, while 58% are earning 10% OR LESS of their revenue off international revenue.
BORN GLOBAL COMPANIES STARTING OPERATION IN 2010-2017
54% are earning less than $1 million in total revenue
56%MICRO
26%SMALL
15%MEDIUM
3%LARGE
ORGANISATION SIZE
Pre1980
0%
20%
40%
60%
1980s 1990s 2000s 2010sBO
RN
GLO
BA
L B
Y D
EC
AD
E
Source: AIBS 2017, Questions 20, 21, 22, 52, 55 and 56. Note: n=941 for overall, 2010-2017 (n=145); classed as born global if they began trading internationally within two years of beginning their operation.
4%8%
15%
31%
44%
59%1 or 2
21%3 to 5
9%6 to 10
10%MORE THAN 10
NUMBER OF MARKETS
32
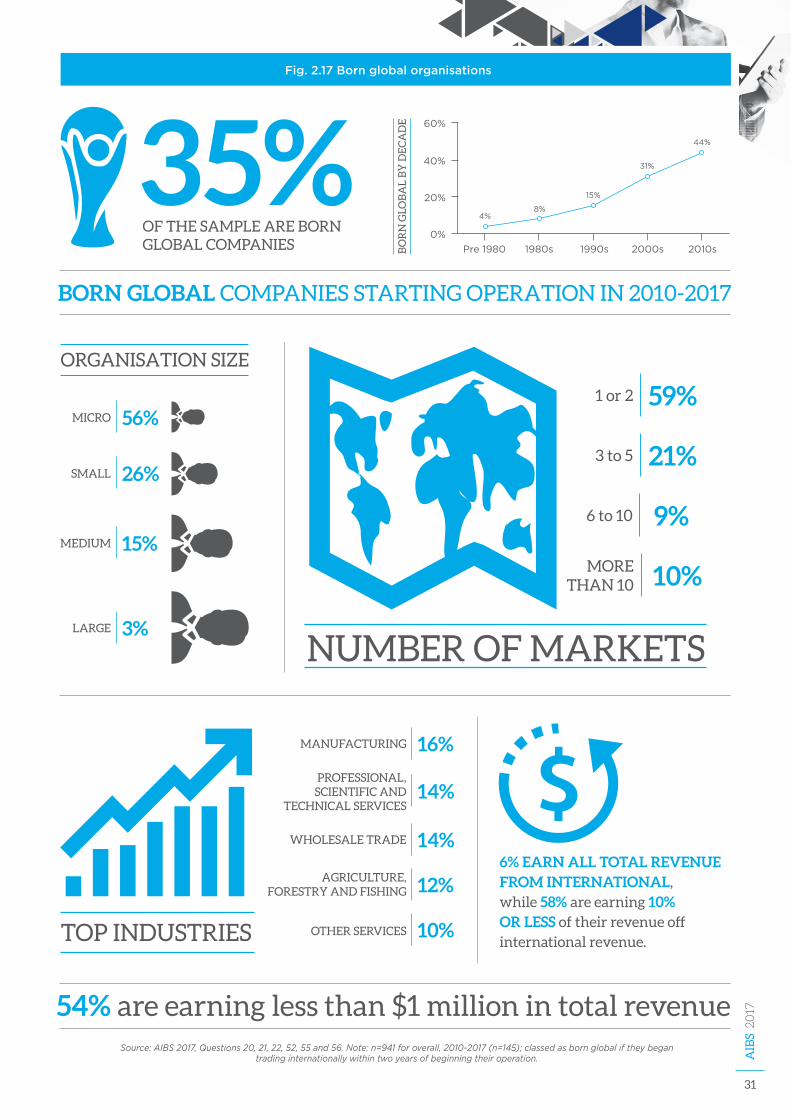
Bornglobalsurveyrespondentstotal35%ofthesample(n=941).Whenthisfigureisdistributedacrossseveraldecades,findingsindicatethatthehighestproportionofbornglobalcompaniesoperatedinthe2010s,thatistosaythattheyearntinternationalrevenuewithinthefirsttwoyearsofoperation.Bornglobalrespondentsarefoundacrossthevariousindustrysectorsbutweremore
prominentinmanufacturing,professionalservicesandwholesaletradesectors.Mostbornglobalorganisationsaremicro-sizedorganisationsemployingbetween0and4peopleandthat58%oftheseearnlessthanA$1millionintotalrevenue.
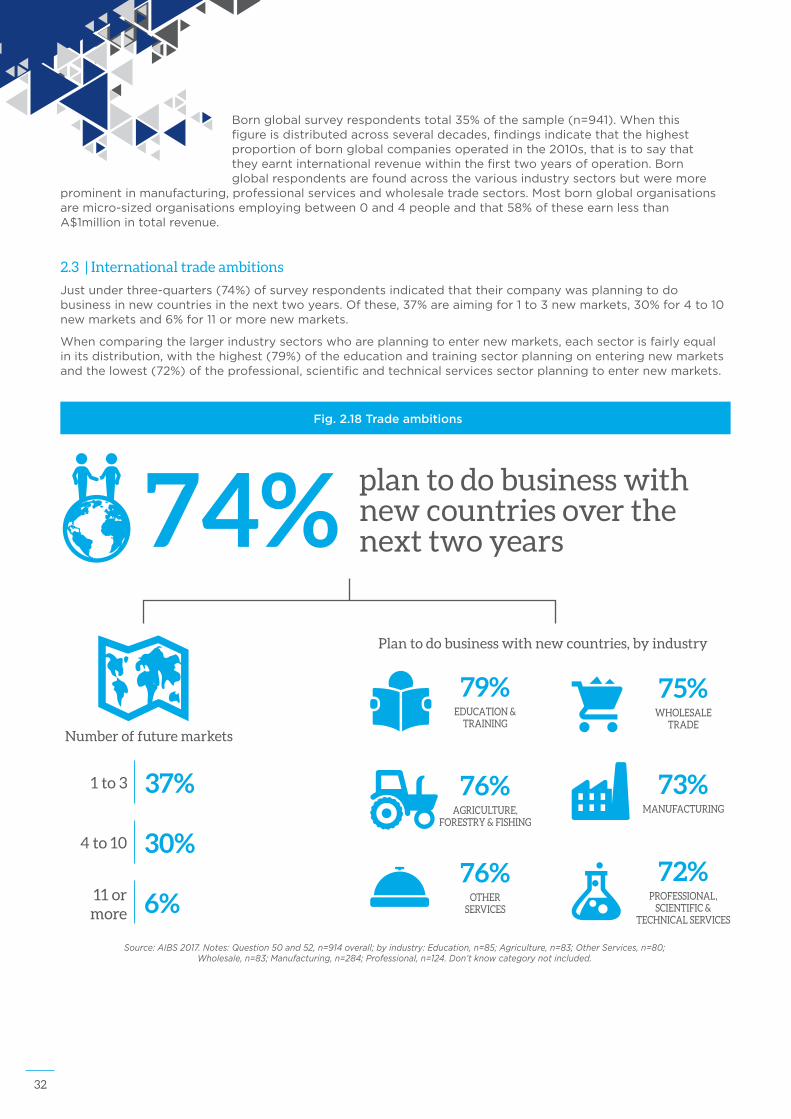
2.3 | International trade ambitions
Justunderthree-quarters(74%)ofsurveyrespondentsindicatedthattheircompanywasplanningtodobusinessinnewcountriesinthenexttwoyears.Ofthese,37%areaimingfor1to3newmarkets,30%for4to10newmarketsand6%for11ormorenewmarkets.
Whencomparingthelargerindustrysectorswhoareplanningtoenternewmarkets,eachsectorisfairlyequalinitsdistribution,withthehighest(79%)oftheeducationandtrainingsectorplanningonenteringnewmarketsandthelowest(72%)oftheprofessional,scientificandtechnicalservicessectorplanningtoenternewmarkets.
Source: AIBS 2017. Notes: Question 50 and 52, n=914 overall; by industry: Education, n=85; Agriculture, n=83; Other Services, n=80; Wholesale, n=83; Manufacturing, n=284; Professional, n=124. Don’t know category not included.
Fig. 2.18 Trade ambitions
74% plan to do business with new countries over the next two years
Plan to do business with new countries, by industry
AGRICULTURE, FORESTRY & FISHING
76%MANUFACTURING
73%
EDUCATION & TRAINING
79%WHOLESALE
TRADE
75%
OTHER SERVICES
76%PROFESSIONAL,
SCIENTIFIC & TECHNICAL SERVICES
72%
Number of future markets
37%1 to 3
30%4 to 10
6%11 or more
33
AIB
S 2017
Australia’sinternationallyactivebusinessesarenotonlyengagedinexportsandimportsofgoodsandservices,butarealsoactiveinoutwardinvestmentandreceivinginvestments.UndertakingresearchanddevelopmentoverseasisacommonactivityforAustralianbusinessesandwithsupport,theseinvestmentscanbetransformedintonichecommercialactivity,contributingtothegrowthofinternationalbusinesspartnershipsandcollaboration.However,whilstthissectionanalysesexistinginternationalbusinessactivity,futuremarketsanddoingbusinessinnewandmultiplecountriesarealsointhesightsofAustralianbusinesses,contributingtowardsthefuturegrowthofAustralia’sinternationaleconomy.
34
Australia’s international business activity in focus3
What the survey says
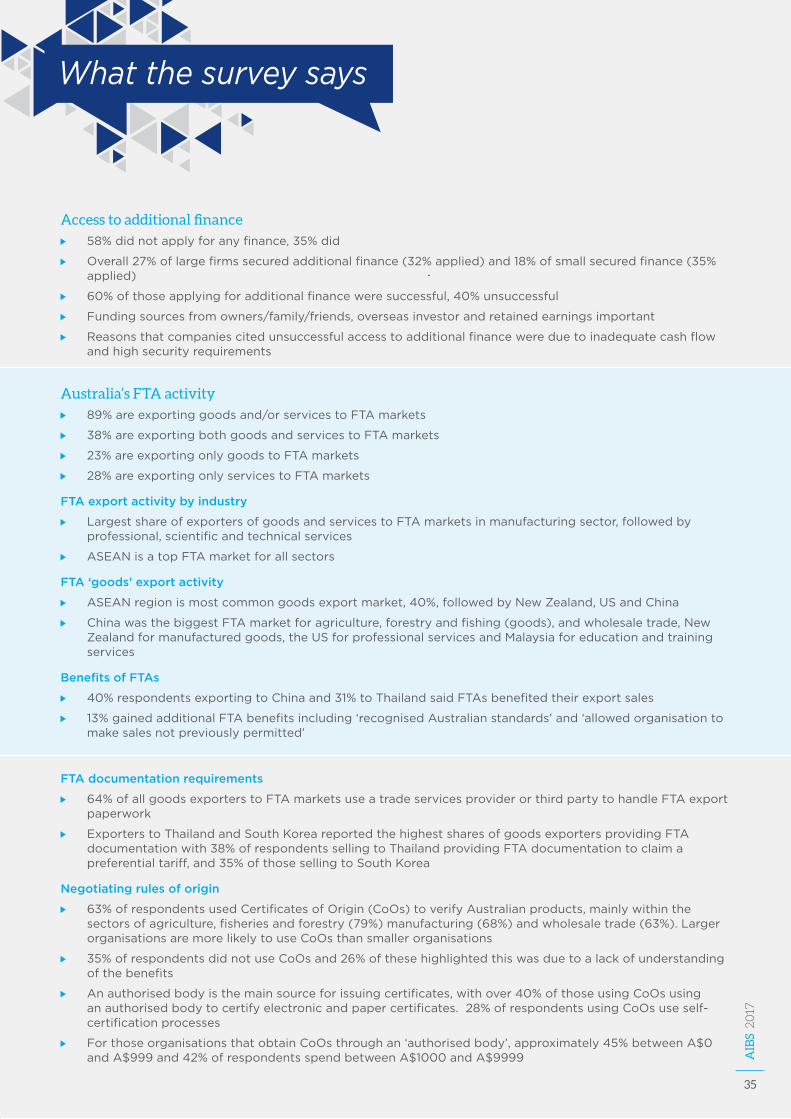
Access to additional finance
58%didnotapplyforanyfinance,35%did
Overall27%oflargefirmssecuredadditionalfinance(32%applied)and18%ofsmallsecuredfinance(35%applied)
60%ofthoseapplyingforadditionalfinanceweresuccessful,40%unsuccessful
Fundingsourcesfromowners/family/friends,overseasinvestorandretainedearningsimportant
Reasonsthatcompaniescitedunsuccessfulaccesstoadditionalfinancewereduetoinadequatecashflowandhighsecurityrequirements
Australia’s FTA activity
89%areexportinggoodsand/orservicestoFTAmarkets
38%areexportingbothgoodsandservicestoFTAmarkets
23%areexportingonlygoodstoFTAmarkets
28%areexportingonlyservicestoFTAmarkets
FTA export activity by industry
LargestshareofexportersofgoodsandservicestoFTAmarketsinmanufacturingsector,followedbyprofessional,scientificandtechnicalservices
ASEANisatopFTAmarketforallsectors
FTA ‘goods’ export activity
ASEANregionismostcommongoodsexportmarket,40%,followedbyNewZealand,USandChina
ChinawasthebiggestFTAmarketforagriculture,forestryandfishing(goods),andwholesaletrade,NewZealandformanufacturedgoods,theUSforprofessionalservicesandMalaysiaforeducationandtrainingservices
Benefits of FTAs
40%respondentsexportingtoChinaand31%toThailandsaidFTAsbenefitedtheirexportsales
13%gainedadditionalFTAbenefitsincluding‘recognisedAustralianstandards’and‘allowedorganisationtomakesalesnotpreviouslypermitted’
FTA documentation requirements
64%ofallgoodsexporterstoFTAmarketsuseatradeservicesproviderorthirdpartytohandleFTAexportpaperwork
ExporterstoThailandandSouthKoreareportedthehighestsharesofgoodsexportersprovidingFTAdocumentationwith38%ofrespondentssellingtoThailandprovidingFTAdocumentationtoclaimapreferentialtariff,and35%ofthosesellingtoSouthKorea
Negotiating rules of origin
63%ofrespondentsusedCertificatesofOrigin(CoOs)toverifyAustralianproducts,mainlywithinthesectorsofagriculture,fisheriesandforestry(79%)manufacturing(68%)andwholesaletrade(63%).LargerorganisationsaremorelikelytouseCoOsthansmallerorganisations
35%ofrespondentsdidnotuseCoOsand26%ofthesehighlightedthiswasduetoalackofunderstandingofthebenefits
Anauthorisedbodyisthemainsourceforissuingcertificates,withover40%ofthoseusingCoOsusinganauthorisedbodytocertifyelectronicandpapercertificates.28%ofrespondentsusingCoOsuseself-certificationprocesses
ForthoseorganisationsthatobtainCoOsthroughan‘authorisedbody’,approximately45%betweenA$0andA$999and42%ofrespondentsspendbetweenA$1000andA$9999
35
AIB
S 2017
36
FTA ‘Services’ activity
MostpopularFTAserviceexportmarketsaretheASEANregion,China,US,SingaporeandNewZealand
Mode1,servicingoverseasmarketsviacallcentresetc.andMode4bytravellingoverseasaremostsignificant
9%ofthosethattraveloverseasfacedrestrictions
Barriers to commencing international trade
Ofthosecompaniesthatdonotengageininternationalactivity,26%reportthisisduetoalackofinternationalleadsand22%areuncertainhowtobegin
46%suggestedadatabaseofpotentialbuyers/supplierswouldhelpstart,41%suggestedgrants,34%mentoring
Key trade factors influencing international revenue
Significantfactorscorrelatingtohigherexportintensityinclude:moreyearsengagedininternationaltrade,smallerorganisations,inlargermarkets,andtheusingofFTAs.
37
AIB
S 2017
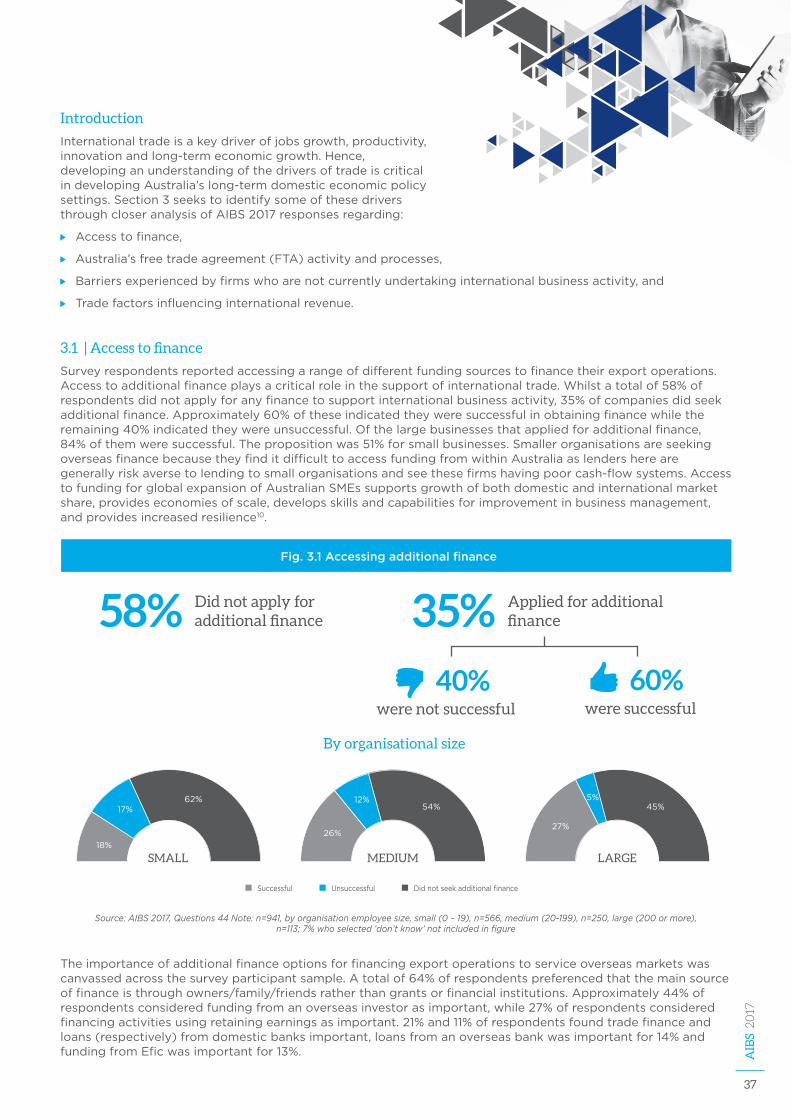
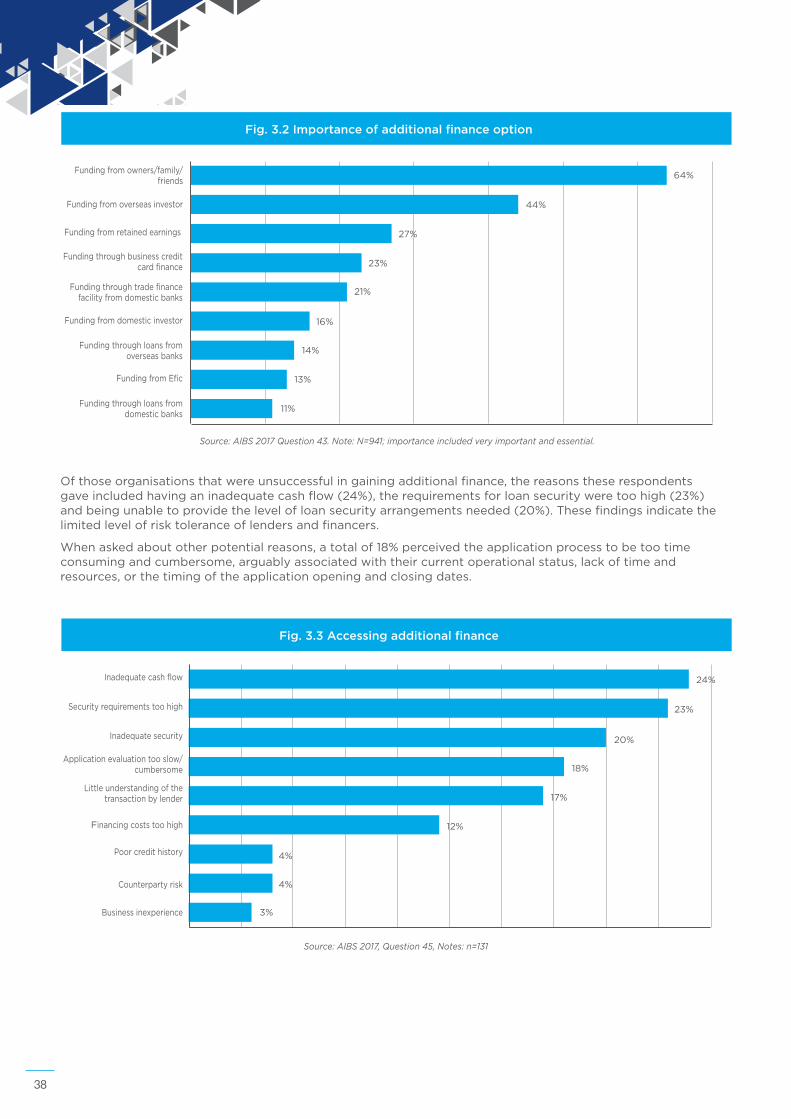
Theimportanceofadditionalfinanceoptionsforfinancingexportoperationstoserviceoverseasmarketswascanvassedacrossthesurveyparticipantsample.Atotalof64%ofrespondentspreferencedthatthemainsourceoffinanceisthroughowners/family/friendsratherthangrantsorfinancialinstitutions.Approximately44%ofrespondentsconsideredfundingfromanoverseasinvestorasimportant,while27%ofrespondentsconsideredfinancingactivitiesusingretainingearningsasimportant.21%and11%ofrespondentsfoundtradefinanceandloans(respectively)fromdomesticbanksimportant,loansfromanoverseasbankwasimportantfor14%andfundingfromEficwasimportantfor13%.
Introduction
Internationaltradeisakeydriverofjobsgrowth,productivity,innovationandlong-termeconomicgrowth.Hence,developinganunderstandingofthedriversoftradeiscriticalindevelopingAustralia’slong-termdomesticeconomicpolicysettings.Section3seekstoidentifysomeofthesedriversthroughcloseranalysisofAIBS2017responsesregarding:
Accesstofinance,
Australia’sfreetradeagreement(FTA)activityandprocesses,
Barriersexperiencedbyfirmswhoarenotcurrentlyundertakinginternationalbusinessactivity,and
Tradefactorsinfluencinginternationalrevenue.
3.1 | Access to finance
Surveyrespondentsreportedaccessingarangeofdifferentfundingsourcestofinancetheirexportoperations.Accesstoadditionalfinanceplaysacriticalroleinthesupportofinternationaltrade.Whilstatotalof58%ofrespondentsdidnotapplyforanyfinancetosupportinternationalbusinessactivity,35%ofcompaniesdidseekadditionalfinance.Approximately60%oftheseindicatedtheyweresuccessfulinobtainingfinancewhiletheremaining40%indicatedtheywereunsuccessful.Ofthelargebusinessesthatappliedforadditionalfinance,84%ofthemweresuccessful.Thepropositionwas51%forsmallbusinesses.SmallerorganisationsareseekingoverseasfinancebecausetheyfinditdifficulttoaccessfundingfromwithinAustraliaaslendersherearegenerallyriskaversetolendingtosmallorganisationsandseethesefirmshavingpoorcash-flowsystems.AccesstofundingforglobalexpansionofAustralianSMEssupportsgrowthofbothdomesticandinternationalmarketshare,provideseconomiesofscale,developsskillsandcapabilitiesforimprovementinbusinessmanagement,andprovidesincreasedresilience10.
Source: AIBS 2017, Questions 44 Note: n=941, by organisation employee size, small (0 – 19), n=566, medium (20-199), n=250, large (200 or more), n=113; 7% who selected ‘don’t know’ not included in figure
Fig. 3.1 Accessing additional finance
58% Did not apply for additional finance 35% Applied for additional
finance
were not successful
40%were successful
60%
Successful Unsuccessful Didnotseekadditionalfinance
18%
17%62%
26%
12%54%
27%
5%45%
SMALL MEDIUM LARGE
By organisational size
38
Ofthoseorganisationsthatwereunsuccessfulingainingadditionalfinance,thereasonstheserespondentsgaveincludedhavinganinadequatecashflow(24%),therequirementsforloansecurityweretoohigh(23%)andbeingunabletoprovidethelevelofloansecurityarrangementsneeded(20%).Thesefindingsindicatethelimitedlevelofrisktoleranceoflendersandfinancers.
Whenaskedaboutotherpotentialreasons,atotalof18%perceivedtheapplicationprocesstobetootimeconsumingandcumbersome,arguablyassociatedwiththeircurrentoperationalstatus,lackoftimeandresources,orthetimingoftheapplicationopeningandclosingdates.
Fig. 3.2 Importance of additional finance option
Fundingfromowners/family/friends
Fundingfromoverseasinvestor
Fundingfromretainedearnings
Fundingthroughbusinesscreditcardfinance
Fundingfromdomesticinvestor
Fundingthroughloansfromoverseasbanks
FundingfromEfic
Fundingthroughloansfromdomesticbanks
Fundingthroughtradefinancefacilityfromdomesticbanks
64%
44%
27%
23%
16%
14%
13%
11%
21%
Source: AIBS 2017 Question 43. Note: N=941; importance included very important and essential.
Fig. 3.3 Accessing additional finance
Inadequatecashflow
Inadequatesecurity
Securityrequirementstoohigh
Applicationevaluationtooslow/cumbersome
Littleunderstandingofthetransactionbylender
Financingcoststoohigh
Poorcredithistory
Counterpartyrisk
Businessinexperience
24%
20%
23%
18%
17%
12%
4%
4%
3%
Source: AIBS 2017, Question 45, Notes: n=131
39
AIB
S 2017
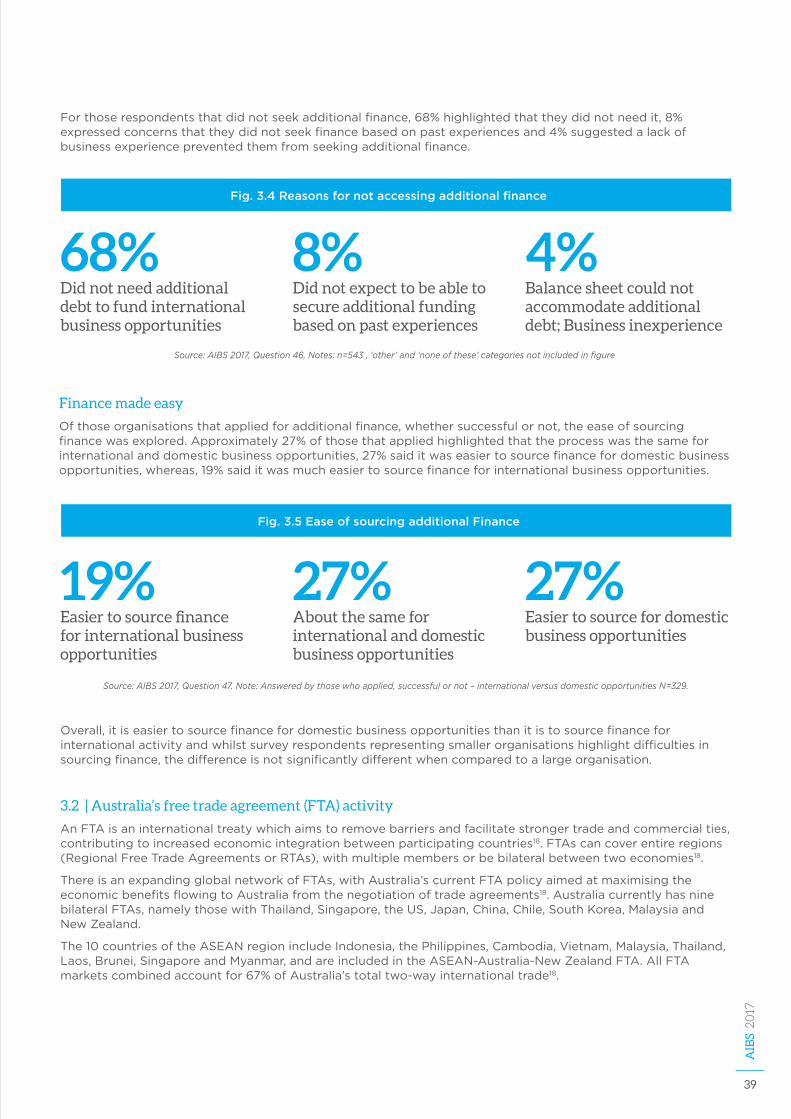
Forthoserespondentsthatdidnotseekadditionalfinance,68%highlightedthattheydidnotneedit,8%expressedconcernsthattheydidnotseekfinancebasedonpastexperiencesand4%suggestedalackofbusinessexperiencepreventedthemfromseekingadditionalfinance.
Finance made easy
Ofthoseorganisationsthatappliedforadditionalfinance,whethersuccessfulornot,theeaseofsourcingfinancewasexplored.Approximately27%ofthosethatappliedhighlightedthattheprocesswasthesameforinternationalanddomesticbusinessopportunities,27%saiditwaseasiertosourcefinancefordomesticbusinessopportunities,whereas,19%saiditwasmucheasiertosourcefinanceforinternationalbusinessopportunities.
Fig. 3.4 Reasons for not accessing additional finance
68% Did not need additional debt to fund international business opportunities
8% Did not expect to be able to secure additional funding based on past experiences
4% Balance sheet could not accommodate additional debt; Business inexperience
Source: AIBS 2017, Question 46, Notes: n=543 , ‘other’ and ‘none of these’ categories not included in figure
Overall,itiseasiertosourcefinancefordomesticbusinessopportunitiesthanitistosourcefinanceforinternationalactivityandwhilstsurveyrespondentsrepresentingsmallerorganisationshighlightdifficultiesinsourcingfinance,thedifferenceisnotsignificantlydifferentwhencomparedtoalargeorganisation.
3.2 | Australia’s free trade agreement (FTA) activity
AnFTAisaninternationaltreatywhichaimstoremovebarriersandfacilitatestrongertradeandcommercialties,contributingtoincreasedeconomicintegrationbetweenparticipatingcountries18.FTAscancoverentireregions(RegionalFreeTradeAgreementsorRTAs),withmultiplemembersorbebilateralbetweentwoeconomies18.
ThereisanexpandingglobalnetworkofFTAs,withAustralia’scurrentFTApolicyaimedatmaximisingtheeconomicbenefitsflowingtoAustraliafromthenegotiationoftradeagreements18.AustraliacurrentlyhasninebilateralFTAs,namelythosewithThailand,Singapore,theUS,Japan,China,Chile,SouthKorea,MalaysiaandNewZealand.
The10countriesoftheASEANregionincludeIndonesia,thePhilippines,Cambodia,Vietnam,Malaysia,Thailand,Laos,Brunei,SingaporeandMyanmar,andareincludedintheASEAN-Australia-NewZealandFTA.AllFTAmarketscombinedaccountfor67%ofAustralia’stotaltwo-wayinternationaltrade18.
19% Easier to source finance for international business opportunities
27% About the same for international and domestic business opportunities
27% Easier to source for domestic business opportunities
Fig. 3.5 Ease of sourcing additional Finance
Source: AIBS 2017, Question 47. Note: Answered by those who applied, successful or not – international versus domestic opportunities N=329.
40
AustraliaisengagedinseveralFTA,RTAandmultilateralnegotiations,whichinclude:
Australia-EuropeanUnionFreeTradeAgreement,
Australia-GulfCooperationCouncil(GCC)FTA,
Australia-HongKongFreeTradeAgreement,
Australia-IndiaComprehensiveEconomicCooperationAgreement,
ComprehensiveandProgressiveAgreementsonTrans-PacificPartnership
EnvironmentalGoodsNegotiations,
Indonesia-AustraliaComprehensiveEconomicPartnershipAgreement,
PacificAllianceFreeTradeAgreement,
RegionalComprehensiveEconomicPartnership,and
TradeinServicesAgreement,
TherearemanybenefitsoftheFTAarrangementsforAustralia17.AnFTAcan:
Fosterfreertradeflowsandcreatestrongertieswithglobaltradingpartners,
Eliminatetariffsandaddressbehind-the-borderbarriersthatimpedetheflowofgoodsandservicesbetweenparties,
Encourageinvestment,enhancecooperation,addressintellectualproperty,e-commerceandgovernmentprocurementissues,
IncreaseAustralia’sproductivityandcontributetohigherGDPgrowthbyallowingdomesticbusinessesaccesstocheaperinputs,
Introducenewtechnologiesandfostercompetitionandinnovation,
Promoteregionaleconomicintegrationandbuildsharedapproachestotradeandinvestment,includingadoptingcommonRulesofOrigin(RoO)andbroaderacceptanceofproductstandards,
EnhancethecompetitivenessofAustralianexportsintheinternationalpartnermarketandaddtotheattractivenessofAustraliaasaninvestmentdestination,and
Deliverenhancedtradingopportunitiesthatcontributetothesustainableeconomicgrowthofless-developedeconomies.
However,despiteongoingfacilitationandimplementationofdirectandregionalFTApolicy,barriersforinternationalbusinessesinexpandinginternationalbusinessactivitiescontinuetoexist,forexporters18.Suchcomplexitiesinclude:
Culturalandsocialbarriers,and
Politicalandregulatorybarrierssuchastariffsandstandards.
ShiftingeconomiccircumstancesalsoinfluenceAustralia’srelativeinternationalcompetitivenessandaffectstheabilitytoattractforeigndirectinvestment(FDI)intoAustralia–therebyshapingthegeneraloperatingenvironmentforAustralianbusinessesandinstitutionsconductinginternationalbusinessactivities.Theseissueswillbeexploredlaterinthisreport.
3.2.1 | Overall goods and services to FTA markets
AustraliahasactivelypursuedFTAsforgoodsandservicesexportsandthesehaveresultedinfavourablemarketaccessforAustralianbusinessesinvolvedintradingintermediateand/orfinalgoodsandservices.WhiletheFTAshavefocussedprimarilyonagriculturalandmerchandisegoods,thedatabaseoftheGeneralAgreementonTradeinServices(GATS)identifiesAustralia’sagreementswithChile,Japan,SingaporeandUnitedStatesasincludingsignificantcommitmentsfortheservicessector.
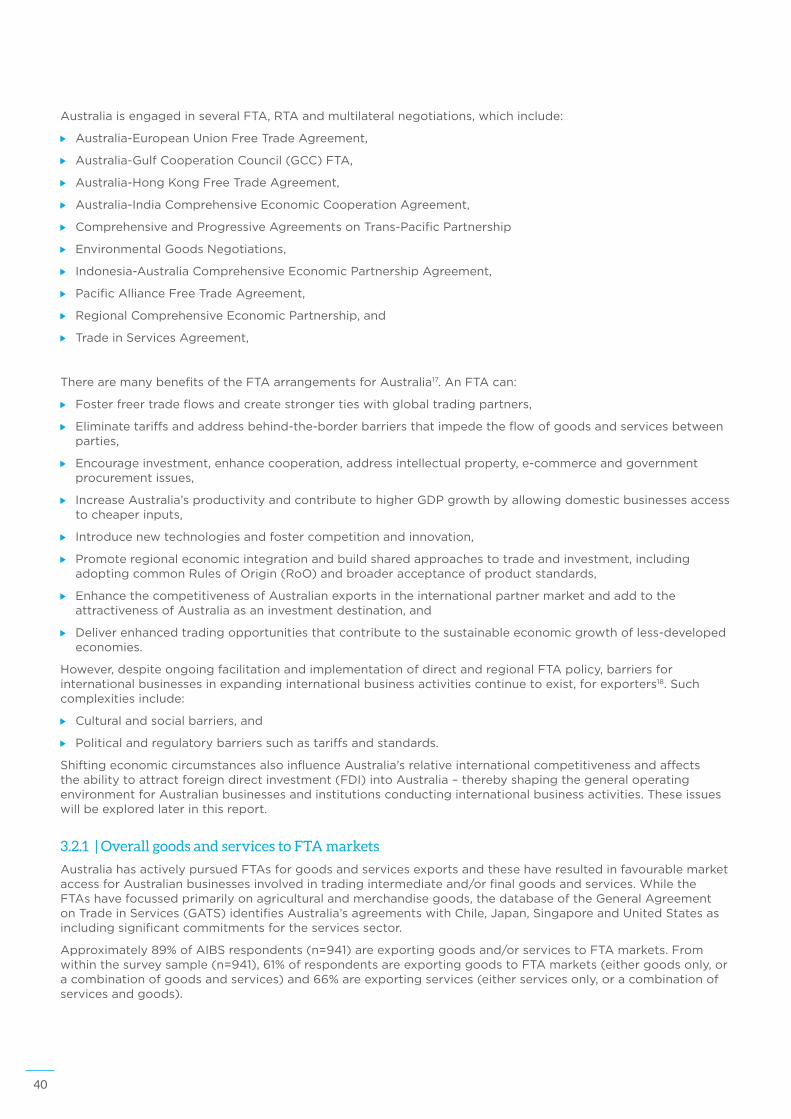
Approximately89%ofAIBSrespondents(n=941)areexportinggoodsand/orservicestoFTAmarkets.Fromwithinthesurveysample(n=941),61%ofrespondentsareexportinggoodstoFTAmarkets(eithergoodsonly,oracombinationofgoodsandservices)and66%areexportingservices(eitherservicesonly,oracombinationofservicesandgoods).
41
AIB
S 2017
Fig. 3.6 Respondents undertaking export to FTA markets (% share)
38%
28%
23%
11%
SellingbothgoodsandservicestoFTAmarkets
SellingservicesonlytoFTAmarkets
NotsellingtoFTAmarkets
SellinggoodsonlytoFTAmarkets
Source: AIBS 2017, Question Export activities to FTA markets – Q26 and Q36, Note: n=941.
Byexaminingthetrade-relatedfactors(insection3.4)thatinfluenceinternationalrevenue,surveyrespondentshighlightthatthegreaterproportionofcountriesthathaveanFTAwithAustralia,andthatAustralianorganisationstradewith,impactedpositivelyonearningsfrominternationaltrade.
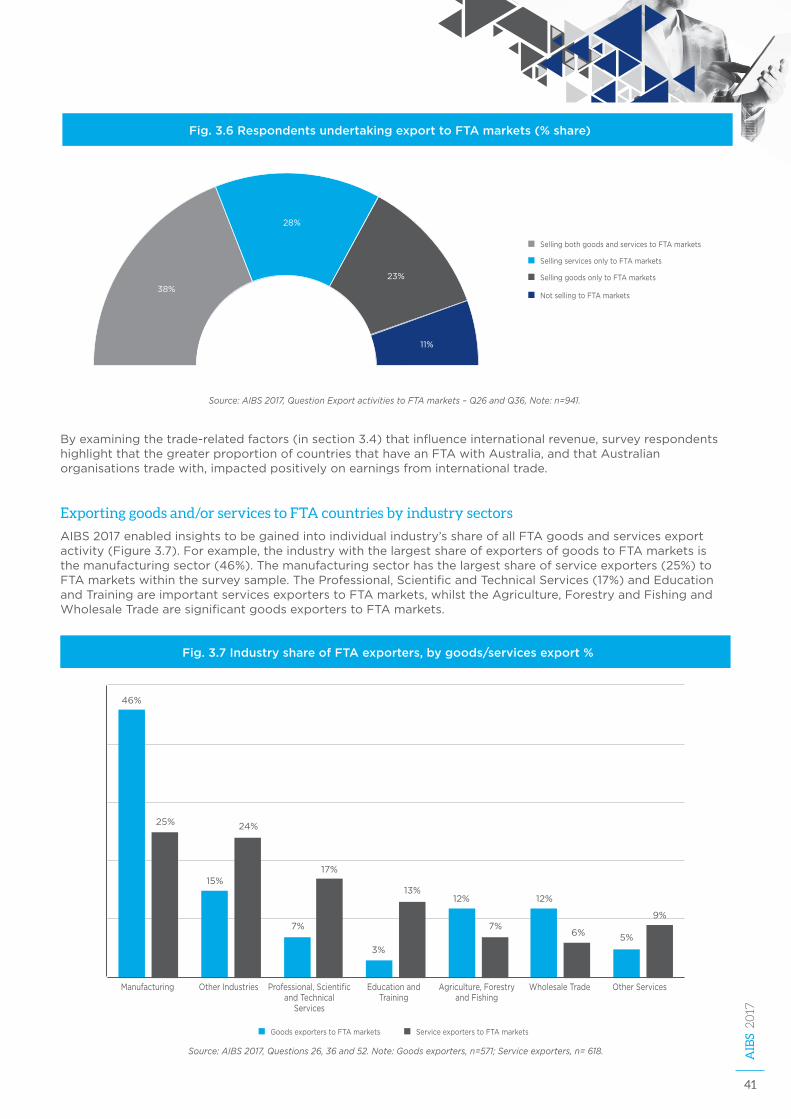
Exporting goods and/or services to FTA countries by industry sectors
AIBS2017enabledinsightstobegainedintoindividualindustry’sshareofallFTAgoodsandservicesexportactivity(Figure3.7).Forexample,theindustrywiththelargestshareofexportersofgoodstoFTAmarketsisthemanufacturingsector(46%).Themanufacturingsectorhasthelargestshareofserviceexporters(25%)toFTAmarketswithinthesurveysample.TheProfessional,ScientificandTechnicalServices(17%)andEducationandTrainingareimportantservicesexporterstoFTAmarkets,whilsttheAgriculture,ForestryandFishingandWholesaleTradearesignificantgoodsexporterstoFTAmarkets.
Fig. 3.7 Industry share of FTA exporters, by goods/services export %
Manufacturing OtherIndustries Professional,ScientificandTechnical
Services
EducationandTraining
Agriculture,ForestryandFishing
WholesaleTrade OtherServices
46%
15%
7%
3%
12% 12%
5%
25% 24%
17%
13%
7%6%
9%
GoodsexporterstoFTAmarkets ServiceexporterstoFTAmarkets
Source: AIBS 2017, Questions 26, 36 and 52. Note: Goods exporters, n=571; Service exporters, n= 618.
42
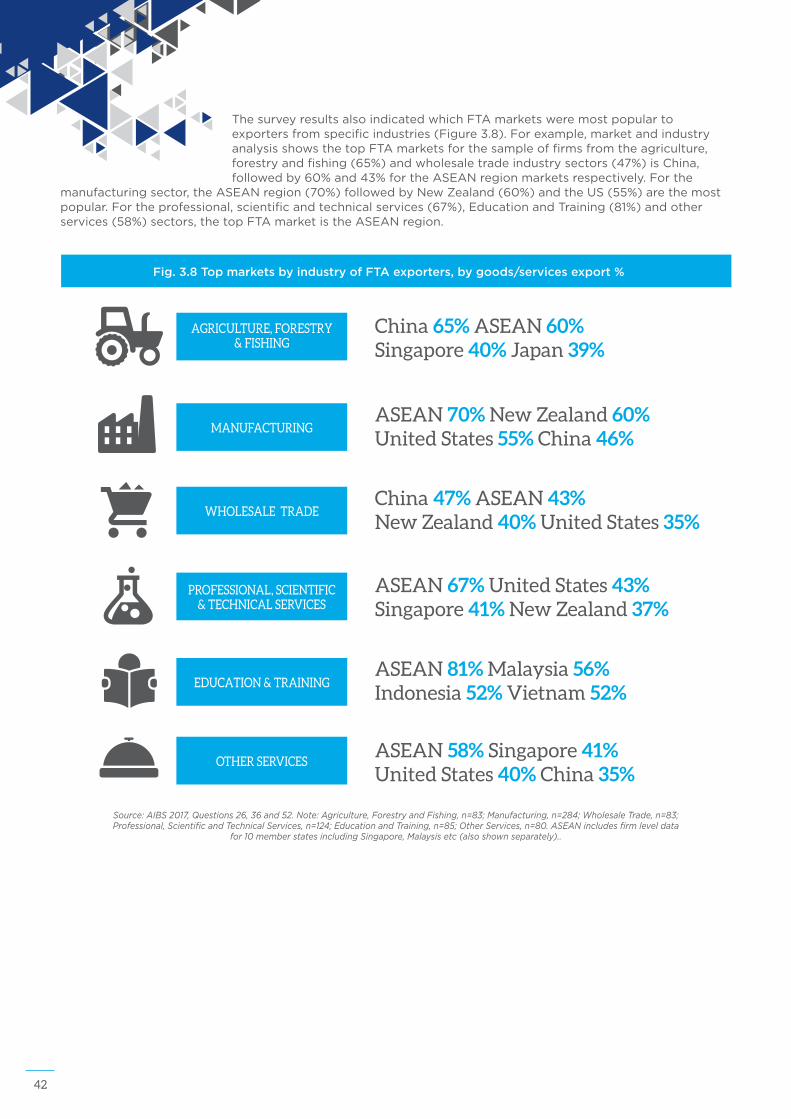
ThesurveyresultsalsoindicatedwhichFTAmarketsweremostpopulartoexportersfromspecificindustries(Figure3.8).Forexample,marketandindustryanalysisshowsthetopFTAmarketsforthesampleoffirmsfromtheagriculture,forestryandfishing(65%)andwholesaletradeindustrysectors(47%)isChina,followedby60%and43%fortheASEANregionmarketsrespectively.Forthe
manufacturingsector,theASEANregion(70%)followedbyNewZealand(60%)andtheUS(55%)arethemostpopular.Fortheprofessional,scientificandtechnicalservices(67%),EducationandTraining(81%)andotherservices(58%)sectors,thetopFTAmarketistheASEANregion.
Fig. 3.8 Top markets by industry of FTA exporters, by goods/services export %
AGRICULTURE, FORESTRY & FISHING
China 65% ASEAN 60% Singapore 40% Japan 39%
ASEAN 70% New Zealand 60% United States 55% China 46%
MANUFACTURING
ASEAN 81% Malaysia 56% Indonesia 52% Vietnam 52%
EDUCATION & TRAINING
China 47% ASEAN 43% New Zealand 40% United States 35%
WHOLESALE TRADE
ASEAN 58% Singapore 41% United States 40% China 35%
OTHER SERVICES
ASEAN 67% United States 43% Singapore 41% New Zealand 37%
PROFESSIONAL, SCIENTIFIC & TECHNICAL SERVICES
Source: AIBS 2017, Questions 26, 36 and 52. Note: Agriculture, Forestry and Fishing, n=83; Manufacturing, n=284; Wholesale Trade, n=83; Professional, Scientific and Technical Services, n=124; Education and Training, n=85; Other Services, n=80. ASEAN includes firm level data
for 10 member states including Singapore, Malaysis etc (also shown separately)..
43
AIB
S 2017
3.2.2 | Goods exports to FTA markets
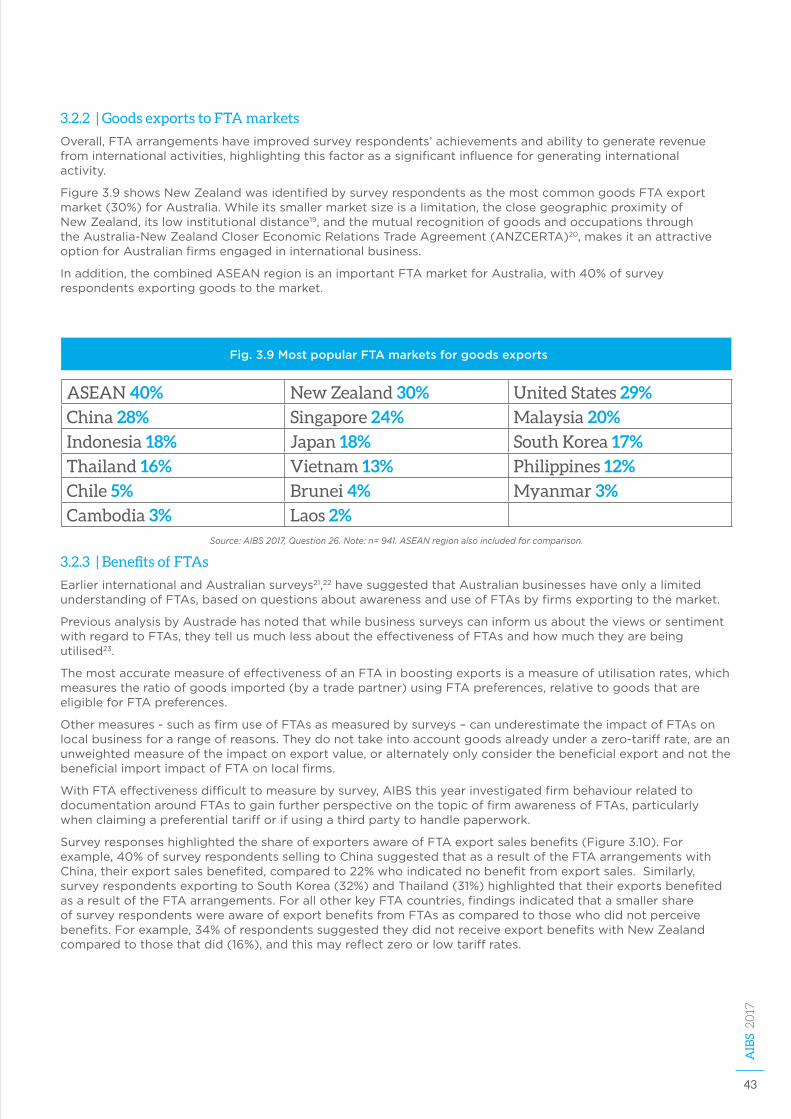
Overall,FTAarrangementshaveimprovedsurveyrespondents’achievementsandabilitytogeneraterevenuefrominternationalactivities,highlightingthisfactorasasignificantinfluenceforgeneratinginternationalactivity.
Figure3.9showsNewZealandwasidentifiedbysurveyrespondentsasthemostcommongoodsFTAexportmarket(30%)forAustralia.Whileitssmallermarketsizeisalimitation,theclosegeographicproximityofNewZealand,itslowinstitutionaldistance19,andthemutualrecognitionofgoodsandoccupationsthroughtheAustralia-NewZealandCloserEconomicRelationsTradeAgreement(ANZCERTA)20,makesitanattractiveoptionforAustralianfirmsengagedininternationalbusiness.
Inaddition,thecombinedASEANregionisanimportantFTAmarketforAustralia,with40%ofsurveyrespondentsexportinggoodstothemarket.
3.2.3 | Benefits of FTAs
EarlierinternationalandAustraliansurveys21,22havesuggestedthatAustralianbusinesseshaveonlyalimitedunderstandingofFTAs,basedonquestionsaboutawarenessanduseofFTAsbyfirmsexportingtothemarket.
PreviousanalysisbyAustradehasnotedthatwhilebusinesssurveyscaninformusabouttheviewsorsentimentwithregardtoFTAs,theytellusmuchlessabouttheeffectivenessofFTAsandhowmuchtheyarebeingutilised23.
ThemostaccuratemeasureofeffectivenessofanFTAinboostingexportsisameasureofutilisationrates,whichmeasurestheratioofgoodsimported(byatradepartner)usingFTApreferences,relativetogoodsthatareeligibleforFTApreferences.
Othermeasures-suchasfirmuseofFTAsasmeasuredbysurveys–canunderestimatetheimpactofFTAsonlocalbusinessforarangeofreasons.Theydonottakeintoaccountgoodsalreadyunderazero-tariffrate,areanunweightedmeasureoftheimpactonexportvalue,oralternatelyonlyconsiderthebeneficialexportandnotthebeneficialimportimpactofFTAonlocalfirms.
WithFTAeffectivenessdifficulttomeasurebysurvey,AIBSthisyearinvestigatedfirmbehaviourrelatedtodocumentationaroundFTAstogainfurtherperspectiveonthetopicoffirmawarenessofFTAs,particularlywhenclaimingapreferentialtarifforifusingathirdpartytohandlepaperwork.
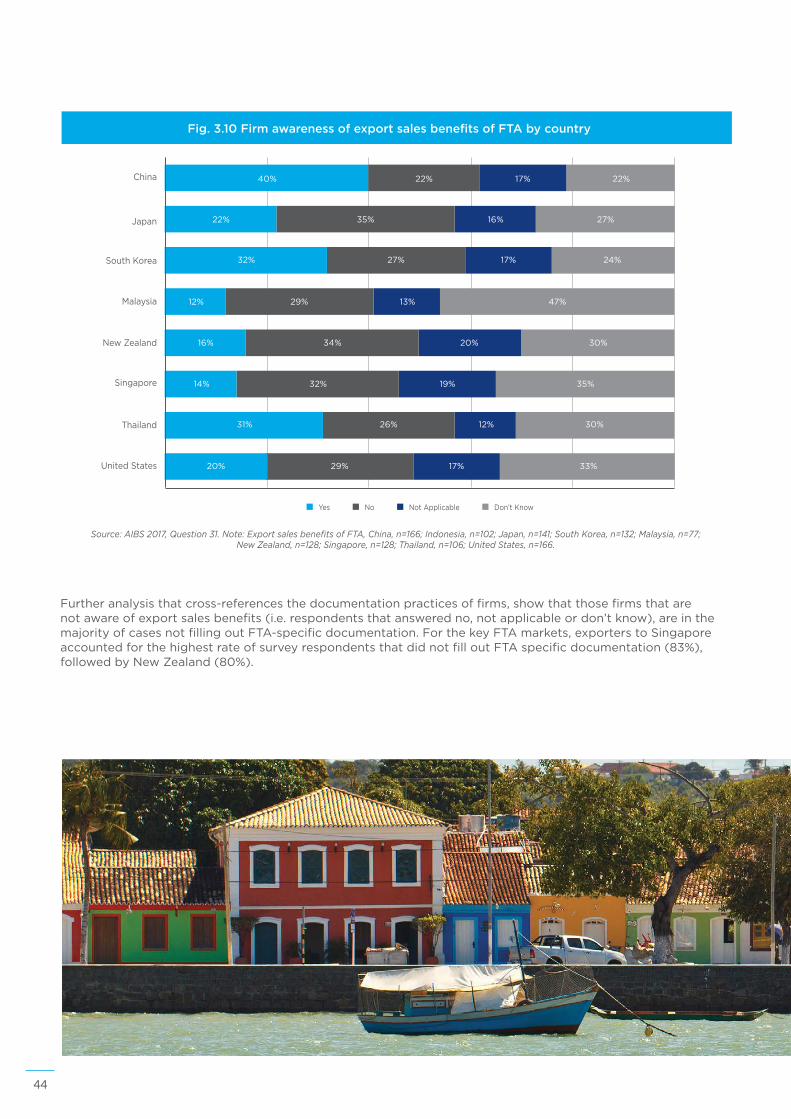
SurveyresponseshighlightedtheshareofexportersawareofFTAexportsalesbenefits(Figure3.10).Forexample,40%ofsurveyrespondentssellingtoChinasuggestedthatasaresultoftheFTAarrangementswithChina,theirexportsalesbenefited,comparedto22%whoindicatednobenefitfromexportsales.Similarly,surveyrespondentsexportingtoSouthKorea(32%)andThailand(31%)highlightedthattheirexportsbenefitedasaresultoftheFTAarrangements.ForallotherkeyFTAcountries,findingsindicatedthatasmallershareofsurveyrespondentswereawareofexportbenefitsfromFTAsascomparedtothosewhodidnotperceivebenefits.Forexample,34%ofrespondentssuggestedtheydidnotreceiveexportbenefitswithNewZealandcomparedtothosethatdid(16%),andthismayreflectzeroorlowtariffrates.
Fig. 3.9 Most popular FTA markets for goods exports
ASEAN 40% New Zealand 30% United States 29%
China 28% Singapore 24% Malaysia 20%
Indonesia 18% Japan 18% South Korea 17%
Thailand 16% Vietnam 13% Philippines 12%
Chile 5% Brunei 4% Myanmar 3%
Cambodia 3% Laos 2%Source: AIBS 2017, Question 26. Note: n= 941. ASEAN region also included for comparison.
44
Furtheranalysisthatcross-referencesthedocumentationpracticesoffirms,showthatthosefirmsthatarenotawareofexportsalesbenefits(i.e.respondentsthatansweredno,notapplicableordon’tknow),areinthemajorityofcasesnotfillingoutFTA-specificdocumentation.ForthekeyFTAmarkets,exporterstoSingaporeaccountedforthehighestrateofsurveyrespondentsthatdidnotfilloutFTAspecificdocumentation(83%),followedbyNewZealand(80%).
Fig. 3.10 Firm awareness of export sales benefits of FTA by country
Yes NotApplicableNo Don’tKnow
40% 22% 17% 22%
27%16%35%22%
32%
12%
16%
14%
31%
20% 29% 17% 33%
26% 12% 30%
32% 19% 35%
34% 20% 30%
29% 13% 47%
27% 17% 24%
China
Japan
SouthKorea
Malaysia
NewZealand
Singapore
Thailand
UnitedStates
Source: AIBS 2017, Question 31. Note: Export sales benefits of FTA, China, n=166; Indonesia, n=102; Japan, n=141; South Korea, n=132; Malaysia, n=77; New Zealand, n=128; Singapore, n=128; Thailand, n=106; United States, n=166.
45
AIB
S 2017
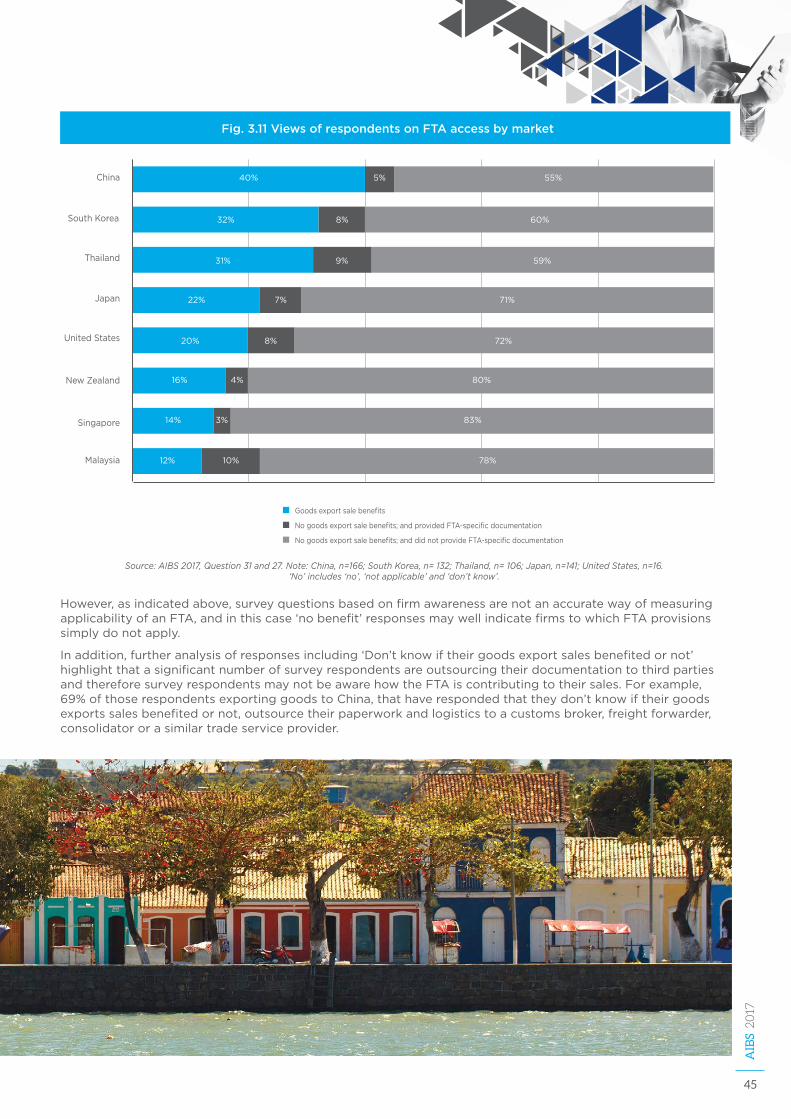
However,asindicatedabove,surveyquestionsbasedonfirmawarenessarenotanaccuratewayofmeasuringapplicabilityofanFTA,andinthiscase‘nobenefit’responsesmaywellindicatefirmstowhichFTAprovisionssimplydonotapply.
Inaddition,furtheranalysisofresponsesincluding‘Don’tknowiftheirgoodsexportsalesbenefitedornot’highlightthatasignificantnumberofsurveyrespondentsareoutsourcingtheirdocumentationtothirdpartiesandthereforesurveyrespondentsmaynotbeawarehowtheFTAiscontributingtotheirsales.Forexample,69%ofthoserespondentsexportinggoodstoChina,thathaverespondedthattheydon’tknowiftheirgoodsexportssalesbenefitedornot,outsourcetheirpaperworkandlogisticstoacustomsbroker,freightforwarder,consolidatororasimilartradeserviceprovider.
Fig. 3.11 Views of respondents on FTA access by market
Goodsexportsalebenefits
Nogoodsexportsalebenefits;andprovidedFTA-specificdocumentation
Nogoodsexportsalebenefits;anddidnotprovideFTA-specificdocumentation
40%
32% 8% 60%
31% 9% 59%
22% 7% 71%
20% 8% 72%
16% 4% 80%
14% 3% 83%
12% 10% 78%
5% 55%China
Japan
SouthKorea
Malaysia
NewZealand
Singapore
Thailand
UnitedStates
Source: AIBS 2017, Question 31 and 27. Note: China, n=166; South Korea, n= 132; Thailand, n= 106; Japan, n=141; United States, n=16. ‘No’ includes ‘no’, ‘not applicable’ and ‘don’t know’.
46
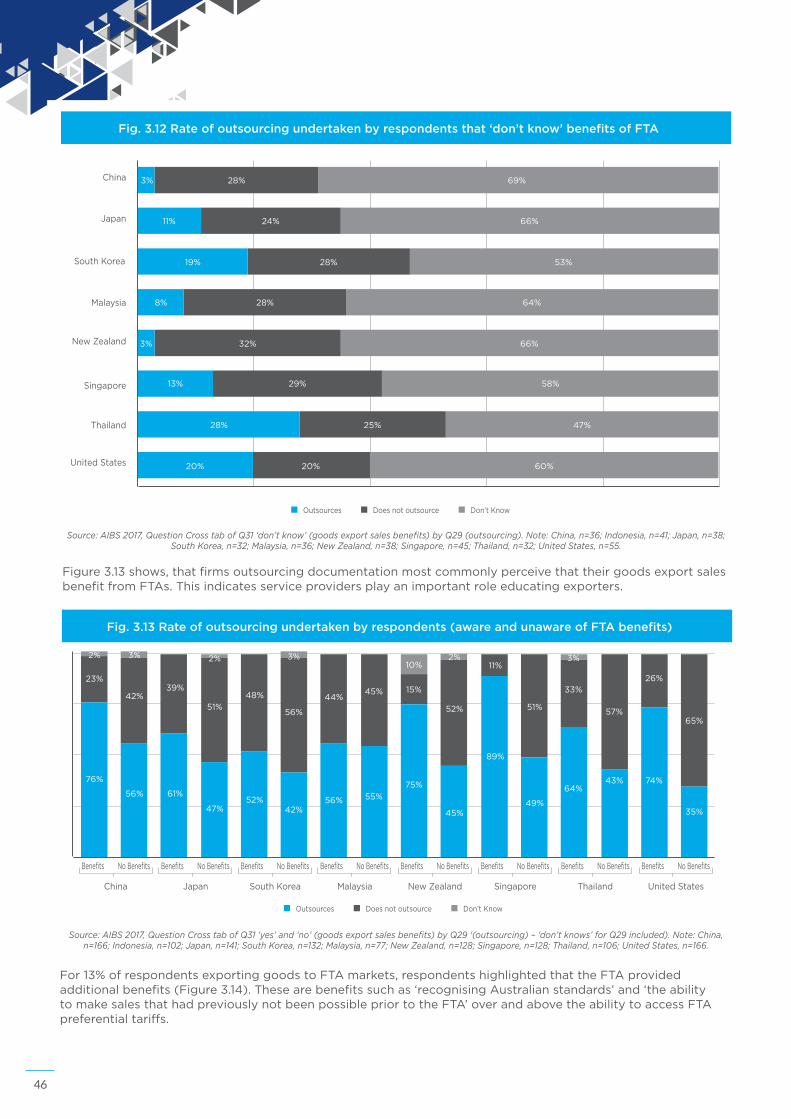
Figure3.13shows,thatfirmsoutsourcingdocumentationmostcommonlyperceivethattheirgoodsexportsalesbenefitfromFTAs.Thisindicatesserviceprovidersplayanimportantroleeducatingexporters.
Fig. 3.12 Rate of outsourcing undertaken by respondents that ‘don’t know’ benefits of FTA
China
Japan
SouthKorea
Malaysia
NewZealand
Singapore
Thailand
UnitedStates
Outsources Doesnotoutsource Don’tKnow
3% 28% 69%
11% 24% 66%
19% 28% 53%
8% 28% 64%
3% 32% 66%
13% 29% 58%
28% 25% 47%
20% 20% 60%
Source: AIBS 2017, Question Cross tab of Q31 ‘don’t know’ (goods export sales benefits) by Q29 (outsourcing). Note: China, n=36; Indonesia, n=41; Japan, n=38; South Korea, n=32; Malaysia, n=36; New Zealand, n=38; Singapore, n=45; Thailand, n=32; United States, n=55.
For13%ofrespondentsexportinggoodstoFTAmarkets,respondentshighlightedthattheFTAprovidedadditionalbenefits(Figure3.14).Thesearebenefitssuchas‘recognisingAustralianstandards’and‘theabilitytomakesalesthathadpreviouslynotbeenpossiblepriortotheFTA’overandabovetheabilitytoaccessFTApreferentialtariffs.
Fig. 3.13 Rate of outsourcing undertaken by respondents (aware and unaware of FTA benefits)
Outsources Doesnotoutsource Don’tKnow
China Japan SouthKorea Malaysia NewZealand Singapore Thailand UnitedStates
Benefits NoBenefits Benefits NoBenefits Benefits NoBenefits Benefits NoBenefits Benefits NoBenefits Benefits NoBenefits Benefits NoBenefits Benefits NoBenefits
76%
23%
2%
56%
42%
3%
61%
39%
47%
51%
2%
52%
48%
42%
56%
3%
56%
44%
55%
45%
75%
15%
10%
45%
52%
2%
89%
11%
49%
51%
64%
33%
3%
43%
57%
74%
26%
35%
65%
Source: AIBS 2017, Question Cross tab of Q31 ‘yes’ and ‘no’ (goods export sales benefits) by Q29 ‘(outsourcing) – ‘don’t knows’ for Q29 included). Note: China, n=166; Indonesia, n=102; Japan, n=141; South Korea, n=132; Malaysia, n=77; New Zealand, n=128; Singapore, n=128; Thailand, n=106; United States, n=166.
47
AIB
S 2017
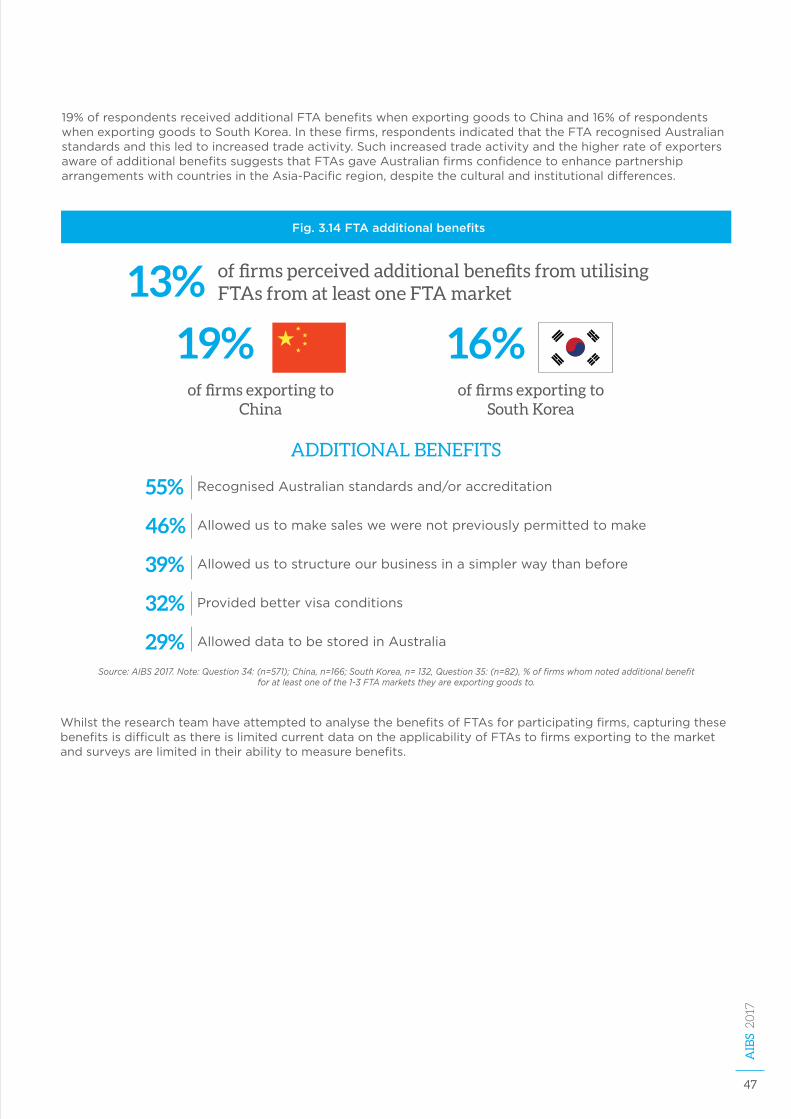
19%ofrespondentsreceivedadditionalFTAbenefitswhenexportinggoodstoChinaand16%ofrespondentswhenexportinggoodstoSouthKorea.Inthesefirms,respondentsindicatedthattheFTArecognisedAustralianstandardsandthisledtoincreasedtradeactivity.SuchincreasedtradeactivityandthehigherrateofexportersawareofadditionalbenefitssuggeststhatFTAsgaveAustralianfirmsconfidencetoenhancepartnershiparrangementswithcountriesintheAsia-Pacificregion,despitetheculturalandinstitutionaldifferences.
WhilsttheresearchteamhaveattemptedtoanalysethebenefitsofFTAsforparticipatingfirms,capturingthesebenefitsisdifficultasthereislimitedcurrentdataontheapplicabilityofFTAstofirmsexportingtothemarketandsurveysarelimitedintheirabilitytomeasurebenefits.
Fig. 3.14 FTA additional benefits
of firms perceived additional benefits from utilising FTAs from at least one FTA market13%
of firms exporting to China
19% of firms exporting to
South Korea
16%
ADDITIONAL BENEFITS
RecognisedAustralianstandardsand/oraccreditation55%
Allowedustomakesaleswewerenotpreviouslypermittedtomake46%
Allowedustostructureourbusinessinasimplerwaythanbefore39%
Providedbettervisaconditions32%
AlloweddatatobestoredinAustralia29%Source: AIBS 2017. Note: Question 34: (n=571); China, n=166; South Korea, n= 132, Question 35: (n=82), % of firms whom noted additional benefit
for at least one of the 1-3 FTA markets they are exporting goods to.
48
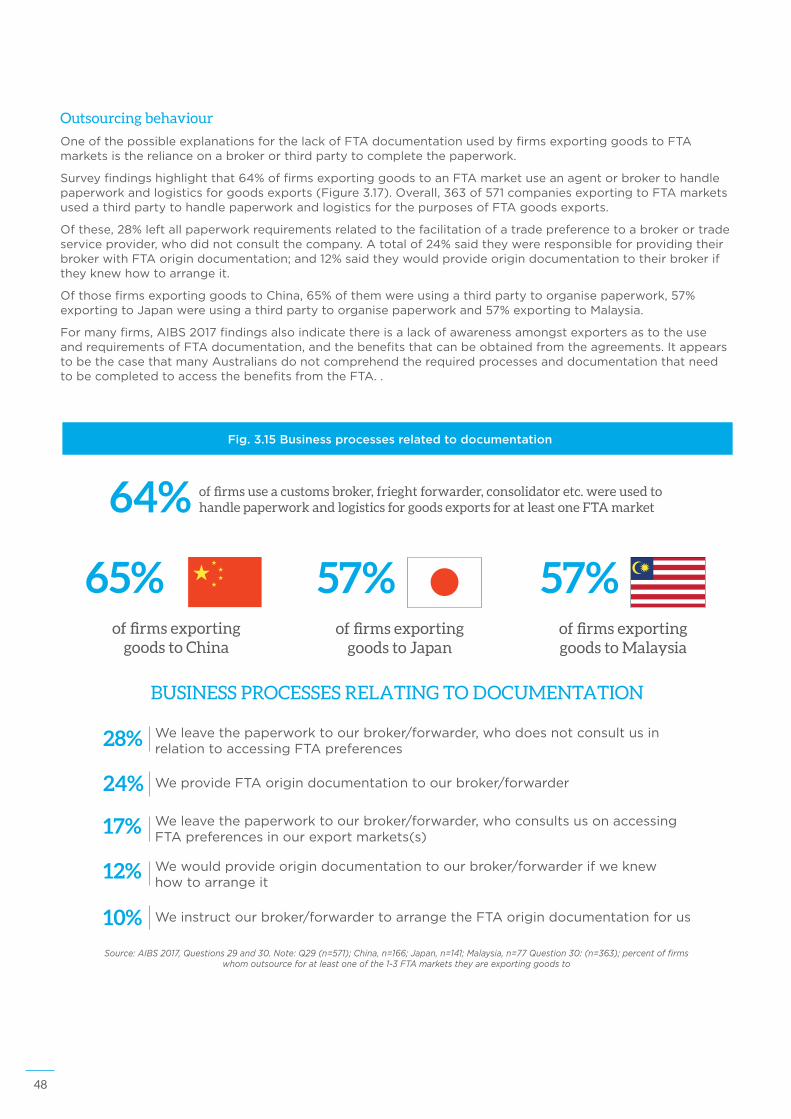
Outsourcing behaviour
OneofthepossibleexplanationsforthelackofFTAdocumentationusedbyfirmsexportinggoodstoFTAmarketsistherelianceonabrokerorthirdpartytocompletethepaperwork.
Surveyfindingshighlightthat64%offirmsexportinggoodstoanFTAmarketuseanagentorbrokertohandlepaperworkandlogisticsforgoodsexports(Figure3.17).Overall,363of571companiesexportingtoFTAmarketsusedathirdpartytohandlepaperworkandlogisticsforthepurposesofFTAgoodsexports.
Ofthese,28%leftallpaperworkrequirementsrelatedtothefacilitationofatradepreferencetoabrokerortradeserviceprovider,whodidnotconsultthecompany.Atotalof24%saidtheywereresponsibleforprovidingtheirbrokerwithFTAorigindocumentation;and12%saidtheywouldprovideorigindocumentationtotheirbrokeriftheyknewhowtoarrangeit.
OfthosefirmsexportinggoodstoChina,65%ofthemwereusingathirdpartytoorganisepaperwork,57%exportingtoJapanwereusingathirdpartytoorganisepaperworkand57%exportingtoMalaysia.
Formanyfirms,AIBS2017findingsalsoindicatethereisalackofawarenessamongstexportersastotheuseandrequirementsofFTAdocumentation,andthebenefitsthatcanbeobtainedfromtheagreements.ItappearstobethecasethatmanyAustraliansdonotcomprehendtherequiredprocessesanddocumentationthatneedtobecompletedtoaccessthebenefitsfromtheFTA..
Fig. 3.15 Business processes related to documentation
of firms use a customs broker, frieght forwarder, consolidator etc. were used to handle paperwork and logistics for goods exports for at least one FTA market64%
BUSINESS PROCESSES RELATING TO DOCUMENTATION
Weleavethepaperworktoourbroker/forwarder,whodoesnotconsultusinrelationtoaccessingFTApreferences
28%
WeprovideFTAorigindocumentationtoourbroker/forwarder24%
Weleavethepaperworktoourbroker/forwarder,whoconsultsusonaccessingFTApreferencesinourexportmarkets(s)
17%
Wewouldprovideorigindocumentationtoourbroker/forwarderifweknewhowtoarrangeit
12%
Weinstructourbroker/forwardertoarrangetheFTAorigindocumentationforus10%
of firms exporting goods to China
65% of firms exporting goods to Malaysia
57% of firms exporting
goods to Japan
57%
Source: AIBS 2017, Questions 29 and 30. Note: Q29 (n=571); China, n=166; Japan, n=141; Malaysia, n=77 Question 30: (n=363); percent of firms whom outsource for at least one of the 1-3 FTA markets they are exporting goods to
49
AIB
S 2017
3.2.4 | Certificates of origin
Ininternationalbusiness,itisverycommonforgoodstobeprocessedinmultiplecountriesusingmaterialsfrombothforeignanddomesticsources.Thereisaneedtodeterminetheoriginofagoodwhenimportingintomanycountries.Therulesoforigincanvaryandthereisadifferencebetweenpreferentialandnon-preferentialcertificatesoforigin24.
Preferentialcertificatesoforigin:
Usedforgovernedbyspecialarrangementssuchasfreeandpreferentialtradeagreements,
Certifyifgoodsmeetthecriteriatoqualifyforpreferentialtreatmentsuchasreducedoreliminateddutyrates,
Ensurethatonlygoodsmovedbetweencountrieswithagreementsreceivepreferentialtreatment,and
Establishoriginbydemonstratingthatthegoodisan‘originatingproduct’.
Non-preferentialcertificatesoforigin:
Applytotradethatisnotgovernedbyspecialtradingarrangements,
Certifyoriginforcertainpurposessuchasquotas,anti-dumping,statisticsorlabelling,
Establishoriginbaseduponeitherbeingwhollyobtainedorproducedinonecountryorhavingundergonesubstantialtransformation,and
Markthegoodsoriginforimportation.
Overall,63%ofbusinesseswhoindicatedtheyexportedgoodsoverseas,whethertoanFTAmarketorothermarket,usedCoOstoverifythattheirproductwasfromAustralia(Figure3.18).Thiswasparticularlythecaseforcompaniesfromtheagriculture,forestryandfishingsector(79%),manufacturingsector(68%)andwholesaletradesector(63%).Largerorganisations(78%)ratherthansmallerones(57%)weremorelikelytouseCoOstoverifytheirproductswerefromAustralia.Surveyrespondentsindicatedthatthehighertherevenueofthecompany,themorelikelytheyaretouseCoOs.Thiscouldbeattributedtothecostofadministeringcertificatesandthetimeandresourcesrequiredtopreparedocumentation.Itcouldalsobeattributedtolargerfirmsexportingmoreoftenthansmallerfirmsandinlargequantities.
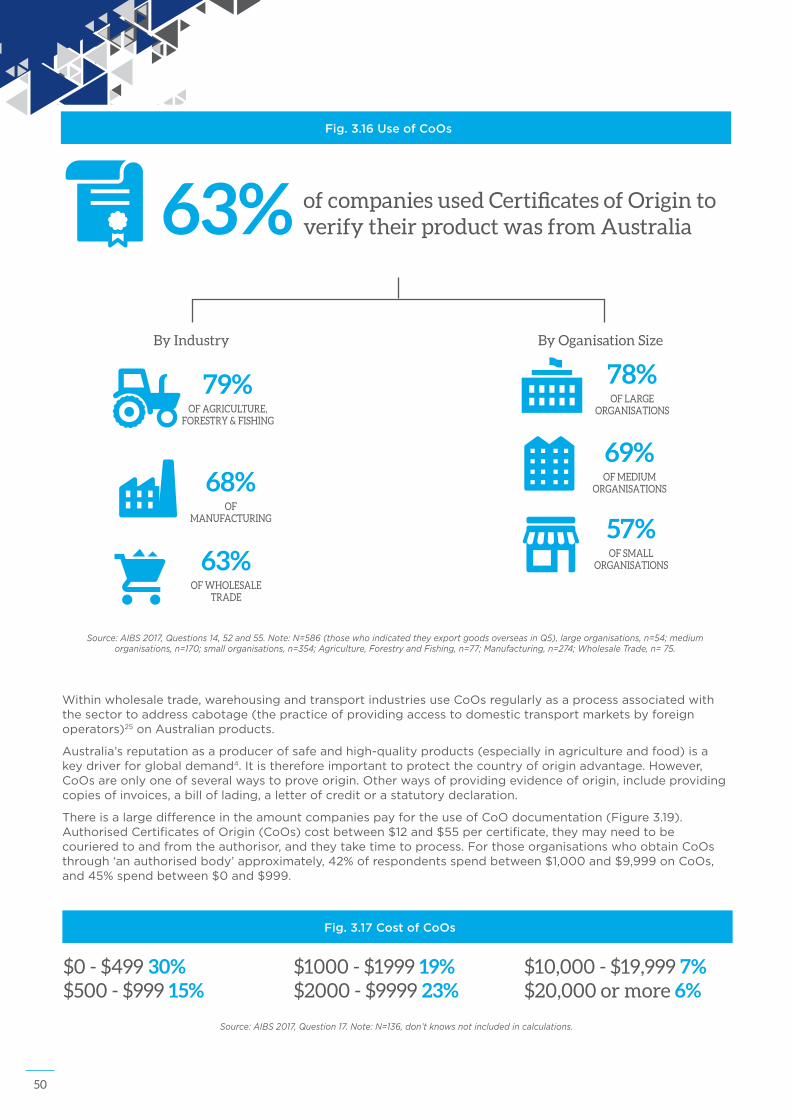
50
Withinwholesaletrade,warehousingandtransportindustriesuseCoOsregularlyasaprocessassociatedwiththesectortoaddresscabotage(thepracticeofprovidingaccesstodomestictransportmarketsbyforeignoperators)25onAustralianproducts.
Australia’sreputationasaproducerofsafeandhigh-qualityproducts(especiallyinagricultureandfood)isakeydriverforglobaldemand4.Itisthereforeimportanttoprotectthecountryoforiginadvantage.However,CoOsareonlyoneofseveralwaystoproveorigin.Otherwaysofprovidingevidenceoforigin,includeprovidingcopiesofinvoices,abilloflading,aletterofcreditorastatutorydeclaration.
ThereisalargedifferenceintheamountcompaniespayfortheuseofCoOdocumentation(Figure3.19).AuthorisedCertificatesofOrigin(CoOs)costbetween$12and$55percertificate,theymayneedtobecourieredtoandfromtheauthorisor,andtheytaketimetoprocess.ForthoseorganisationswhoobtainCoOsthrough‘anauthorisedbody’approximately,42%ofrespondentsspendbetween$1,000and$9,999onCoOs,and45%spendbetween$0and$999.
Fig. 3.16 Use of CoOs
of companies used Certificates of Origin to verify their product was from Australia63%
By Industry By Oganisation Size
OF LARGE ORGANISATIONS
78%
OF MEDIUM ORGANISATIONS
69%
OF SMALL ORGANISATIONS
57%
OF AGRICULTURE, FORESTRY & FISHING
79%
OF MANUFACTURING
68%
OF WHOLESALE TRADE
63%
Source: AIBS 2017, Questions 14, 52 and 55. Note: N=586 (those who indicated they export goods overseas in Q5), large organisations, n=54; medium organisations, n=170; small organisations, n=354; Agriculture, Forestry and Fishing, n=77; Manufacturing, n=274; Wholesale Trade, n= 75.
Fig. 3.17 Cost of CoOs
$0 - $499 30% $500 - $999 15%
$1000 - $1999 19% $2000 - $9999 23%
$10,000 - $19,999 7%$20,000 or more 6%
Source: AIBS 2017, Question 17. Note: N=136, don’t knows not included in calculations.
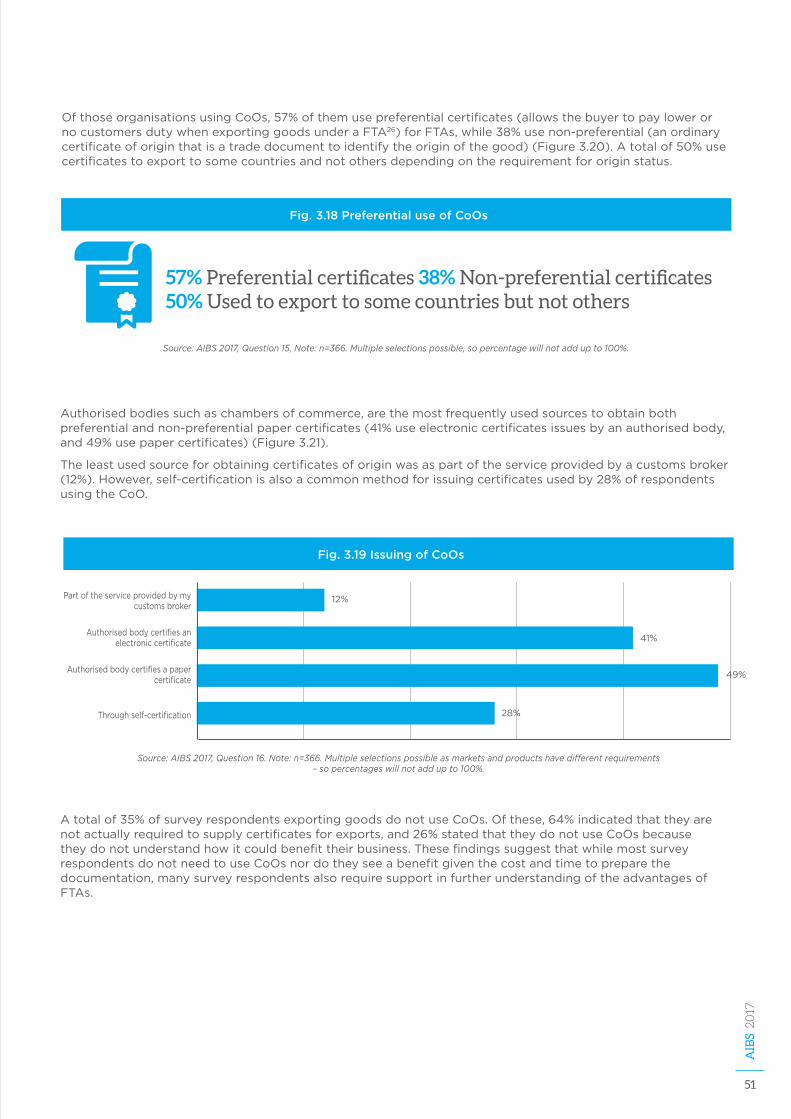
51
AIB
S 2017
OfthoseorganisationsusingCoOs,57%ofthemusepreferentialcertificates(allowsthebuyertopaylowerornocustomersdutywhenexportinggoodsunderaFTA26)forFTAs,while38%usenon-preferential(anordinarycertificateoforiginthatisatradedocumenttoidentifytheoriginofthegood)(Figure3.20).Atotalof50%usecertificatestoexporttosomecountriesandnotothersdependingontherequirementfororiginstatus.
Authorisedbodiessuchaschambersofcommerce,arethemostfrequentlyusedsourcestoobtainbothpreferentialandnon-preferentialpapercertificates(41%useelectroniccertificatesissuesbyanauthorisedbody,and49%usepapercertificates)(Figure3.21).
Theleastusedsourceforobtainingcertificatesoforiginwasaspartoftheserviceprovidedbyacustomsbroker(12%).However,self-certificationisalsoacommonmethodforissuingcertificatesusedby28%ofrespondentsusingtheCoO.
Fig. 3.18 Preferential use of CoOs
57% Preferential certificates 38% Non-preferential certificates50% Used to export to some countries but not others
Source: AIBS 2017, Question 15, Note: n=366. Multiple selections possible, so percentage will not add up to 100%.
Fig. 3.19 Issuing of CoOs
Partoftheserviceprovidedbymycustomsbroker
Authorisedbodycertifiesanelectroniccertificate
Authorisedbodycertifiesapapercertificate
Throughself-certification
12%
41%
49%
28%
Source: AIBS 2017, Question 16. Note: n=366. Multiple selections possible as markets and products have different requirements – so percentages will not add up to 100%.
Atotalof35%ofsurveyrespondentsexportinggoodsdonotuseCoOs.Ofthese,64%indicatedthattheyarenotactuallyrequiredtosupplycertificatesforexports,and26%statedthattheydonotuseCoOsbecausetheydonotunderstandhowitcouldbenefittheirbusiness.ThesefindingssuggestthatwhilemostsurveyrespondentsdonotneedtouseCoOsnordotheyseeabenefitgiventhecostandtimetopreparethedocumentation,manysurveyrespondentsalsorequiresupportinfurtherunderstandingoftheadvantagesofFTAs.
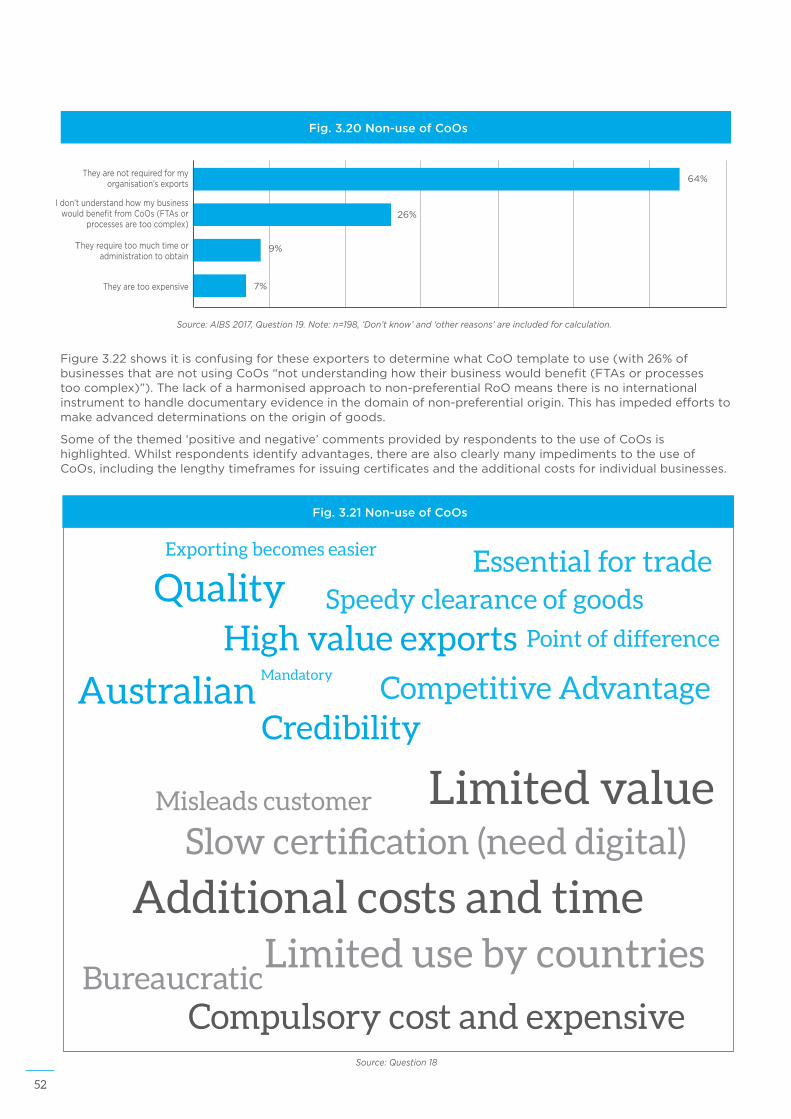
52
64%
Fig. 3.20 Non-use of CoOs
Theyarenotrequiredformyorganisation’sexports
Idon’tunderstandhowmybusinesswouldbenefitfromCoOs(FTAsor
processesaretoocomplex)
Theyrequiretoomuchtimeoradministrationtoobtain
Theyaretooexpensive
26%
9%
7%
Source: AIBS 2017, Question 19. Note: n=198, ‘Don’t know’ and ‘other reasons’ are included for calculation.
Figure3.22showsitisconfusingfortheseexporterstodeterminewhatCoOtemplatetouse(with26%ofbusinessesthatarenotusingCoOs“notunderstandinghowtheirbusinesswouldbenefit(FTAsorprocessestoocomplex)”).Thelackofaharmonisedapproachtonon-preferentialRoOmeansthereisnointernationalinstrumenttohandledocumentaryevidenceinthedomainofnon-preferentialorigin.Thishasimpededeffortstomakeadvanceddeterminationsontheoriginofgoods.
Someofthethemed‘positiveandnegative’commentsprovidedbyrespondentstotheuseofCoOsishighlighted.Whilstrespondentsidentifyadvantages,therearealsoclearlymanyimpedimentstotheuseofCoOs,includingthelengthytimeframesforissuingcertificatesandtheadditionalcostsforindividualbusinesses.
Misleads customer
Slow certification (need digital)
Limited use by countriesBureaucratic
Compulsory cost and expensive
Additional costs and time
Limited value
Exporting becomes easier
Mandatory
Point of difference
Speedy clearance of goods
High value exports
AustralianCredibility
Competitive Advantage
Essential for tradeQuality
Fig. 3.21 Non-use of CoOs
Source: Question 18
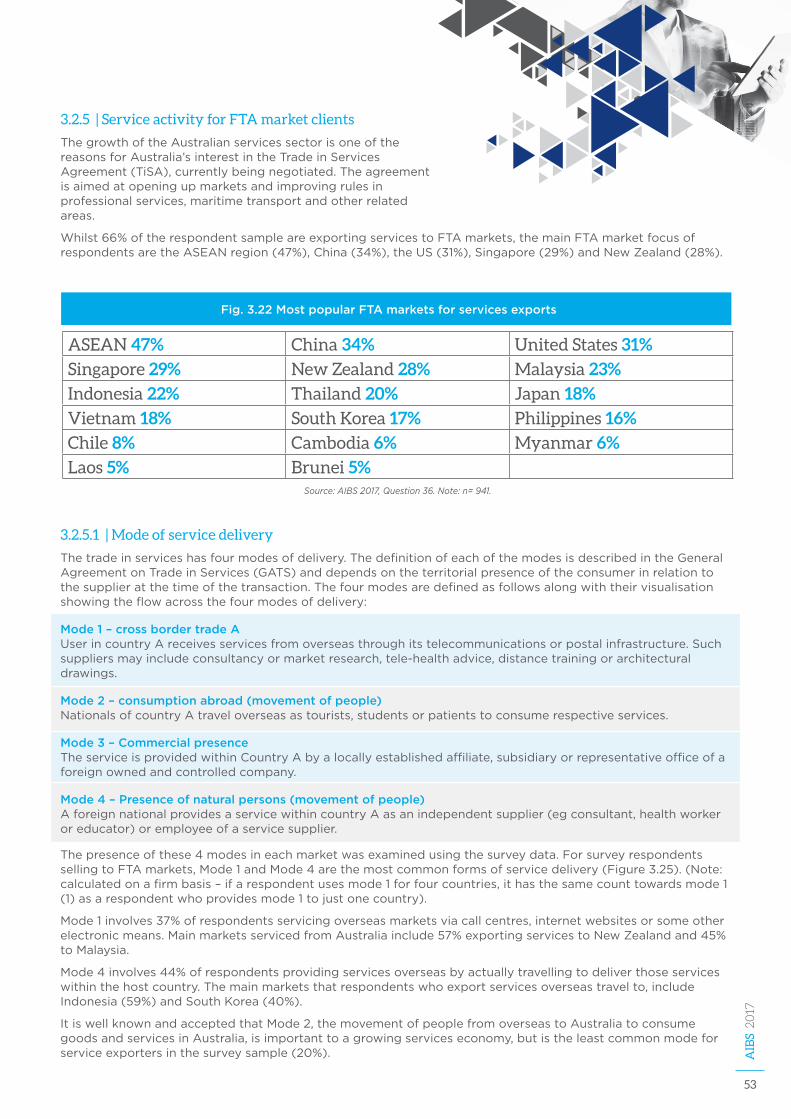
53
AIB
S 2017
3.2.5 | Service activity for FTA market clients
ThegrowthoftheAustralianservicessectorisoneofthereasonsforAustralia’sinterestintheTradeinServicesAgreement(TiSA),currentlybeingnegotiated.Theagreementisaimedatopeningupmarketsandimprovingrulesinprofessionalservices,maritimetransportandotherrelatedareas.
Whilst66%oftherespondentsampleareexportingservicestoFTAmarkets,themainFTAmarketfocusofrespondentsaretheASEANregion(47%),China(34%),theUS(31%),Singapore(29%)andNewZealand(28%).
Fig. 3.22 Most popular FTA markets for services exports
ASEAN 47% China 34% United States 31%
Singapore 29% New Zealand 28% Malaysia 23%
Indonesia 22% Thailand 20% Japan 18%
Vietnam 18% South Korea 17% Philippines 16%
Chile 8% Cambodia 6% Myanmar 6%
Laos 5% Brunei 5%Source: AIBS 2017, Question 36. Note: n= 941.
3.2.5.1 | Mode of service delivery
Thetradeinserviceshasfourmodesofdelivery.ThedefinitionofeachofthemodesisdescribedintheGeneralAgreementonTradeinServices(GATS)anddependsontheterritorialpresenceoftheconsumerinrelationtothesupplieratthetimeofthetransaction.Thefourmodesaredefinedasfollowsalongwiththeirvisualisationshowingtheflowacrossthefourmodesofdelivery:
Mode 1 – cross border trade A UserincountryAreceivesservicesfromoverseasthroughitstelecommunicationsorpostalinfrastructure.Suchsuppliersmayincludeconsultancyormarketresearch,tele-healthadvice,distancetrainingorarchitecturaldrawings.
Mode 2 – consumption abroad (movement of people) NationalsofcountryAtraveloverseasastourists,studentsorpatientstoconsumerespectiveservices.
Mode 3 – Commercial presence TheserviceisprovidedwithinCountryAbyalocallyestablishedaffiliate,subsidiaryorrepresentativeofficeofaforeignownedandcontrolledcompany.
Mode 4 – Presence of natural persons (movement of people) AforeignnationalprovidesaservicewithincountryAasanindependentsupplier(egconsultant,healthworkeroreducator)oremployeeofaservicesupplier.
Thepresenceofthese4modesineachmarketwasexaminedusingthesurveydata.ForsurveyrespondentssellingtoFTAmarkets,Mode1andMode4arethemostcommonformsofservicedelivery(Figure3.25).(Note:calculatedonafirmbasis–ifarespondentusesmode1forfourcountries,ithasthesamecounttowardsmode1(1)asarespondentwhoprovidesmode1tojustonecountry).
Mode1involves37%ofrespondentsservicingoverseasmarketsviacallcentres,internetwebsitesorsomeotherelectronicmeans.MainmarketsservicedfromAustraliainclude57%exportingservicestoNewZealandand45%toMalaysia.
Mode4involves44%ofrespondentsprovidingservicesoverseasbyactuallytravellingtodeliverthoseserviceswithinthehostcountry.Themainmarketsthatrespondentswhoexportservicesoverseastravelto,includeIndonesia(59%)andSouthKorea(40%).
ItiswellknownandacceptedthatMode2,themovementofpeoplefromoverseastoAustraliatoconsumegoodsandservicesinAustralia,isimportanttoagrowingserviceseconomy,butistheleastcommonmodeforserviceexportersinthesurveysample(20%).
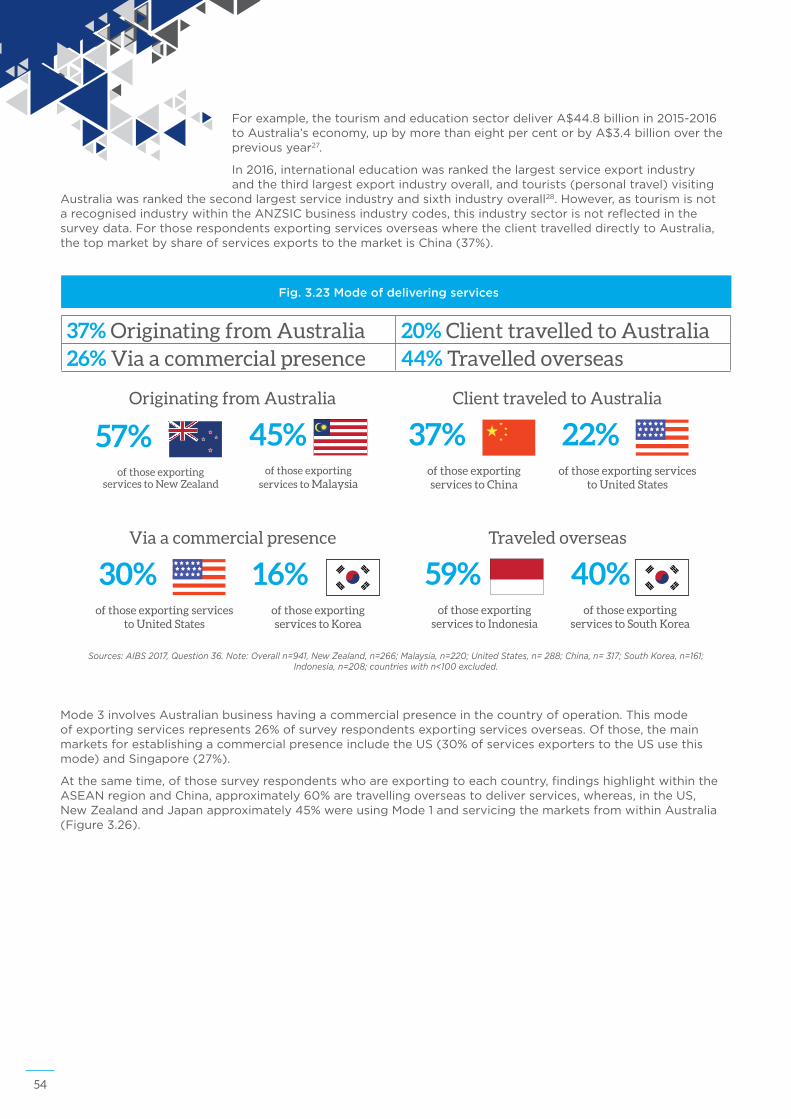
54
Forexample,thetourismandeducationsectordeliverA$44.8billionin2015-2016toAustralia’seconomy,upbymorethaneightpercentorbyA$3.4billionoverthepreviousyear27.
In2016,internationaleducationwasrankedthelargestserviceexportindustryandthethirdlargestexportindustryoverall,andtourists(personaltravel)visiting
Australiawasrankedthesecondlargestserviceindustryandsixthindustryoverall28.However,astourismisnotarecognisedindustrywithintheANZSICbusinessindustrycodes,thisindustrysectorisnotreflectedinthesurveydata.ForthoserespondentsexportingservicesoverseaswheretheclienttravelleddirectlytoAustralia,thetopmarketbyshareofservicesexportstothemarketisChina(37%).
Mode3involvesAustralianbusinesshavingacommercialpresenceinthecountryofoperation.Thismodeofexportingservicesrepresents26%ofsurveyrespondentsexportingservicesoverseas.Ofthose,themainmarketsforestablishingacommercialpresenceincludetheUS(30%ofservicesexporterstotheUSusethismode)andSingapore(27%).
Atthesametime,ofthosesurveyrespondentswhoareexportingtoeachcountry,findingshighlightwithintheASEANregionandChina,approximately60%aretravellingoverseastodeliverservices,whereas,intheUS,NewZealandandJapanapproximately45%wereusingMode1andservicingthemarketsfromwithinAustralia(Figure3.26).
Fig. 3.23 Mode of delivering services
37% Originating from Australia 20% Client travelled to Australia26% Via a commercial presence 44% Travelled overseas
Client traveled to Australia
of those exporting services to China
37% of those exporting services
to United States
22%
Via a commercial presence
of those exporting services to Korea
16% of those exporting services
to United States
30% Traveled overseas
of those exporting services to Indonesia
59% of those exporting
services to South Korea
40%
Originating from Australia
of those exporting services to Malaysia
45% of those exporting
services to New Zealand
57%
Sources: AIBS 2017, Question 36. Note: Overall n=941, New Zealand, n=266; Malaysia, n=220; United States, n= 288; China, n= 317; South Korea, n=161; Indonesia, n=208; countries with n<100 excluded.
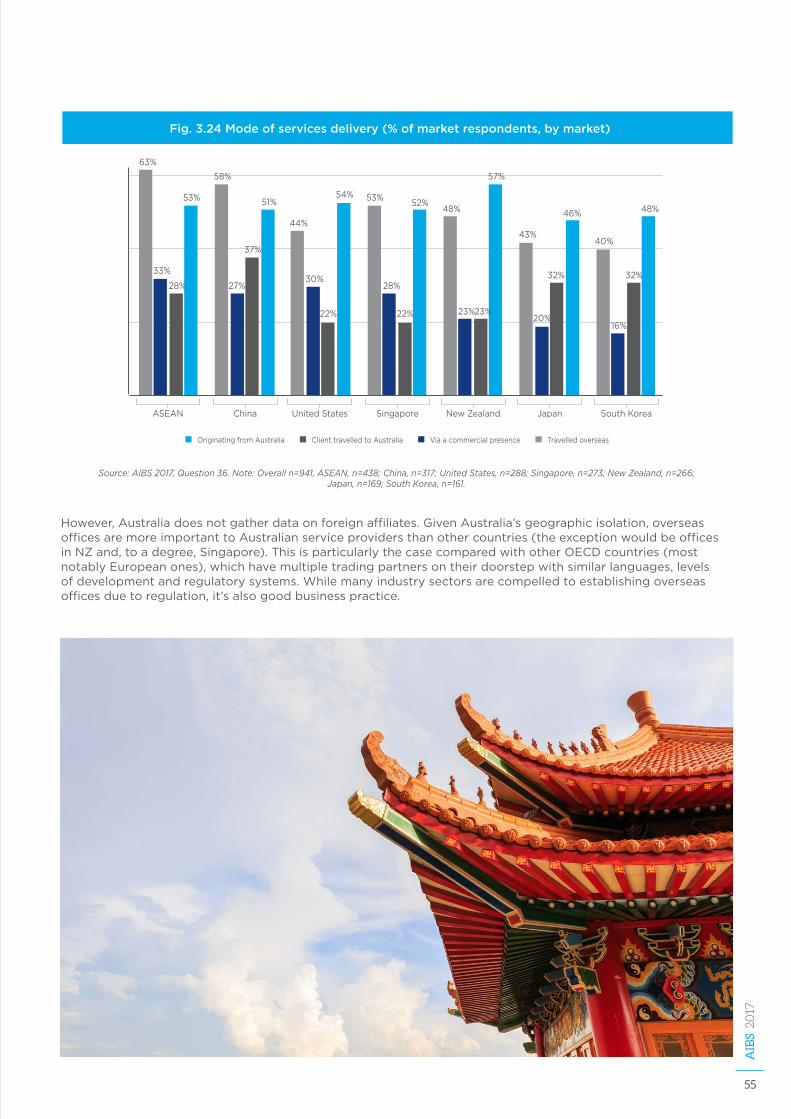
55
AIB
S 2017
However,Australiadoesnotgatherdataonforeignaffiliates.GivenAustralia’sgeographicisolation,overseasofficesaremoreimportanttoAustralianserviceprovidersthanothercountries(theexceptionwouldbeofficesinNZand,toadegree,Singapore).ThisisparticularlythecasecomparedwithotherOECDcountries(mostnotablyEuropeanones),whichhavemultipletradingpartnersontheirdoorstepwithsimilarlanguages,levelsofdevelopmentandregulatorysystems.Whilemanyindustrysectorsarecompelledtoestablishingoverseasofficesduetoregulation,it’salsogoodbusinesspractice.
Fig. 3.24 Mode of services delivery (% of market respondents, by market)
OriginatingfromAustralia ClienttravelledtoAustralia Viaacommercialpresence Travelledoverseas
ASEAN China UnitedStates Singapore NewZealand Japan SouthKorea
Source: AIBS 2017, Question 36. Note: Overall n=941, ASEAN, n=438; China, n=317; United States, n=288; Singapore, n=273; New Zealand, n=266; Japan, n=169; South Korea, n=161.
63%
33%
28% 28%
53%
58% 57%
43%
20%
32%
46%
40%
16%
32%
48%
27%
37%
51%
44%
52%48%
30%
22% 22% 23%23%
54% 53%
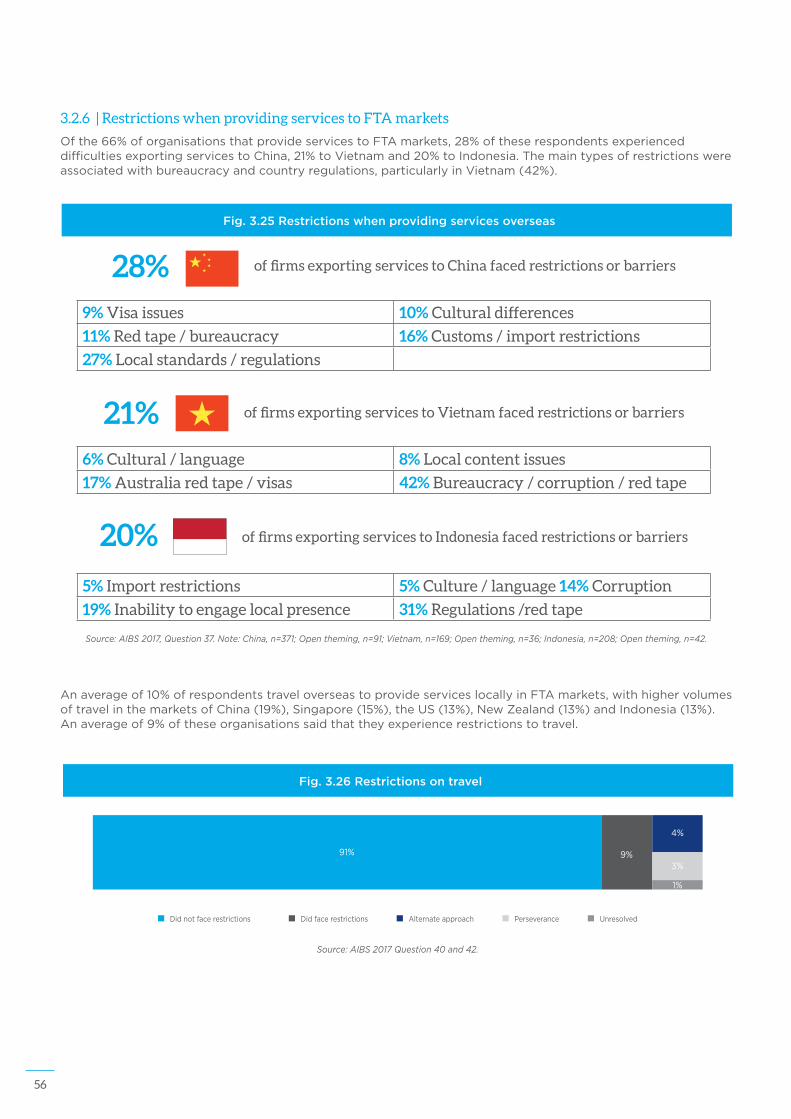
56
Fig. 3.25 Restrictions when providing services overseas
of firms exporting services to China faced restrictions or barriers28% 9% Visa issues 10% Cultural differences
11% Red tape / bureaucracy 16% Customs / import restrictions
27% Local standards / regulations
of firms exporting services to Vietnam faced restrictions or barriers21% 6% Cultural / language 8% Local content issues
17% Australia red tape / visas 42% Bureaucracy / corruption / red tape
5% Import restrictions 5% Culture / language 14% Corruption
19% Inability to engage local presence 31% Regulations /red tape
of firms exporting services to Indonesia faced restrictions or barriers20%
Source: AIBS 2017, Question 37. Note: China, n=371; Open theming, n=91; Vietnam, n=169; Open theming, n=36; Indonesia, n=208; Open theming, n=42.
Anaverageof10%ofrespondentstraveloverseastoprovideserviceslocallyinFTAmarkets,withhighervolumesoftravelinthemarketsofChina(19%),Singapore(15%),theUS(13%),NewZealand(13%)andIndonesia(13%).Anaverageof9%oftheseorganisationssaidthattheyexperiencerestrictionstotravel.
Fig. 3.26 Restrictions on travel
Didnotfacerestrictions Didfacerestrictions Alternateapproach Perseverance Unresolved
91% 9%
4%
3%
1%
Source: AIBS 2017 Question 40 and 42.
3.2.6 | Restrictions when providing services to FTA markets
Ofthe66%oforganisationsthatprovideservicestoFTAmarkets,28%oftheserespondentsexperienceddifficultiesexportingservicestoChina,21%toVietnamand20%toIndonesia.Themaintypesofrestrictionswereassociatedwithbureaucracyandcountryregulations,particularlyinVietnam(42%).
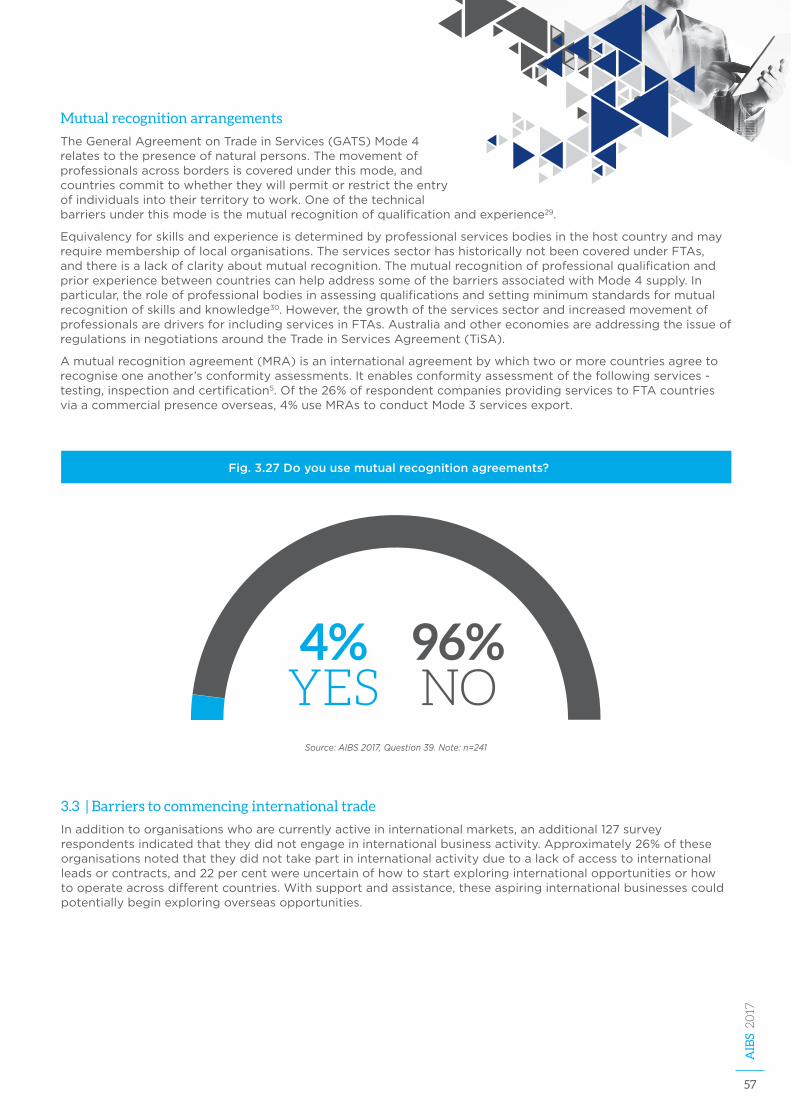
57
AIB
S 2017
Mutual recognition arrangements
TheGeneralAgreementonTradeinServices(GATS)Mode4relatestothepresenceofnaturalpersons.Themovementofprofessionalsacrossbordersiscoveredunderthismode,andcountriescommittowhethertheywillpermitorrestricttheentryofindividualsintotheirterritorytowork.Oneofthetechnicalbarriersunderthismodeisthemutualrecognitionofqualificationandexperience29.
Equivalencyforskillsandexperienceisdeterminedbyprofessionalservicesbodiesinthehostcountryandmayrequiremembershipoflocalorganisations.TheservicessectorhashistoricallynotbeencoveredunderFTAs,andthereisalackofclarityaboutmutualrecognition.ThemutualrecognitionofprofessionalqualificationandpriorexperiencebetweencountriescanhelpaddresssomeofthebarriersassociatedwithMode4supply.Inparticular,theroleofprofessionalbodiesinassessingqualificationsandsettingminimumstandardsformutualrecognitionofskillsandknowledge30.However,thegrowthoftheservicessectorandincreasedmovementofprofessionalsaredriversforincludingservicesinFTAs.AustraliaandothereconomiesareaddressingtheissueofregulationsinnegotiationsaroundtheTradeinServicesAgreement(TiSA).
Amutualrecognitionagreement(MRA)isaninternationalagreementbywhichtwoormorecountriesagreetorecogniseoneanother’sconformityassessments.Itenablesconformityassessmentofthefollowingservices-testing,inspectionandcertification5.Ofthe26%ofrespondentcompaniesprovidingservicestoFTAcountriesviaacommercialpresenceoverseas,4%useMRAstoconductMode3servicesexport.
3.3 | Barriers to commencing international trade
Inadditiontoorganisationswhoarecurrentlyactiveininternationalmarkets,anadditional127surveyrespondentsindicatedthattheydidnotengageininternationalbusinessactivity.Approximately26%oftheseorganisationsnotedthattheydidnottakepartininternationalactivityduetoalackofaccesstointernationalleadsorcontracts,and22percentwereuncertainofhowtostartexploringinternationalopportunitiesorhowtooperateacrossdifferentcountries.Withsupportandassistance,theseaspiringinternationalbusinessescouldpotentiallybeginexploringoverseasopportunities.
Fig. 3.27 Do you use mutual recognition agreements?
4%YES
96%NO
Source: AIBS 2017, Question 39. Note: n=241
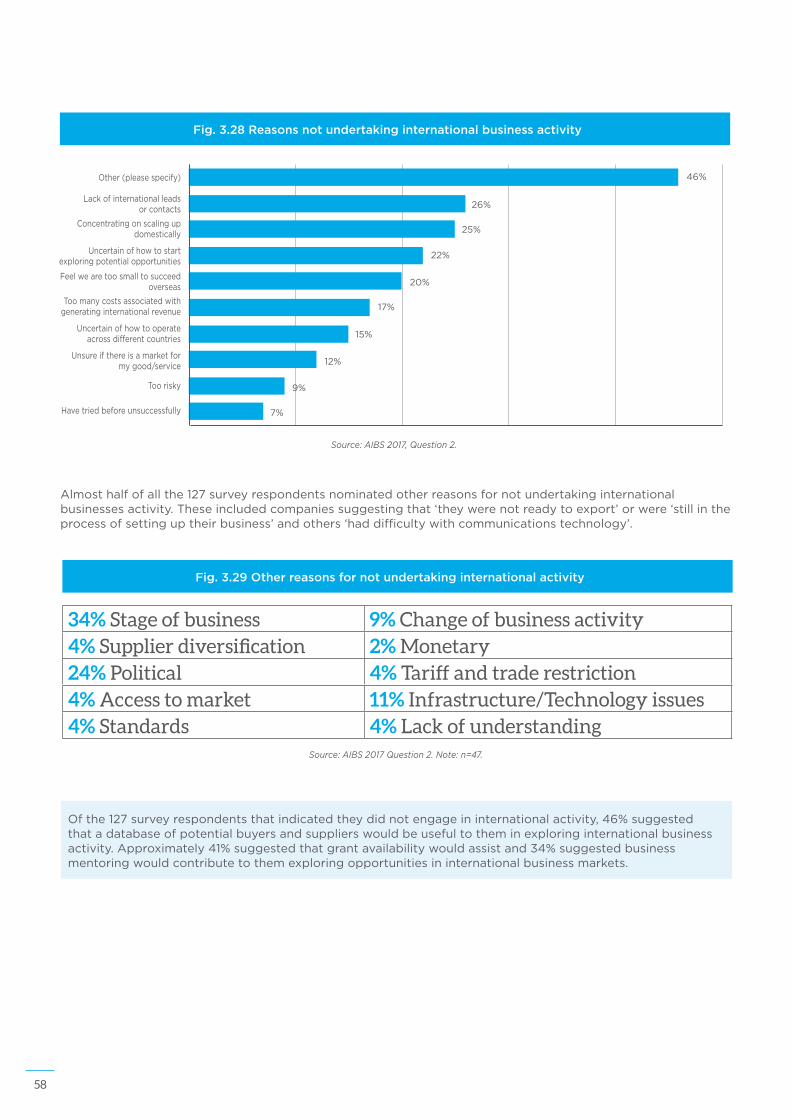
58
Almosthalfofallthe127surveyrespondentsnominatedotherreasonsfornotundertakinginternationalbusinessesactivity.Theseincludedcompaniessuggestingthat‘theywerenotreadytoexport’orwere‘stillintheprocessofsettinguptheirbusiness’andothers‘haddifficultywithcommunicationstechnology’.
Ofthe127surveyrespondentsthatindicatedtheydidnotengageininternationalactivity,46%suggestedthatadatabaseofpotentialbuyersandsupplierswouldbeusefultotheminexploringinternationalbusinessactivity.Approximately41%suggestedthatgrantavailabilitywouldassistand34%suggestedbusinessmentoringwouldcontributetothemexploringopportunitiesininternationalbusinessmarkets.
Fig. 3.28 Reasons not undertaking international business activity
Other(pleasespecify)
Lackofinternationalleadsorcontacts
Concentratingonscalingupdomestically
Feelwearetoosmalltosucceedoverseas
Uncertainofhowtooperateacrossdifferentcountries
Unsureifthereisamarketformygood/service
Toorisky
Havetriedbeforeunsuccessfully
Toomanycostsassociatedwithgeneratinginternationalrevenue
Uncertainofhowtostartexploringpotentialopportunities
46%
26%
25%
20%
15%
12%
9%
7%
17%
22%
Source: AIBS 2017, Question 2.
Fig. 3.29 Other reasons for not undertaking international activity
34% Stage of business 9% Change of business activity4% Supplier diversification 2% Monetary24% Political 4% Tariff and trade restriction4% Access to market 11% Infrastructure/Technology issues4% Standards 4% Lack of understanding
Source: AIBS 2017 Question 2. Note: n=47.
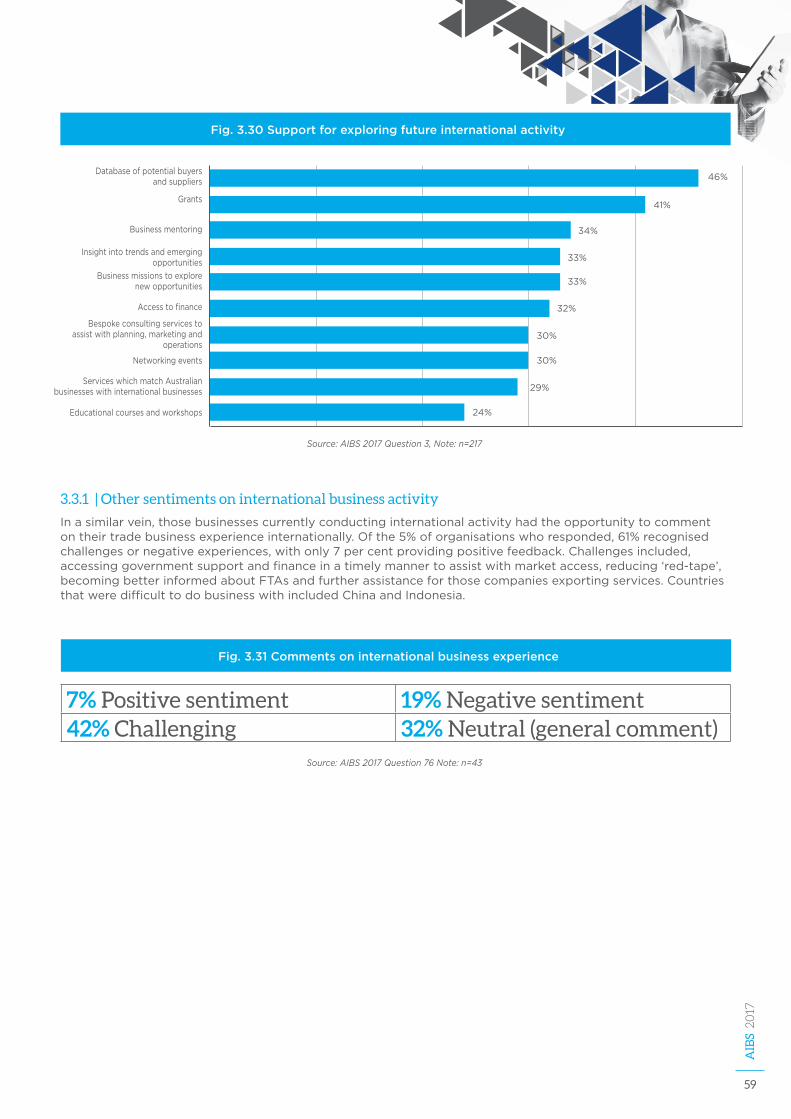
59
AIB
S 2017
3.3.1 | Other sentiments on international business activity
Inasimilarvein,thosebusinessescurrentlyconductinginternationalactivityhadtheopportunitytocommentontheirtradebusinessexperienceinternationally.Ofthe5%oforganisationswhoresponded,61%recognisedchallengesornegativeexperiences,withonly7percentprovidingpositivefeedback.Challengesincluded,accessinggovernmentsupportandfinanceinatimelymannertoassistwithmarketaccess,reducing‘red-tape’,becomingbetterinformedaboutFTAsandfurtherassistanceforthosecompaniesexportingservices.CountriesthatweredifficulttodobusinesswithincludedChinaandIndonesia.
Fig. 3.30 Support for exploring future international activity
Databaseofpotentialbuyersandsuppliers
Insightintotrendsandemergingopportunities
Businessmissionstoexplorenewopportunities
Networkingevents
ServiceswhichmatchAustralianbusinesseswithinternationalbusinesses
Educationalcoursesandworkshops
Accesstofinance
Bespokeconsultingservicestoassistwithplanning,marketingand
operations
Grants
Businessmentoring
46%
33%
33%
30%
29%
24%
32%
30%
41%
34%
Source: AIBS 2017 Question 3, Note: n=217
Fig. 3.31 Comments on international business experience
7% Positive sentiment 19% Negative sentiment42% Challenging 32% Neutral (general comment)
Source: AIBS 2017 Question 76 Note: n=43
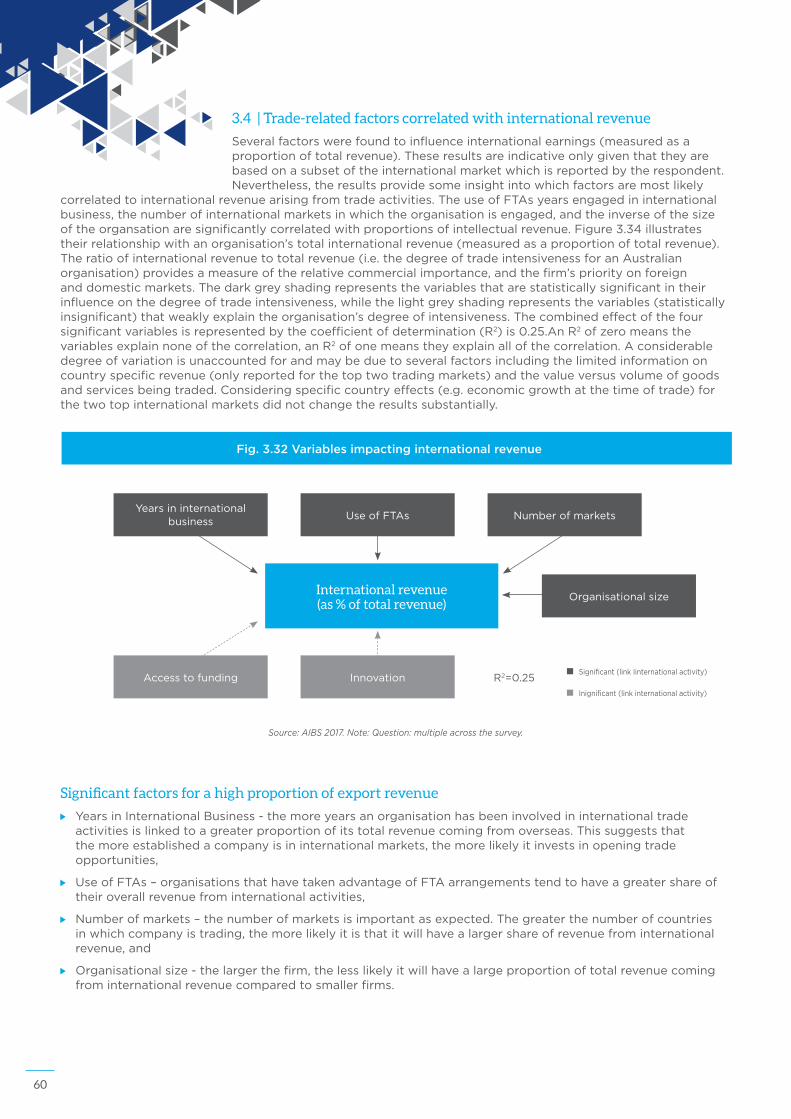
60
Fig. 3.32 Variables impacting international revenue
International revenue (as % of total revenue)
Organisationalsize
UseofFTAs NumberofmarketsYearsininternational
business
InnovationAccesstofunding R2=0.25Significant(linkIinternationalactivity)
Inignificant(linkinternationalactivity)
Source: AIBS 2017. Note: Question: multiple across the survey.
3.4 | Trade-related factors correlated with international revenue
Severalfactorswerefoundtoinfluenceinternationalearnings(measuredasaproportionoftotalrevenue).Theseresultsareindicativeonlygiventhattheyarebasedonasubsetoftheinternationalmarketwhichisreportedbytherespondent.Nevertheless,theresultsprovidesomeinsightintowhichfactorsaremostlikely
correlatedtointernationalrevenuearisingfromtradeactivities.TheuseofFTAsyearsengagedininternationalbusiness,thenumberofinternationalmarketsinwhichtheorganisationisengaged,andtheinverseofthesizeoftheorgansationaresignificantlycorrelatedwithproportionsofintellectualrevenue.Figure3.34illustratestheirrelationshipwithanorganisation’stotalinternationalrevenue(measuredasaproportionoftotalrevenue).Theratioofinternationalrevenuetototalrevenue(i.e.thedegreeoftradeintensivenessforanAustralianorganisation)providesameasureoftherelativecommercialimportance,andthefirm’spriorityonforeignanddomesticmarkets.Thedarkgreyshadingrepresentsthevariablesthatarestatisticallysignificantintheirinfluenceonthedegreeoftradeintensiveness,whilethelightgreyshadingrepresentsthevariables(statisticallyinsignificant)thatweaklyexplaintheorganisation’sdegreeofintensiveness.Thecombinedeffectofthefoursignificantvariablesisrepresentedbythecoefficientofdetermination(R2)is0.25.AnR2ofzeromeansthevariablesexplainnoneofthecorrelation,anR2ofonemeanstheyexplainallofthecorrelation.Aconsiderabledegreeofvariationisunaccountedforandmaybeduetoseveralfactorsincludingthelimitedinformationoncountryspecificrevenue(onlyreportedforthetoptwotradingmarkets)andthevalueversusvolumeofgoodsandservicesbeingtraded.Consideringspecificcountryeffects(e.g.economicgrowthatthetimeoftrade)forthetwotopinternationalmarketsdidnotchangetheresultssubstantially.
Significant factors for a high proportion of export revenue
YearsinInternationalBusiness-themoreyearsanorganisationhasbeeninvolvedininternationaltradeactivitiesislinkedtoagreaterproportionofitstotalrevenuecomingfromoverseas.Thissuggeststhatthemoreestablishedacompanyisininternationalmarkets,themorelikelyitinvestsinopeningtradeopportunities,
UseofFTAs–organisationsthathavetakenadvantageofFTAarrangementstendtohaveagreatershareoftheiroverallrevenuefrominternationalactivities,
Numberofmarkets–thenumberofmarketsisimportantasexpected.Thegreaterthenumberofcountriesinwhichcompanyistrading,themorelikelyitisthatitwillhavealargershareofrevenuefrominternationalrevenue,and
Organisationalsize-thelargerthefirm,thelesslikelyitwillhavealargeproportionoftotalrevenuecomingfrominternationalrevenuecomparedtosmallerfirms.
61
AIB
S 2017
Not statistically significant factors
Innovation–innovationsthatmayaffectthevolumeoftradewithinselectedorganisationssurveyeddidnotoccurinsufficientcriticalmasstohelpexplaintheorganisation’srevenuefrominternationalactivity.Itispossiblehoweverthatinvestmentinsupportinginnovationmayopennewmarketopportunitiesthatencourageandsupportnewinternationalbusinessactivity,maskingtheoveralleffectofinnovationssignificantinthelongerterm,and
Accesstofunding-inthismodel,accesstofunding(whethersuccessfulornot)isnotsignificant.
AustraliahasbeenactiveinnegotiatingFTAswithstrategiceconomicpartnersintheregionandthelargesteconomiesintheworld.ThesurveyindicatesthatmanyAustralianbusinessesareavailingthebenefitsoftheseFTAs,andincreasingtheirinternationalbusinessactivities.However,thefindingsalsosuggestthatAustralianbusinessescontinuetofacecertainbarriersintheirattemptstointernationalise.ThesemayincludethelackofmanagementawarenessabouthowtheFTAwouldbenefittheirorganisation,therestrictionsonmovementofindividualsacrossborders,mutualrecognitionofproductsandqualificationsandspecificaccesstofinanceissues.
ThesurveyfindingshighlightthattheAustralianGovernment’seffortstonegotiateFTAshavehadapositivecorrelationwiththeinternationalisationofAustralianfirms.Inthecurrentcircumstanceswherethereisuncertaintyabouttradepoliciesinmanycountries,negotiatingmultipleFTAsseemstobeaneffectivestrategy.ThisisparticularlytrueintheaftermathofBrexit,whereAustraliaisconsideringpotentialFTAswithUnitedKingdom(UK)andtheEuropeanUnion,andthewithdrawaloftheUSfromtheTrans-PacificPartnership(TPP)agreement.DiscussionsaboutfuturebilateralFTAswiththeGCC,IndiaandotherimportanteconomiesshouldbeapositivesignforAustralianbusinessintendingtoenterorextendtheircurrentmarketpresenceglobally.
However,barriersforthoseorganisationsnotoperatinginternationallyalsoexistandpreventfuturegrowthforinternationaltrade.Thesebarriersincludealackofleadsfornewfirmstoentermarkets,alackofconfidenceanduncertaintyonhowtobegininternationalbusinesstrade,despitetheincreasingshareofbornglobalfirms.
62
Innovation in Australia’s international business activity, and future outlook 4
63
AIB
S 2017
Innovative trade activity and export sales
49%introducedproductioninnovation-32%marketinginnovation-27%processinnovation
Otherinnovationspursued(10%)includetechnological,digitalandbusinessmodelinnovation
68%offirmsinnovatingstatedinnovationsveryimportantoressentialfordrivingexportsales
Youngercompaniesmorelikelytogenerateinternationalrevenuethroughintellectualproperty(IP)
GreaterintensityofIPactivityinlast10–15years
International operations - future outlook
Mostrespondentsoptimisticaboutthenexttwoyears
Top6industrysectorsindicatefinancialoutlookisbetter
Companiesformedbetween2010and2017aremorefinanciallyoptimistic
Majorityofrespondentsindicatedthattheircompanywasplanningtodobusinessinnewcountriesoverthenexttwoyears
What the survey says
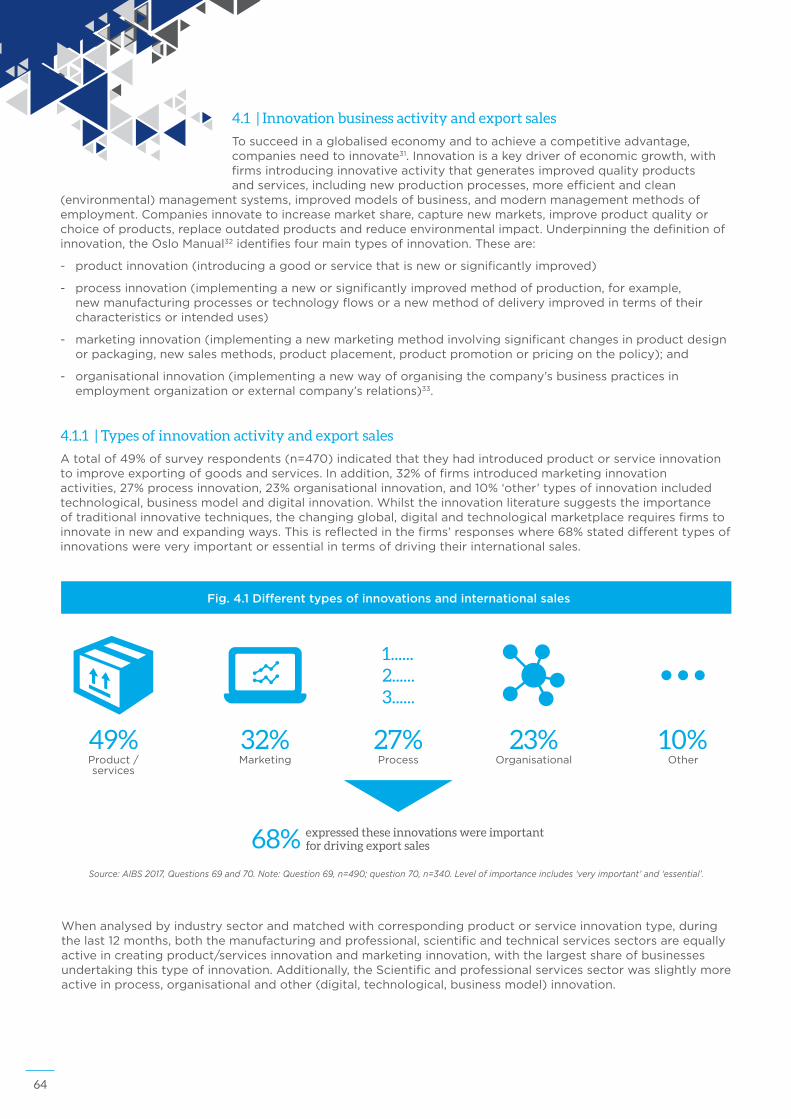
64
4.1 | Innovation business activity and export sales
Tosucceedinaglobalisedeconomyandtoachieveacompetitiveadvantage,companiesneedtoinnovate31.Innovationisakeydriverofeconomicgrowth,withfirmsintroducinginnovativeactivitythatgeneratesimprovedqualityproductsandservices,includingnewproductionprocesses,moreefficientandclean
(environmental)managementsystems,improvedmodelsofbusiness,andmodernmanagementmethodsofemployment.Companiesinnovatetoincreasemarketshare,capturenewmarkets,improveproductqualityorchoiceofproducts,replaceoutdatedproductsandreduceenvironmentalimpact.Underpinningthedefinitionofinnovation,theOsloManual32identifiesfourmaintypesofinnovation.Theseare:
- productinnovation(introducingagoodorservicethatisneworsignificantlyimproved)
- processinnovation(implementinganeworsignificantlyimprovedmethodofproduction,forexample,newmanufacturingprocessesortechnologyflowsoranewmethodofdeliveryimprovedintermsoftheircharacteristicsorintendeduses)
- marketinginnovation(implementinganewmarketingmethodinvolvingsignificantchangesinproductdesignorpackaging,newsalesmethods,productplacement,productpromotionorpricingonthepolicy);and
- organisationalinnovation(implementinganewwayoforganisingthecompany’sbusinesspracticesinemploymentorganizationorexternalcompany’srelations)33.
4.1.1 | Types of innovation activity and export sales
Atotalof49%ofsurveyrespondents(n=470)indicatedthattheyhadintroducedproductorserviceinnovationtoimproveexportingofgoodsandservices.Inaddition,32%offirmsintroducedmarketinginnovationactivities,27%processinnovation,23%organisationalinnovation,and10%‘other’typesofinnovationincludedtechnological,businessmodelanddigitalinnovation.Whilsttheinnovationliteraturesuggeststheimportanceoftraditionalinnovativetechniques,thechangingglobal,digitalandtechnologicalmarketplacerequiresfirmstoinnovateinnewandexpandingways.Thisisreflectedinthefirms’responseswhere68%stateddifferenttypesofinnovationswereveryimportantoressentialintermsofdrivingtheirinternationalsales.
Whenanalysedbyindustrysectorandmatchedwithcorrespondingproductorserviceinnovationtype,duringthelast12months,boththemanufacturingandprofessional,scientificandtechnicalservicessectorsareequallyactiveincreatingproduct/servicesinnovationandmarketinginnovation,withthelargestshareofbusinessesundertakingthistypeofinnovation.Additionally,theScientificandprofessionalservicessectorwasslightlymoreactiveinprocess,organisationalandother(digital,technological,businessmodel)innovation.
Fig. 4.1 Different types of innovations and international sales
49% Product/services
32% Marketing
27% Process
23% Organisational
10% Other
68% expressed these innovations were important for driving export sales
Source: AIBS 2017, Questions 69 and 70. Note: Question 69, n=490; question 70, n=340. Level of importance includes ‘very important’ and ‘essential’.
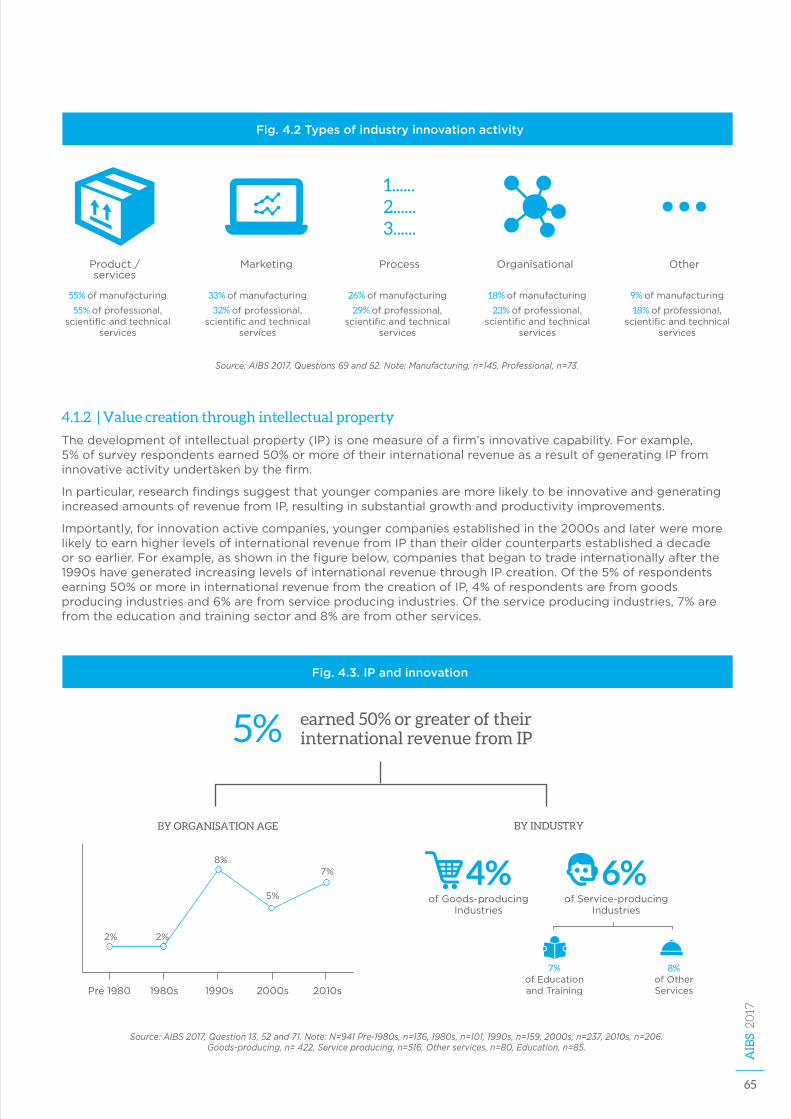
65
AIB
S 2017
4.1.2 | Value creation through intellectual property
Thedevelopmentofintellectualproperty(IP)isonemeasureofafirm’sinnovativecapability.Forexample,5%ofsurveyrespondentsearned50%ormoreoftheirinternationalrevenueasaresultofgeneratingIPfrominnovativeactivityundertakenbythefirm.
Inparticular,researchfindingssuggestthatyoungercompaniesaremorelikelytobeinnovativeandgeneratingincreasedamountsofrevenuefromIP,resultinginsubstantialgrowthandproductivityimprovements.
Importantly,forinnovationactivecompanies,youngercompaniesestablishedinthe2000sandlaterweremorelikelytoearnhigherlevelsofinternationalrevenuefromIPthantheiroldercounterpartsestablishedadecadeorsoearlier.Forexample,asshowninthefigurebelow,companiesthatbegantotradeinternationallyafterthe1990shavegeneratedincreasinglevelsofinternationalrevenuethroughIPcreation.Ofthe5%ofrespondentsearning50%ormoreininternationalrevenuefromthecreationofIP,4%ofrespondentsarefromgoodsproducingindustriesand6%arefromserviceproducingindustries.Oftheserviceproducingindustries,7%arefromtheeducationandtrainingsectorand8%arefromotherservices.
Fig. 4.3. IP and innovation
5% earned 50% or greater of their international revenue from IP
BY ORGANISATION AGE BY INDUSTRY
Pre1980 1980s 1990s 2000s 2010s
2% 2%
8%
5%
7% 4%ofGoods-producing
Industries
6%ofService-producing
Industries
7% ofEducationandTraining
8% ofOtherServices
Source: AIBS 2017, Question 13, 52 and 71. Note: N=941 Pre-1980s, n=136, 1980s, n=101, 1990s, n=159, 2000s, n=237, 2010s, n=206. Goods-producing, n= 422, Service producing, n=516, Other services, n=80, Education, n=85.
Source: AIBS 2017, Questions 69 and 52. Note: Manufacturing, n=145, Professional, n=73.
55% ofmanufacturing
55% ofprofessional,scientificandtechnical
services
33% ofmanufacturing
32% ofprofessional,scientificandtechnical
services
26% ofmanufacturing
29% ofprofessional,scientificandtechnical
services
Fig. 4.2 Types of industry innovation activity
Product/services
Marketing Process Organisational Other
18% ofmanufacturing
23% ofprofessional,scientificandtechnical
services
9% ofmanufacturing
18% ofprofessional,scientificandtechnical
services
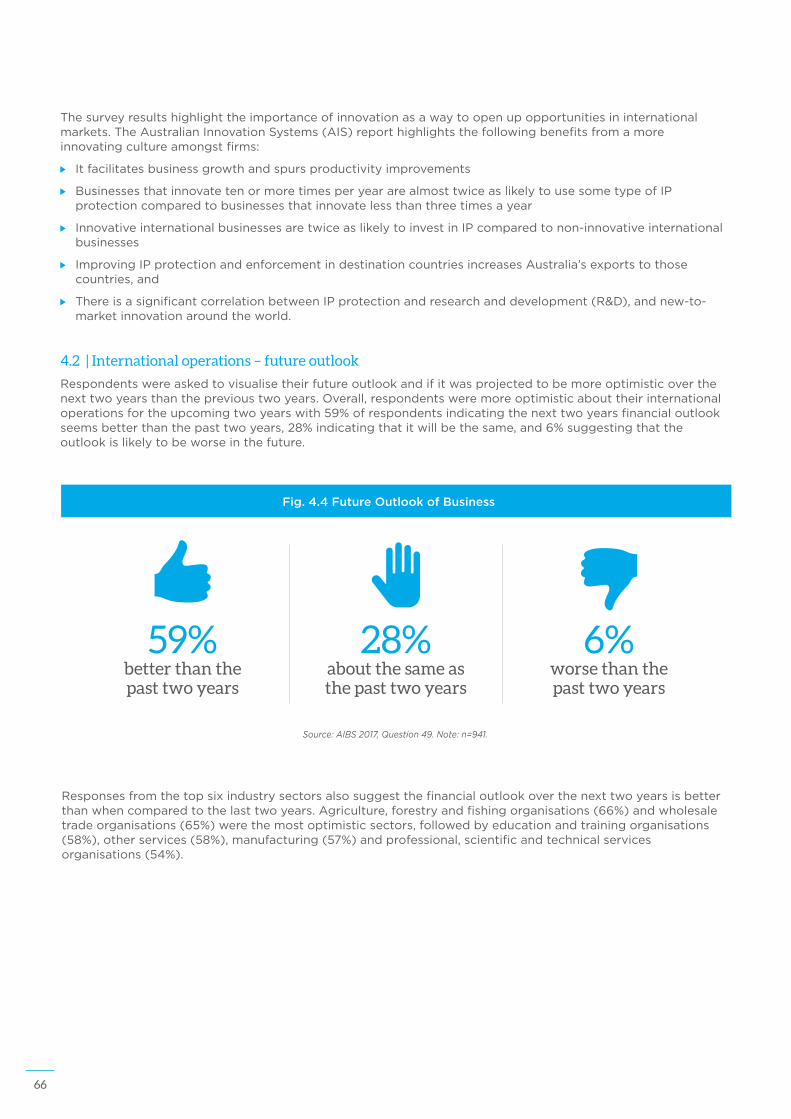
66
Thesurveyresultshighlighttheimportanceofinnovationasawaytoopenupopportunitiesininternationalmarkets.TheAustralianInnovationSystems(AIS)reporthighlightsthefollowingbenefitsfromamoreinnovatingcultureamongstfirms:
Itfacilitatesbusinessgrowthandspursproductivityimprovements
BusinessesthatinnovatetenormoretimesperyeararealmosttwiceaslikelytousesometypeofIPprotectioncomparedtobusinessesthatinnovatelessthanthreetimesayear
InnovativeinternationalbusinessesaretwiceaslikelytoinvestinIPcomparedtonon-innovativeinternationalbusinesses
ImprovingIPprotectionandenforcementindestinationcountriesincreasesAustralia’sexportstothosecountries,and
ThereisasignificantcorrelationbetweenIPprotectionandresearchanddevelopment(R&D),andnew-to-marketinnovationaroundtheworld.
4.2 | International operations – future outlook
Respondentswereaskedtovisualisetheirfutureoutlookandifitwasprojectedtobemoreoptimisticoverthenexttwoyearsthantheprevioustwoyears.Overall,respondentsweremoreoptimisticabouttheirinternationaloperationsfortheupcomingtwoyearswith59%ofrespondentsindicatingthenexttwoyearsfinancialoutlookseemsbetterthanthepasttwoyears,28%indicatingthatitwillbethesame,and6%suggestingthattheoutlookislikelytobeworseinthefuture.
Responsesfromthetopsixindustrysectorsalsosuggestthefinancialoutlookoverthenexttwoyearsisbetterthanwhencomparedtothelasttwoyears.Agriculture,forestryandfishingorganisations(66%)andwholesaletradeorganisations(65%)werethemostoptimisticsectors,followedbyeducationandtrainingorganisations(58%),otherservices(58%),manufacturing(57%)andprofessional,scientificandtechnicalservicesorganisations(54%).
Fig. 4.4 Future Outlook of Business
6%worse than the past two years
59%better than the past two years
28%about the same as the past two years
Source: AIBS 2017, Question 49. Note: n=941.
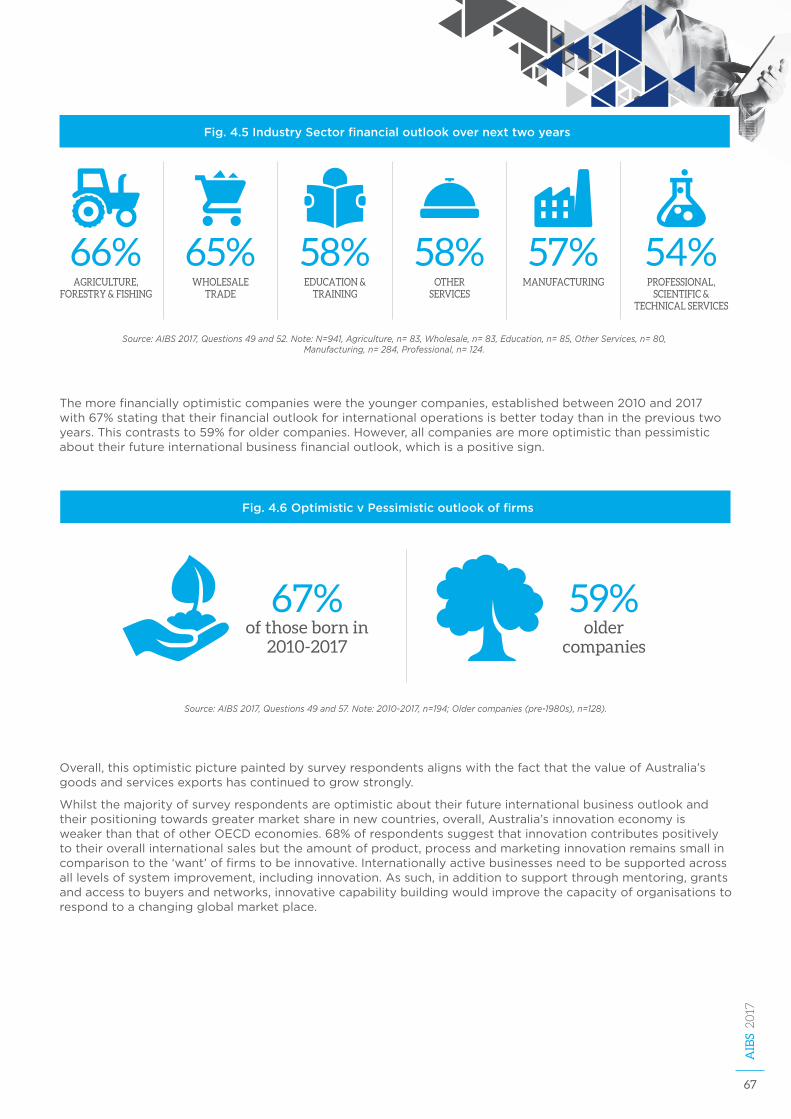
67
AIB
S 2017
Fig. 4.5 Industry Sector financial outlook over next two years
66%AGRICULTURE,
FORESTRY & FISHINGWHOLESALE
TRADE
65%EDUCATION &
TRAINING
58%OTHER
SERVICES
58%MANUFACTURING
57%PROFESSIONAL,
SCIENTIFIC & TECHNICAL SERVICES
54%
Source: AIBS 2017, Questions 49 and 52. Note: N=941, Agriculture, n= 83, Wholesale, n= 83, Education, n= 85, Other Services, n= 80, Manufacturing, n= 284, Professional, n= 124.
Themorefinanciallyoptimisticcompaniesweretheyoungercompanies,establishedbetween2010and2017with67%statingthattheirfinancialoutlookforinternationaloperationsisbettertodaythanintheprevioustwoyears.Thiscontraststo59%foroldercompanies.However,allcompaniesaremoreoptimisticthanpessimisticabouttheirfutureinternationalbusinessfinancialoutlook,whichisapositivesign.
Overall,thisoptimisticpicturepaintedbysurveyrespondentsalignswiththefactthatthevalueofAustralia’sgoodsandservicesexportshascontinuedtogrowstrongly.
Whilstthemajorityofsurveyrespondentsareoptimisticabouttheirfutureinternationalbusinessoutlookandtheirpositioningtowardsgreatermarketshareinnewcountries,overall,Australia’sinnovationeconomyisweakerthanthatofotherOECDeconomies.68%ofrespondentssuggestthatinnovationcontributespositivelytotheiroverallinternationalsalesbuttheamountofproduct,processandmarketinginnovationremainssmallincomparisontothe‘want’offirmstobeinnovative.Internationallyactivebusinessesneedtobesupportedacrossalllevelsofsystemimprovement,includinginnovation.Assuch,inadditiontosupportthroughmentoring,grantsandaccesstobuyersandnetworks,innovativecapabilitybuildingwouldimprovethecapacityoforganisationstorespondtoachangingglobalmarketplace.
Fig. 4.6 Optimistic v Pessimistic outlook of firms
67%of those born in
2010-2017
59%older
companies
Source: AIBS 2017, Questions 49 and 57. Note: 2010-2017, n=194; Older companies (pre-1980s), n=128).

68
AppendixA
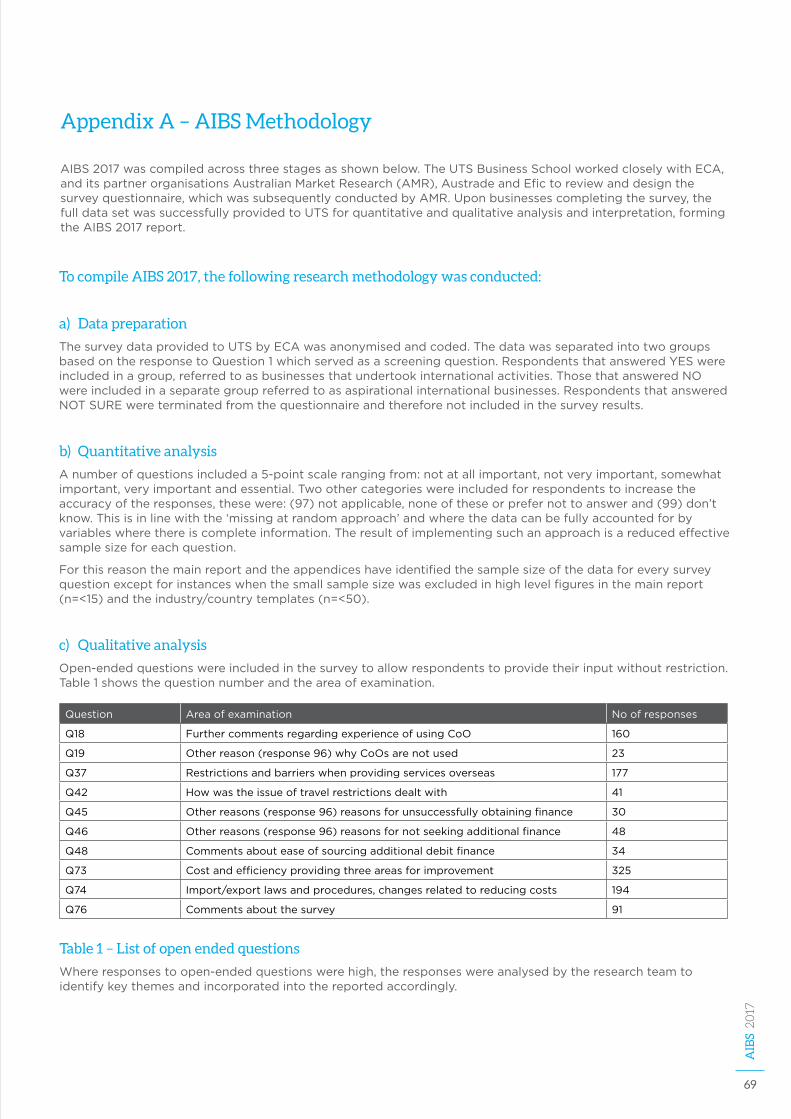
69
AIB
S 2017
Appendix A – AIBS Methodology
AIBS2017wascompiledacrossthreestagesasshownbelow.TheUTSBusinessSchoolworkedcloselywithECA,anditspartnerorganisationsAustralianMarketResearch(AMR),AustradeandEfictoreviewanddesignthesurveyquestionnaire,whichwassubsequentlyconductedbyAMR.Uponbusinessescompletingthesurvey,thefulldatasetwassuccessfullyprovidedtoUTSforquantitativeandqualitativeanalysisandinterpretation,formingtheAIBS2017report.
To compile AIBS 2017, the following research methodology was conducted:
a) Data preparation
ThesurveydataprovidedtoUTSbyECAwasanonymisedandcoded.ThedatawasseparatedintotwogroupsbasedontheresponsetoQuestion1whichservedasascreeningquestion.RespondentsthatansweredYESwereincludedinagroup,referredtoasbusinessesthatundertookinternationalactivities.ThosethatansweredNOwereincludedinaseparategroupreferredtoasaspirationalinternationalbusinesses.RespondentsthatansweredNOTSUREwereterminatedfromthequestionnaireandthereforenotincludedinthesurveyresults.
b) Quantitative analysis
Anumberofquestionsincludeda5-pointscalerangingfrom:notatallimportant,notveryimportant,somewhatimportant,veryimportantandessential.Twoothercategorieswereincludedforrespondentstoincreasetheaccuracyoftheresponses,thesewere:(97)notapplicable,noneoftheseorprefernottoanswerand(99)don’tknow.Thisisinlinewiththe‘missingatrandomapproach’andwherethedatacanbefullyaccountedforbyvariableswherethereiscompleteinformation.Theresultofimplementingsuchanapproachisareducedeffectivesamplesizeforeachquestion.
Forthisreasonthemainreportandtheappendiceshaveidentifiedthesamplesizeofthedataforeverysurveyquestionexceptforinstanceswhenthesmallsamplesizewasexcludedinhighlevelfiguresinthemainreport(n=<15)andtheindustry/countrytemplates(n=<50).
c) Qualitative analysis
Open-endedquestionswereincludedinthesurveytoallowrespondentstoprovidetheirinputwithoutrestriction.Table1showsthequestionnumberandtheareaofexamination.
Question Areaofexamination Noofresponses
Q18 FurthercommentsregardingexperienceofusingCoO 160
Q19 Otherreason(response96)whyCoOsarenotused 23
Q37 Restrictionsandbarrierswhenprovidingservicesoverseas 177
Q42 Howwastheissueoftravelrestrictionsdealtwith 41
Q45 Otherreasons(response96)reasonsforunsuccessfullyobtainingfinance 30
Q46 Otherreasons(response96)reasonsfornotseekingadditionalfinance 48
Q48 Commentsabouteaseofsourcingadditionaldebitfinance 34
Q73 Costandefficiencyprovidingthreeareasforimprovement 325
Q74 Import/exportlawsandprocedures,changesrelatedtoreducingcosts 194
Q76 Commentsaboutthesurvey 91
Table 1 – List of open ended questions
Whereresponsestoopen-endedquestionswerehigh,theresponseswereanalysedbytheresearchteamtoidentifykeythemesandincorporatedintothereportedaccordingly.
70
d) Grouping respondents and cross tabs analysis
Datawasgroupedtoenableeffectivecrosstabanalysis,providehigherlevelanalysisonthefactorsthatwereimportantornotimportant,grouptheyearscompaniesbeganearninginternationalrevenueintoprogressivematuritylevels,andtoaligntothemesfornotusingFTA-specificdocumentation.
e) Firm size
Insomeinstancesdatawasrecordedasgroupresponses.Forexample,firmsizewasdeterminedbynumbersofemployeesassmall,mediumandlargeusingtheAustralianBureauofStatisticsdefinitionofnumberofemployees:
Smallfirmsincluded0-4and5-19
Mediumfirmsincluded20-49,50-99and100-199
Largefirms200-499and500ormore
Don’tknowresponses
(Q55,Howmanyemployeesdoesyourcompanyhave?)
The‘Don’tknow’responseswereexcludedfromthecrosstabanalysiswhichincludedfirmsizeasavariable.
f) Importance
Importancequestionsgroupedas:essentialandveryimportanttoprovideanoverallimportancescore.Somewhatimportantandnotatallimportantandnotveryimportantweregroupedintoa‘notimportantgroup’.
g) Firm maturity
Respondentsprovidedinformationonwhatyeartheircompanybeganoperating.Primarily,companyagewasrecodedintothedecadetheybeganoperations(e.g.pre1980s,1980s,1990s,2000s,2010s).‘Oldercompanies’referstothosewhobeganoperatingpriorto1980.
Analysisalsolookedinto‘bornglobals’,whichwereclassifiedbythosewhostartedundertakinginternationalactivitywithintwoyearsofbeginningoperations.
h) Reasons for not using FTA-specific documentation
ThereasonsfornotprovidingFTA-specificdocumentationweregroupedintothefollowingcategories:
Lackofknowledge
- WedidnotknowtherewasanFTA
- WedidnotknowthatanFTAtariffpreferencemayexistinthatmarket
- WedidnotknowacertificatewasrequiredtoaccesstheFTAtariffpreference
- Don’tknow
Little/nobenefit
- OurproductwaseligibleforanFTAtariffpreference,butthepreferencewasnotcommerciallysignificant
Preferenceineligibility
- OurproductwasineligibleforaFTAtariffpreferencebecauseitdidnotmeettherulesoforigin
- TherewasnopreferentialtariffavailableundertherelevantFTA
NodocumentationwasrequiredtoaccesstheFTApreferenceforourproduct
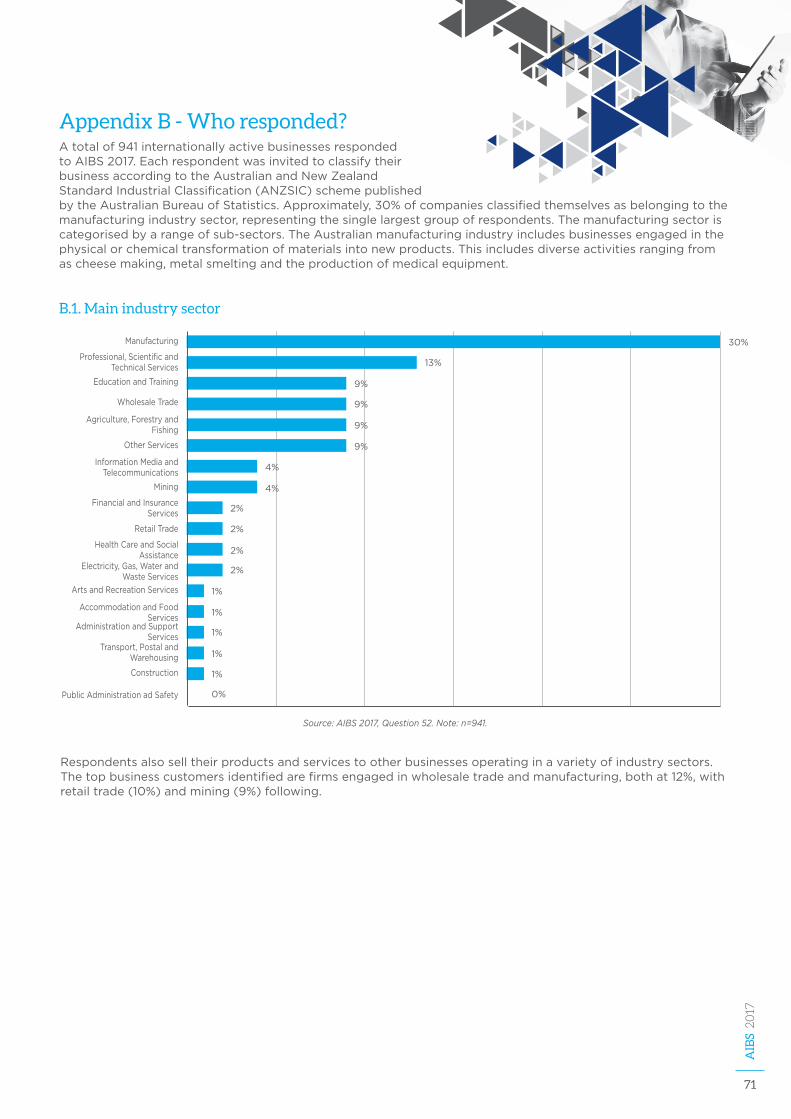
71
AIB
S 2017
Manufacturing
Professional,ScientificandTechnicalServices
EducationandTraining
WholesaleTrade
OtherServices
Agriculture,ForestryandFishing
InformationMediaandTelecommunications
RetailTrade
FinancialandInsuranceServices
HealthCareandSocialAssistance
Electricity,Gas,WaterandWasteServices
ArtsandRecreationServices
AccommodationandFoodServices
AdministrationandSupportServices
Transport,PostalandWarehousing
Construction
PublicAdministrationadSafety
Mining
30%
13%
9%
9%
9%
4%
4%
2%
2%
2%
2%
1%
1%
1%
1%
1%
0%
9%
Source: AIBS 2017, Question 52. Note: n=941.
Appendix B - Who responded?Atotalof941internationallyactivebusinessesrespondedtoAIBS2017.EachrespondentwasinvitedtoclassifytheirbusinessaccordingtotheAustralianandNewZealandStandardIndustrialClassification(ANZSIC)schemepublishedbytheAustralianBureauofStatistics.Approximately,30%ofcompaniesclassifiedthemselvesasbelongingtothemanufacturingindustrysector,representingthesinglelargestgroupofrespondents.Themanufacturingsectoriscategorisedbyarangeofsub-sectors.TheAustralianmanufacturingindustryincludesbusinessesengagedinthephysicalorchemicaltransformationofmaterialsintonewproducts.Thisincludesdiverseactivitiesrangingfromascheesemaking,metalsmeltingandtheproductionofmedicalequipment.
B.1. Main industry sector
Respondentsalsoselltheirproductsandservicestootherbusinessesoperatinginavarietyofindustrysectors.Thetopbusinesscustomersidentifiedarefirmsengagedinwholesaletradeandmanufacturing,bothat12%,withretailtrade(10%)andmining(9%)following.
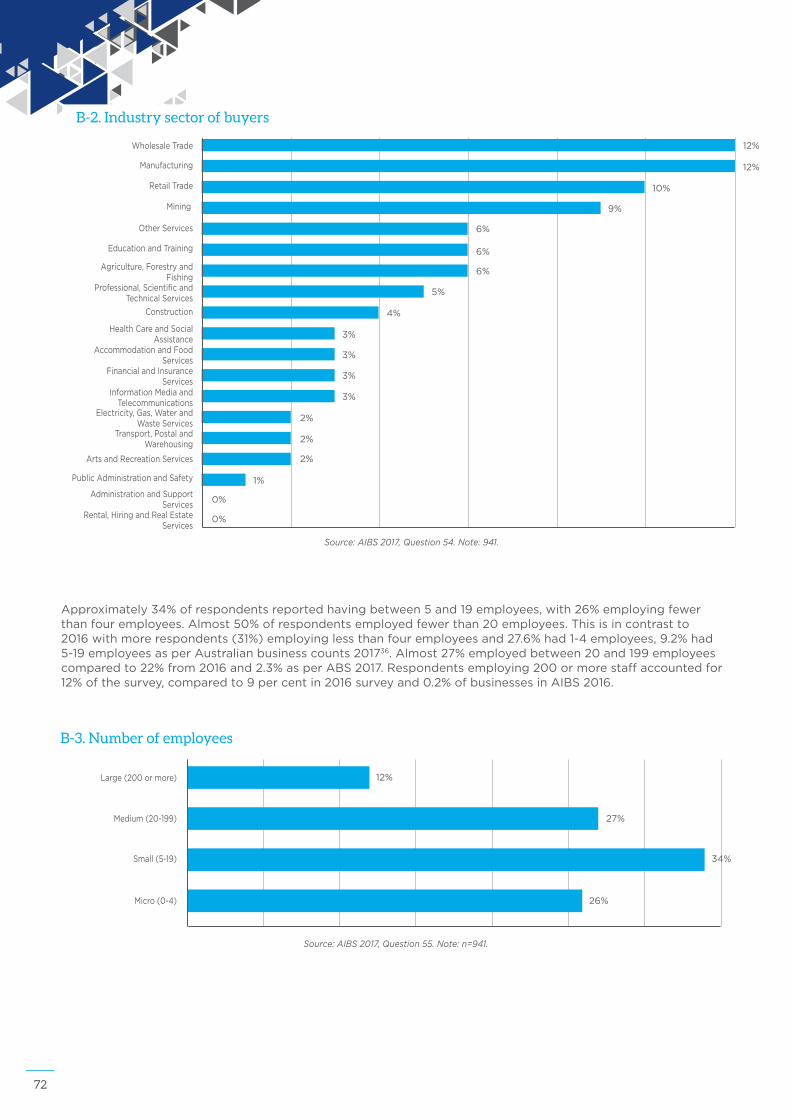
72
Approximately34%ofrespondentsreportedhavingbetween5and19employees,with26%employingfewerthanfouremployees.Almost50%ofrespondentsemployedfewerthan20employees.Thisisincontrastto2016withmorerespondents(31%)employinglessthanfouremployeesand27.6%had1-4employees,9.2%had5-19employeesasperAustralianbusinesscounts201736.Almost27%employedbetween20and199employeescomparedto22%from2016and2.3%asperABS2017.Respondentsemploying200ormorestaffaccountedfor12%ofthesurvey,comparedto9percentin2016surveyand0.2%ofbusinessesinAIBS2016.
0%
0%
1%
2%
2%
2%
3%
3%
3%
3%
4%
5%
6%
6%
6%
9%
10%
12%
12%
Manufacturing
Professional,ScientificandTechnicalServices
EducationandTraining
WholesaleTrade
OtherServices
Agriculture,ForestryandFishing
InformationMediaandTelecommunications
RetailTrade
FinancialandInsuranceServices
HealthCareandSocialAssistance
Electricity,Gas,WaterandWasteServices
ArtsandRecreationServices
AccommodationandFoodServices
AdministrationandSupportServices
Rental,HiringandRealEstateServices
Transport,PostalandWarehousing
Construction
PublicAdministrationandSafety
Mining
B-2. Industry sector of buyers
Source: AIBS 2017, Question 54. Note: 941.
Large(200ormore)
Medium(20-199)
Small(5-19)
Micro(0-4)
12%
27%
34%
26%
B-3. Number of employees
Source: AIBS 2017, Question 55. Note: n=941.
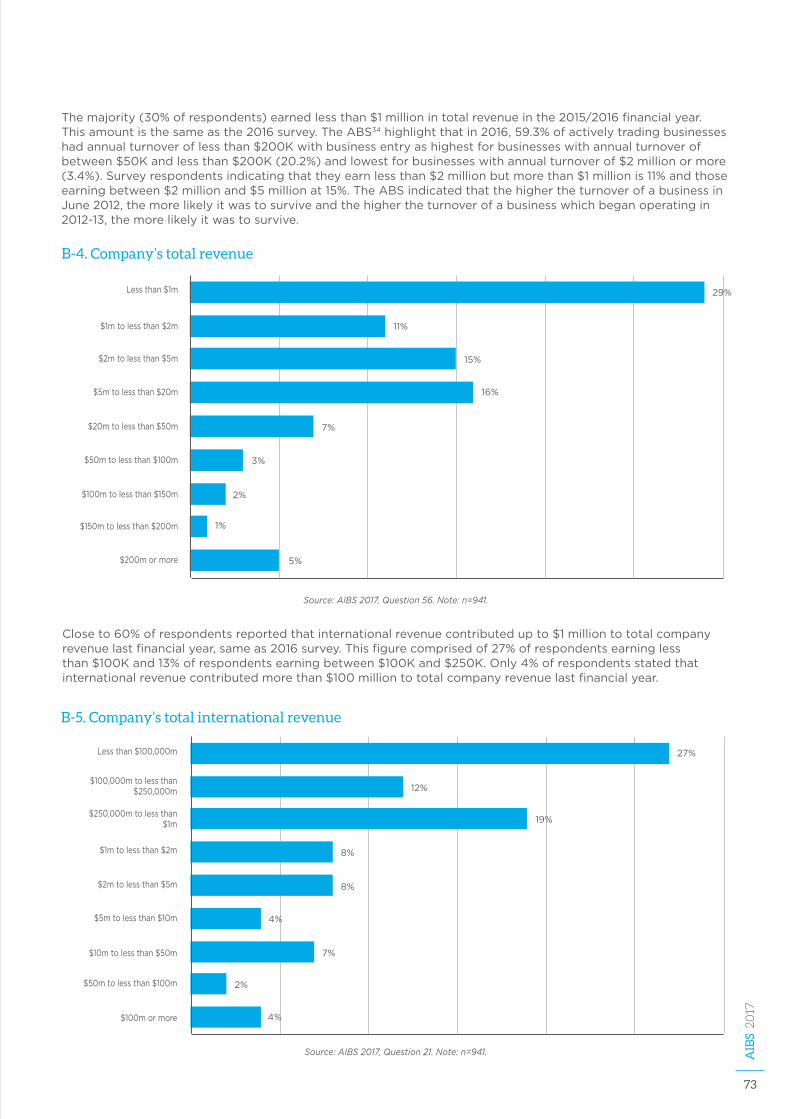
73
AIB
S 2017
Themajority(30%ofrespondents)earnedlessthan$1millionintotalrevenueinthe2015/2016financialyear.Thisamountisthesameasthe2016survey.TheABS34highlightthatin2016,59.3%ofactivelytradingbusinesseshadannualturnoveroflessthan$200Kwithbusinessentryashighestforbusinesseswithannualturnoverofbetween$50Kandlessthan$200K(20.2%)andlowestforbusinesseswithannualturnoverof$2millionormore(3.4%).Surveyrespondentsindicatingthattheyearnlessthan$2millionbutmorethan$1millionis11%andthoseearningbetween$2millionand$5millionat15%.TheABSindicatedthatthehighertheturnoverofabusinessinJune2012,themorelikelyitwastosurviveandthehighertheturnoverofabusinesswhichbeganoperatingin2012-13,themorelikelyitwastosurvive.
B-4. Company’s total revenue
Lessthan$1m
$1mtolessthan$2m
$2mtolessthan$5m
$5mtolessthan$20m
$20mtolessthan$50m
$50mtolessthan$100m
$100mtolessthan$150m
$150mtolessthan$200m
$200mormore
29%
11%
15%
16%
7%
3%
2%
1%
5%
Source: AIBS 2017, Question 56. Note: n=941.
Closeto60%ofrespondentsreportedthatinternationalrevenuecontributedupto$1milliontototalcompanyrevenuelastfinancialyear,sameas2016survey.Thisfigurecomprisedof27%ofrespondentsearninglessthan$100Kand13%ofrespondentsearningbetween$100Kand$250K.Only4%ofrespondentsstatedthatinternationalrevenuecontributedmorethan$100milliontototalcompanyrevenuelastfinancialyear.
B-5. Company’s total international revenue
27%
12%
19%
8%
8%
4%
7%
2%
4%
Lessthan$100,000m
$100,000mtolessthan$250,000m
$250,000mtolessthan$1m
$1mtolessthan$2m
$2mtolessthan$5m
$5mtolessthan$10m
$10mtolessthan$50m
$50mtolessthan$100m
$100mormore
Source: AIBS 2017, Question 21. Note: n=941.
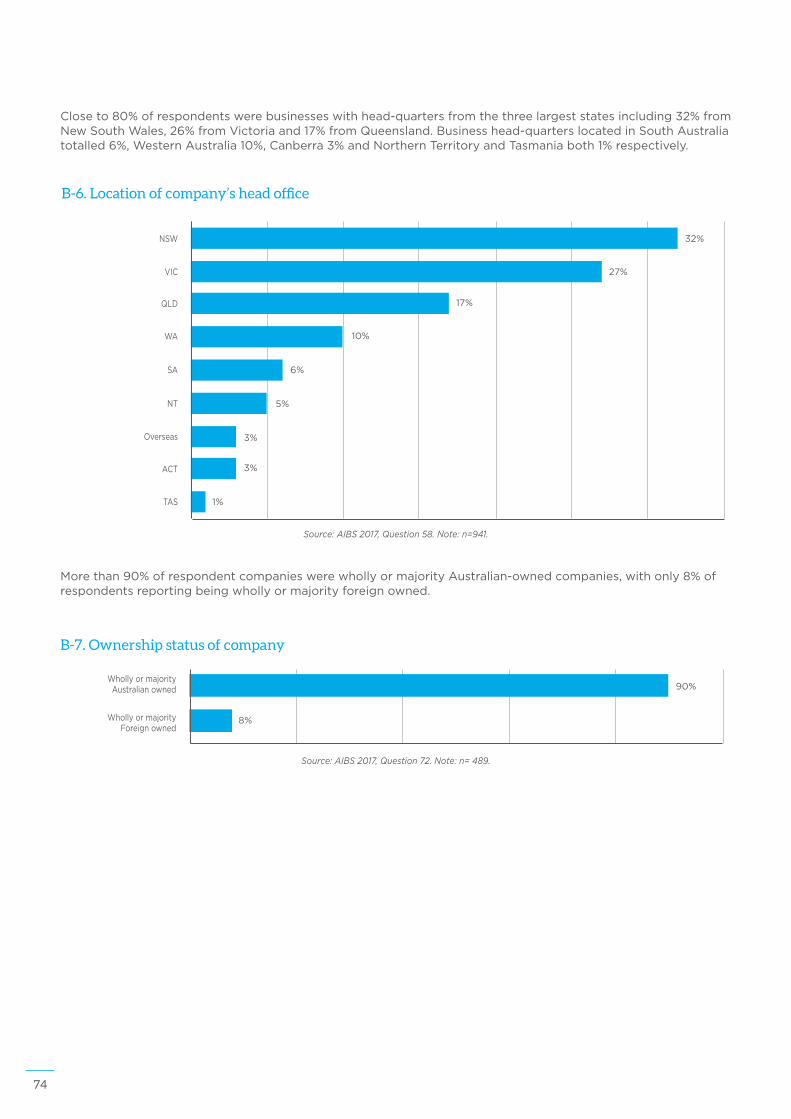
74
Morethan90%ofrespondentcompanieswerewhollyormajorityAustralian-ownedcompanies,withonly8%ofrespondentsreportingbeingwhollyormajorityforeignowned.
Closeto80%ofrespondentswerebusinesseswithhead-quartersfromthethreelargeststatesincluding32%fromNewSouthWales,26%fromVictoriaand17%fromQueensland.Businesshead-quarterslocatedinSouthAustraliatotalled6%,WesternAustralia10%,Canberra3%andNorthernTerritoryandTasmaniaboth1%respectively.
B-6. Location of company’s head office
32%
27%
17%
10%
6%
5%
3%
3%
1%
NSW
VIC
QLD
WA
SA
NT
Overseas
ACT
TAS
Source: AIBS 2017, Question 58. Note: n=941.
B-7. Ownership status of company
90%
8%
WhollyormajorityAustralianowned
WhollyormajorityForeignowned
Source: AIBS 2017, Question 72. Note: n= 489.

75
AIB
S 2017
Approximately,50%ofrespondingcompanieswereclassifiedassmall-mediumsized.Justunder50%ofthesefirmsarehighlyexperiencedandhavebeenoperatingformorethan20years.Only8%ofrespondentshavebeenoperatingfortwoyears,17%forsixyears,14%for12yearsand14%sincetheyear2000.
B-8. Company trading date
7%
15%
12%
13%
17%
11%
14%
2015-2017
2010-2014
2005-2009
2000-2004
1990-1999
1980-1989
1979orbefore
Source: AIBS 2017, Question 57. Note: n=941.

76
77
AIB
S 2017
Reference list
1 UniversityofSydney2016,Australia’sInternationalBusinessSurvey2016,ExportCouncilofAustralia,Austrade,ExportFinance&InsuranceCorporation,viewed1August2017<https://www.austrade.gov.au/news/economic-analysis/key-publications/australias-international-business-survey-2016>.
2 OfficeoftheChiefEconomist2016,AustralianIndustryReport,DepartmentofIndustryInnovationandScience,AustralianGovernment,viewed19May2017,<https://industry.gov.au/Office-of-the-Chief-Economist/Publications/Pages/Australian-Innovation-System.aspx>.
3 AustralianBureauofStatistics,CountsofAustralianBusiness,Cat.No.8165.0.2July2017,viewed1September2017,http://www.abs.gov.au/ausstats/[email protected]/mf/8165.0.
4 Ricks,DA,Toyne,BandMartinez,Z1990,‘Recentdevelopmentsininternationalmanagementresearch’,JournalofManagement,vol.16,no.2,pp.219-53.
5 Lopez,LE,Kundu,SKandCiravegna,L2009,‘Bornglobalorbornregional?EvidencefromanexploratorystudyintheCostaRicansoftwareindustry’,Journalofinternationalbusinessstudies,vol.40,no.7,pp.1228-38.
6 Cavusgil,STandKnight,G2015,‘Thebornglobalfirm:Anentrepreneurialandcapabilitiesperspectiveonearlyandrapidinternationalization’,Journalofinternationalbusinessstudies,vol.46,no.1,pp.3-16.
7 WorldTradeReport2016,WorldTradeOrganisations,viewed1August2017,https://www.wto.org/english/res_e/booksp_e/world_trade_report16_e.pdf.
8 Dunning,H1989,‘Thestudyofinternationalbusiness:Apleaforamoreinterdisciplinaryapproach’,Journalofinternationalbusinessstudies,pp.411-36.
9 Gattorna,J2016,Dynamicsupplychainalignment:anewbusinessmodelforpeakperformanceinenterprisesupplychainsacrossallgeographies,CRCPress.
10 Guidetoexporting,Austrade,viewed1August2017https://www.austrade.gov.au/Australian/Export/Guide-to-exporting/Agents-and-distributors
11 OtherinternationalactivitiesmayincludeundertakingR&Doverseas,manufacturingproductsoverseasthroughlicensingortemporaryemploymentofforeignstaffetc.
* Theoverarching‘93%undertakingexportingactivities’inFigure2.4havebeenincluded.However,thebreakdownofthefigureandwriteuparound‘importance’issplitintogoodsandservices–ratherthanthecombined93%-asQ6andQ7eachhaveafocus,goodsandservicesrespectively.
12 Organisationalsampletypesdifferwiththoseofthe2016survey,sodirectcomparisonswithAIBS2016cannotbedeemedasaccurate.
13 WorldTradeOrganizationandWorldBank(2017)I-TIP,viewed1September2017,http://i-tip.wto.org/services/default.aspx.
14 Partanen,J,Chetty,SKandRajala,A2014,‘InnovationTypesandNetworkRelationships’,EntrepreneurshipTheoryandPractice,vol.38,no.5,pp.1027-55.
15 http://www.abs.gov.au/AUSSTATS/[email protected]/Lookup/1301.0Chapter22012009%E2%80%9310
16 AustralianBusinessFoundation2007,Borntobeglobal,viewed4August2017,<https://www.nswbusinesschamber.com.au/NSWBCWebsite/media/Policy/Thinking%20Business%20Reports/Older%20Reports/Born-to-be-Global-A-closer-look-at-the-international-venturing-of-Australian-born-global-firms.pdf>.
17 DFAT(2017)Australia-NewZealandCloserEconomicTradeRelationsAgreement,viewed1September2017http://dfat.gov.au/trade/agreements/anzcerta/pages/australia-new-zealand-closer-economic-relations-trade-agreement.aspx.
18 Bellamy,CD2015,‘BarrierstoInternationalBusiness’,LibertUniversity.
19 Psychicdistancereferstothesharedculturalvalues,historyandlanguagebetweennations(JohansonandVahlne1977).
20 ExportCouncilofAustralia2015,InquiryintotheBusinessExperienceinUtilisingAustralia’sFreeTradeAgreements,viewed5September2017,http://www.export.org.au/publications/inquiry-into-the-business-experience-in-utilising-australia-s-free-trade-agreements>.
21 http://www.economist.com/topics/economist-intelligence-unit?page=1
22 https://www.acci.asn.au/resources/small-business-survey-june-2015
23 Pomfret,R,Kaufmann,UandFindlay,C2010,‘UseofFTAsinAustralia’,inREITIdiscussionpaperseries.10-E-042,REITITokyo.
24 https://www.integrationpoint.com/landingpage/coo-infographic.html#.WXWIBoSGPIU.
25 http://www.smh.com.au/business/aviation/qantas-warns-against-allowing-foreign-carriers-to-fly-domestic-routes-20170417-gvm61u.html.
26 www.customs.gov.sg/businesses/exporting-goods/certificatesoforigin.
27 https://www.austrade.gov.au/news/economic-analysis/australias-export-performance-in-2015-16.
28 Tradefactsheet,DFAT,viewed1August2017,http://dfat.gov.au/trade/resources/trade-at-a-glance/pages/top-goods-services.aspx.
29 DFAT(2017)ProfessionalServicesMutualRecognitionUnit,viewed1September2017,http://dfat.gov.au/trade/topics/Pages/professional-services-mutual-recognition-unit.aspx.
30 Mendoza,D.R.AndSugiyarto,G.(2017).TheLongRoadAhead:StatusReportontheImplementationoftheASEANMutualRecognitionArrangementsonProfessionalServices.AsianDevelopmentBank.
31 Potecea,VandCebuc,G2011,‘Theimportanceofinnovationininternationalbusiness’,TheUSVAnnalsofEconomicsandPublicAdministration,vol.10,no.3,pp.157-61.
32 OECD/Eurostat(2005),OsloManual:GuidelinesforCollectingandInterpretingInnovationData,3rdEdition,OECDPublishing,Paris,viewed1September2017.http://dx.doi.org/10.1787/9789264013100-en.
33 Silva,GM,Styles,CandLages,LF2017,‘Breakthroughinnovationininternationalbusiness:Theimpactoftech-innovationandmarket-innovationonperformance’,InternationalBusinessReview,vol.26,no.2,pp.391-404.
34 AustralianBureauofStatistics,CountsofAustralianBusiness,Cat.No.8165.0.2July2017http://www.abs.gov.au/ausstats/[email protected]/mf/8165.0
SURVEY PARTNERS
Acknowledgements
UTSwouldliketothankthefollowingfortheircontributions:TheteamattheExportCouncilofAustralia,Austrade,EficandAMRandthesurveyrespondentswhoprovidedtheirtimeandknowledgeinassistingtheresearchteamtocompileathoroughunderstandingintothecharacteristics
ofexistinginternationalbusinessactivitywithinAustralianbusinesses.
Disclaimer:ThisreportdoesnotnecessarilyreflecttheviewsofAIBSsurveypartners.