Embed Size (px)
Citation preview

AUSTRALIA’S IDENTIFIED MINERAL RESOURCES 1999
AGSO
A U S T R A L I A NGEOLOGICAL SURVEYO R G A N I S A T I O N

AUSTRALIA’S IDENTIFIED MINERAL RESOURCES 1999

Department of Industry, Science & Resources
Minister for Industry, Science & Resources: Senator the Hon. Nick Minchin
Parliamentary Secretary: The Hon. Warren Entsch, MP
Secretary: Russell Higgins
Australian Geological Survey Organisation
Executive Director: Neil Williams
© Commonwealth of Australia 1999
This work is copyright. Apart from any fair dealings for the purposes of study, research, criticism, or review, as
permitted under the Copyright Act 1968, no part may be reproduced by any process without written permission.
Copyright is the responsibility of the Executive Director, Australian Geological Survey Organisation. Requests
and enquiries should be directed to the Executive Director, Australian Geological Survey Organisation, GPO
Box 378, Canberra, ACT 2601.
ISSN 1327-1466
Australian Geological Survey Organisation (1999)
Australia’s identified mineral resources 1999.
Australian Geological Survey Organisation, Canberra.
AGSO has tried to make the information in this product as accurate as possible. However, it does not guarantee
that the information is totally accurate or complete. Therefore, you should not rely solely on this information
when making a commercial decision.
Cover photograph:
Processing plant to recover diamonds at Ashton-s Merlin project, Northern Territory
Photograph courtesy of Ashton Mining Limited
Cover page for ìContentsî
MIM’s Townsville copper refinery
Photograph courtesy of MIM Holdings Ltd
Design by Lindsay Davidson, Australian Geological Survey Organisation

3
Foreword
In late 1998, the Australian Geological Survey
Organisation (AGSO) was incorporated into the new
Department of Industry, Science & Resources. This
represented an amalgamation of the Department of
Industry, Science & Tourism with the Resources &
Energy functions of the former Department of
Primary Industries & Energy. It resulted in the
transfer of the Minerals & Energy and Petroleum
Resources Branches from the former Bureau of
Resource Sciences to AGSO. Before 1992, these
branches were part of AGSO’s predecessor — the
Bureau of Mineral Resources, Geology and
Geophysics.
AGSO’s geological survey and research roles in
minerals are now complemented by an important
resource assessment and scientific advice and
analysis role that supports informed decision-making
and policy development in relation to minerals and
metals issues, land use, energy, and sustainable
development.
To ensure that policy makers, the mining industry,
the investment sector and the general community are
well informed on Australia’s mineral endowment,
AGSO will continue to draw on data and
information from mineral exploration and mining
companies to:
• provide independent advice and analysis on
Australia’s inventory of identified mineral
resources, their rate of development, and the
level of exploration activity; and
• publish key statistics and developments in
‘Australia’s Identified Mineral Resources’.
The MINRES database supports AGSO’s resource
assessment work. MINRES contains information on
the locations of and resource tonnages, grades and
elements in around 3000 mineral deposits; a
commercially available version contains non-
confidential entries for over 1500 of these deposits.
MINRES is currently being redeveloped with the
aims of improving both the efficiency of maintaining
a high quality dataset and the ease of use of the
system. During 1998 MINRES was redeveloped as
an Internet-based system. During 1999, issues
associated with granting easier and wider public
access to MINRES will be addressed.
AGSO also underpins Government resource policy
and management decisions by appraising the mineral
resource potential of areas being considered for
restricted land use; advising on environmental issues
in relation to exploration, mining, rehabilitation, and
mineral processing; and providing advice on
offshore exploration and mining issues.
Neil Williams
Chief Executive Officer
Australian Geological Survey Organisation

ContentsForeword 3
List of plates 5
List of figures 5
List of tables 5
Summary 8
Introduction 9
Commodity reviews 7
Bauxite 12
Black coal 13
Brown coal 15
Copper 15
Diamond 17
Gold 18
Iron ore 20
Lithium 23
Magnesite 24
Manganese ore 26
Mineral sands 26
Nickel 28
Phosphate 29
Shale oil 30
Tantalum 31
Uranium 33
Vanadium 40
Zinc, lead, silver 41
Mineral industry performance & outlook 42
Mineral exploration in Australia 45
Exploration expenditure 46
Exploration drilling 48
Offshore mineral exploration in Commonwealth waters 51
References 52
Appendix 1
Abbreviations and acronyms 53
Appendix 2
National classification system for identified mineral resources 54
Appendix 3
Staff — Mineral Resources & Energy Program 59

PlatesPlate 1 Processing plant to recover diamonds at Ashton’s Merlin project, Northern Territory 1
Plate 2 MIM’s Townsville copper refinery 4
Plate 3 ANSIR;s ground vibrators 7
Plate 4 Roof bolting in preparation for long wall mining at Oaky Creek’s
second underground mine, Queensland 13
Plate 5 Copper anode casting wheel at MIM’s Mount Isa smelter operation 15
Plate 6 Open pits developed to access ore at the Merlin diamond project, Northern Territory 17
Plate 7 Entrance to the Jabiluka decline, Northern Territory 33
Plate 8 Ion exchange columns for in situ leach trials at the Beverley uranium project,
South Australia 36
Plate 9 Solvent extraction demonstration plant at the
Honeymoon uranium project, South Australia 38
Plate 10 Ore processing mill under construction at the
Century zinc-lead-silver mine,Queensland 42
Plate 11 Drilling and drill core with gold in quartz vein from Gympie, Queensland 45
TablesTable 1 Australia’s resources of major minerals and fuels, and world figures for 1998 13
Table 2 Comparison of resource classification schemes for uranium 33
Table 3 Uranium resources for Honeymoon and nearby deposits 38
Table 4 Australian production and exports of selected mineral products 1997-98 43
Table 5 Exploration expenditure and exploration drilling, 1997-98 48
Table 6 Methods of exploration drilling in Australia by type of area drilled, 1997-98 49
Table 7 Active offshore exploration licences in Commonwealth waters 51
FiguresFigure 1 Trends in economic demonstrated resources (EDR) for major commodities since 1975 13
Figure 2 Western Australian iron ore resources 1998 21
Figure 3 Uranium deposits and prospects in Australia 34
Figure 4 Jabiluka – diagrammatic longitudinal section looking north 35
Figure 5 Plan showing locations of ore lenses and palaeodrainage channel
(from Beverley EIS, Heathgate 1998) 39
Figure 6 Australian exploration expenditure since 1992-93 46
Figure 7 Australian exploration expenditure since 1969-70 expressed in 1997-98 dollars 47
Figure 8 Proportion of Australian exploration expenditure spent on drilling in each State,
1997-98 Vs 1996-97 48
Figure 9 Exploration metres drilled in each state from 1993-94 to 1997-98 49
Figure 10 Australian exploration drilling by drilling method and by type of exploration area
during 1997-98 50

Plate 3 Ground vibrators at work during a deep seismic reflection survey across the northeast margin of the Broken
Hill Block, as part of a study by the Australian Geological Survey Organisation and the NSW Department of Mineral
Resources of the resource potential of the Bancannia Trough and Koonenbury region. (Photo courtesy of the
Australian National Seismic Imaging Resource - ANSIR).

COMMODITIES REVIEW

8
Summary
In 1998, Australia’s economic demonstrated
resources (EDR) of cobalt, copper, magnesite, gold,
ilmenite, nickel, platinum group metals, tantalum
and vanadium increased while those of diamond,
iron ore, lead, manganese ore, lithium, silver,
uranium, tin and zinc diminished. The reductions in
EDR were due mainly to ongoing high levels of
production; commodity prices were a subsidiary
factor. EDR of all other commodities remained
essentially unchanged.
EDR of nickel and tantalum reached record levels in
1998. Gold increased slightly and maintained a
flattening-off trend in EDR that has been evident
since the mid-1990s. Black coal and bauxite EDR
remained around levels established in the late 1980s
and mid-1990s respectively. A decrease of almost
8% in iron ore EDR is attributable to production and
a comprehensive review of resources information
that became available during the year.
Australia continues to rank highly as one of the
world’s leading mineral resource nations. It has the
world’s largest EDR of lead, mineral sands
(ilmenite, rutile, and zircon), nickel, silver, tantalum,
uranium and zinc. In addition, its EDR is in the top
six worldwide for bauxite, black coal, brown coal,
copper, cobalt, gold, iron ore, lithium, manganese
ore, rare earth oxides, industrial diamond and
vanadium.
Mineral exploration expenditure decreased by 7%
from $1148.5 million in 1996–97 to $1066.8 million
in 1997–98. The biggest reductions were recorded in
Tasmania (20%), Queensland (17%), Victoria (17%)
and the Northern Territory (15%). Expenditure on
gold was down slightly from the previous period,
but still accounted for over 60% of total mineral
exploration expenditure. Total expenditure on
greenfields leases was 76%, which was slightly
higher than in 1996–97. The decline in Australia’s
aggregate minerals exploration expenditure is
expected to continue over the next two years, and
remain at relatively subdued levels over the period
to 2003–04.
Australia’s mineral resources sector continued to
underpin the standard of living of all Australians in
1998. As the nation’s largest export earner, the
minerals industry is vital to the well-being of the
economy. In addition to its nationally important
export performance, mining contributes significantly
to the regional economies and the social well-being
of communities in many parts of Australia.
In 1997–98 Australia’s mineral and energy exports
increased to a record of $41.2 billion, a rise of 13%
over the previous fiscal year, as a result of increased
production. The Australian Bureau of Agriculture
and Resource Economics (ABARE) forecast export
earnings to fall by just under 2% in 1998–99.

9
Introduction
This report presents the first annual assessment of
Australia’s identified mineral resources by the
Australian Geological Survey Organisation (AGSO).
It continues a series of national mineral resource
assessments that have been published by the
Australian Government since 1988.
The assessment is undertaken as input into
Government policy decisions relating to the
sustainable development of mineral resources. The
report examines trends in resources of all major and
some minor mineral commodities, and comments on
Australia’s world ranking as a resource nation. In
addition, it comments on exploration expenditure (in
current dollars) in 1997-98 and the previous five
fiscal years. The current level of expenditure is put
into perspective by comparing it in real terms to
expenditure over the preceding 28 years.
Estimates of Australia’s identified resources of all
major and several minor mineral commodities are
reported for 1998 (Table 1). The estimates are based
on published and unpublished data available to
AGSO up to the end of December 1998.
The Petroleum Resources Program of AGSO
provided data on petroleum resources. World data
have been obtained or calculated from data in
various sources, but mainly in publications of the
United States Geological Survey (USGS).
The mineral resource classification used in this
report reflects both the geological certainty of
existence of the mineral resource and the economic
feasibility of its extraction (see ‘National
classification system for identified mineral
resources’ at the end of this report). The
classification category, economic demonstrated
resources (EDR), is used instead of ‘reserves’ for
national totals of economic resources because the
term ‘reserve’ has specific meanings for individual
mineral deposits under the criteria of the Joint Ore
Reserves Committee (JORC) code used by industry
for reporting reserves and resources. EDR also
provide a basis for meaningful international
comparisons of the economic resources of other
nations. With few exceptions, ore is mined from
resources in the EDR category. EDR are therefore
depleted by mining and increased by new
discoveries, and by technical and economic changes
that can allow formerly subeconomic deposits to be
reclassified as economic.
AGSO has prepared estimates of Australia’s uranium
resources within categories defined by the OECD
Nuclear Energy Agency (OECD/NEA) and the
International Atomic Energy Agency (IAEA; OECD/
NEA & IAEA 1998). In this publication these
estimates are reported under the corresponding
resource categories of the national classification
scheme. A correlation of the national and OECD/
NEA schemes is given in the review of uranium
resources.
Long-term trends in EDR for bauxite, black coal,
iron ore, gold, copper, lead, zinc, nickel, and mineral
sands are shown in Figure 1. EDR for these
commodities have generally increased or at least
been maintained since 1975 despite substantial
levels of production. Much of the success in
maintaining EDR can be attributed to the sustained
exploration activity that Australia has enjoyed over
the period and to the highly prospective nature of
the continent.

Commodities review
1 0
Abbreviations: t=tonne; m3=cubic metre; L=litre; kt= 103t; Mc=106carat;
Mt=106t;Gt=109t;Gl=109L;na=not available.
(a) World mine production for 1998 are mostly USGS estimates.
(b) Excludes USA.
(c) Raw coal.
(d) Saleable coal.
(e) Source: Petroleum Resources Branch, AGSO( as at 31 December 1996).
(f) Source: ABARE
(g) Refer to text for comparison of resource categories in the national scheme with
those of the international scheme for classifying uranium resources.
(h) Compiled from most recent resources data published by OECD/NEA and IAEA.
(i) Excludes Morocco and Brazil.
(j) Platinum and palladium only.
(k) Includes cricidolite production.
(l) Based on AGSO,USGS and other sources.
(m) Source: Ux Weekly, 8 March 1999.
Table 1 Australia’s resources of major minerals and fuels, and world figures for 1998
COMMODITY UNITS AUSTRALIA WORLD
Demonstrated Inferred
Mine
ProductionUndifferent-
iated
Sub
eco-
nomic
Econo-
mic
Sub economic
Para-
marginal
Sub-
marginal
Economic
Economic
Demonstrated
Resources(1)
Mine
production(a)
Antimony kt Sb 88.7 9.2 61.4 10.8 14.8 25.7 1.8 2100 140
Asbestos
Chrystal Ore Mt — 46.24 — — — 75.18 — large
Crocidolite fibre Mt 3169 3793 1729 — — 2.12 — large 1.95(k)
Bauxite Mt 3169 3793 1729 — — 1598 44.7 25000 125(k)
Black coal
in situ Gt 70.9 0.7 5.6 — — very large
recoverable Gt 51.1 0.4 3.4 — — very large 0.285(c) 698(0) 3.9(d)(o)
Brown coal
in situ Gt 45.6 1.0 2.3 — — 184.4
recoverable Gt 41.1 0.9 2.1 — — 166.0 0.065 310(0) 0.9(o)
Cadmium kt Cd 112.6 9.5 25.5 24.4 1.5 — na 600 19.9
Chromium kt Cr —
Cobalt kt Co 676 46.5 194.6 — — 975.8 1.5 4,300 30.9
Copper Mt Cu 22.5 17.4 1.1 1.2 3 10.5 0.6 356 11.9
Diamond
gem & near gem Mc 68 203.3 0.1 1.4 33.8 1.1 40.8 — 53
industrial Mc 70.4 209.7 0.3 0.1 49.5 0.4 580 59
Flourine Mt F — 24.34 9.81 — — 2.14 — 107(i) 2.21
Gold t Au 4,404 1,202 124 — — 2,470 311 45,404 2,400
iron ore Gt 15.3 4.9 0.4 — — 11.4 0.153 140.0 1.02
Lead Mt Pb 17.2 4 10.7 5 15.2 0.8 0.62 66.0 3.1
Lithium kt Li 158 79 3 — — 7 na 3,400 16(b)
Magnesite Mt MgCO3 201.9 40 343.7 — — 325.3 0.36 8,600 11.5(b)
Manganese ore Mt 109.7 27.0 167.0 70 93.8 — 1.5 1952 22.1
Mineral sands
Ilmenite Mt 164.3 65.7 0.2 — — 103.7 2.4 632 6.7(b)
Rutile Mt 17.5 36.3 0.3 — — 31.5 0.24 44.87 0.48(b)
Zircon Mt 23.2 26.6 0.4 — — 25.5 0.40 64.6 0.81(b)
Molybdenum kt Mo — 6.3 3.2 — — 859.5 — 5,500 136
Nickel Mt Ni 9.0 1.8 2.8 — — 12.8 0.14 45.3 1.17
Niobium kt Nb 10 67.6 — — — 1,994 — 3,500 20.4
Petroleum (recoverable)(e)
Crude oil GL 240 — 30 — — — 21.1
Natural (sales) gas 109m3 1360 — 984 — — — 28.8
Condensate GL 193 — 54 — — — 7.7
LPG naturally occur GL 174 — 77 — — — 3.8
Phosphate rock Mt 88 981 — — — 3,739 12,000 141
PGM (Pt, Pd, Os, Ir, Ru, Rh) t metal 36.1 13.3 28.4 3.5 94.6 3.9 na 71,000 280(1)
Rare earths
REO & Y2O
3 Mt 1 3.5 10.7 — — 4.4 — 100 0.07
Shale oil GL — 461 3,345 — — 41,425 na na
Silver kt Ag 40.6 9.2 16.1 9.5 13.3 1.6 1.5 280 16.2
Tantalum kt Ta 18.0 5.9 0.17 — — 72.58 na 26.02 0.44
Tin kt Sn 100.9 19.1 182.2 — 298.0 73.4 10.2 7,700 216
Tungsten kt W 0.98 34.22 27.99 2.47 177.61 — — 2,000 33.5
Uranium(g) kt U 607 — 109 147 47 — 5.790(n) 2325(h) 33.9(m)
Vanadium kt V 190 1423 8425 700 2595 — — 10.000 35.0(b)
Zinc Mt Zn 34.0 10.5 18.1 10.1 10.1 0.7 1.06 190 7.8
}

Commodities review
1 1
Figure 1 Trends in economic demonstrated resources (EDR) for major commodities since 1975
0
10
20
30
40
50
60
19801975
Years
Black Coal
'00
0 m
illi
on
to
nn
es
1985 1990 1995
0
1000
500
1500
2500
3500
4000
4500
3000
2000
Years
Gold
to
nn
es
19801980 1990 1990 2000
0
5
10
15
20
25
30
35
45
50
Years
Copper, Lead, Zinc, Nickel
19801975 1985 1990 1995
Lead
Copper
Zinc
Nickel
Millio
n
ton
nes
2
0
4
6
8
10
12
14
1618
1975 1980 1985
Years
1990 1995
Bauxite, Iron Ore
'00
0 m
illi
on
to
nn
es
0
40
20
60
80
100
120
140
160
180
Mil
lio
n
ton
ne
s
Years
Mineral Sands
19801980 1990 1990 2000
IImenite
Rutile
Zircon

Bauxite
Commodities review
1 2
Commodity reviews
All mining operations and most of the mineral
deposits referred to in this section are shown in the
1998 edition of the 1 to 10 million-scale map of
‘Australian mining operations and significant
mineral deposits’, which is reproduced with this report.
Bauxite
When exports of bauxite, alumina, aluminium, and
semi-fabricated products are taken into account, the
aluminium industry is Australia’s second largest
merchandise exporter, accounting for exports valued
at around $6 billion in 1997–98. This is now second
only to coal.
The bauxite, alumina and/or aluminium sectors are
particularly important in terms of development and
employment in regions such as north Queensland,
southwest Western Australia, the Northern Territory,
north Tasmania, the Hunter Valley, and southwest
Victoria.
Resources
Vast resources of bauxite, located in the Weipa and
Gove regions adjacent to the Gulf of Carpentaria
and in the Darling Ranges south of Perth, underpin
the long-term future of Australia’s world-class
alumina and aluminium industries. Deposits in these
regions continue to rank among the world’s largest
identified resources in terms of extractable alumina
content. Bauxite deposits at Mitchell Plateau and
Cape Bougainville, in the north of Western Australia,
are uneconomic to develop, but represent a
significant, potentially viable future resource.
EDR remained unchanged in 1998, accounting for
just over 30% of identified resources. Demonstrated
subeconomic and inferred resources were also
unchanged from levels reported in 1997. Ongoing
exploration programs at and near to existing sites of
production were successful in upgrading resources
from inferred to demonstrated. Similarly, the
addition to inferred resources occurred at a rate
equal to or greater than the rate of production.
Exploration
Data relating to exploration for bauxite specifically
are not available nationally.
Production
In 1997–98 Australia produced 44.9 Mt of bauxite,
13.5 Mt of alumina, and 1.6 Mt of primary aluminium.
World ranking
Based on USGS and AGSO data, Australia’s
demonstrated bauxite resources of 8.7 Gt rank
second in the world behind Guinea and ahead of
Brazil, India, and Jamaica. Australia is the largest
producer and second largest exporter of bauxite, the
largest producer and exporter of alumina, and the
fifth largest producer and third largest exporter of
aluminium.
Industry developments
During 1998, Comalco completed a major upgrade
of plant at the Weipa bauxite mine. The upgrade
involved replacing the haulage truck fleet,
refurbishing the beneficiation plant and upgrading
the Andoom mine loadout station. Under the terms
of an agreement with Alcan, covering the Ely
bauxite resource, Comalco commenced an
exploration drilling program of this resource. The
results will enable Ely bauxite to be integrated
within Comalco’s long range mine plan.
Comalco continues to study the feasibility of a
greenfield refinery based on Weipa bauxite. Two
sites are being evaluated — one near Gladstone,
Queensland, and the other near Bintulu in Sarawak,
Malaysia.
Nabalco Pty Ltd, manager of the Gove bauxite/
alumina joint venture in the Northern Territory,
reported that the year ended 31 March the bauxite
mine produced a record 6.6 Mt.

Black coal
Commodities review
1 3
Alcoa’s Jarrahdale operation, the oldest bauxite
mine in Western Australia, closed at the end of 1998
as a consequence of dwindling reserves and
uneconomic haulage distances. Over its 35-year life,
Jarrahdale produced 168 Mt of bauxite.
Rehabilitation of the Jarradale mine site will be
completed over the next two years.
The Huntly and Willowdale mines continue to feed
Alcoa’s three refineries (Kwinana, Pinjarra, and
Wagerup) south of Perth. To maintain throughput at
Kwinana, Huntly has been developed into a 19-Mt-
a-year bauxite mine, the largest in the world. Both
Huntly and Willowdale have been equipped with
‘walking’ crusher units, which can walk small
distances over a number of days when trucking
distances become too great.
Black coal
The black coal mining industry employs over 20 000
people, mostly in Queensland and New South Wales,
and provides locally significant employment in
Western Australia, South Australia, and Tasmania.
By far the greatest use of black coal in Australia is
for electricity generation. Other uses include coke-
making for the iron and steel industry, and as a
source of heat in the manufacture of cement.
Resources
Australia has substantial resources of both
metallurgical and thermal coals with production for
export being based on coal deposits in Queensland
and New South Wales. In-situ EDR remained at 71
Gt in 1998. Queensland (50%) and New South
Wales (47%) dominate the in-situ EDR. Black coal
amenable to open-cut mining represents about 40%
of in-situ EDR. About 14 Gt, or 27% of the
recoverable EDR of 51 Gt, occurs at currently
operating coal mines.
Subeconomic resources of black coal remained
unchanged in 1998. Inferred resources are very large
but not quantified for Queensland and New South
Wales. An in-situ total of about 20 Gt occurs in
Western Australia and South Australia.
Exploration
Exploration expenditure on coal in 1997–98 totalled
$64.8 million, down from $70.5 million in 1996–97.
Expenditure in Queensland and New South Wales
was $32.6 million and $28.3 million respectively.
The level of expenditure continued at relatively high
levels, compared to the early 1990s, owing to the
Queensland and New South Wales governments
lifting restrictions on tendering for prospective areas,
and companies planning expansion of mine capacity.
Production
In 1998, Australia produced 285 Mt of raw coal
(271 Mt in 1997), which yielded 225 Mt of saleable
coal (217 Mt in 1997). Exports of black coal during
1998 were 83 Mt of metallurgical coal and 84 Mt of
steaming coal. In 1998, 71% of Australia’s raw coal
production came from open-cut mines.
Plate 4 Roof bolting in preparation for longwall mining
at Oaky Creek’s second underground mine, Queensland
Photograph courtesy of MIM Holdings Ltd

Commodities review
1 4
ABARE forecasts Australian thermal coal exports to
grow at an average annual rate of 3.5% over the next
five years, up from 85.5 Mt in 1998–99 to around
101 Mt in 2003–04. Metallurgical coal exports are
projected to grow at an average annual rate of 1.7%,
up from 84.9 Mt to 92 Mt over the same period.
World ranking
In 1998, Australia accounted for 7% of the world’s
recoverable EDR of black coal and ranked sixth
behind the USA (29%), the former USSR (20%),
China (13%), India (10%) and South Africa (8%).
Australia produced about 6% of the world’s saleable
black coal output in 1998 and was ranked fifth after
China (35%), USA (23%), India (8%) and the
former USSR (8%).
Industry developments
In New South Wales, open-cut mining of thermal
coal started at the Bengalla mine near
Muswellbrook, and development of a new longwall
operation commenced at Wambo. The Clarence
Colliery, near Lithgow, reopened as an underground
bord and pillar operation, and longwall mining
recommenced at the Ellalong Colliery, near
Cessnock. Approvals were granted for extensions to
the Cooranbong Colliery, near Lake Macquarie, and
the Lemington Mine, near Singleton.
Approvals being sought for extensions to existing
operations or new mines include: the Tahmoor North
underground longwall mine, which will extend
mining at Tahmoor for at least 20 years; the
proposed Donaldson (Maitland) and Kayuga
(Muswellbrook) open-cut thermal coal mines; and
the Mount Pleasant and Mount Arthur North
deposits, near Muswellbrook. The Mount Owen
mine is evaluating the potential to expand capacity
to 5 Mtpa, and the Saddlers Creek deposit is being
evaluated to extend the life of the Drayton open-cut.
Queensland’s newest mine is at Coppabella, near
Nebo, in the northern Bowen Basin. Coal from this
operation serves the pulverised coal injection
market. A longwall installed at Moranbah North,
also in the northern Bowen Basin, is scheduled to
reach its design capacity of over 3.5 Mtpa in 1999.
The Ensham open-cut and Newlands and Oaky
North longwall mines are all in an expansion phase.
Feasibility studies in progress include: the Kerlong
underground project, at Burton, which is examining
the possibility of hydraulic mining of coal to a depth
of 400m; and the Pisces thermal coal deposit, north
of Blackwater in the Bowen Basin. Other feasibility
studies involve the possible development of mine-
mouth power stations at the Wandoan, Millmerran,
Acland, and Kogan Creek thermal coal deposits, in
the Surat Basin.
In Western Australia, a 300-megawatt coal-fired
power station at Collie is under construction and is
scheduled to be commissioned in the first half of
1999.
Infrastructure developments include the new third
berth at the Koorangang Island Coal Loader
expansion project, in Newcastle. The expansion has
been completed, and is designed to boost the port’s
coal-exporting capacity by an additional 9 Mtpa to
75 Mtpa. In Queensland, the Surat Rail and Port
Infrastructure Development Project has identified
several rail-link options for the transport of coal
from mines in the Surat Basin. They include a rail
connection to the port of Gladstone or a new coal-
export terminal at Coonarr, south of Bundaberg,
with a rail line to Chincilla.
Technological developments and new approaches to
mining include Australia’s first contract punch
longwall mining development at the Alliance
Colliery (Oaky Creek). This mine is using
conventional equipment to mine longwall coal from
blocks developed directly from an open-cut final
highwall. At the Norwich Park open-cut, in central
Queensland, cast-blasting followed by dozing has
been introduced to optimise coal uncovering and
minimise rehandling. This approach is replacing
some of the draglines as the major stripping method
for a 12–15-m parting.

Copper
Brown coal
Commodities review
1 5
Brown coal
Brown coal occurs in Victoria, South Australia,
Western Australia and Tasmania. It is only mined in
Victoria, however, where extensive resources are
utilised mainly for electricity generation.
Resources
Australia’s in-situ EDR (46 Gt) and inferred
resources (184 Gt) remained unchanged in 1998.
Victoria accounted for 94% of Australia’s in-situ
EDR, most of which is located in the La Trobe
Valley.
Production
In 1998, Australian brown coal production was
about 65 Mt, up from 61 MT in 1997. Australia
produced over 7% of the world’s brown coal in
1998, and was the fourth largest producer after
Germany (21%), USA (17%), and former USSR
(10%).
World ranking
Australia has about 14% of the world’s recoverable
brown coal EDR, and was ranked third behind the
former USSR (32%) and Germany (14%).
Industry developments
Planning by Yallourn Energy Pty Ltd to develop a
brown coal mine at Maryvale by 2004 to replace the
depleted Township Field mine continues. At Loy
Yang advance long-term planning aims to extend the
mine from 2028 to 2048. Details of these projects
were presented in BRS (1998).
Copper
Some of Australia’s earliest major mines were based
on rich secondary copper ores. Mines like Burra,
Kapunda, Moonta, and Wallaroo, in South Australia,
were major producers during the mid- and late
1800s. Australia has become a world-class copper-
producing nation again over the past decade, with
the discovery of major new resources. At the end of
1998, there were 15 copper mines in Australia —
five in New South Wales, nine in Queensland, two in
Western Australia and one each in Tasmania, South
Australia, and the Northern Territory.
Resources
In 1998, EDR increased by 5% to 22.5 Mt.
Reassessments of resources at several major
deposits, particularly the Northparkes copper–gold
mine and at Tritton near Girilambone (both in
central NSW), more than compensated for
production. However, total identified resources of
copper decreased by 1.3 Mt or around 2%.
Exploration expenditure
Exploration expenditure for copper is not recorded
separately but is aggregated with expenditure for
base metals (made up copper–lead–zinc plus silver,
nickel, and cobalt). During 1997–98, expenditure on
base metals went against the overall downward
trend, increasing by $20 million (10%). Base metals
Plate 5 Copper anode casting wheel at MIM’s Mount Isa smelter
operation Photograph courtesy of MIM Holdings Ltd

Commodities review
1 6
accounted for 21% of the total exploration
expenditure, amounting to $227 million. However,
in the six months to December 1998, base metal
exploration expenditure decreased in both the
September and December quarters.
Production
In 1998, Australia’s mine production was 604 000 t
of contained copper, 11% higher than in 1997.
Production was boosted by the start-up of the
Reward open-pit, near Charters Towers (central
Queensland), in July and Cadia, near Orange
(central New South Wales), in August, and also by
increased output from the Mount Gordon operations
(formerly Gunpowder) and the Ernest Henry mine
(both in north Queensland), and Nifty, in the east
Pilbara (Western Australia).
Exports of copper, amounting to about 490 000 t of
contained metal, contributed a little over $1.3 billion
to the Australian economy in calendar 1998, and
represent about 3% of all export earnings from
minerals.
World ranking
Australia has the world’s third largest EDR of
copper (6%), after Chile (25%) and USA (16%). As
a copper producer, Australia ranks fifth in the world
after Chile, USA, Indonesia, and Canada.
Industry developments
At Mount Isa, expansion and upgrade of the Mount
Isa copper smelter to more than 250 000 t per year
was near completion at the end of the year. This will
accommodate mine production from MIM’s 51%-
owned Ernest Henry mine as well as production
from Mount Isa. The development of the 1800-m-
deep Enterprise operation at Mount Isa was more
than 50% complete at the end of the year. Enterprise
will provide continuity of sources of ore grading
about 4% copper for ten years, and the development
should be fully operational by early calendar 2000.
By the end of August 1998, the Ernest Henry
copper–gold mine had completed its first 12 months
of operation; commercial production was declared in
May 1998, following its commissioning phase.
Ernest Henry will produce about 95 000 t of copper
per annum at full capacity.
In October 1998, Western Metals Limited completed
a takeover of Aberfoyle Limited, and acquired that
company’s business interests, including the Mount
Gordon copper project (formerly known as
Gunpowder), in northwest Queensland. Western
Metals announced the discovery of the new
Mammoth No. 2 lens, which has an inferred
resource of 1.1 Mt of chalcocite ore grading 5.8%
copper. The combined measured, indicated, and
inferred resources of the Mount Gordon district were
put at 15.4 Mt at a grade of 4.9% copper as at the
end of December 1998. Production increased
strongly in the December quarter; output was made
up of 10 000 t of direct shipping chalcocitic ore
grading 30.1% copper, and a further 100 500 t of ore
grading 10.8% copper. About 4250 t of copper
cathode was produced at the electro-winning plant.
At the Reward open-pit mine near Charters Towers,
mining of 0.45 Mt supergene- enriched copper ore
averaging 10.8% copper commenced in mid-July,
and treatment and production of copper concentrates
began at the nearby Thalanga mill a few days later.
Production at year end was running at around 5000 t
of contained copper per month, and mining of this
ore is expected to be completed by May 1999.
When completed in early 1999, the $1.94 billion
Olympic Dam (South Australia) expansion project
of WMC Limited will triple annual production
capacity to over 9 Mt of ore, which will yield
200 000 t of copper to be refined at the Olympic
Dam plant. These production levels should be
achieved by late 1999.
In Western Australia, Straits Resources Limited
completed the acquisition of Nifty Copper
operations from WMC Resources Limited in
November 1998. Overall, reassessment of the
resource inventory by Straits resulted in an increase
in inferred resources of about half a million tonnes
of contained copper. Leachable copper resources at
Nifty in the measured, indicated, and inferred
categories aggregated 20.5 Mt grading 1.43%

Diamonds
Commodities review
1 2
copper, while measured, indicated, and inferred
resources of primary sulphide ore totalled 73.5Mt at
1.75% copper, for a combined grand total resource
of about 94 Mt at an average grade of 1.68% copper.
In October, Normandy Mining Limited reported that
reserves and resources at the Gecko mine, near
Tennant Creek (Northern Territory), were expected
to be depleted in late 1998.
In early December 1998, the directors of the Mount
Lyell Mining Company Limited announced that they
had appointed an Administrator of its affairs and
those of its wholly owned subsidiary Copper Mines
of Tasmania Pty Ltd. An announcement to the
Australian Stock Exchange on 11 December by
Macmahon Holdings Limited stated that the mining
contract for the underground mining of copper at
Mount Lyell was due to expire on 31 January 1999,
and that Macmahon Holdings had been asked by the
Administrator to continue for the time being under
its current mining contract.
respectively. Production and delineation of
additional resources at Argyle in Western Australia
accounted for most of these changes.
Exploration
Data relating to exploration for diamond specifically
are not available nationally.
World resources and production
Australia’s EDR are the world’s third largest for
industrial diamond, after the Republic of Congo and
Botswana. Detailed data are not available on world
resources of gem/near gem diamond, but Australia
has one of the largest stocks for this category.
Australia’s diamond production is the largest in the
world for both gem/near gem and natural industrial
diamond categories. Production, mostly from the
Argyle open-pit, is bolstered by a minor contribution
from the nearby Argyle alluvials operation. Copeton
(NSW) also recorded minor production.
Industry developments
The Argyle mine AK1 Stage One open-pit
expansion, in northwestern Western Australia,
commenced in late 1998, and further pit expansions
are planned. A new deep drilling program is
scheduled for 1999, and studies are continuing on
sublevel underground mining, which may be
implemented late in the next decade. Alluvial
diamond production at Argyle is scheduled to wind
down toward the end of 1999, although additional
alluvial sources are being investigated.
Mining operations at the Merlin project in the
Northern Territory started in November 1998 and
the first diamond concentrate was produced at the
end of January 1999. Of the 3306 c of diamond
produced, a large selection of the stones is greater
than one carat, including a 14.76-c white gem-
quality stone. Pits have been developed on the
southern cluster of pipes including Sacramore,
Launfal, Palomides and Excalibur. Processing of 1.5
Mt of ore over 2.5 years from seven of the 12 Merlin
pipes will facilitate decisions on increasing the
processing plant size, underground mining, and
viability of mining other Merlin pipes.
1 7
Plate 6 Open pits developed to access ore at
the Merlin diamond project, Northern Territory
Photograph courtesy of Ashton Mining Limited
Diamond
Resources
In 1998, EDR decreased by 2.3 Mc (3%) to 68 Mc
for gem/near gem diamond and 1.2 Mc (2%) to 70.4
Mc for industrial diamond compared with 1997.
However, total identified resources for gem/near
gem and industrial diamond increased by 2 Mc (1%)
to 307.7 Mc and by 4.3 Mc (1%) to 330.4 Mc

Gold
Commodities review
1 8
Gold
Resources
Australia’s gold resources are mined in all States
and the Northern Territory. In 1998, resources
increased in all categories except demonstrated
submarginal, which remained unchanged. The
increases, however, were modest with total resources
increasing by 164 tonnes (2%). Maintaining gold
resources at such levels in the future may be
thwarted by falling exploration expenditure.
Australia’s EDR of gold rose by 52 t (1%) to 4404 t
in 1998. Despite the increase, EDR remained below
the record level of 4454 t established in 1996. EDR
is a combination of resources from the JORC Code
reserves categories and those resources from the
JORC measured and indicated resources categories
assessed by AGSO as being economic. In 1998, 62%
(2709 t) of EDR was derived from the JORC Code
reserves categories. This compares with almost 58%
in 1996.
Western Australia increased its dominance to 58% of
Australia’s total EDR (up from 55% in the previous
year — an increase of 147 t to 2547 t). South
Australia maintained its position as the State with
the second largest EDR, but it remained almost
unchanged in 1998. New South Wales further
consolidated its standing as the third largest EDR;
its increase of 79 t to 461 t represented a growth of
17%. Despite a 10% reduction in its stock of EDR,
Queensland surpassed the Northern Territory as
holder of the fourth largest EDR stock, and in 1998
held 243 t (268 t in 1997). EDR in the Northern
Territory fell to 161 t, mainly as a result of the
reclassification of Mount Todd resources into a
lower category. Developments since the end of 1998
have raised expectations that mining may be
resumed at this site. Victoria’s EDR was unchanged
at 72 t, and that for Tasmania fell by 34% to 50 t.
Subeconomic demonstrated resources remained at
16% of total identified resources. They totalled 1326
t in 1998; 1308 t in 1997. Of the 1998 total, 1202 t
was in the paramarginal category and 124 t in the
submarginal category.
As in 1997, paramarginal resources were dominated
by Western Australia (813 t). Small increases (less
than 10 t) were recorded in the Northern Territory,
South Australia, Tasmania, Victoria, and New South
Wales. In Queensland, paramarginal resources fell
by 4 t.
Submarginal resources were unchanged in total at
124 t in 1998. Increases totalling 5 t in Queensland,
New South Wales, and Victoria were evenly
balanced by reductions totalling 5 t in Western
Australia and the Northern Territory. South Australia
and Tasmania remained unchanged.
Overall, Australia’s inferred resources rose by 94 t
(4%) to 2470 t in 1998. Increases in Western
Australia, South Australia, and Tasmania were
offset by reductions in New South Wales, Victoria,
and the Northern Territory. The growth in Western
Australia resulted from many minor variations and
significant resources at new deposits such as
Wallaby and Just in Case. In New South Wales,
the reduction was due mainly to the
reclassification of resources from the inferred to
the demonstrated category (e.g., at the Ridgeway
deposit, Cadia).
Exploration expenditure
According to four quarterly figures published by
ABS, Australia’s total mineral exploration
expenditure in 1998 was $958.5 million. Of this,
$561.8million (58.6%) was attributed to the search
for gold. Expenditure on gold exploration was down
by $174.8 million compared with 1997, and also
held a smaller share of the overall exploration
expenditure at 58.6% compared with the 1997
level of 63%.
Western Australia dominated gold exploration
expenditure by contributing almost $410 million
(73% of the Australian total). Expenditure in the
other States was: Northern Territory, $39.7
million (7.1%); Queensland, $36.3 million
(6.5%); Victoria, $29.9 million (5.3%); New
South Wales, $24.2 million (4.3%); South
Australia, $17.9 million (3.2%); and Tasmania,
$3.9 million (0.7%).

Commodities review
1 9
Production
Preliminary production data from ABARE show
Australian gold output to be unchanged in 1998 at
312 t. Western Australia remained the dominant
producer with an output of some 234 t (75% of total
production), slightly lower than in 1997. Ranking of
the other States and the Northern Territory remained
unchanged in 1998. Queensland was the second largest
producer with an estimated 32 t, followed by the
Northern Territory (20 t), New South Wales (15 t),
Victoria (5 t), Tasmania (4 t), and South Australia (1 t).
Production in New South Wales rose by about 30%
due mainly to the Cadia project coming on stream
during the year and producing in excess of 100 000
ounces. About 5% of Australia’s gold production
came from operations at which gold was not the
primary commodity recovered.
ABARE has forecast that gold production will be
308 t for the 1998–99 financial year, 313 t in 1999–
2000, and after a steady reduction, 294 t in 2003–
2004.
World ranking
World resources and production rankings remained
unchanged in 1998. South Africa, the USA, and
Australia occupied the first three positions in both
EDR and production.
According to AGSO and USGS data, world EDR of
gold in 1998 was 45 404 t. Australia had the third
largest EDR with 10%. South Africa was ranked
first with 41% followed by the USA with 12%. Both
the share of resources and rankings of these
countries remained unchanged from 1997. Russia
had the fourth largest EDR with 7%.
USGS estimate of world gold production in 1998
was 2400 t. South Africa remained the world’s
leading producer with an output estimated by the
USGS at 465 t (19.4% of the world total compared
with 21.2% in 1997). The USA retained its ranking
as the world’s second largest producer with 350 t
(14.6% of the total) and Australia was again ranked
third with 312 t (13% of the total). Canada, with 155 t
(6.5%) was the fourth largest producer.
Industry developments
Although gold prices in Australian dollar terms were
slightly better in 1998 than in 1997, they remain
low. Despite this situation there has been
considerable activity in the industry during the year.
Delta Gold NL commenced mining at its Golden
Feather project, near Kalgoorlie (WA), during the
year. Production started after an agreement was
reached with Goldfields Kalgoorlie Limited to
process Golden Feather ore at Goldfields’
Paddington CIL plant. Delta announced that it
planned to produce at least 200 000 ounces of gold
from 1.5 Mt of ore in campaigns starting in
December. Under the agreement, Delta is to pay an
access fee, meet all plant operating costs, and spend
$2 million upgrading the Paddington plant to handle
the higher grade ore from Golden Feather.
Mining also commenced at the Cornishman project,
4 km south of Southern Cross (WA), during the year.
The first gold was poured in the December quarter
at the Bullfinch plant, and just over 16 000 ounces
were poured in that quarter. Cornishman is a joint
venture between Sons of Gwalia Limited (51%;
project manager) and Troy Resources NL (49%).
Operations at the Mount Olympus mine, near
Paraburdoo in the Ashburton region (WA), began
late in the year, and the first gold was poured on 31
December 1998. The operation is using the plant
relocated from the former Lynas Find operation. It is
expected that the mine will yield some 175 000
ounces of gold over three years at an average cash
cost of A$250/ounce. Ownership of the project is
Sipa Resources International NL (45.5%), Lynas
Gold NL (35%), and Arcadia Minerals NL (19.5%).
Lynas Gold is the production manager for the
operation.
In a major development at the Boddington mine,
south of Perth, the Boddington Gold Mine Joint
Venture partners agreed with Alcoa of Australia
Limited and Hedges Gold Pty Ltd to acquire for
$15 million all mineral rights over the Hedges gold
mine’s worked areas and some of an adjoining
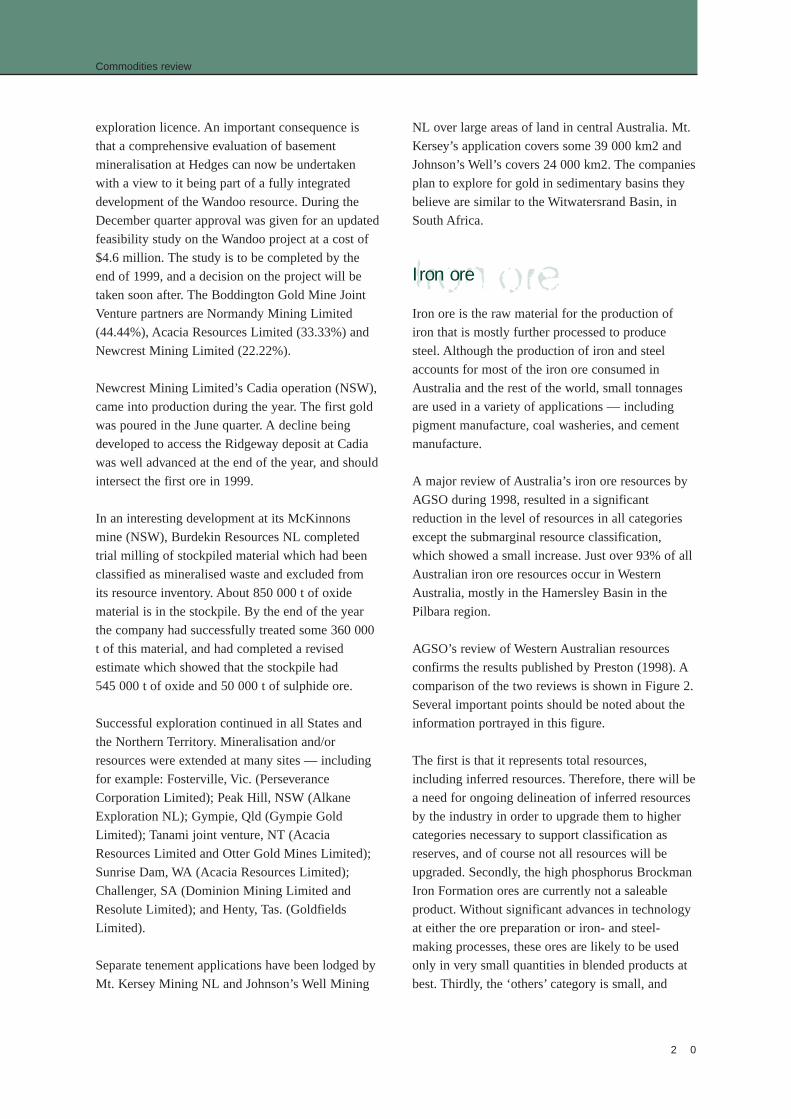
Iron ore
Commodities review
2 0
exploration licence. An important consequence is
that a comprehensive evaluation of basement
mineralisation at Hedges can now be undertaken
with a view to it being part of a fully integrated
development of the Wandoo resource. During the
December quarter approval was given for an updated
feasibility study on the Wandoo project at a cost of
$4.6 million. The study is to be completed by the
end of 1999, and a decision on the project will be
taken soon after. The Boddington Gold Mine Joint
Venture partners are Normandy Mining Limited
(44.44%), Acacia Resources Limited (33.33%) and
Newcrest Mining Limited (22.22%).
Newcrest Mining Limited’s Cadia operation (NSW),
came into production during the year. The first gold
was poured in the June quarter. A decline being
developed to access the Ridgeway deposit at Cadia
was well advanced at the end of the year, and should
intersect the first ore in 1999.
In an interesting development at its McKinnons
mine (NSW), Burdekin Resources NL completed
trial milling of stockpiled material which had been
classified as mineralised waste and excluded from
its resource inventory. About 850 000 t of oxide
material is in the stockpile. By the end of the year
the company had successfully treated some 360 000
t of this material, and had completed a revised
estimate which showed that the stockpile had
545 000 t of oxide and 50 000 t of sulphide ore.
Successful exploration continued in all States and
the Northern Territory. Mineralisation and/or
resources were extended at many sites — including
for example: Fosterville, Vic. (Perseverance
Corporation Limited); Peak Hill, NSW (Alkane
Exploration NL); Gympie, Qld (Gympie Gold
Limited); Tanami joint venture, NT (Acacia
Resources Limited and Otter Gold Mines Limited);
Sunrise Dam, WA (Acacia Resources Limited);
Challenger, SA (Dominion Mining Limited and
Resolute Limited); and Henty, Tas. (Goldfields
Limited).
Separate tenement applications have been lodged by
Mt. Kersey Mining NL and Johnson’s Well Mining
NL over large areas of land in central Australia. Mt.
Kersey’s application covers some 39 000 km2 and
Johnson’s Well’s covers 24 000 km2. The companies
plan to explore for gold in sedimentary basins they
believe are similar to the Witwatersrand Basin, in
South Africa.
Iron ore
Iron ore is the raw material for the production of
iron that is mostly further processed to produce
steel. Although the production of iron and steel
accounts for most of the iron ore consumed in
Australia and the rest of the world, small tonnages
are used in a variety of applications — including
pigment manufacture, coal washeries, and cement
manufacture.
A major review of Australia’s iron ore resources by
AGSO during 1998, resulted in a significant
reduction in the level of resources in all categories
except the submarginal resource classification,
which showed a small increase. Just over 93% of all
Australian iron ore resources occur in Western
Australia, mostly in the Hamersley Basin in the
Pilbara region.
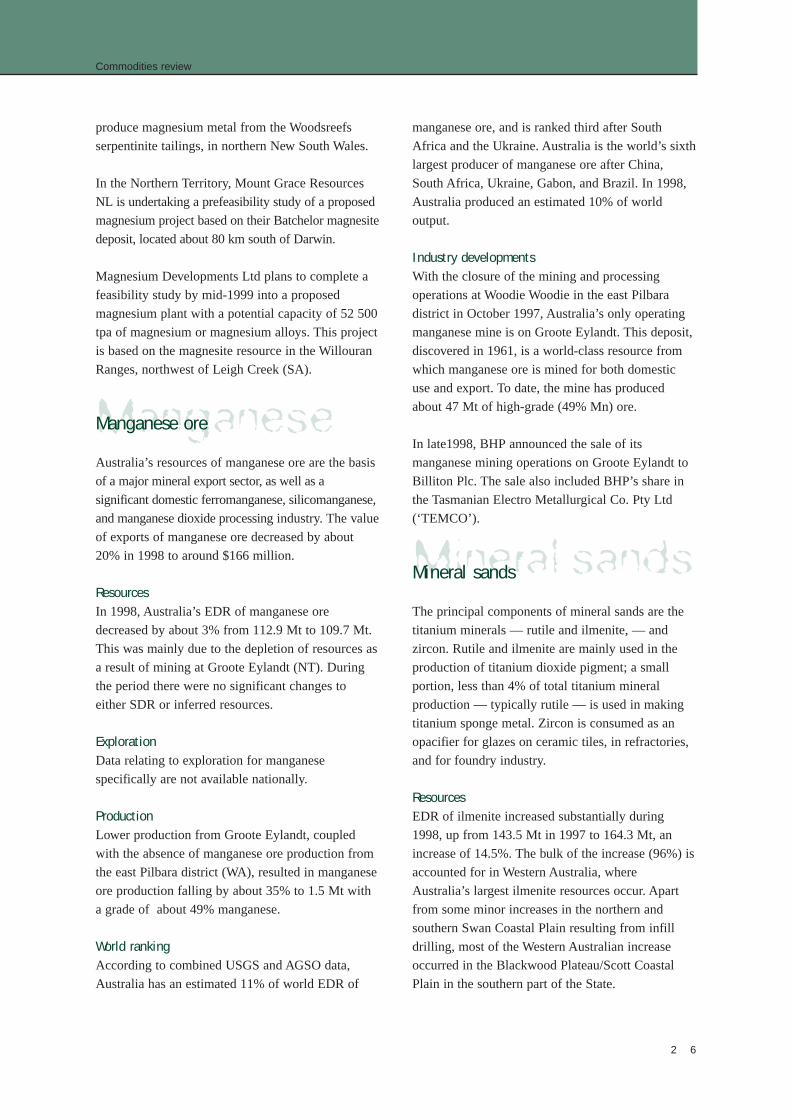
AGSO’s review of Western Australian resources
confirms the results published by Preston (1998). A
comparison of the two reviews is shown in Figure 2.
Several important points should be noted about the
information portrayed in this figure.
The first is that it represents total resources,
including inferred resources. Therefore, there will be
a need for ongoing delineation of inferred resources
by the industry in order to upgrade them to higher
categories necessary to support classification as
reserves, and of course not all resources will be
upgraded. Secondly, the high phosphorus Brockman
Iron Formation ores are currently not a saleable
product. Without significant advances in technology
at either the ore preparation or iron- and steel-
making processes, these ores are likely to be used
only in very small quantities in blended products at
best. Thirdly, the ‘others’ category is small, and

Commodities review
2 1
includes resources outside the Hamersley Basin.
Although these resources are important to local
communities and to the nation, they are too small to
have a major impact on the long-term future of the
industry. Not included in the ‘others’ category are
some 650 Mt of resources in titanomagnetite
deposits. Owing to the limited levels of low
phosphorus Brockman ore, the source of most high-
grade lump ore for export, the detritals (a source of
lump ore), will be an important resource in the
future. Even so, they are too small to impact
substantially on the industry’s long term outlook.
The future of the industry then is linked to four
major groups — low- and medium- phosphorus
Brockman Iron Formation ores (e.g., Mount
Whaleback, Mount Tom Price, and Paraburdoo),
Marra Mamba Iron Formation ores (e.g., Orebody
29, West Angelas, Hope Downs, and Marandoo),
and Channel Iron Deposits (CID; e.g., Robe River,
Yandi, and HI Yandi). The low phosphorus
Brockman resources are the source of the premium
high-grade lump ore that has been the backbone of
the iron ore export industry in Western Australia
since the late 1960s. Clearly, however, these
resources have a limited life if production is
maintained at current rates. Medium-phosphorus
Brockman ores have traditionally been used as
blending ores with the low-phosphorus ores. This
situation is likely to continue.
From this resource base, it is apparent that the Marra
Mamba and CID ores will provide the long-term
base for the industry. They are two quite different
ore types. The Marra Mamba ore is a hematite and
goethite mix capable of producing limited lump ore
that may partly substitute for the premium
Brockman lump ore, but does not have equivalent
chemical or physical properties. A large proportion
of Marra Mamba ore will be in the form of fines,
which are generally lower in alumina than fines
generated from the Brockman ores.
9000
8000
7000
6000
5000
4000
3000
Gt
iro
n o
re
Ore type
2000
1000
0
Low
PB
rock
man
Mediu
m P
Bro
ckm
an
Hig
h P
Bro
ckm
an
Detrita
ls
Marr
aM
am
ba
CID
Oth
ers
Preston (1998) AGSO
Figure 2 Western Australian iron ore resources 1998

Commodities review
2 2
CIDs have been exploited at the Robe River
operations for many years, and in recent years
successful marketing has seen the BHP and
Hamersley Iron Yandi mines come on stream. These
resources are used principally as sinter feed. The
origins of CIDs would suggest that composition may
not be as consistent as with the Brockman of Marra
Mamba ores across deposits, but internally deposits
are reasonably consistent. The substantial stock of
CID resources should ensure that they will be an
important component of Western Australia’s iron ore
exports over the long term.
Over the next two to three decades, there will be a
significant change in the composition of Western
Australian iron ore production that will reflect the
depletion of the premium ores and the growing
importance of Marra Mamba and CID ores.
Resources
Australia’s EDR fell by almost 8% in 1998.
Although production accounts for some of this
reduction, a comprehensive review generated many
revised estimates of resources. In 1998, virtually all
of Australia’s EDR were in Western Australia. Small
tonnages occur in South Australia, Tasmania, and
New South Wales. Most of the reduction in EDR
occurred in Western Australia (down by 7.6%), and
resulted from a loss of resources to production and
new resource estimates being made available to
AGSO. Tasmanian EDR remained steady. South
Australian EDR more than halved, but this was due
to new data becoming available rather than a major
downgrading of resources. South Australia has the
potential to see EDR delineated in areas outside of
the Middleback Ranges as work continues on the
South Australian Steel and Energy project (SASE).
To date, however, all published data for deposits
being investigated as part of SASE are classified as
inferred resources, and thus are ineligible for
inclusion in EDR or any other category of
demonstrated resources.
Australia’s subeconomic demonstrated resources
(SDR) fell by 63% in 1998. Much of the fall was
due to companies reclassifying resources from the
demonstrated to the inferred category, and some was
due to SDR being upgraded to EDR by AGSO.
Almost all the reduction in SDR occurred in Western
Australian deposits. Small variations occurred in all
other states except Tasmania.
Inferred resources fell by almost 40% to just under
11.4 Gt, due mainly to a reduction of over 6 Gt in
Western Australia. The reductions were a
consequence of new information becoming available
to AGSO.
Exploration expenditure
According to quarterly ABS figures, expenditure on
iron ore exploration in 1998 was $45 million. This
represented an increase of 68% over the previous
year. As in past years, comprehensive State-by-State
data are not published by ABS, but, most of the
expenditure was in Western Australia.
Production
Australian iron ore production in 1998 is reported
by ABARE as 155.7 Mt, a reduction of 1% over
1997. Of the total, 148.9 Mt (95.6%) was won in
Western Australia, 2.5% in Tasmania, and 1.9%
percent in South Australia. Minor production of iron
ore for non-steel industry use occurred in New
South Wales and Queensland.
World ranking
According to USGS estimates modified by AGSO to
account for revised Australian estimates, Australia
has some 11% of world EDR of iron ore. This is
slightly higher than the 1997 estimate of 10%.
Australia has the world’s fourth largest EDR after
China, Ukraine, and Russia. In terms of iron
contained in the EDR, Australia has some 12% of
the world’s EDR and is ranked third after the
Ukraine and slightly behind Russia. China is ranked
fourth, a position, which reflects the lower grade of
its resources.
Industry developments
The depressed state of the Asian steel sector
hindered development within the Australian iron ore
industry during the year under review. BHP decided
not to proceed with the development of its Orebody
18 in the Newman district. The company is keeping

Commodities review
2 3
the project under review, but a restart will depend on
improved market conditions. The Mid West iron and
steel project’s on-site preparation work at Oakajee,
near Geraldton, also ceased as a consequence of the
Asian financial crisis.
Sharing infrastructure is an issue that has important
implications for many potential developments in the
industry. In a first test, to facilitate development of
its West Angelas deposits, Robe River Iron
Associates is seeking access to a railway line owned
by Hamersley Iron Pty Ltd. Robe made application
to the National Competition Council for it to
recommend to the Commonwealth Treasurer the
declaration of a bulk iron ore track transportation
service. If successful, Robe would have access to
parts of Hamersley’s rail facilities to support the
West Angelas project.
BHP completed the under-harbour tunnel link
between its Nelson Point and Finucane Island
facilities at Port Hedland in March 1998. The tunnel
will be used to transport ore from Nelson Point to
the Finucane Island ship-loading facilities and the
company’s hot briquetted iron (HBI) plant. Work on
the HBI plant continued during the year, and, by
year’s end, production of the first metal was
expected in early 1999.
A South African company, Iscor Ltd, has joined
Hancock Prospecting Pty Ltd to investigate the
possible development of the Hope Downs deposit,
in the Pilbara district. It is expected that a two-year
feasibility study will cost in the order of $20
million with ISCOR meeting 80% of the cost to
earn 49% interest in the project. Hope Downs is one
of several Marra Mamba Iron Formation deposits
currently under consideration for development by
various companies. The project has three deposits
— Hope Downs 1, 2, and 3 — which all have
Marra Mamba ore. Hope Downs 3 also has
Brockman Iron Formation ore. Hancock
Prospecting have noted that the Marra Mamba ore
in Hope Downs 1 has low impurities, low stripping
ratios, and about 40% lump fraction; tests have
indicated the lump ore would perform well in
blast furnaces.
BHP continued work on its Mining Area C deposits
to the west of Newman. An environmental
management plan for the project was released for
comment during the year. Heritage surveys of both
the proposed mining and access areas have been
completed and the company reported that it is
studying a number of mining, processing, and ore-
handling options.
The Western Australian Government approved
extended mining operations at Hamersley Iron’s
Brockman mine, in the State’s Pilbara region. The
mine is located some 50 km northwest of the
company’s Mount Tom Price mine. The extended
operation will be mining in-situ bedded ore from an
area adjacent to the Brockman No. 2 detritals
orebody. Production will be at the rate of 4 Mt of
ore per year. Hamersley will operate the mine with
it’s own employees rather than contractors.
In February 1998, Rio Tinto Ltd announced that
research had resulted in an important breakthrough
in the HIsmelt iron-making process. The
breakthrough came from the replacement of a
horizontal vessel with a new water-cooled vertical
vessel, which simplified engineering issues,
increased the life on the refractory bricks lining the
vessel, and overall increased reliability of the
process. Rio Tinto stated that the process would
allow the use of Pilbara iron ores that previously
were difficult to use because of the high levels of
undesirable constituents, namely silica, alumina,
and phosphorus. HIsmelt allows silica and alumina
to be contained in slag and thus separated from the
liquid iron. Following successful demonstration of
the process, it is planned to build an intermediate-
sized plant at an international site to be determined.
In an interesting development Westralian Sands
announced plans to build a prototype plant at its
Capel mineral sands operation to produce high-
quality pig iron from wastes from its synthetic rutile
plant. Construction of the plant is expected to begin
during 1999.

Lithium
Magnesite
Commodities review
2 4
Lithium
Resources
All of Australia’s lithium resources occur in Western
Australia, and all EDR occur in the Greenbushes
deposit at the town of Greenbushes in the State’s
southwest. EDR fell by almost 3% to just over
158 000 t in 1998, due mainly to loss of resource to
production. Greenbushes is the world’s largest and
highest-grade spodumene (Li2O.Al2O3.4SiO2)
resource.
SDR and inferred resources were unchanged in 1998.
Exploration expenditure
There are no statistics available on exploration
expenditure for lithium in 1998. In view of the
current world oversupply of lithium resources,
particularly in the form of lithium rich brines, it is
unlikely that there will be substantial exploration
expenditure in Australia in the near future.
Production
Sons of Gwalia Limited remained the world’s largest
producer of lithium minerals in 1998. Production for
the year was 68 666 t, about 22% less than in 1997.
The reduction in output was in response to a
significant oversupply in the world lithium carbonate
market resulting from production at brine operations
in Chile and Argentina.
World ranking
According to estimates published by the USGS,
Chile holds about 88% of the world’s lithium
resources, followed by Canada with just over 5%
and Australia with just under 5%. Resource data,
however, are not available for some important
producing countries including — Argentina, China,
and Russia. Lithium resources occur in two distinct
categories — lithium minerals and lithium-rich
brines. Lithium brine resources, now the dominant
feedstock for lithium carbonate production, are
dominated by Chile. Canada and Australia dominate
resources of lithium minerals.
World production of lithium in 1998 was estimated
by the USGS to have been 16 000 t of contained
lithium. This was an increase of 2000 t over the
1997 estimate. For both these statistics, USA
production is withheld by the USGS for commercial
reasons. Most of the world increase is due to growth
in output in Argentina (up by 992 t to 1000 t) and
Chile (up by 400 t to 4500 t). Chile (with 28%)
remained the world’s largest producer, followed by
China (18%), Australia (13%) and Russia (12.5%).
Industry developments
No significant developments occurred in the
Australian lithium industry in 1998. Faced by a
substantial world oversupply, Sons of Gwalia
reduced production, but reported that in the 1997–98
financial year its lithium operation at Greenbushes
remained profitable and cashflow was positive.
Magnesite
Resources
EDR of magnesite increased by about 6% to 202 Mt
in 1998. The bulk of this increase occurred in South
Australia, where Pima Resources NL has identified
in excess of 120 Mt of magnesite in the Willouran
Ranges, northwest of Leigh Creek.
The largest Australian EDR of magnesite occur at
Kunwarara, 70 km northwest of Rockhampton
(Qld). Although some 2.4 Mt of ore was mined in
1998, further infill drilling and reclassification of
resources resulted in EDR increasing by about 2%.
The Kunwarara deposit contains substantial
accumulations of very high-density ‘bone-type’
magnesite, which is characterised by a nodular and
cryptocrystalline structure and low iron content.
The Thuddungra mine, 80 km northwest of Young
(NSW), did not operate in 1998. Magnesite from
this mine, which typically contains 98–99% MgCO3,
is processed at Young.
The second largest EDR of magnesite are in
Tasmania, where the Arthur River deposit contains
an indicated resource of 29 Mt of magnesite. The
magnesite has a grade of 42.8% MgO and is part of
a much larger resource of 180 Mt in the Arthur–

Commodities review
2 5
Lyons River area, about 53 km south of Burnie. A
small EDR of magnesite occurs in the Ravensthorpe
area in southeast Western Australia
SDR, which account for around 42% of total
identified resources, rose by 34 Mt during the year.
All the increase was in the paramarginal category
and recorded in South Australia and Tasmania.
Submarginal demonstrated resources in 1998
totalled in excess of 340 Mt, unchanged from the
previous year. All these resources are located in
Queensland.
Inferred resources rose by 67% to a record level of
325 Mt in 1998. South Australia and Tasmania
recorded the largest increases as a result of recent
discoveries. South Australia with 39% has the
largest inferred resource followed by Queensland
(31%) and Tasmania (25%).
Exploration
Data relating to exploration for magnesite
specifically are not available nationally.
Production
During 1998, Queensland Metals Corporation
Limited mined 2.4 Mt of crude magnesite ore at
Kunwarara, which was beneficiated to produce
about 345 000 t of magnesite. This material was
used to produce 102 000 t of deadburned magnesia,
about 17 500 t of calcined magnesia, and 27 300 t of
electrofused magnesia. These products are used for
the manufacture of high-quality refractory bricks,
which are for lining heat-containment vessels in the
steel, cement, non-ferrous, and chemical industries.
World ranking
According to USGS estimates, Australia has about
2% of the world’s EDR of magnesite. China, Russia,
and North Korea together account for over 70% of
the world’s EDR of magnesite. The Kunwarara
deposit, however, is the world’s largest known
resource of cryptocrystalline, nodular magnesite, a
high-quality ore by world standards.
Australia accounted for 3% of the world’s
production in 1998. Turkey (with 19%) was the
world’s largest producer, followed by China (18%)
and North Korea (14%).
Industry developments
With an increasing trend towards lightweight
automobiles and hence an increase in the usage of
magnesium metal in automobile parts, the demand
for magnesium metal is forecast to rise. This has
resulted in an abundance of new project proposals to
produce magnesium metal.
In the second half of 1998, Australian Magnesium
Corporation (AMC), jointly owned by Normandy
Mining Limited and Queensland Metals
Corporation, commenced operation of a 1500 tpa
demonstration plant at Gladstone (Qld). The purpose
of the plant is to trial the magnesium technology
developed by CSIRO, to develop design criteria, and
to validate all environmental operating parameters
for a proposed commercial plant. AMC expects to
commit to the construction of a commercial plant at
Rockhampton during the third quarter of 1999.
Magnesium metal production from the plant is
anticipated to start in late 2002; full production
should be achieved by late 2004.
In Tasmania, Crest Magnesium NL (formerly Crest
Resources Australia NL) is continuing with its
evaluation of the Arthur River magnesite project.
The first stage involves mining 300 000 tpa of raw
magnesite ore which will be upgraded by a single-
stage beneficiation process to 45% MgO. The
second stage involves production of magnesium
metal. The company has negotiated an option to
acquire a license to use proven magnesium metal
production technology from the Ukrainian National
Research and Design Titanium Institute in
Zaporozhie. Crest Magnesium has also entered into
an agreement with Multiplex Constructions to
construct a 95 000 tpa metal plant in the Bell Bay
region, in northeast Tasmania.
Golden Triangle Resources NL has commenced a
scoping study of a $700 million 80 000 tpa
magnesium plant based on magnesite deposits at
Main Creek and Bowry Creek, south of Burnie. The
company is also carrying out a feasibility study to
Mineral sands
Manganese
Commodities review
2 6
produce magnesium metal from the Woodsreefs
serpentinite tailings, in northern New South Wales.
In the Northern Territory, Mount Grace Resources
NL is undertaking a prefeasibility study of a proposed
magnesium project based on their Batchelor magnesite
deposit, located about 80 km south of Darwin.
Magnesium Developments Ltd plans to complete a
feasibility study by mid-1999 into a proposed
magnesium plant with a potential capacity of 52 500
tpa of magnesium or magnesium alloys. This project
is based on the magnesite resource in the Willouran
Ranges, northwest of Leigh Creek (SA).
Manganese ore
Australia’s resources of manganese ore are the basis
of a major mineral export sector, as well as a
significant domestic ferromanganese, silicomanganese,
and manganese dioxide processing industry. The value
of exports of manganese ore decreased by about
20% in 1998 to around $166 million.
Resources
In 1998, Australia’s EDR of manganese ore
decreased by about 3% from 112.9 Mt to 109.7 Mt.
This was mainly due to the depletion of resources as
a result of mining at Groote Eylandt (NT). During
the period there were no significant changes to
either SDR or inferred resources.
Exploration
Data relating to exploration for manganese
specifically are not available nationally.
Production
Lower production from Groote Eylandt, coupled
with the absence of manganese ore production from
the east Pilbara district (WA), resulted in manganese
ore production falling by about 35% to 1.5 Mt with
a grade of about 49% manganese.
World ranking
According to combined USGS and AGSO data,
Australia has an estimated 11% of world EDR of
manganese ore, and is ranked third after South
Africa and the Ukraine. Australia is the world’s sixth
largest producer of manganese ore after China,
South Africa, Ukraine, Gabon, and Brazil. In 1998,
Australia produced an estimated 10% of world
output.
Industry developments
With the closure of the mining and processing
operations at Woodie Woodie in the east Pilbara
district in October 1997, Australia’s only operating
manganese mine is on Groote Eylandt. This deposit,
discovered in 1961, is a world-class resource from
which manganese ore is mined for both domestic
use and export. To date, the mine has produced
about 47 Mt of high-grade (49% Mn) ore.
In late1998, BHP announced the sale of its
manganese mining operations on Groote Eylandt to
Billiton Plc. The sale also included BHP’s share in
the Tasmanian Electro Metallurgical Co. Pty Ltd
(‘TEMCO’).
Mineral sands
The principal components of mineral sands are the
titanium minerals — rutile and ilmenite, — and
zircon. Rutile and ilmenite are mainly used in the
production of titanium dioxide pigment; a small
portion, less than 4% of total titanium mineral
production — typically rutile — is used in making
titanium sponge metal. Zircon is consumed as an
opacifier for glazes on ceramic tiles, in refractories,
and for foundry industry.
Resources
EDR of ilmenite increased substantially during
1998, up from 143.5 Mt in 1997 to 164.3 Mt, an
increase of 14.5%. The bulk of the increase (96%) is
accounted for in Western Australia, where
Australia’s largest ilmenite resources occur. Apart
from some minor increases in the northern and
southern Swan Coastal Plain resulting from infill
drilling, most of the Western Australian increase
occurred in the Blackwood Plateau/Scott Coastal
Plain in the southern part of the State.

Commodities review
2 7
Continuing successful exploration in the Murray
Basin in northern Victoria and New South Wales
resulted in the ilmenite EDR increasing by 19% in
Victoria and by 27% in New South Wales.
EDR of rutile (which includes leucoxene in WA)
decreased by about 30 000 t to 17.5 Mt in 1998. The
largest decrease occurred in Western Australia,
notably in the Southern Swan Coastal Plain and
Blackwood Plateau / Scott Coastal Plain regions,
where leucoxene is more abundant than rutile.
Western Australia and Queensland together hold
86% of Australia’s EDR of rutile.
EDR of rutile in Victoria and New South Wales
increased by 21% and 13% respectively. All of the
increase occurred in the Murray Basin.
EDR of zircon decreased marginally by about
40 000 t to 23.22 Mt in 1998. Increases in EDR in
Victoria and New South Wales failed to compensate
for decreases in Western Australia and Queensland,
which together have 92% of Australia’s EDR of
zircon. EDR of zircon in Victoria and New South
Wales increased by 17% and 7% respectively; all of
this increase occurred in the Murray Basin.
Some 19%, 26% and 31% of Australia’s EDR of
ilmenite, rutile, and zircon respectively are
unavailable for mining. Areas quarantined from
mining and now largely incorporated into national
parks include: Moreton, Bribie, and Fraser Islands
(Qld); Cooloola sand mass north of Noosa (Qld);
Byfield sand mass and Shoalwater Bay area (Qld);
and Yuraygir, Bundjalung, Hat Head, and Myall
Lakes National Parks (NSW).
SDR of ilmenite, rutile, and zircon declined by
1.8%, 1.4%, and 1.2% respectively to 66.95 Mt,
36.35 Mt, and 26.91 Mt in 1998. The bulk of the
decrease occurred in the Murray Basin in southwest
New South Wales after further drilling upgraded
deposits from this category to EDR.
Inferred resources of ilmenite increased by just over
6% to 103.7 Mt in 1998. Increases occurred in
Queensland, New South Wales, Victoria and South
Australia. Victoria has the largest inferred ilmenite
resource with 37% of the Australian total. Western
Australia with 29% is ranked second followed by
Queensland with 23%.
Inferred resources of rutile and zircon increased
marginally by 4.3% and 5%, respectively. Most of
the increase occurred in New South Wales, Victoria,
and South Australia; a small increase occurred in
Western Australia. Victoria, the main holder of rutile
and zircon, has inferred resources of 77% and 64%
respectively of the total. Queensland with 8%
(rutile) and 16% (zircon) is the second largest holder
of resources in this category.
Exploration
Following successful initial exploration for coarse-
grained heavy mineral strandlines by companies
such as BeMax Resources NL, Aberfoyle Resources
Limited, RZM Ltd, and RGC Limited, most the
Murray Basin area in New South Wales, Victoria,
and South Australia is now under active exploration.
Production
In 1998, Australia produced 2.4 Mt of ilmenite,
240 000 t of rutile, and 400 000 t of zircon. The
bulk of Australia’s rutile and zircon production is
exported, and about 55% of the ilmenite is exported.
The remaining ilmenite production is upgraded to
synthetic rutile, which contains about 92–93% TiO2.
World ranking
According to AGSO and USGS data, Australia has
the world’s largest EDR of ilmenite, rutile and
zircon with 26%, 39%, and 36% respectively. Other
significant rankings are: South Africa (19%) and
Norway (12%) for ilmenite; South Africa (19%) and
India (15%) for rutile; and South Africa (35%) and
Ukraine (10%) for zircon.
In 1998, world production of ilmenite increased by
8% to 6.73 Mt; rutile increased by 3% to 476 000 t;
and zircon decreased by 13% to 807 000 t.
Australia produced about 36%, 50%, and 50% each
of world production of ilmenite, rutile and zircon
respectively.

Commodities review
Nickel
2 8
Australia is the world’s leading producer and largest
exporter of all three minerals. South Africa (from
dune sands) and Canada (from hard rock) mine
similar quantities of ilmenite to Australia, and
upgrade it to titanium slag before exporting it.
Industry developments
Production from the first heavy-mineral sand mine
in the Murray Basin is expected to commence in
early 2000. The Wemen project, owned by RZM Ltd
(70%) and Western Metals (30%), plans to treat 9.9
Mt of ore over almost four years. Annual production
will average 9600 t of zircon and 23 600 t of rutile.
The deposit will be mined by dredge, and the wet
concentrates trucked to RZM’s dry plant at Tomago,
near Newcastle (NSW).
RGC Limited is progressing a detailed feasibility
study into a number of high-grade deposits referred
to as Kulwin, Woornack, and Rownack, east of
Ouyen (Vic.). The grade of heavy mineral within
these deposits varies from 9 to 25%.
Rio Tinto has relinquished a number of its
exploration areas covering the fine-grained WIM200
and WIM250 deposits near Horsham, central
Victoria. Areas covering the WIM150 and WIM100
deposits have been retained.
Nickel
Resources
Nickel resources occur in all States except Victoria.
Australia’s total identified resources of nickel
increased by 2.19 Mt (9.2%) in 1998.
EDR of nickel increased by 33.7% over 1997, from
6.72 Mt to a record 8.97 Mt, and represented 34% of
total identified resources. EDR increased in all states
as a result of company reassessments at either
existing mines or new projects nearing production.
Western Australia has the nation’s largest
resources of nickel with 88% of EDR. While
proven and probable reserves at WMC Ltd’s
Mount Keith operations declined, measured and
indicated resources increased by over 40%.
Reserves at WMC’s other operations, Kambalda
and Leinster, decreased as a result of production
and the lower nickel prices that prevailed
throughout the year. Substantial increases in
resources were reported at the Ravensthorpe and
Abednego laterite projects, and smaller increases at
Cawse and Murrin Murrin.
In Queensland, further drilling and reassessment of
Preston Resources Ltd’s Marlborough deposits
resulted in a significant increase in EDR.
Exploration at the Syerston project in New South
Wales delineated resources that have also been
classified as EDR, the first so classified in that State.
SDR, which accounted for about 18% of total
identified resources, decreased by 2.54 Mt during
the year. The largest decrease, in Western Australia,
more than offset the small increases in Queensland,
New South Wales, and the Northern Territory.
Inferred resources increased by about 28% to a
record level of 12.82 Mt. Western Australia
recorded strong growth, up by about 3.5 Mt (45%)
over 1997. Increases in inferred resources also
occurred at the Murrin Murrin, Mount Margaret,
and Eucalyptus deposits and at WMC Ltd’s Mount
Keith operation.
Exploration
Data relating to exploration for nickel are not
available nationally.
Production
In 1998, production increased by 15%, to a record
level of 933 000 t of nickel concentrates containing
an estimated 142 000 t of nickel. All the production
was from Western Australia.
World ranking
According to AGSO and USGS data, world EDR of
nickel increased by 5.4% (43 Mt in 1997 to 45.3 Mt
in 1998). Australia’s share of world EDR increased
to 19.8%, up from 15.6% in 1997, making it the
largest holder of EDR, followed by Russia (14.5%),
Cuba (12.1%), and Canada (11.7%).

Commodities review
2 9
Phosphate
Australia accounted for about 12% of estimated
world nickel output of 1.17 Mt in 1998, and was the
third largest producer after Russia (22.7%) and
Canada (19%).
Industry developments
Australia has six nickel mines currently in operation:
WMC Ltd’s Kambalda, Leinster, and Mount Keith;
Outokumpu Oy’s Silver Swan and Forrestania; and
Titan Resources’ Radio Hill. A nickel smelter
operates at Kalgoorlie (WA), and there are two
nickel refineries — one at Yabulu (Qld), and the
other at Kwinana (WA). Billiton Plc took over QNI
Limited in early 1999 and now operates the Yabulu
refinery, which produced 227 000 t of nickel in
1997–98. The refinery’s principal output is nickel
rondelles produced from lateritic ore imported from
Indonesia, New Caledonia, and the Philippines.
During late 1998 and early 1999, WMC Ltd’s
Wannaway, Blair and Otter/Juan mines (all within
the Kambalda region) were put on care-and-
maintenance as a result of continuing low nickel prices.
Three lateritic nickel projects in Western Australia,
Murrin Murrin, Cawse, and Bulong commenced
production during late 1998 and early 1999. Each
operation utilises pressure acid leaching to process
the laterite ore, which is then refined on site. Murrin
Murrin (Anaconda Nickel), the largest of the three
mines, uses Sherritt technology to produce a nickel–
cobalt mixed sulphide concentrate, which is refined
by releaching. Cobalt is removed by solvent
extraction, and nickel and cobalt metal are
precipitated by hydrogen reduction.
At the Cawse mine (Centaur Mining and
Exploration Ltd) ore processing involves pressure
acid leaching to produce a mixed hydroxide
intermediate product that is releached and refined by
solvent extraction and electrowinning. Nickel
production commenced in late January 1999, and
annual production is expected to be 10 000 tpa.
Bulong (Preston Resources Ltd) utilises pressure
acid leaching, solvent extraction, and
electrowinning, without producing an intermediate
product. When fully operational, Bulong nickel
capacity will be 9000 tpa. When fully operational,
these relatively low cost mines will provide an
additional 64 000 tpa of nickel to world supply.
Other potential laterite projects are either at
feasibility or prefeasibilty stages of evaluation. They
include Mount Margaret and Ravensthorpe (WA),
Marlborough (Qld), and Syerston (NSW). Potential
new mines based on nickel sulphide ore are
Yakabindie, Maggie Hays, and Emily (WA).
Phosphate
Apart from a small amount used for direct fertiliser
application, there is no phosphate rock mined in
Australia for the manufacture of phosphoric acid, an
essential component in the production of high-
analysis fertilisers. Towards the end of 1999, this
situation is expected to change with the expected
commissioning of Queensland Fertiliser Project’s
Phosphate Hill mine in Queensland.
Australia’s Indian Ocean Territory of Christmas
Island is a source of quality rock phosphate, which
is exported to the Asia–Pacific and south east Asian
region. Christmas Island rock phosphate products
are used widely in the palm oil sector of this region,
and increasing sales of higher-grade phosphate are
being made to Australian manufacturers of Single
Superphosphate.
Resources
Since a reclassification of resources by WMC
Fertilizers Ltd, Australia’s EDR of phosphate rock
declined by about 15% in 1998 to 88 Mt. All these
resources are located at Phosphate Hill, 70 km south
of Duchess, in northwest Queensland. They occur as
sedimentary phosphate rock deposits (phosphorites),
at the southeastern margin of the Georgina Basin,
and have an average grade of 23.4% P2O5.
Most of Australia’s demonstrated resources of
phosphate occur in the Georgina Basin and are
classified as paramarginal. Two deposits, Swan and

Shale oil
Commodities review
3 0
Emu, occur within carbonatite at Mount Weld, 26
km southeast of Laverton (WA), where a phosphate-
rich zone has formed by the solution and weathering
of a primary carbonatite.
The bulk of Australia’s inferred phosphate resources
are in phosphorites in the Georgina Basin, and these
are evenly distributed between Queensland and the
Northern Territory. A small part of the Mount Weld
resource is classified as inferred.
There are no publicly available data on current
phosphate resources on Christmas Island.
Exploration
Data relating to exploration for phosphate are not
available nationally.
Production
In mainland Australia, less than 5000 t of phosphate
rock is mined annually from small deposits in South
Australia. This phosphate rock is high in aluminium
and iron, and is not suitable for manufacturing
superphosphate. It is used as a direct-application
fertiliser or for making organic fertiliser for
horticultural applications.
In 1997–98, Phosphate Resources Ltd (PRL)
shipped 587 000 t of phosphate rock from Christmas
Island, an increase of 5.2% over 1996–97. Of this
amount, about 360 000 t of phosphate were shipped
to Malaysia and about 140 000 t to Australia. PRL
mines more than 470 000 t of rock phosphate and
71 000 t of phosphate dust annually.
World ranking
Australia’s EDR of phosphate rock comprises less
than 1% of the world’s total EDR of 12 000 Mt,
which occurs principally as sedimentary marine
phosphorites.
Industry developments
Mining at Phosphate Hill–Duchess deposit (Qld) has
been on care-and-maintenance since 1983. After an
announcement that natural gas would be piped into
the Mount Isa region, WMC Fertilizers Ltd
announced in late 1996 that they would develop an
integrated fertiliser manufacturing facility in the
region.The components of this chemical processing
operation consist of a mine, phosphoric acid facility,
ammonia plant, and granulation plant at Phosphate
Hill, and a sulphuric acid plant at Mount Isa.
The acid plant at Mount Isa will convert sulphur
dioxide from Mount Isa Mine’s copper smelter into
sulphuric acid, which will be transported by rail to
Phosphate Hill. The conversion plant will remove
97% of the sulphur-bearing gases currently being
emitted by the copper smelter, and overall stack
emissions of sulphur dioxide at Mount Isa will be
reduced by about 80%. About 4000 t of sulphuric
acid will be produced each day.
The mined phosphate rock will be crushed and
combined with sulphuric acid to produce 1500 t per
day of phosphoric acid. A 600 t per day ammonia
plant will utilise, as feedstock, natural gas sourced
from the Cooper Basin.
The granulation plant will combine phosphoric acid
and ammonia to produce one million tonnes per year
of diammonium phosphate and monoammonium
phosphate fertiliser. Construction of the various
plants at Phosphate Hill and Mount Isa began in
early 1998, and commissioning is expected in late 1999.
PRL was awarded the 1998 Australian Export Award
for its effort in surviving the downturn in Asian
markets in 1997. During 1997–98, it signed a new
21-year mining lease with the Australian
Government. The lease has enabled the company to
plan for expansion and growth with greater security.
The company aims to improve its mine
infrastructure and assist in the rehabilitation of
previously mined phosphate areas.
Shale oil
Resources
AGSO assessed that in 1998 Australia had no shale
oil resources in the EDR category. As reported last
year, this situation may change significantly after the
shale oil demonstration plant at Stuart (Qld) has

Tantalum
Commodities review
3 1
commenced operation. It is expected that the Stuart
trials will begin in the first half of 1999.
Very little change occurred in the level of Australia’s
shale oil resources in 1998. Paramarginal
demonstrated resources remained unchanged at 461
GL. There was an increase of 6% to 3158 GL in
submarginal demonstrated resources as the result of
a successful exploration program completed at
Duaringa (Qld) during the year.
Resources in the Stuart deposit are classified as
subeconomic paramarginal by AGSO. Should the
demonstration plant prove that extraction of shale oil
is commercially feasible, it is expected that the
resources in that deposit will be upgraded to EDR.
Inferred resources were virtually unchanged in 1998.
Exploration
There was very little exploration for shale oil in
1998. Southern Pacific Petroleum / Central Pacific
Minerals (SPP/CPM) completed the drilling program
on the Duaringa deposit that resulted in the
upgraded resource estimates referred to above.
Production
There was no production of shale oil in Australia in
1998.
World ranking
Information on world resources and production of
shale oil is not available.
Industry developments
Considerable activity took place at the Stuart site
over the year. In December, a contract to undertake
mining was awarded to a joint venture between
Macmahon Holdings Limited and Nghulin, which is
a company formed by the local Aboriginal community.
SPP/CPM reported that, by the end of December,
0.3 Mm3 of overburden and topsoil had been mined.
The overburden mined is being used by the
Gladstone Port Authority in the development of its
Bulk Liquids Handling Wharf on Gladstone harbour.
By the end of 1998, stage 1 of the Stuart plant was
95% completed and was both on schedule and
budget. Overall site construction was 89%
completed at the end of the year, and full completion
is expected in the second quarter of 1999. If this
target is achieved, the first shale oil production is
expected by the end of 1999.
In October, a team of experts was formed to develop
the Alberta Taciuk Process for stage 2 of the project.
The task of this team is to develop a preliminary
design for stage 2, into which the results of the stage
1 test program can be incorporated. Assuming stage
1 is successful, construction of stage 2 is expected to
commence in 2001, and the first shale oil produced
from it in 2003. Stage 2 would produce 15 000
barrels a day. If stage 2 proceeds it is expected to
cost over $350 million.
Also in October, SPP/CPM and Suncor Energy
announced that they would proceed with the
development of several trial reafforestation projects.
The companies announced that the trials would
involve an investment of over $3.5 million over a
four-year period to plant and maintain more than
180 000 native trees to capture carbon dioxide. They
are aiming to achieve net levels of carbon dioxide
emissions in commercial shale oil production equal
to or less than those released in the production of
conventional oil products.
During the year SPP/CPM joined with the Royal
Melbourne Institute of Technology to develop
techniques for the rapid analysis of oil shales.
Should this project be successful, improved process
control would be achieved, and this in turn would
lead to higher levels of production from a given plant.
Tantalum
Rapid world-wide growth in the use of portable
electronic devices — such as mobile phones,
computers, and video cameras — has generated
strong growth in demand for tantalum capacitors in
recent years. Australia, through the operations of
Sons of Gwalia Ltd, is the world’s largest producer
of tantalum in the form of tantalum concentrates.
The company also controls the world’s largest stock
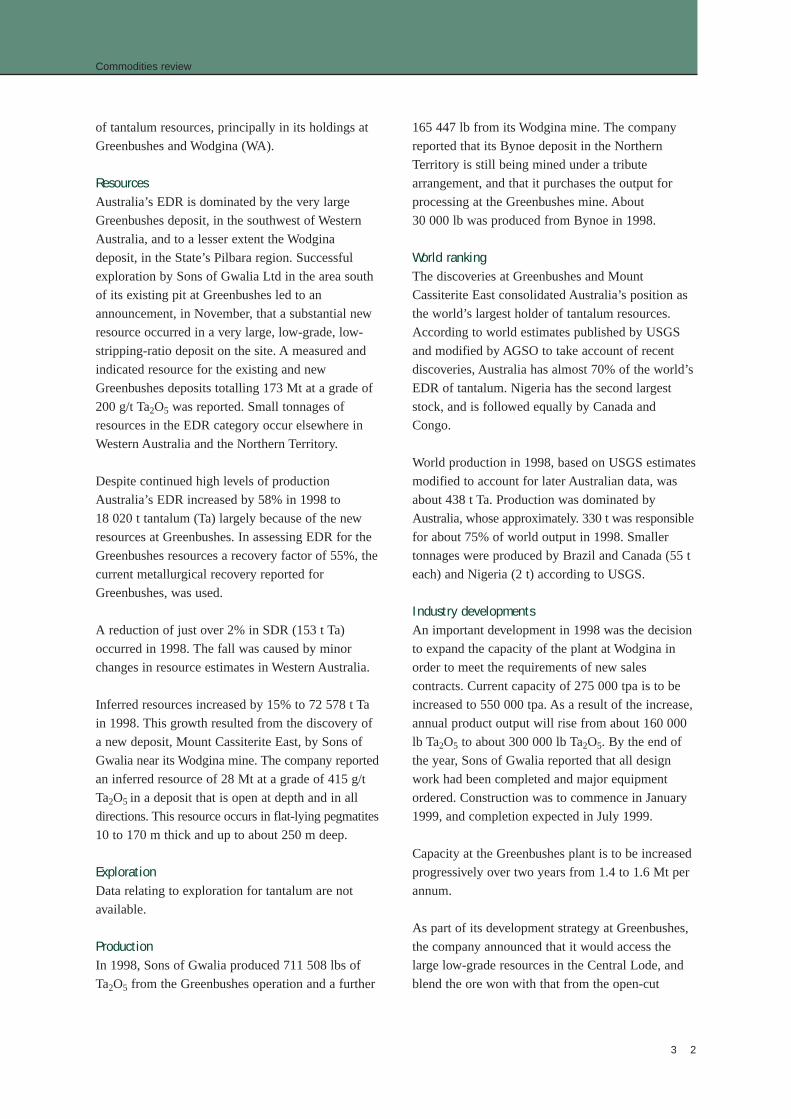
Commodities review
3 2
of tantalum resources, principally in its holdings at
Greenbushes and Wodgina (WA).
Resources
Australia’s EDR is dominated by the very large
Greenbushes deposit, in the southwest of Western
Australia, and to a lesser extent the Wodgina
deposit, in the State’s Pilbara region. Successful
exploration by Sons of Gwalia Ltd in the area south
of its existing pit at Greenbushes led to an
announcement, in November, that a substantial new
resource occurred in a very large, low-grade, low-
stripping-ratio deposit on the site. A measured and
indicated resource for the existing and new
Greenbushes deposits totalling 173 Mt at a grade of
200 g/t Ta2O5 was reported. Small tonnages of
resources in the EDR category occur elsewhere in
Western Australia and the Northern Territory.
Despite continued high levels of production
Australia’s EDR increased by 58% in 1998 to
18 020 t tantalum (Ta) largely because of the new
resources at Greenbushes. In assessing EDR for the
Greenbushes resources a recovery factor of 55%, the
current metallurgical recovery reported for
Greenbushes, was used.
A reduction of just over 2% in SDR (153 t Ta)
occurred in 1998. The fall was caused by minor
changes in resource estimates in Western Australia.
Inferred resources increased by 15% to 72 578 t Ta
in 1998. This growth resulted from the discovery of
a new deposit, Mount Cassiterite East, by Sons of
Gwalia near its Wodgina mine. The company reported
an inferred resource of 28 Mt at a grade of 415 g/t
Ta2O5 in a deposit that is open at depth and in all
directions. This resource occurs in flat-lying pegmatites
10 to 170 m thick and up to about 250 m deep.
Exploration
Data relating to exploration for tantalum are not
available.
Production
In 1998, Sons of Gwalia produced 711 508 lbs of
Ta2O5 from the Greenbushes operation and a further
165 447 lb from its Wodgina mine. The company
reported that its Bynoe deposit in the Northern
Territory is still being mined under a tribute
arrangement, and that it purchases the output for
processing at the Greenbushes mine. About
30 000 lb was produced from Bynoe in 1998.
World ranking
The discoveries at Greenbushes and Mount
Cassiterite East consolidated Australia’s position as
the world’s largest holder of tantalum resources.
According to world estimates published by USGS
and modified by AGSO to take account of recent
discoveries, Australia has almost 70% of the world’s
EDR of tantalum. Nigeria has the second largest
stock, and is followed equally by Canada and
Congo.
World production in 1998, based on USGS estimates
modified to account for later Australian data, was
about 438 t Ta. Production was dominated by
Australia, whose approximately. 330 t was responsible
for about 75% of world output in 1998. Smaller
tonnages were produced by Brazil and Canada (55 t
each) and Nigeria (2 t) according to USGS.
Industry developments
An important development in 1998 was the decision
to expand the capacity of the plant at Wodgina in
order to meet the requirements of new sales
contracts. Current capacity of 275 000 tpa is to be
increased to 550 000 tpa. As a result of the increase,
annual product output will rise from about 160 000
lb Ta2O5 to about 300 000 lb Ta2O5. By the end of
the year, Sons of Gwalia reported that all design
work had been completed and major equipment
ordered. Construction was to commence in January
1999, and completion expected in July 1999.
Capacity at the Greenbushes plant is to be increased
progressively over two years from 1.4 to 1.6 Mt per
annum.
As part of its development strategy at Greenbushes,
the company announced that it would access the
large low-grade resources in the Central Lode, and
blend the ore won with that from the open-cut

Commodities review
Uranium
operation. Subsequently, in its December 1998
quarterly report, Sons of Gwalia noted that bulk-
processing trials of this ore confirmed the
metallurgical assumptions made in the feasibility
study into the proposal. The resource is to be mined
by bulk mining methods and processed at higher
throughput rates.
Uranium
Resources
AGSO has prepared estimates of Australia’s uranium
resources within categories defined by the OECD
Nuclear Energy Agency (OECD/NEA) and the
International Atomic Energy Agency (IAEA; OECD/
NEA & IAEA, 1998). In Table 1, these estimates are
reported under the corresponding resource categories
of the national classification scheme. The resource
categories of both schemes are correlated as closely
as possible in Table 2.
Australia has the world’s largest resources of
uranium in the low-cost RAR category, with 26% of
world resources in this category. Other countries
with large low-cost resources include Kazakhstan
(19%), Canada (14%), South Africa (9%), Namibia
(7%), Brazil (7%), Russian Federation (6%), and
United States (5%).
About 95% of Australia’s total uranium resources in
the low cost RAR category are within the following
six deposits (Fig. 3):
• Olympic Dam (SA);
• Ranger, Jabiluka, and Koongarra, in the Alligator
Rivers region (NT);
• Kintyre and Yeelirrie (WA).
Exploration
After the exploration boom of the late 1970s,
uranium exploration in Australia dropped from
A$89.0 million in 1980 to an historic low of A$7.2
million in 1994 (expenditures in constant 1997 A$).
Subsequently, exploration expenditure increased
progressively to A$23.6 million in 1997. Australia is
Plate 7 Entrance to the Jabiluka decline, Northern Territory
Photograph courtesy of Energy Resources of Australia Ltd
National Scheme OECD/NEA & IAEA Scheme
Economic Demonstrated Resources Reasonably Assured Resources (RAR) recoverable at less than
US$80/ kg U (commonly referred to as low cost resources)
Subeconomic Demonstrated Resources RAR recoverable at US$80-130/ kg U
Economic Inferred Resources Estimated Additional Resources Category 1
(EAR-1) recoverable at less than US$80/ kg U
Subeconomic Inferred Resources EAR-1 recoverable at US$80-130/ kg U
Table 2 Comparison of resource classification schemes for uranium

Perth
Townsville
Melbourne
Adelaide
Derby
Darwin
Broken Hill
Kalgoorlie
Mount Isa
0 500 km
Ranger
KoongarraRanger
68
WestmorelandMaureen
Ben Lomond
Bigrlyi
Alice Springs
Angela
Olympic DamMt Painter
Beverley
Oobagooma
KintyreManyingee
Turee Creek
Lake WayLake MaitlandYeelirrie
Mulga Rock
Current producer
Jabiluka
Honeymoon
Deposit
31/A/17
Port Hedland
Commodities review
3 4
one of the few countries where exploration
expenditure increased in recent years, a result of the
abolition of the ‘three mines’ policy in 1996 and
improved demand for uranium. Data for 1998 are
yet to be finalised.
The main areas where exploration was carried out
during 1997 and 1998 are:
• Arnhem Land (NT) — exploration for
unconformity-related deposits in
Palaeoproterozoic metasediments below a thick
cover of Kombolgie Sandstone;
• Paterson Province (WA) — exploration for
unconformity-related deposits in
Palaeoproterozoic metasediments of the Rudall
Metamorphic Complex, which hosts the Kintyre
orebody;
• Westmoreland area (northwest Qld.)
— exploration for sandstone-type deposits in
Proterozoic strata of the McArthur Basin;
• Olympic Dam area — exploration drilling along
the southern margin of the deposit.
Production
Uranium oxide is currently produced at two mining/
milling operations — Ranger and Olympic Dam.
Australia’s total production for 1998 was 5790 t
U3O8 (4910 t U; U=0.848 x U3O8), of which Ranger
produced 4050 t U3O8 and Olympic Dam produced
1740 t U3O8. Total production for 1998 was 11%
less than in 1997.
Industry developments
Ranger. Mining continued during the year at the
Ranger No. 3 orebody, which commenced full-scale
production in mid-1997 and has total proven plus
probable reserves of 16.3 Mt ore with average grade
0.29% U3O8 (47 200 t of contained U3O8). No. 3
orebody is 1 km north of the mined-out No. 1 open-
pit, which has been used as a repository for mill
tailings since August 1996.
In August 1997, Energy Resources of Australia Ltd
(ERA) completed the expansion of nominal milling
capacity at Ranger to 5000 t U3O8 per annum.
However, chemical problems within the mill resulted
Figure 3 Uranium deposits and prospects in Australia

Commodities review
3 5
in production only reaching 4050 t U3O8 in 1998.
The plant returned to full capacity in June 1998 but
ERA subsequently decided to temporarily shutdown
the new ball mill from 8 January 1999 in view of
depressed market conditions.
Olympic Dam. The Olympic Dam copper–uranium–
gold–silver deposit is the world’s largest deposit of
low-cost uranium. Total proved plus probable
reserves amounted to 336 000 t of contained U3O8 at
December 1998 (WMC 1998). Uranium production
is linked to copper production.
The Olympic Dam expansion project commenced in
January 1997 and construction continued through
1998. The expansion will increase annual production
capacity to 200 000 t of refined copper and 4600 t
U3O8, which will triple current production levels. At
this production rate the mill will process 9 Mt of ore
per annum. The expansion, South Australia’s largest
development project, represents an estimated outlay
of $1.94 billion.
Features of the expansion include:
• an automated electric rail haulage system and a
new crusher station;
• a new autogenous mill incorporating the latest
grinding technology;
• a new smelter;
• an enlarged hydrometallurgical plant;
• a third haulage shaft.
Jabiluka. ERA Ltd proposes to mine the Jabiluka
orebody by underground mining methods (Fig. 4).
Jabiluka has total proved and probable ore reserves
of 19.5 Mt with average grade 0.46% U3O8 (90 400 t
of contained U3O8).
ERA’s preferred option is for an underground
mining operation, and for the ore to be processed at
the Ranger mill. The ore would be trucked 22 km to
Ranger via a haul road entirely within the lease area,
and the tailings would be disposed of into the open
pits at Ranger (Shirvington 1997). This option is
referred to as the Ranger Mill Alternative.
As an alternative option, ERA proposed in the
environmental impact statement (EIS) that a mill be
built adjacent to the Jabiluka mine, and that the ore
be milled and processed within the Jabiluka Mineral
Lease. This option is referred to as the Jabiluka Mill
Alternative (JMA).
In August 1997, the Commonwealth Environment
Minister recommended that there does not appear to
be any environmental issue that would prevent the
preferred Jabiluka proposal from proceeding. The
Minister required that stringent regulatory and
operating conditions be applied to ensure the
protection of World Heritage values, flora, fauna,
and cultural heritage (including Aboriginal sacred
sites).
Subsequent to this approval, the traditional owners
of the Jabiluka Mineral Lease area indicated that
Figure 4 Jabiluka – diagrammatic longitudinal section looking north

Commodities review
3 6
they were unwilling to consent to milling Jabiluka
ore at Ranger. Consequently, it became necessary to
submit the JMA to a detailed environmental
assessment process to evaluate it as an acceptable
option. In April 1998, the Commonwealth
Environment Minister directed ERA to prepare a
public environment report (PER) to assist the
Commonwealth and Northern Territory
Governments in assessing the environmental impacts
of the JMA.
ERA Ltd proposed to use cemented paste-fill
technology for disposing of tailings in the JMA. As
much as possible of the cemented tailings would be
disposed of underground in the mine stopes, and any
excess tailings that could not be placed underground
would be stored in two purpose-built surface pits.
In his assessment of the PER, the Commonwealth
Environment Minister noted concerns about the
nature and behaviour of cemented tailings paste in
the pits, and concerns regarding the long-term
security of the pits from a hydrological perspective.
After receiving an independent report on tailings
management, the Minister announced in August
1998 that the milling of uranium ore at Jabiluka will
be environmentally acceptable if 100% of the
tailings are returned to the mine void underground.
Acknowledging that there may be viable alternatives
to disposing of all tailings underground, the Minister
stated that the company must conduct an additional
assessment that addresses the issues of concern
before a decision could be made on any such option.
In August 1998, the Minister for Resources & Energy
formally endorsed the recommendations made by the
Environment Minister and cleared the way for the
development of milling operations at Jabiluka. This
decision completes the Commonwealth approvals
process under the Environmental Protection (Impact of
Proposals) Act for the Jabiluka mine and for the options
Plate 8 Ion exchange columns for in situ leach trials at the Beverley uranium project, South Australia
Photograph courtesy of Aden McKay, AGSO; published with the permission of Heathgate Resources Pty Ltd
Commodities review
3 7
to mill the ore either at Jabiluka or at Ranger. ERA
considers that the option of milling the ore at Ranger is
more environmentally beneficial than milling the ore at
Jabiluka. The company is seeking to find common
ground with the traditional owners, through their
legal representatives (the Northern Lands Council),
on where the ore should be processed. (ERA 1998).
Authorisation under the Northern Territory Uranium
Mining (Environmental Controls) Act to construct
the portal and access decline was issued in June
1998. Construction of the retention pond has been
completed, and the mine portal is well advanced .
Beverley. Heathgate Resources Pty Ltd estimate that
the Beverley uranium deposit has total resources of
at least 10 600 t U3O8 recoverable by in-situ leach
(ISL) mining.
The deposit occurs in uncemented, partly
consolidated, fine- to medium-grained sand with
interbedded clay and silt (upper Tertiary Namba
Formation). It forms three lenticular zones,
designated North, Central, and South ore lenses. The
North and Central ore lenses are within the central
of three palaeochannels, while the South ore lens is
situated in the south palaeochannel (Fig. 5). The
deposit occurs at an average depth below surface of
107 m, and the combined thickness of the
mineralised sand is typically 20–30 m.
In January 1998, Heathgate commenced in-situ field
leach trials to confirm the viability of ISL methods.
On the basis of the success of these trials, it is
proposed that the commercial operation, will use
sulphuric acid and oxygen to dissolve the uranium
in-situ, and resin-type ion-exchange techniques will
be used to recover uranium in the processing plant.
Heathgate proposes that liquid wastes will be
collected initially in the plant-holding ponds. Two
options exist for disposing of these liquids:
• reinject the liquids into the Beverley aquifer in
areas already mined out, or
• evaporate the water in surface ponds, and dispose
of the resulting solids in an engineered disposal facility.
The company considers that reinjection into the
mineralised aquifer is the best method of disposal
from both environmental and operational
perspectives because it:
• minimises the amount of material requiring
near-surface disposal;
• significantly reduces the area needed for
pondage;
• significantly reduces the release of radon to the
atmosphere.
Groundwater in the mineralised zone is saline (total
dissolved solids range from 3000 to 12 000 mg/l),
and contains naturally occurring uranium and
radium at concentrations well in excess of drinking
water limits. It is unsuitable as potable water, for
agriculture, or for stock-watering.
Discharge from the Beverley aquifer is believed to
be virtually zero because (Heathgate 1998):
• the hydraulic gradient along the Beverley
channel is virtually zero (i.e., no lateral flow),
• vertical hydraulic gradients are directed towards
the Beverley aquifer from above and below, and
• the mineralised parts of the channel appear, from
recent pumping test results, to be bounded to the
north and south by low-permeability potential
flow paths and to the east and west by similar
restrictions.
The draft EIS for the proposed Beverley
development was released in June 1998, and the
supplement (response document) was released in
September 1998. The EIS was assessed jointly by
the South Australian and Commonwealth
Governments. The Commonwealth Environment
Minister announced in a press release of 23
December 1998 that, subject to the company
carrying out further investigations to confirm that
there is no hydraulic connection between the
Beverley aquifer and other surrounding aquifers, ‘…
the Beverley project is environmentally acceptable
and there is no environmental reason which would
prevent the granting of Commonwealth approvals.’

Honeymoon. The resources recoverable by ISL
methods for Honeymoon and nearby deposits owned
by Southern Cross are itemised in Table 3 (Ackland
1997; Southern Cross 1998a).
The deposit has a roll-front shape and occurs at an
oxidation–reduction interface within coarse-grained
Tertiary sand along the lateral margins of a bend in a
palaeochannel. The deposit is between 100 and 120 m
below the surface. Uranium is present mainly as
coffinite; quartz and kaolinite are gangue minerals.
The ore has a high pyrite content (average 7%), and
total organic carbon averages 0.3%.
The mineralised palaeochannel provides the only
significant groundwater occurrence in the area. It
comprises three aquifers — upper, middle, and basal
sand units — separated by semiconfining clay layers
2 to 4 m thick. The basal sand aquifer (which hosts
the deposit) averages 12 m thick.
Commodities review
3 8
Deposit Resource category Resources (t U3O8 ) Grade (% U3O8)
Honeymoon (including Measured 3700 0.156
Honeymoon Extension)
East Kalkaroo Indicated 900 0.14
Goulds Dam Inferred 18 000 0.098
Table 3 Uranium resources for Honeymoon and nearby deposits
Plate 9 Solvent extraction demonstration plant at the Honeymoon uranium project, South Australia
Photograph courtesy of Aden McKay, AGSO; published with the permission of Southern Cross Resources Australia Pty Ltd

Commodities review
3 9
Figure 5 Plan showing locations of ore lenses and palaeodrainage channel (from Beverley EIS, Heathgate 1998)

Commodities review
Vanadium
Groundwater quality in the mineralised sand is very
poor; its total dissolved solids usually greater than
16 000 mg/litre (Southern Cross 1998b) make it
unacceptable for human consumption, domestic use,
irrigation supply and stock-watering. Minor stock-
water supplies are being drawn from the upper aquifer.
In May 1996, the project was acquired by Southern
Cross Resources Incorporated. Refurbishment of
plant left on the site from previous testing
commenced in the latter part of 1997. The plant was
commissioned in early 1998.
In April 1998, approval was granted by the South
Australian Department of Mines & Energy
Resources for the company to carry out field leach
trials. These used sulphuric acid and an oxidant to
mobilise the uranium from the basal aquifer. The
oxidants tested were oxygen gas, hydrogen peroxide,
and ferric sulphate. Both solvent- extraction and ion-
exchange (resin) techniques were investigated. The
results obtained by solvent extraction were far
superior. The extremely high chloride content of the
groundwater prevented the ion exchange-process
from working effectively.
A draft EIS for the project was in preparation at the
end of 1998. The proposed commercial operation
will produce 1000 t U3O8 per year. The company is
considering three options for disposing of liquid waste:
• injection to a disposal well into the mineralised
zone in an area where ISL operations have been
completed,
• evaporation of the water and disposal of the
resulting salts in an engineered solids disposal
facility, and
• precipitation of the radioactive component
(radium) and disposal of these salts in an
engineered solids disposal facility, and
reinjection of the water.
Senate Inquiry into uranium mining and milling
Australia’s uranium mining sector was the subject of
a review by the Senate Select Committee on
Uranium Mining and Milling which tabled its report
in the Senate in May 1997. The Committee’s
majority report found that the major finding of the
1977 Ranger Uranium Environmental Inquiry (the
Fox Report) that — ‘The hazards of mining and
milling uranium, if these activities are properly
regulated and controlled, are not such as to justify a
decision not to develop Australian uranium mines’
— remained valid as the foundation for policy on
the mining and milling of uranium in Australia.
The Government tabled its response to the report in
May 1998. It accepted most of the Committee’s
recommendations relating to environmental, health,
and safety issues, but rejected a recommendation
that a Commonwealth Uranium Authority be
established to regulate uranium mining in Australia.
Vanadium
Vanadium is used in metal alloys, principally to
strengthen steel.
Resources
During 1998, Australia’s EDR of vanadium
increased by 38 232 t (25%) as a result of increases
in resources at the Windimurra deposit, 75 km east-
southeast of Mount Magnet (WA). Proven reserves
of oxidised ore reported by Precious Metals
Australia Ltd for Windimurra are 55.4 Mt with
average grade 0.497% V2O5.
Exploration
Exploration for vanadium increased in 1998 in
response to higher market prices and increased
demand. Exploration drilling at Interim Resources’
Gabanintha/Yarrabubla project, 45 km southeast of
Meekatharra, intersected zones of vanadium/titanium
mineralisation within a titaniferous magnetite zone
hosted by basic intrusive rocks.
Exploration and metallurgical testing of vanadium
resources within the Julia Creek oil shale deposits,
north Queensland, continued during the year.
Production
There was no production of vanadium in 1998.
4 0

Commodities review
Zinc Lead Silver
4 1
Zinc, lead, silver
Resources
EDR for zinc (34 Mt), lead (17.2 Mt), and silver
(40.6 kt) decreased in 1998 by 6%, 1%, and 2%
respectively as a result of production and
reassessment of resources at major mines.
Australia’s total identified resources of zinc (83.5
Mt) and lead (53 Mt) each decreased by 3%, while
silver (90.4 kt) decreased by 2% during 1998.
Exploration
Data relating to exploration for zinc, lead, and silver
specifically were not assessed.
World resources and production
Australia has the world’s largest EDR of zinc (18%),
lead (26%), and silver (15%). According to USGS
world production data for 1998, Australia ranks as
the largest producer of lead, second of zinc, and
fourth of silver. Production is mainly from mines at
Cannington, George Fisher, Hilton, and Mount Isa
(Qld); McArthur River (NT); Broken Hill and Elura
(NSW); Hellyer and Rosebery (Tas.); and Scuddles,
Gossan Hill and the Lennard Shelf deposits (WA).
Australia’s gold mines also contribute significantly
to silver production.
Industry developments
Development of the large Century mine, in
northwest Queensland, is ahead of schedule, and
production is expected to commence in the final
quarter of 1999. More than 1300 people are
employed on the project, and over $600 million in
goods and services has been sourced from Australian
suppliers.
At the Mount Isa mine, a strategy to focus on higher
mineral recovery at reduced mining rates is proving
successful. Development of the new George Fisher
mine has extended the operating life at Mount Isa
and Hilton to about 2003. Thereafter, ore from the
George Fisher mine will replace supply to the
Mount Isa zinc and lead processing plant. The
decision to develop two of George Fisher’s eleven
orebodies of 24 Mt was taken in April 1998, and the
substantial remaining resources (70 Mt) could
Plate 10 Ore processing mill under construction at the Century
zinc-lead-silver mine, Queensland Photograph courtesy of
Pasminco Ltd
Industry developments
Windimurra is a world-class vanadium deposit and
will be Australia’s only vanadium mine when
production commences. It is a magmatic Fe–Ti–V
deposit in which the vanadium occurs in magnetite
and ilmenite. The economic viability of the project
has been enhanced by a number of recent
developments including recent advances in
processing technology, and the availability of energy
from the Dampier to Bunbury gas pipeline.
Following the granting of government approvals,
construction work at Windimurra commenced in
mid-1998. Precious Metals Australia Ltd and
Glencore International AG have completed a
feasibility study that included pilot-scale
metallurgical testing. The contract for the rotary kiln
(which will be the world’s largest) has been let to a
Danish company. Total capital costs of the project
are estimated at A$115 million. The scheduled full
production of 16 million lb of V2O5 per year at
Windimurra will represent about 10% of world
production. Its proven ore reserve is considered
adequate for a mine life of 21 years.

Mineral Industry
extend the current 10-year mine life. The mine is
scheduled to commence in mid-2000 and produce
2.5 million tpa of zinc–lead–silver ore.
At Elura, in western New South Wales, production
was mainly from the newly developed Northern
Orebodies. Production from the Main Orebody
continued to be interrupted by the impacts of ground
subsidence that occurred in 1996.
Ground failure also restricted access to high-grade
areas at Rosebery, in western Tasmania, where deep
exploration continued to identify new resources.
In Western Australia, underground mining
commenced at the Pillara deposit (1.5 Mt of ore per
year), in the Kimberley region, in mid-1998. A new
mine was commissioned in late 1998 at Gossan Hill,
east of Geraldton, which boosted ore feed to the
nearby Scuddles mine processing plant.
At the Browns lead–copper–cobalt–nickel deposit
(NT), a final feasibility study is to be completed in
1999, before proposed development of the mine in
2000. It is planned that 1.75 Mt of ore will be mined
per year, and that sulphide concentrate be direct-
smelted into lead bullion and a copper–cobalt–nickel
matte. A further 300 000 t of oxide ore will be
leached by sulphuric acid generated from smelter
gases.
The Woodlawn mine (NSW) ceased operations in
early March 1998, as a result of ground stability
problems at depth and limited reserves.
Mining of the Thalanga base metal deposit, in
central Queensland, ceased in June 1998. The mine’s
plant has been adapted to process ore from the
Highway and Reward copper–gold deposits, 70 km
southwest of Charters Towers.
Mineral industry performance & outlook
The Minerals Council of Australia’s annual industry
survey (MCA 1998) reported that overall mine
production rose by 5.2% in 1997–98, following
growth of 6.8% in the previous year. The report
noted, however, that on all indicators of profitability
the minerals industry performed poorly in the period
under review. Over the past two years, net profit
return on average shareholders’ funds has seen the
two lowest results recorded since the early 1980s
(2.9% in 1996–97 and 1.8% in 1997–98).
Australian mine production statistics for various
commodities in 1998, provided by ABARE, are
summarised in Table 1. Gross nominal value of mine
production in 1997–98 was $39 775 million, an
increase of 13.5% (10.9% in real terms, 1998–99
dollars) over 1996–97 (Waring & Hogan 1999).
Overall, ABARE forecast production of metals and
related minerals to increase by 14% in the five-year
period to 2003–04. Substantial growth in mine
output is projected to occur in the nickel industry
(up by 65%), zinc (up by 39%), copper (up by
17%), and iron ore (up by 15%).
The nominal value of Australia’s mineral and energy
exports increased by 13% (over 11% in real terms)
in 1997–98 to a record of $41.2 billion. Australia’s
total earnings from mineral and energy exports are
forecast by ABARE to fall by 1.8% in 1998–99.
Over the medium term, minerals and energy
earnings are projected to fall by 10% to $36.3
billion (in real terms) between 1998–99 and 2000–
01, before rising to around $37 billion in 2003–04.
Details of production and exports of selected
mineral commodities for 1997–98 are presented in
Table 4.
Overall expenditure in all minerals and energy
industries is expected to fall in 1998–99 (Waring &
Hogan 1999). ABS survey data indicate a likely fall
in capital expenditure of around 23% to $8.5 billion
in that period, and a further decline of 18% to $7
billion in 1999–2000. Capital expenditure at these
levels, while sharply down from 1997–98, remains
relatively high by historic standards. Much of this
expenditure, however, relates to major mining and
processing developments at advanced stages of
development. Recent corporate decisions are likely
to result in further major declines in capital and
exploration expenditure.
Commodities review
4 2

Commodities review
4 3
Table 4 Australian production and exports of selected mineral products 1997-98
Commodity Production Exports Export value million
Aluminium
Bauxite (Mt) 44.878 141
Alumina (Mt) 13537 10.536 2,888
Aluminium (Mt) 1.589 1.236 2,836
Coal
Black raw (Mt) 280.17
Black seable (Mt) 222.45 163.08 9,557
Brown 65.60
Copper
Ores & concentrates (kt) 1,667 1097 822
Refined primary (kt) 284 127 372
Diamond (kc) 43,046 42,483 538
Gold
Mine production (t) 316.15
Refined (t)(a) 348.21 427.7 6242
Iron & Steel
Ore & Pelets (Mt) 159.657 142.208 3,791
Iron & steel (Mt) (b) 16.971 3.347 1,608
Lead
Ores & concentrates (kt) 838 253 140
Refined (kt) 185 177 180
Bullion (kt) 171 167 173
Manganese
Ores & concentrates (Mt) 1,647 1,147 157
Mineral sands
Ilmenite concentrates (kt) 2,352 1,304 139
Rutile concentrates (kt) 242 207 160
Synthetic rutile (kt) 688 501 286
Titanium dioxide pigment (kt) 162 136 346
Zircon concentrates (Kt) 427 396 231
Nickel
Concentrate (kt) 871
Refined (Kt) 182(c) 151 1,103(d)
Uranium (t U3
O8) 5,797 6,415 288
Zinc
Ores & concentrates (Kt) 1,947 1,450 581
Refined (Kt) 304 198 407
na=not available; t=tonnes; kt=102t; Mt= 106t; kc=103 carats
Source; Australian Commodity Statisics ,ABARE, December 1998
(a) Includes gold of Australian and overseas origin (b) Includes 7,545 Mt pig iron and 8.427 Mt raw steel(c) Sum of products in the Intermediate nickel, <99% Ni and >99% Ni categories(d) Sum of all nickel product export values

Plate 11 Exploration drilling by Gympie Gold at Gympie, Queensland
Photograph courtesy of Gympie Gold Limited

MINERAL EXPLORATION IN AUSTRALIA

Exploration
Mineral exploration in Australia
4 6
Exploration expenditure
Mineral exploration expenditure for a range of
commodities is collected by ABS quarterly, and the
following discussion and statistics are based on
survey data for 1997–98 and the first two quarters of
1998–99. The differentiation of commodity groups
before 1980 is based largely on a breakdown of ABS
totals by AGSO.
Mineral exploration expenditure in Australia fell by
7% from $1148.5 million in 1996–97 to $1066.8
million in 1997–98 (Fig. 6). This was the first
annual decrease for 7 years since the relative low
point in 1990–91. Gold was responsible for the bulk
of the decline (down by 11% or $80 million to $648
million), but decreases were also recorded by
diamond ($17 million), coal ($6 million), and other
($12 million). Expenditure on base metals went
against the trend, increasing by $20 million (10%),
and iron ore expenditure rose $4 million (16%).
Uranium exploration expenditure rose by $9 million
(71%) to $22 million. There continued to be very
little interest in tin or tungsten exploration with
expenditure falling to an all time low of $0.1 million.
Exploration expenditure decreased in most States,
except South Australia, where it was up by $10
million or 28%. Exploration expenditure fell most
markedly in Tasmania (20%), Queensland (17%),
Victoria (17%), and the Northern Territory (15%) in
1997–98. Western Australia, with 62% of the total,
was again responsible for most of the expenditure,
followed by Queensland (13%), New South Wales
(8%), the Northern Territory (7%), South Australia (4%).
Gold accounted for 61% of total Australian
exploration expenditure by commodity group in
1997–98, down from 63% in the previous year. It
was followed by a group made up of the base metals
(copper–lead–zinc) plus silver, nickel, and cobalt
representing 21%, coal (6%), and diamond (4%),
while uranium and mineral sands accounted for 2%
and 1% respectively of the total exploration
expenditure.
Expenditure on ‘production leases’ exploration fell
by about $53 million or 17% in 1997–98. In
contrast, exploration expenditure in ‘greenfields’
areas (areas outside production leases) decreased by
only $29 million, or about 3%. Overall, about 24%,
Other
Tin, tungsten, mineral sands, uranium, construction materials
Iron ore
Coal
Diamond
Copper, lead, zinc, silver, nickel, cobalt
Gold
1992-93
0
200
400
600
1000
800
1200Source: ABS
1993-94 1994-95
Year
Exp
en
dit
ure
(m
illio
ns o
f cu
rren
t $)
1995-96 1996-97 1997-98
Figure 6 Australian exploration expenditure since 1992-93
Mineral exploration in Australia

Mineral exploration in Australia
4 7
or $253 million, was spent on ‘production leases’ in
1997–98, while 76% or $814 million was spent on
‘greenfields’ leases.
In constant 1997–98 dollar terms, the rise in
exploration expenditure which began in 1992–93
peaked in 1996–97 (Fig. 7) and began to decline in
1997–98. The ‘real’ level of expenditure in 1996–97
did not reach the level of the all time high attained
in 1981–82.
Exploration expenditure figures published by ABS
for June to December 1998 show a 19% decrease in
overall expenditure, compared with the corresponding
period for 1996–97. Of all the States, Queensland
with a reduction of $36 million (44%) experienced
the largest relative fall in exploration expenditure in
the September and December 1998 quarters
combined compared with the corresponding 1997
quarters. Expenditure in New South Wales in the last
six months of 1998 was also down by $17 million
compared with the same six months in 1997, a 34%
reduction. However, Western Australia’s expenditure
for the same period was down by only $34 million
or 10%. The overall pattern over the last six
quarters has been one of generally declining levels
of expenditure, which appears to reflect the
decreased demand for metals and lower commodity
prices.
Outlook for exploration expenditure
Australia’s aggregate minerals exploration
expenditure is forecast by ABARE to decline sharply
in 1998–99 and 1999–2000, and is expected to
remain at relatively subdued levels over the medium-
term to 2003–04 (Waring 1999).
Although the industry has demonstrated its ability to
respond quickly and flexibly to many and varied
factors in the past, there are lags (usually between 2
to 8 years) between resource discovery and minerals
production. It is important therefore that
governments and industry work cooperatively to
ensure that mineral exploration is maintained at
levels sufficient to allow continuing production and
growth in the industry. Should ABARE’s medium-
term forecast be realised and a downward trend in
expenditure continue beyond 2003–04, the cyclic
periodicity of the last decade would be disrupted
(Fig. 6). This could adversely affect the level of
resource stocks for gold and base metals, where the
links between expenditure and future production are
critical because of the small resource base compared
with current production rates. Levels of Australia’s
Figure 7 Australian exploration expenditure since 1969-70 expressed in 1997-98 dollars
0.0
1970
1972
1974
1976
1978
1980
1982
1984
1986
1988
1990
1992
1994
1996
1998
200.0
400.0
YearSource: ABS (current dollars deflated by Consumer Price Index,
1997-98=100 provided by ABARE)
Gold Copper, lead, zinc, Uranium Other
silver, nickel, cobalt
Ex
pe
nd
itu
re (
mil
lio
n 1
99
7-9
8$
)
600.0
800.0
1000.0
1200.0
1400.0

Exploration
drilling
Australia’s mineral prospectivity within a highly
competitive investment climate.
Exploration drilling
In 1998, AGSO again commissioned ABS to
undertake a survey of exploration and mining
companies to ascertain the amount and type of
exploration drilling carried out in Australia in 1997–
98. The survey was undertaken on behalf of the
Conference of Chief Government Geologists to
enable a State-by-State comparison to be made of
expenditure and metres drilled by type of drilling. A
summary of the data was released by ABS on 22
December 1998 (ABS Catalogue No. 8412.0).
Mineral exploration in Australia
EDR for major commodities like bauxite, iron ore,
and coal are such that any downturn in exploration
over the medium term would not manifest itself in
terms of reduced production.
The Minerals Council of Australia’s survey (MCA
1998) reveals that survey respondents (mostly the
larger Australian mineral companies) are on average
now spending 30 to 40% of their exploration
budgets outside Australia — in 1997–98 respondents
spent $450 million on overseas exploration activities
and $699 million in Australia. Individual major
Australian companies are spending up to at least
85% of their exploration budgets in other countries.
This emphasises the global nature of the minerals
industry and the importance of maintaining
1996-97 1997-98
NSW
State
Perc
en
t
0
10
20
30
40
50
60
Vic Qld SA WA Tas NT
Table 5 Exploration expenditure and exploration drilling, 1997-98
Figure 8 Proportion of Australian exploration expenditure spent on drilling in each State, 1997-98 Vs 1996-97
State Total exploration expenditure Exploration Drilling ($ million) ($ million) ‘000 metres(a)
New South Wales 88.2 36.5 621.5
Victoria 43.1 9.374 200.6
Queensland 133.2 27.419 609.6
South Australia 45 13.528 452.7
Western Australia 660.4 259.88 8475.6
Tasmania 20.7 8.553 94.4
Northern Territory 75.9 23.434 604.8
Australia 1066.8 378.688 11059.1
Note: Totals and sums of components may vary because of rounding. (a) Statistics collected by Australian Bureau of
Statistics for AGSO, on behalf of the Conference of Chief Government Geologists.
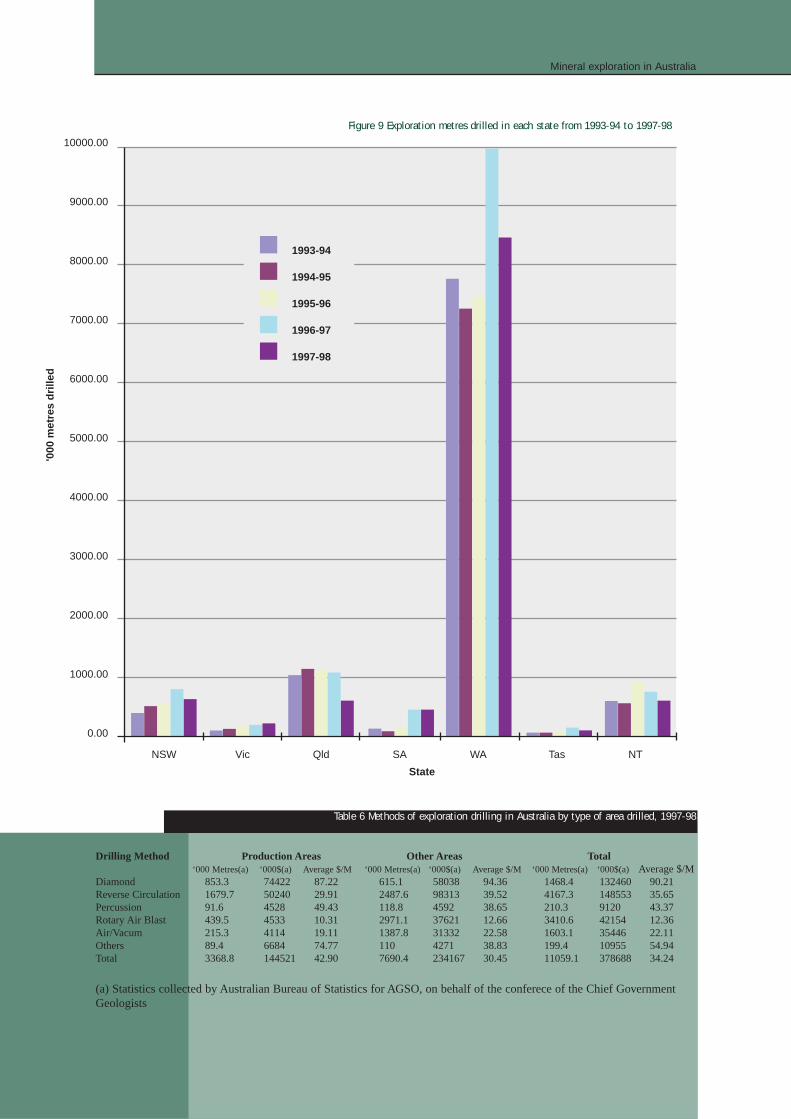
NSW
0.00
1000.00
2000.00
3000.00
4000.00
5000.00
6000.00
7000.00
8000.00
9000.00
10000.00
State
'000 m
etr
es d
rilled
Vic Qld SA WA Tas NT
1993-94
1994-95
1995-96
1996-97
1997-98
Mineral exploration in Australia
Figure 9 Exploration metres drilled in each state from 1993-94 to 1997-98
Table 6 Methods of exploration drilling in Australia by type of area drilled, 1997-98
Drilling Method Production Areas Other Areas Total ‘000 Metres(a) ‘000$(a) Average $/M ‘000 Metres(a) ‘000$(a) Average $/M ‘000 Metres(a) ‘000$(a) Average $/M
Diamond 853.3 74422 87.22 615.1 58038 94.36 1468.4 132460 90.21
Reverse Circulation 1679.7 50240 29.91 2487.6 98313 39.52 4167.3 148553 35.65
Percussion 91.6 4528 49.43 118.8 4592 38.65 210.3 9120 43.37
Rotary Air Blast 439.5 4533 10.31 2971.1 37621 12.66 3410.6 42154 12.36
Air/Vacum 215.3 4114 19.11 1387.8 31332 22.58 1603.1 35446 22.11
Others 89.4 6684 74.77 110 4271 38.83 199.4 10955 54.94
Total 3368.8 144521 42.90 7690.4 234167 30.45 11059.1 378688 34.24
(a) Statistics collected by Australian Bureau of Statistics for AGSO, on behalf of the conferece of the Chief Government
Geologists

Mineral exploration in Australia
5 0
Of the $1066.8 million spent on exploration in
Australia in 1997–98, about $378.7 million (36%)
was spent on drilling, well down on the 42% of the
previous year. A State-by-State breakdown of
drilling expenditure is presented in Table 5. The
highest and lowest proportions of exploration
expenditure directed to drilling within the total
expenditure recorded for each State in 1997–98 were
41.4% in New South Wales and 20.6% in
Queensland (Fig. 8); the proportion in Queensland
was almost half of the previous year. The proportion
of exploration expenditure directed to drilling also
decreased in Western Australia, New South Wales,
and Tasmania.
About 11.06 million metres of exploration drilling
was undertaken in 1997–98, 17% less than in 1996–
97. In 1997–98, about 30% of the metres drilled was
undertaken in production areas (Table 6), compared
with 34% during the previous year. Drilling in
Western Australia accounted for just under 8.5
million metres or 77% of total metres drilled (Fig.
9). In terms of drilling expenditure, Western
Australia was responsible for 69% of the Australian
total. Tasmania and Victoria were each below 3% in
terms of both the proportion of total metres drilled
and the proportion of the total expenditure spent on
drilling, while South Australia increased its
proportion to around 4% of the total for both
expenditure and metres drilled in 1997–98.
Exploration drilling in greenfield areas decreased by
12% in 1997–98, to 7.69 million metres, at a cost of
$234.2 million. This represented about 70% of all
exploration metres drilled; in the previous year, the
proportion of metres drilled in greenfield areas was
lower, at around 66%. Drilling statistics by method
of drilling and type of area are summarised in Table
6 and Figure 10.
Compared with 1996–97, drilling expenditure fell by
21.3% to $378.7 million, and metres drilled
decreased by 17.2% from 13 361 to 11 059 million
metres, in 1997–98. Average drilling costs per metre
for all types of drilling combined fell by almost 5%.
The 17% decrease in total metres drilled in 1997–98
reflected major reductions in all types of drilling
both on production leases and on greenfields areas
(“all other areas”) as a result of cutbacks in
expenditure by mining and exploration companies in
response to lower metal prices.
Diamond RC Percussion RAB Air Core/Vacuum
Other
0
500
1000
1500
2000
2500
3000
'000 m
etr
es d
rilled
Production
Other areas (Greenfields)
RC Reverse Circulation RAB Rotary Airblast
Drilling Method
Figure 10 Australian exploration drilling by drilling method and by type of exploration area during 1997-98

offshore
Mineral exploration in Australia
Offshore mineral exploration inCommonwealth waters
Australia’s Offshore Minerals Act 1994 regulates
exploration for and mining of minerals, other than
petroleum, over the continental shelf three nautical
miles beyond the territorial baselines (generally the
low-water mark) of the States and Territories.
Applications for a mineral exploration licence
(MEL) are made to the designated authority (usually
the relevant State or Territory minister responsible
for mining) with an application fee of $3000. The
application must be made in the approved manner
and must specify details such as:
• block numbers (each block being ~ 4 km2, and
no more than 500 can be applied for with each
application);
• proposed exploration program;
• amount of money allocated to each part of the
program;
• technical qualifications of the applicant and
employees;
• financial resources.
The initial term of a licence is 4 years and it may be
renewed for three 2-year periods, subject to the
licensee’s satisfactory observance of the licence
conditions. There is a mandatory reduction of 50%
of the licence area on renewal of a MEL. However,
it is possible to apply for an extension of term if
activities have been significantly interrupted or
stopped by circumstances beyond the control of the
licensee.
Table 7 Active offshore exploration licences in Commonwealth waters
MEL Date Granted Location Commodity
WA-1 29-Jul-90 120km north of Wyndham, (Ord Prospect) Diamond
WA-4 22-Jun-92 120km northeast of Wyndham, (Victoria Prospect) Diamond
WA-7 10-May-94 140km north northwest of Wyndham, (Berkeley Prospect) Diamond
NT-1 17-Jan-92 170km northeast of Wyndham, (Victoria Prospect) Diamond
NT-2 17-Jan-92 140km northeast of Wyndham (Victoria Prospect) Diamond
NT-3 16-Apr-95 300km northeast of Wyndham (Daly River Prospect) Diamond
NT-4 16-Apr-95 200km northeast of Wyndham (Daly River Prospect) Diamond
T-1 30-Mar-98 Ringarooma Bay, Tasmania Tin
As at 30 April 1999, a total of 64 offshore MEL
applications had been received since February 1990.
Currently there are eight active licences (Table 7), of
which seven permit exploration for economic
deposits of alluvial diamonds in offshore
palaeochannels and tidal shoals in the Joseph
Bonaparte Gulf (northwest Australia). Though no
diamonds so far have been discovered in
Commonwealth waters, gem-quality diamonds have
been discovered adjacent to WA-1-MEL and WA-7-
MEL in State waters.
Most offshore mineral exploration to date has been
based on known distributions of diamonds, gold,
heavy mineral sands, and tin in adjacent onshore
areas. Other mineral commodities with offshore
extensions from known onshore deposits include
tungsten, coal, manganese, and iron ore. Phosphates
and polymetallic manganese nodules (containing
nickel, cobalt, and copper) occur in deep water and
are of potential long-term interest.

Mineral exploration in Australia
5 2
References
Ackland, M., 1997. The Honeymoon project: on the brink
of realisation. The Uranium Institute, 22nd Annual
Symposium, September 1997. London.
BRS, 1998. Australia’s identified mineral resources 1998.
Bureau of Resource Sciences, 50p.
ERA, 1998. Jabiluka mill alternative public environment
report approved. Press Release by ERA Ltd, 27 August
1998.
Heathgate, 1998. Beverley uranium mine. Environmental
impact statement. Heathgate Resources Pty Ltd.
JORC, 1996. Australasian code for reporting of identified
mineral resources and ore reserves (the JORC code).
Report of the joint committee of the Australasian Institute
of Mining & Metallurgy, Australian Institute of
Geoscientists and Minerals Council of Australia. 12p.
MCA, 1998. Minerals industry ’98 survey report. Minerals
Council of Australia, Canberra.
OECD/NEA & IAEA, 1998. Uranium 1997 - Resources,
Production & Demand. OECD Nuclear Energy Agency &
International Atomic Energy Agency, Paris.
Preston, W. A., 1998. Western Australia’s iron ore
industry: planning for the future. Iron Ore and Steel
Forum, Sydney, March 1998.
Shirvington, P., 1997. ERA’s Ranger uranium mine —
exporting Australia’s uranium. Uranium 97 Conference,
Darwin, February 1997.
Southern Cross, 1998a. Mineral resource statement.
Mineral Resource Statement for Billeroo, including the
Goulds Dam Grid Area. Media Statement, 30 April 1998.
Southern Cross Resources Australia Pty Ltd.
Southern Cross, 1998b. Honeymoon Uranium Project.
Declaration of environmental factors. Southern Cross
Resources Australia Pty Ltd. Unpublished report
submitted to the South Australian Government. 31
October 1997.
Waring, T., & Hogan, J., 1999. Minerals and Energy
Outlook to 2003–04. Outlook 99, Minerals and Energy
Volume 3, pp 3-7. Proceedings of the National
Agricultural and Resources Outlook Conference,
Canberra, 17-18 March 1999.
Waring, T., 1999. Minerals and energy: exploration in
Australia. Outlook 99, Minerals and Energy Volume 3, pp
37-50. Proceedings of the National Agricultural and
Resources Outlook Conference, Canberra, 17-18 March
1999.
WMC, 1998. Annual Report to Shareholders 1998.

5 3
Appendix 1: Abbreviations and acronyms
ABARE Australian Bureau of Agricultural and Resource Economics
ABS Australian Bureau of Statistics
BRS Bureau of Resource Sciences
c carat
CSIRO Commonwealth Scientific & Industrial Research Organisation
EAR-1 estimated additional resources - category 1
EDR economic demonstrated resources
GL gigalitre
Gt gigatonne
IAEA International Atomic Energy Agency
kg kilogram
km kilometre
kt kilotonne
L litre
m metre
m3 cubic metre
Mc million carats
MEL mineral exploration licence
mm millimetre
MREB Mineral Resources & Energy Branch
Mt million tonnes
Mtpa million tonnes per annum
MW megawatt
na not available
NSW New South Wales
NT Northern Territory
OECD/NEA Organisation for Economic Cooperation and Development/Nuclear Energy Agency
PGM platinum-group metals
Qld. Queensland
RAB rotary air blast
RAR reasonably assured resources
RC reverse circulation
$ dollar
SA South Australia
SDR Subeconomic demonstrated resources
t tonne
Tas. Tasmania
tpa tonnes per annum
U uranium
U3O8 uranium oxide
USA United States of America
USGS United States Geological Survey
US$ United States of America dollar
Vic. Victoria
WA Western Australia

Introduction
Classification
5 4
Introduction
Australia’s mineral resources are an important
component of its wealth, and knowledge of the
location, quantity and quality of such resources —
including estimates of resources yet to be discovered
— is an essential prerequisite of formulating sound
policies on their use and conservation. Results of
resource assessment can be used also to set priorities
for mineral exploration and research to indicate
mineral potential where alternative land uses are
being considered.
In 1975, the then Bureau of Mineral Resources,
Geology and Geophysics (BMR) adopted, with
minor changes (BMR 1976), the McKelvey resource
classification system used by the US Bureau of
Mines and USGS (USBM/USGS 1980).
Subsequently informal guidelines for using the
system’s definitions were developed and used by
BMR for several years, until the whole system and
its application was reviewed in the light of
accumulated experience. The results of that review
were published (BMR 1984) as the refined BMR
mineral resource classification system for national
resource assessment.
The principles of the McKelvey system, were
retained, as were most of the definitions used by
BMR in its original system, although minor changes
were made to some. Guidelines on applying the
system were established, and adopted. It was
decided that the term ‘reserves’ would not be used
for regional or national aggregates of resources, so
as to avoid the confusion arising from its use with
different meanings in other contexts.
The Bureau of Resource Sciences (BRS) was
formed in 1992 by combining the Mineral and
Petroleum Resource Assessment Branches of the
BMR with the Bureau of Rural Resources. BRS
used the modified McKelvey system in preparing its
annual national assessments of Australia’s identified
mineral resources from 1992 to 1998 Following
administrative changes in the Australian Government
in late 1998, the Mineral and Petroleum Resource
Assessment Branches of BRS were incorporated
into AGSO within the newly created Commonwealth
Department of Industry, Science & Resources.
Estimates prepared by BRS and AGSO are therefore
consistent with earlier estimates prepared by BMR,
which means any analysis of trends is based on
consistent datasets.
Several editions of an industry code for reporting
resources in individual deposits have been
published, the most recent being the 1996 edition
entitled ‘Australasian code for reporting identified
mineral resources and ore reserves’, commonly
referred to as the JORC code. This was a report of a
Joint Committee of the Australasian Institute of
Mining and Metallurgy, the Australian Institute of
Geoscientists, and the Minerals Council of Australia.
The modified McKelvey system and industry codes
are compatible, and data reported for individual
deposits under the industry code are used by AGSO
in the preparation of its assessments of Australia’s
mineral resources.
Classification principles
AGSO classifies known (identified) mineral
resources according to two parameters: degree of
assurance of occurrence (degree of geological
assurance) and degree of economic feasibility of
exploitation. The former takes account of
information on quantity (tonnage) and chemical
composition (grade); the latter takes account of
changing economic factors such as commodity
prices, operating costs, capital costs, and discount
rates.
Resources are classified in accordance with
circumstances at the time of classification.
Appendix 2: National classification system for identified mineral resources

Categories
Terminology
5 5
Resources which are not available for development
at the time of classification because of legal and/or
land-use factors are classified without regard to such
factors; however, the amount of resource thus
affected will, wherever possible, be stated for each
classification category.
The classification framework is designed to
accommodate all naturally occurring metals, non-
metals, and fossil fuels, and to provide a means of
comparing data on different resources which may
have a similar end use (e.g., petroleum, coal, and
uranium as energy sources).
The modified McKelvey system for classifying
identified mineral resources is illustrated below.
Terminology and definitions
RESOURCE — A concentration of naturally occurring
solid, liquid, or gaseous materials in or on the
Earth’s crust and in such form that its economic
extraction is presently or potentially (within a 20–25
year time frame) feasible (see guideline i).
Categories of resources based ondegree of assurance of occurrence
IDENTIFIED RESOURCES — Specific bodies of
mineral-bearing material whose location, quantity,
and quality are known from specific measurements
or estimates from geological evidence. Identified
resources include economic and subeconomic
components. To reflect degrees of geological
assurance, identified resources can be divided into
the following categories:
MEASURED — Resources for which tonnage is
computed from dimensions revealed in outcrops,
trenches, workings, and drillholes, and for which the
grade is computed from the results of detailed
sampling. The sites for inspection, sampling, and
Decreasing degree of goelogical assurance
Dec
reas
ing d
egre
e of
econom
ic f
easi
bil
ity
IDENTIFIED
DEMONSTRATED
MEASURED INDICATED
INFERRED
ECONOM
ICSU
B-E
CONOM
IC
SUB M
ARGIN
AL
PARAM
ARGIN
AL

AGSO
Categories
5 6
measurement are spaced so closely, and the
geological character is so well defined, that size,
shape, and mineral content are well established.
INDICATED — Resources for which tonnage and
grade are computed from information similar to that
used for measured resources, but the sites for
inspection, sampling, and measurement are farther
apart or are otherwise less adequately spaced. The
degree of assurance, although lower than for
resources in the measured category, is high enough
to assume continuity between points of observation.
DEMONSTRATED — A collective term for the sum of
measured and indicated resources.
INFERRED — Resources for which quantitative
estimates are based largely on broad knowledge of
the geological character of the deposit and for which
there are few, if any, samples or measurements. The
estimates are based on an assumed continuity or
repetition for which there is geological evidence.
This evidence may include comparison with deposits
of similar type. Bodies that are completely
concealed may be included if there is specific
geological evidence of their presence. Estimates of
inferred resources should be stated separately and
not combined in a single total with measured or
indicated resources (see guideline ii).
Categories of resources based oneconomic considerations
ECONOMIC — This term implies that, at the time of
determination, profitable extraction or production
under defined investment assumptions has been
established, analytically demonstrated, or assumed
with reasonable certainty (see guideline iii).
SUBECONOMIC — This term refers to those resources
which do not meet the criteria of economic;
subeconomic resources include paramarginal and
submarginal categories.
PARAMARGINAL — That part of subeconomic
resources which, at the time of determination,
almost satisfies the criteria for economic. The main
characteristics of this category are economic
uncertainty and/or failure (albeit just) to meet the
criteria which define economic. Included are
resources which would be producible given
postulated changes in economic or technologic
factors.
SUBMARGINAL— That part of subeconomic
resources that would require a substantially higher
commodity price or some major cost-reducing
advance in technology, to render them economic.
AGSO guidelines for classifyingmineral resources
(i) Use of the term ‘resources’ is restricted to
material, the extraction of which is generally judged
to be potentially economically viable in an arbitrary
time frame of about 20 to 25 years. The term
includes, where appropriate, material such as tailings
and slags. The definition does not intend to imply
that exploitation of any such material will take place
in that time span, but only that its possibility might
reasonably be considered. This guideline attempts to
establish a lower limit to what is worth assessing. It
should be applied on a commodity by commodity
basis to take account of prevailing and prospective
technologies. Material falling outside the category of
resource should be referred to as ‘occurrences’.
Unless otherwise stated, the classification system
refers to in-situ resources. However, it is possible
and in fact desirable to also show recoverable
quantities of resources in each category.
(ii) By definition, inferred resources are classified
as such for want of adequate knowledge and
therefore it may not be feasible to differentiate
between economic and subeconomic inferred
resources. Where inferred resources are shown as
‘undifferentiated’, the amount known or judged to
be economic may be indicated. Such judgements
must take careful account of the commodity being
assessed and its mode of occurrence as these factors
will have a bearing on the reliability of estimates
made. Specifically, grade estimates can be more
reliably made for concordant sedimentary and

References
5 7
biological deposits than for discordant epigenetic
deposits (King et al. 1982, p. 8).
(iii) The definition of ‘economic’ is based on the
important assumption that markets exist for the
commodity concerned. All deposits which are
judged to be exploitable economically at the time of
assessment, whether or not exploitation is
commercially practical, are included in the
economic resources category. It is also assumed that
producers or potential producers will receive the
‘going market price’ for their production. The
classification is therefore based on the concept of
what is judged to be economic rather than what is
considered to be commercial at any particular time.
The information required to make detailed
assessments of economic viability of a particular
deposit is commercially sensitive (e.g., a company’s
costs and required internal rate of return), and these
data may not be available to organisations such as
BRS. Furthermore, as corporate strategies are likely
to be different, individual companies will have
different criteria for what is considered to be
‘economic’. Thus to standardise the approach for
national or regional resource assessments, the
following mineral deposits/situations are accepted
by AGSO, as a general guide, to be economic:
(a) the resources (published or unpublished) of
operating enterprises, whether or not such operations
are sustained by long- or short-term, direct or
indirect, government subsidies;
(b) resources in a deposit which is being developed
for production (i.e., where there is a corporate
commitment to production);
(c) undeveloped resources which are judged to be
economic on the basis of a financial analysis using
actual, estimated, or assumed variables — viz., the
tax rate, capital and operating costs, discount rate
(such as reflects the long-term bond rate),
commodity prices, and depreciation schedules; the
values for the economic variables used in an
assessment must be realistic for the circumstances
prevailing at the time of the assessment;
(d) resources at mines on care-and-maintenance
meeting the criteria outlines in (c) above.
(iv) The term ‘recoverable’ is considered to make
allowance for mining as well as processing losses.
Where a finer distinction needs to be made,
mineable is used to take account of mining losses
and metallurgically recoverable (saleable for coal) is
used to take account of processing losses.
(v) Some minerals derive their economic viability
from their co-product or by-product relationships
with other minerals. Such relationships and
assumptions must be clearly explained in footnotes
or in accompanying text
(vi) National aggregates of resource estimates
should be rounded to the appropriate last significant
digit, so as not to create false impressions of
accuracy.
References
BMR, 1976. BMR adopts new system of resource
classification. Australian Mineral Industry Quarterly,
28(1), 11–13.
BMR, 1984. BMR refines its mineral resource
classification system. Australian Mineral Industry
Quarterly, 36(3) 73–82.
King, H.F., McMahon, D.W. and Bujtor, G.J., 1982.
A guide to the understanding of ore reserve
estimation. Australasian Institute of Mining and
Metallurgy, Melbourne, 21 pp.
USBM/USGS, 1980. Principles of a resource/reserve
classification for minerals. US Geological Survey
Circular 831, 5 pp.

Mineral Resources
National Mineral
Mineral Resources
Australia’s Identified Mineral Resources
5 8
Appendix 3: Staff — Mineral Resources & Energy Program
Director Ian Lambert 6272 3042 [email protected]
Personal Assistant Suzy Obsivac 6272 4391 [email protected]
Mineral Resources & Mining
Bill McKay (Manager) 6272 4020 [email protected]
Bauxite
Mike Huleatt 6272 3245 [email protected]
Gold, iron ore, tantalum, lithium, oil shale, niobium
Lloyd David 6272 4127 [email protected]
Lead, zinc, silver, gem and semiprecious stones, antimony, arsenic,
bismuth, cadmium, selenium, tellurium
Roy Towner 6272 4369 [email protected]
Titanium, zirconium, nickel, rare earths, clays, magnesite, fertiliser
minerals, cobalt, talc, dolomite, peat, limestone, gypsum, silica,
chemical industry minerals and specialty minerals, molybdenum
National Mineral & Energy Databases
Brian Elliott (Manager) 6272 4433 [email protected]
Mineral databases
Stuart Girvan 6272 3243 [email protected]
Mineral databases; tin, platinum-group metals, tungsten, chromium;
potential mineral resources
Maria Fisher 6272 5423 [email protected]
Mineral databases
Mineral Resources Potential & Exploration
Yanis Miezitis (Manager) 6272 5939 [email protected]
Potential mineral resources
Subhash Jaireth 6272 5173 [email protected]
Potential mineral resources

General Contacts
Energy
Australia’s Identified Mineral Resources
5 9
Don Perkin 6272 5815 [email protected]
Exploration, manganese, copper, cobalt; potential mineral resources
Keith Porritt 6272 3044 [email protected]
Geographic information systems; decision support systems
Aden McKay 6272 3045 [email protected]
Uranium, vanadium; potential mineral resources
Ron Sait 6272 5875 [email protected]
Coal, offshore mineral exploration, carbon dioxide capture and disposal;
energy
Neal Evans 6272 5896 [email protected]
Computer geologist; databases; information management; decision support
systems
Andrew Lucas 6272 5371 [email protected]
Computing; geographic information systems; decision support systems
Tim Johns 6271 6428 [email protected]
Computing; geographic information systems; decision support systems
Energy
Leyden Deer 6272 3204 [email protected]
Commercial buildings energy efficiency
General Contacts
Facsimile No: (02) 6272 4161
Postal Address: Australian Geological Survey Organisation
GPO Box 378
Canberra ACT 2601
AUSTRALIA
Location: Cnr Jerrabomberra Ave and Hindmarsh Drive
Symonston ACT 2600
AUSTRALIA
Internet: http://www.agso.gov.au


![Mineral Resources Department, Government of Chhattisgarh...Feb 01, 2018 · Mineral Resources Department, Government of Chhattisgarh has identified the [ ] limestone block for the](https://img.pdfslide.net/doc/110x75/5ffd64fef0b5ce08de68c42d/mineral-resources-department-government-of-chhattisgarh-feb-01-2018-mineral.jpg)