Embed Size (px)
Citation preview

AUSTRALIAN ACADEMY
OF SCIENCEFINANCIAL REPORT 2015–16
FOR THE YEAR ENDING 30 JUNE 2016

© Australian Academy of Science 2017
ISSN 1448-2037
GPO Box 783
Canberra ACT 2601
Tel +61 (0)2 6201 9400
Fax +61 (0)2 6201 9494
Email [email protected]
www.science.org.au
www.science.org.au/annual-and-financial-reports
Independent Audit Report 4Auditor Independence Declaration 6Statement by Council 7Balance Sheet 8Statement of Comprehensive Income 9Statement of Changes in Equity 10Statement of Cash Flows 11Notes to the Financial Statements 12
Contents
3
INDEPENDENT AUDITOR’S REPORT
TO THE MEMBERS OF
AUSTRALIAN ACADEMY OF SCIENCE
We have audited the accompanying financial report of Australian Academy of Science ("the entity"), which comprises the balance sheet as at 30 June 2016, the statement of comprehensive income, statement of changes in equity and statement of cash flows for the year then ended, notes comprising a summary of significant accounting policies and other explanatory information, and the Statement by Council.
Council’s Responsibility for the Financial Report
The Council of the entity is responsible for the preparation of the financial report that gives a true and fair view in accordance with Australian Accounting Standards and the Australian Charities and Not-for-profits Commission Act 2012 (ACNC Act) and for such internal control as the Council determine is necessary to enable the preparation of the financial report that gives a true and fair view and is free from material misstatement, whether due to fraud or error.
Auditor’s Responsibility
Our responsibility is to express an opinion on the financial report based on our audit. We conducted our audit in accordance with Australian Auditing Standards. Those standards require that we comply with relevant ethical requirements relating to audit engagements and plan and perform the audit to obtain reasonable assurance about whether the financial report is free from material misstatement.
An audit involves performing procedures to obtain audit evidence about the amounts and disclosures in the financial report. The procedures selected depend on the auditor's judgement, including the assessment of the risks of material misstatement of the financial report, whether due to fraud or error. In making those risk assessments, the auditor considers internal control relevant to the Council's preparation of the financial report that gives a true and fair view in order to design audit procedures that are appropriate in the circumstances, but not for the purpose of expressing an opinion on the effectiveness of the registered entity's internal control. An audit also includes evaluating the appropriateness of accounting policies used and the reasonableness of accounting estimates made by the Council, as well as evaluating the overall presentation of the financial report.
We believe that the audit evidence we have obtained is sufficient and appropriate to provide a basis for our audit opinion.
4
Opinion
In our opinion the financial report of Australian Academy of Science has been prepared in accordance with the Australian Charities and Not-for-profits Commission Act 2012, including:
a) giving a true and fair view of the registered entity's financial position as at 30 June 2016 and of its financialperformance and cash flows for the year ended on that date; and
b) complying with Australian Accounting Standards and Division 60 of the Australian Charities and Not-for-profits Commission Regulation 2013.
RSM Australia Pty Ltd
Canberra, ACT GED STENHOUSE
Dated: 5 October 2016 Director
5
AUDITOR’S INDEPENDENCE DECLARATION
As lead auditor for the audit of the financial report of the Australian Academy of Science for the year ended 30 June 2016, I declare that, to the best of my knowledge and belief, there have been no contraventions of:
(i) the auditor independence requirements as set out in the Australian Charities and Not-for-profitsCommission Act 2012 in relation to the audit; and
(ii) any applicable code of professional conduct in relation to the audit.
RSM Australian Pty Ltd
Canberra, Australian Capital Territory GED STENHOUSE Date: 5 October 2016 Director
6

Australian Academy of Science
STATEMENT BY COUNCIL
In the opinion of the Council of the Australian Academy of Science (the Academy):
(a) the statements of financial performance for the General Funds, General Purpose Capital Funds, Special Purpose Capital Funds and Grant
Funds are drawn up to give a true and fair view of the results of the Academy for the year ended 30 June 2016;
(b) the balance sheet is drawn up to give a true and fair view of the financial position of the Academy as at 30 June 2016; and
(c) there are reasonable grounds to believe that the Academy will be able to pay its debts as and when they become due and payable.
Signed in accordance with a resolution of the council:
��.E-�/�_r A. Holmes President
0. Mayo
Treasurer
CANBERRA
,.C- October 2016
7
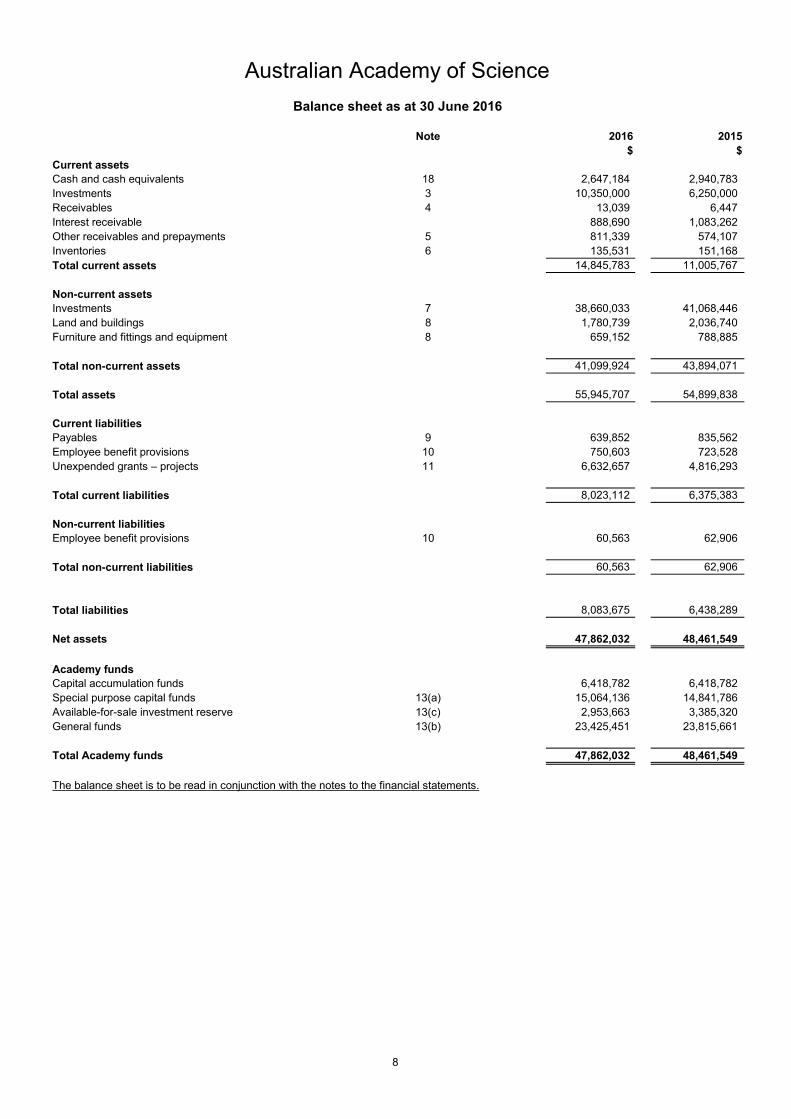
Note 2016 2015$ $
Current assetsCash and cash equivalents 18 2,647,184 2,940,783 Investments 3 10,350,000 6,250,000 Receivables 4 13,039 6,447 Interest receivable 888,690 1,083,262
5 811,339 574,107 Inventories 6 135,531 151,168 Total current assets 14,845,783 11,005,767
Non-current assetsInvestments 7 38,660,033 41,068,446 Land and buildings 8 1,780,739 2,036,740
8 659,152 788,885
Total non-current assets 41,099,924 43,894,071
Total assets 55,945,707 54,899,838
Current liabilitiesPayables 9 639,852 835,562 Employee benefit provisions 10 750,603 723,528 Unexpended grants – projects 11 6,632,657 4,816,293
Total current liabilities 8,023,112 6,375,383
Non-current liabilitiesEmployee benefit provisions 10 60,563 62,906
Total non-current liabilities 60,563 62,906
Total liabilities 8,083,675 6,438,289
Net assets 47,862,032 48,461,549
Academy fundsCapital accumulation funds 6,418,782 6,418,782 Special purpose capital funds 13(a) 15,064,136 14,841,786
13(c) 2,953,663 3,385,320 General funds 13(b) 23,425,451 23,815,661
Total Academy funds 47,862,032 48,461,549 (0) (0)
Available-for-sale investment reserve
The balance sheet is to be read in conjunction with the notes to the financial statements.
Furniture and fittings and equipment
Australian Academy of ScienceBalance sheet as at 30 June 2016
Other receivables and prepayments
8
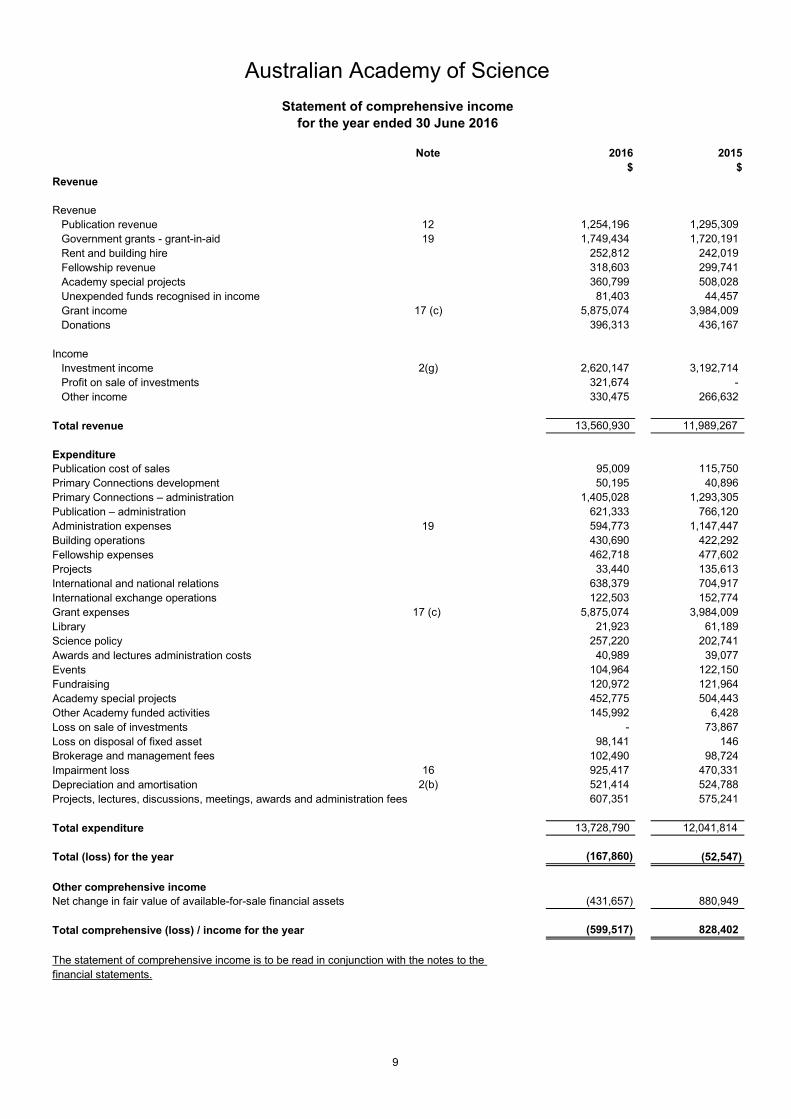
Note 2016 2015$ $
Revenue
RevenuePublication revenue 12 1,254,196 1,295,309 Government grants - grant-in-aid 19 1,749,434 1,720,191 Rent and building hire 252,812 242,019 Fellowship revenue 318,603 299,741 Academy special projects 360,799 508,028
81,403 44,457 17 (c) 5,875,074 3,984,009
Donations 396,313 436,167
Investment income 2(g) 2,620,147 3,192,714 Profit on sale of investments 321,674 -Other income 330,475 266,632
Total revenue 13,560,930 11,989,267
ExpenditurePublication cost of sales 95,009 115,750 Primary Connections development 50,195 40,896 Primary Connections – administration 1,405,028 1,293,305 Publication – administration 621,333 766,120 Administration expenses 19 594,773 1,147,447 Building operations 430,690 422,292 Fellowship expenses 462,718 477,602 Projects 33,440 135,613 International and national relations 638,379 704,917 International exchange operations 122,503 152,774 Grant expenses 17 (c) 5,875,074 3,984,009 Library 21,923 61,189 Science policy 257,220 202,741
40,989 39,077 Events 104,964 122,150 Fundraising 120,972 121,964
452,775 504,443 Other Academy funded activities 145,992 6,428 Loss on sale of investments - 73,867 Loss on disposal of fixed asset 98,141 146 Brokerage and management fees 102,490 98,724 Impairment loss 16 925,417 470,331 Depreciation and amortisation 2(b) 521,414 524,788 Projects, lectures, discussions, meetings, awards and administration fees 607,351 575,241
Total expenditure 13,728,790 12,041,814
(167,860) (52,547)
Other comprehensive incomeNet change in fair value of available-for-sale financial assets (431,657) 880,949
Total comprehensive (loss) / income for the year (599,517) 828,402
Unexpended funds recognised in income
The statement of comprehensive income is to be read in conjunction with the notes to the
Awards and lectures administration costs
Grant income
Academy special projects
Total (loss) for the year
Income
financial statements.
Statement of comprehensive incomefor the year ended 30 June 2016
Australian Academy of Science
9
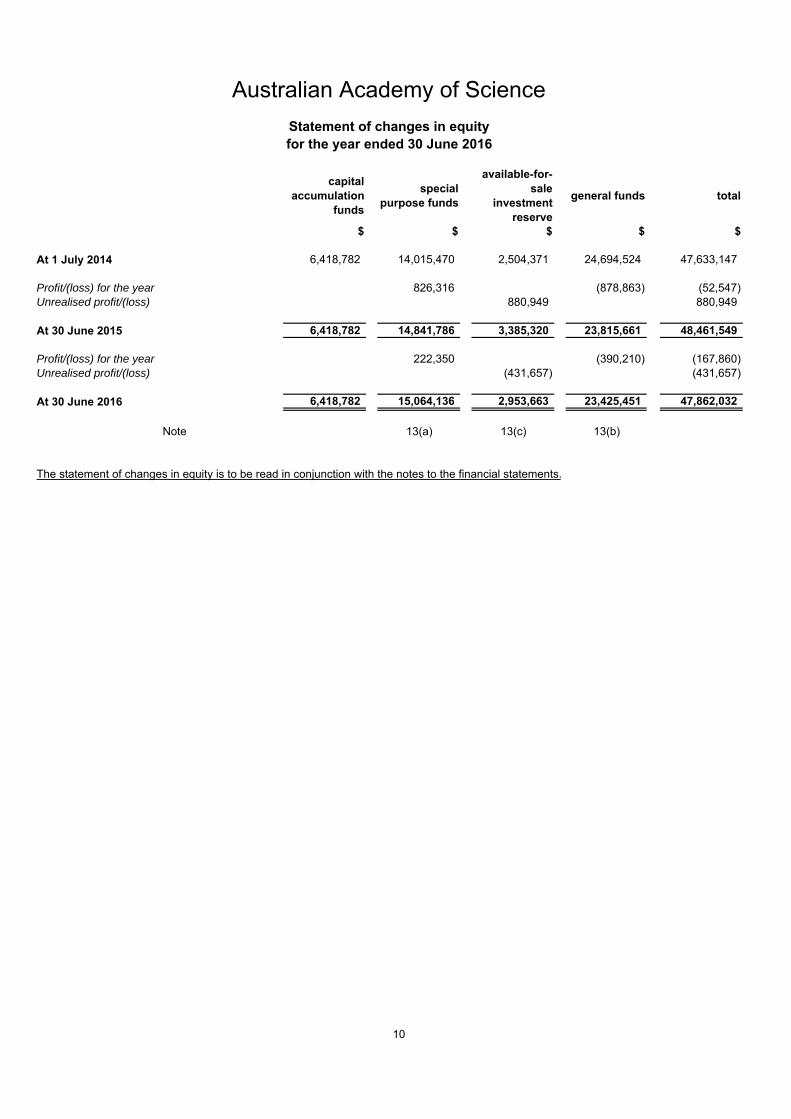
capital accumulation
funds
special purpose funds
available-for- sale
investment reserve
general funds total
$ $ $ $ $
At 1 July 2014 6,418,782 14,015,470 2,504,371 24,694,524 47,633,147
Profit/(loss) for the year 826,316 (878,863) (52,547) Unrealised profit/(loss) 880,949 880,949
At 30 June 2015 6,418,782 14,841,786 3,385,320 23,815,661 48,461,549
Profit/(loss) for the year 222,350 (390,210) (167,860) Unrealised profit/(loss) (431,657) (431,657)
At 30 June 2016 6,418,782 15,064,136 2,953,663 23,425,451 47,862,032
Note 13(a) 13(c) 13(b)
Australian Academy of ScienceStatement of changes in equityfor the year ended 30 June 2016
The statement of changes in equity is to be read in conjunction with the notes to the financial statements.
10
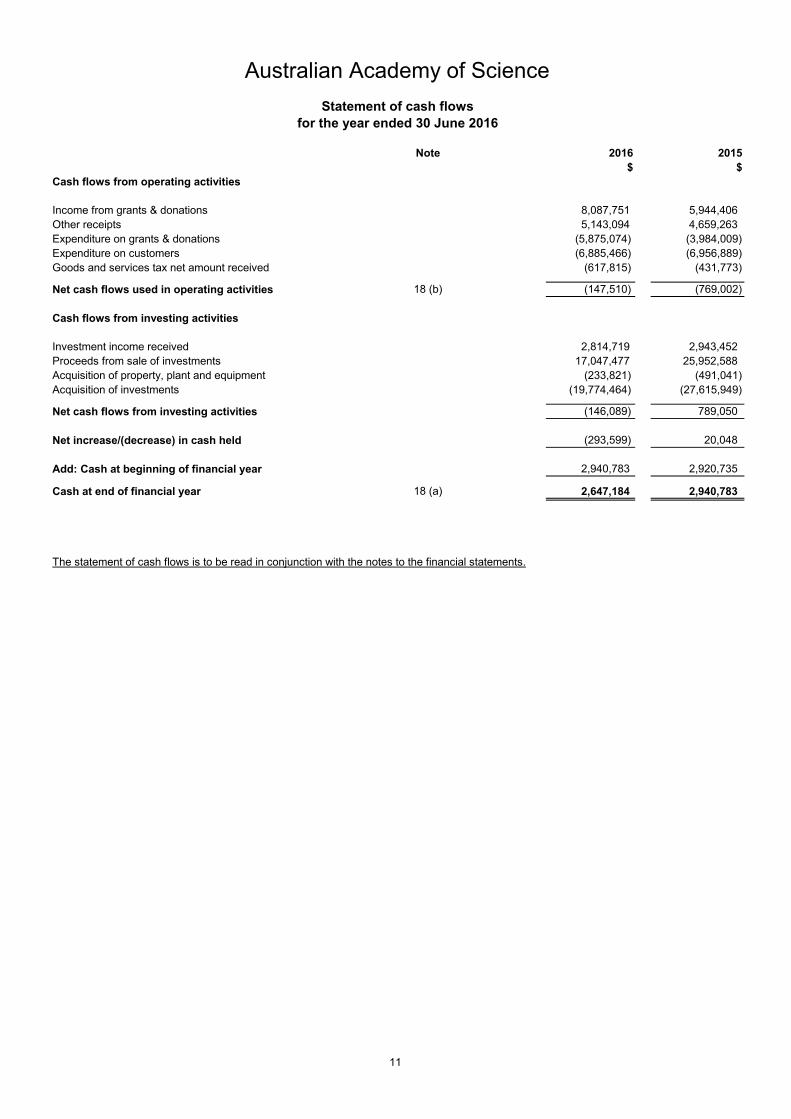
Note 2016 2015$ $
Income from grants & donations 8,087,751 5,944,406 Other receipts 5,143,094 4,659,263
(5,875,074) (3,984,009)Expenditure on customers (6,885,466) (6,956,889)
(617,815) (431,773)
18 (b) (147,510) (769,002)
Investment income received 2,814,719 2,943,452 17,047,477 25,952,588 (233,821) (491,041) (19,774,464) (27,615,949)
(146,089) 789,050
(293,599) 20,048
2,940,783 2,920,735
Cash at end of financial year 18 (a) 2,647,184 2,940,783 - -
The statement of cash flows is to be read in conjunction with the notes to the financial statements.
Cash flows from operating activities
for the year ended 30 June 2016
Australian Academy of ScienceStatement of cash flows
Net cash flows from investing activities
Net increase/(decrease) in cash held
Add: Cash at beginning of financial year
Expenditure on grants & donations
Goods and services tax net amount received
Net cash flows used in operating activities
Acquisition of investments
Cash flows from investing activities
Proceeds from sale of investmentsAcquisition of property, plant and equipment
11
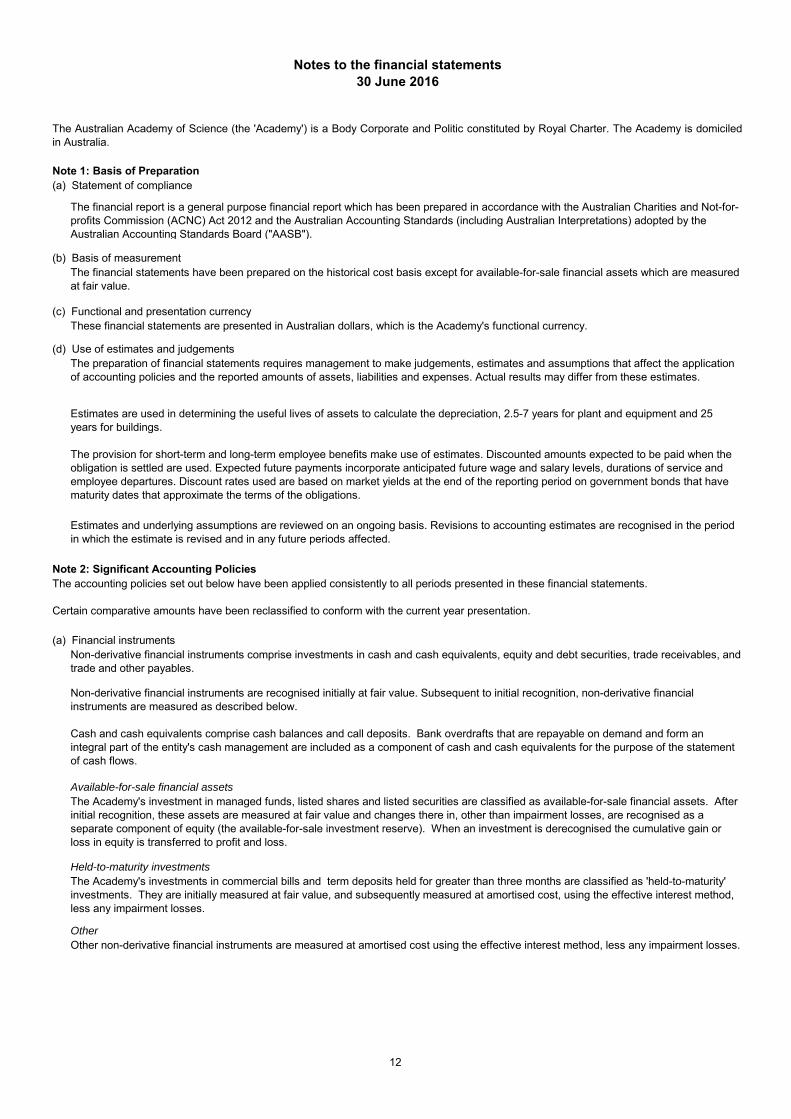
(a) Statement of compliance
(b) Basis of measurement
(a) Financial instruments
These financial statements are presented in Australian dollars, which is the Academy's functional currency.
The preparation of financial statements requires management to make judgements, estimates and assumptions that affect the applicationof accounting policies and the reported amounts of assets, liabilities and expenses. Actual results may differ from these estimates.
The Australian Academy of Science (the 'Academy') is a Body Corporate and Politic constituted by Royal Charter. The Academy is domiciledin Australia.
The Academy's investment in managed funds, listed shares and listed securities are classified as available-for-sale financial assets. Afterinitial recognition, these assets are measured at fair value and changes there in, other than impairment losses, are recognised as aseparate component of equity (the available-for-sale investment reserve). When an investment is derecognised the cumulative gain orloss in equity is transferred to profit and loss.
(c) Functional and presentation currency
(d) Use of estimates and judgements
Estimates and underlying assumptions are reviewed on an ongoing basis. Revisions to accounting estimates are recognised in the period in which the estimate is revised and in any future periods affected.
Note 1: Basis of Preparation
The accounting policies set out below have been applied consistently to all periods presented in these financial statements.
Certain comparative amounts have been reclassified to conform with the current year presentation.
Non-derivative financial instruments comprise investments in cash and cash equivalents, equity and debt securities, trade receivables, andtrade and other payables.
Non-derivative financial instruments are recognised initially at fair value. Subsequent to initial recognition, non-derivative financialinstruments are measured as described below.
Cash and cash equivalents comprise cash balances and call deposits. Bank overdrafts that are repayable on demand and form anintegral part of the entity's cash management are included as a component of cash and cash equivalents for the purpose of the statementof cash flows.
Available-for-sale financial assets
Note 2: Significant Accounting Policies
Notes to the financial statements30 June 2016
The financial report is a general purpose financial report which has been prepared in accordance with the Australian Charities and Not-for-profits Commission (ACNC) Act 2012 and the Australian Accounting Standards (including Australian Interpretations) adopted by theAustralian Accounting Standards Board ("AASB").
Held-to-maturity investmentsThe Academy's investments in commercial bills and term deposits held for greater than three months are classified as 'held-to-maturity'investments. They are initially measured at fair value, and subsequently measured at amortised cost, using the effective interest method,less any impairment losses.
Estimates are used in determining the useful lives of assets to calculate the depreciation, 2.5-7 years for plant and equipment and 25 years for buildings.
The provision for short-term and long-term employee benefits make use of estimates. Discounted amounts expected to be paid when the obligation is settled are used. Expected future payments incorporate anticipated future wage and salary levels, durations of service and employee departures. Discount rates used are based on market yields at the end of the reporting period on government bonds that have maturity dates that approximate the terms of the obligations.
OtherOther non-derivative financial instruments are measured at amortised cost using the effective interest method, less any impairment losses.
The financial statements have been prepared on the historical cost basis except for available-for-sale financial assets which are measuredat fair value.
12
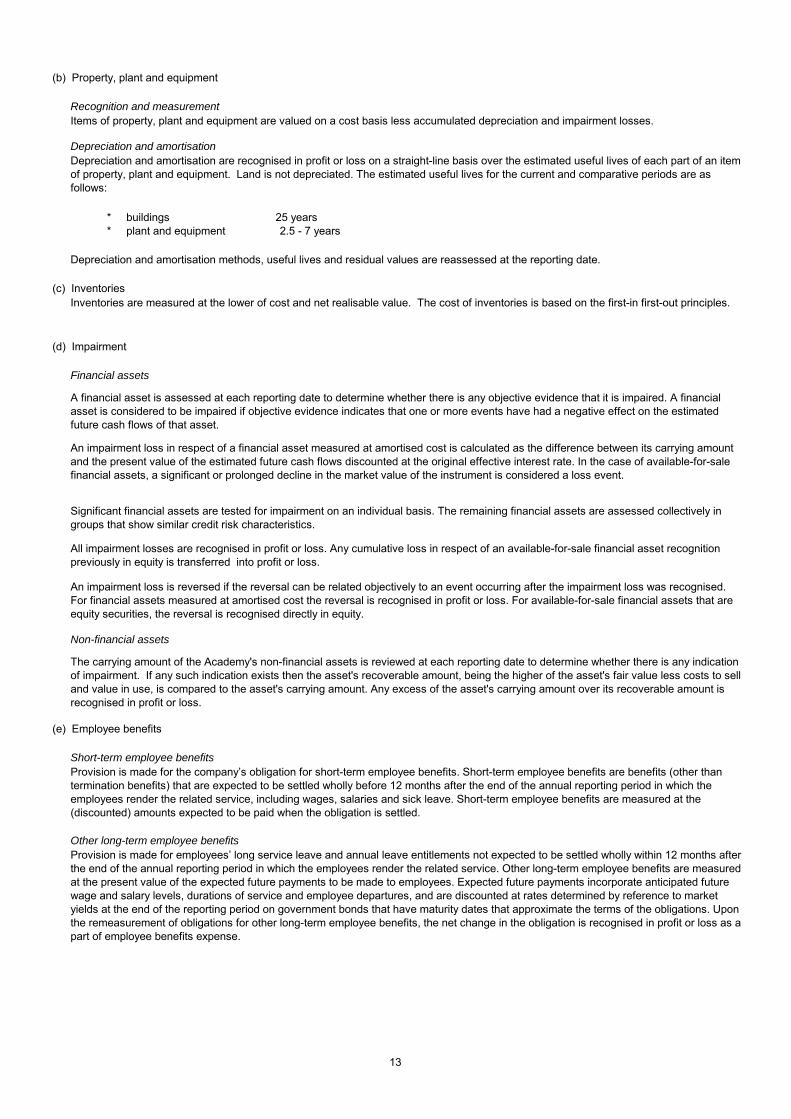
(b) Property, plant and equipment
(c) Inventories
(d) Impairment
(e) Employee benefits
A financial asset is assessed at each reporting date to determine whether there is any objective evidence that it is impaired. A financialasset is considered to be impaired if objective evidence indicates that one or more events have had a negative effect on the estimatedfuture cash flows of that asset.
All impairment losses are recognised in profit or loss. Any cumulative loss in respect of an available-for-sale financial asset recognition previously in equity is transferred into profit or loss.
Depreciation and amortisation
Short-term employee benefits
Provision is made for employees’ long service leave and annual leave entitlements not expected to be settled wholly within 12 months afterthe end of the annual reporting period in which the employees render the related service. Other long-term employee benefits are measuredat the present value of the expected future payments to be made to employees. Expected future payments incorporate anticipated futurewage and salary levels, durations of service and employee departures, and are discounted at rates determined by reference to marketyields at the end of the reporting period on government bonds that have maturity dates that approximate the terms of the obligations. Uponthe remeasurement of obligations for other long-term employee benefits, the net change in the obligation is recognised in profit or loss as apart of employee benefits expense.
An impairment loss is reversed if the reversal can be related objectively to an event occurring after the impairment loss was recognised. For financial assets measured at amortised cost the reversal is recognised in profit or loss. For available-for-sale financial assets that are equity securities, the reversal is recognised directly in equity.
Provision is made for the company’s obligation for short-term employee benefits. Short-term employee benefits are benefits (other thantermination benefits) that are expected to be settled wholly before 12 months after the end of the annual reporting period in which theemployees render the related service, including wages, salaries and sick leave. Short-term employee benefits are measured at the(discounted) amounts expected to be paid when the obligation is settled.
Significant financial assets are tested for impairment on an individual basis. The remaining financial assets are assessed collectively in groups that show similar credit risk characteristics.
The carrying amount of the Academy's non-financial assets is reviewed at each reporting date to determine whether there is any indication of impairment. If any such indication exists then the asset's recoverable amount, being the higher of the asset's fair value less costs to sell and value in use, is compared to the asset's carrying amount. Any excess of the asset's carrying amount over its recoverable amount is recognised in profit or loss.
Non-financial assets
Other long-term employee benefits
* buildings 25 years* plant and equipment 2.5 - 7 years
Items of property, plant and equipment are valued on a cost basis less accumulated depreciation and impairment losses.
Depreciation and amortisation are recognised in profit or loss on a straight-line basis over the estimated useful lives of each part of an itemof property, plant and equipment. Land is not depreciated. The estimated useful lives for the current and comparative periods are asfollows:
Inventories are measured at the lower of cost and net realisable value. The cost of inventories is based on the first-in first-out principles.
Recognition and measurement
Financial assets
Depreciation and amortisation methods, useful lives and residual values are reassessed at the reporting date.
An impairment loss in respect of a financial asset measured at amortised cost is calculated as the difference between its carrying amountand the present value of the estimated future cash flows discounted at the original effective interest rate. In the case of available-for-salefinancial assets, a significant or prolonged decline in the market value of the instrument is considered a loss event.
13
(f) Academy reserves
(g) Revenue
(h) Income tax
(i) Goods and services tax
Includes monies received from interest and dividends. Interest income is recognised as it accrues. Dividend income is recognised whenthe shareholder’s right to receive is established.
At the completion of the grant term where an unexpended balance remains and the Academy is no longer required to acquit the remainingbalance to the grant provider, the amount is recognised as income. The amount is recognised in the year it is deemed not required to berepaid.
Revenue from services rendered is recognised in profit or loss in proportion to the stage of completion of the transaction at the reportingdate.
Revenue from the sale of goods is measured at the fair value of the consideration received or receivable, net of returns and allowances,trade discounts and volume rebates. Revenue is recognised when the significant risks and rewards of ownership have been transferred tothe buyer, recovery of the consideration is probable, the associated costs and possible return of goods can be estimated reliably, and thereis no continuing management involvement with the goods.
These funds include the Academy's asset revaluation and capital input funds.
Receivables and payables are stated with the amount of GST included.
The net amount of GST recoverable from, or payable to, the Australian Taxation Office is included as a current asset or liability in thebalance sheet.
Cash flows are included in the statement of cash flows on a gross basis. The GST components of cash flows arising from investing andfinancing activities that are recoverable from, or payable to, the Australian Taxation Office are classified as operating cash flows.
The Australian Academy of Science is exempt from paying income tax under S.50B of the Income Tax Assessment Act 1997.
Rental income is recognised in the income statement on a straight line basis over the term of the lease.Rental income
General FundsThese funds form the basis of the administration and operations of the Academy. From 2014-15, this has been combined with the GeneralPurpose Capital Funds which were originally established following the receipt of donations and bequests where the Council of theAcademy can at its discretion use the funds received, including interest earnings, to meet the cost of Academy activities and opeations.
Goods (publications)
DonationsDonations are funds or in kind (i.e. shares) received from individuals, trusts and bequests and are recognised on receipt.
Grant incomeThe Academy receives grants from the government and other sources. Grants are treated according to the specifications of the grantfunding deed. Grant income and expenses are recognised as specified by each grant funding deed. Grants required to be returned to thefunding provider due to specific circumstances are treated as unexpended grants which form part of the liabilities in the balance sheet atthe end of the financial year.
The Academy maintains a number of separate funds in order to meet payments for lectures, awards and other activities. They are asfollows:
Investment income
Services
Capital accumulation funds
These funds were established following the receipt of donations and bequests to meet the cost of special purpose lectures, awards andother activities, in accordance with the standing order established for each fund.
Special purpose capital funds
Income, expenses and assets are recognised net of the amount of goods and services tax (GST), except where the amount of GSTincurred is not recoverable from the Australian Taxation Office. In these circumstances, the GST is recognised as part of the cost ofacquisition of the asset or as part of the expense.
Available-for-sale investment reserveThis reserve fund comprises the unrealised profit or loss on the market value of the available-for-sale investments relative to their recognised cost.
14
New Accounting Standards and Interpretations not yet mandatory or early adopted
Australian Accounting Standards and Interpretations that have recently been issued or amended but are not yet mandatory, have not been early adopted by the company for the annual reporting period ended 30 June 2016. The company's assessment of the impact of these new or amended Accounting Standards and Interpretations, most relevant to the company, are set out below.
AASB 9 Financial InstrumentsThis standard is applicable to annual reporting periods beginning on or after 1 January 2018. The standard replaces all previous versions of AASB 9 and completes the project to replace IAS 39 'Financial Instruments: Recognition and Measurement'. AASB 9 introduces new classification and measurement models for financial assets. A financial asset shall be measured at amortised cost, if it is held within a business model whose objective is to hold assets in order to collect contractual cash flows, which arise on specified dates and solely principal and interest. All other financial instrument assets are to be classified and measured at fair value through profit or loss unless the entity makes an irrevocable election on initial recognition to present gains and losses on equity instruments (that are not held-for-trading) in other comprehensive income ('OCI'). For financial liabilities, the standard requires the portion of the change in fair value that relates to the entity's own credit risk to be presented in OCI (unless it would create an accounting mismatch). New simpler hedge accounting requirements are intended to more closely align the accounting treatment with the risk management activities of the entity. New impairment requirements will use an 'expected credit loss' ('ECL') model to recognise an allowance. Impairment will be measured under a 12-month ECL method unless the credit risk on a financial instrument has increased significantly since initial recognition in which case the lifetime ECL method is adopted. The standard introduces additional new disclosures. The company will adopt this standard from 1 July 2018 but the impact of its adoption is yet to be assessed by the company.
AASB 15 Revenue from Contracts with CustomersThis standard is applicable to annual reporting periods beginning on or after 1 January 2018. The standard provides a single standard for revenue recognition. The core principle of the standard is that an entity will recognise revenue to depict the transfer of promised goods or services to customers in an amount that reflects the consideration to which the entity expects to be entitled in exchange for those goods or services. The standard will require: contracts (either written, verbal or implied) to be identified, together with the separate performance obligations within the contract; determine the transaction price, adjusted for the time value of money excluding credit risk; allocation of the transaction price to the separate performance obligations on a basis of relative stand-alone selling price of each distinct good or service, or estimation approach if no distinct observable prices exist; and recognition of revenue when each performance obligation is satisfied. Credit risk will be presented separately as an expense rather than adjusted to revenue. For goods, the performance obligation would be satisfied when the customer obtains control of the goods. For services, the performance obligation is satisfied when the service has been provided, typically for promises to transfer services to customers. For performance obligations satisfied over time, an entity would select an appropriate measure of progress to determine how much revenue should be recognised as the performance obligation is satisfied. Contracts with customers will be presented in an entity's statement of financial position as a contract liability, a contract asset, or a receivable, depending on the relationship between the entity's performance and the customer's payment. Sufficient quantitative and qualitative disclosure is required to enable users to understand the contracts with customers; the significant judgments made in applying the guidance to those contracts; and any assets recognised from the costs to obtain or fulfil a contract with a customer. The company will adopt this standard from 1 July 2018 but the impact of its adoption is yet to be assessed by the company.
AASB 16 LeasesThis standard is applicable to annual reporting periods beginning on or after 1 January 2019. The standard replaces AASB 117 'Leases' and for lessees will eliminate the classifications of operating leases and finance leases. Subject to exceptions, a 'right-of-use' asset will be capitalised in the statement of financial position, measured as the present value of the unavoidable future lease payments to be made over the lease term. The exceptions relate to short-term leases of 12 months or less and leases of low-value assets (such as personal computers and small office furniture) where an accounting policy choice exists whereby either a 'right-of-use' asset is recognised or lease payments are expensed to profit or loss as incurred. A liability corresponding to the capitalised lease will also be recognised, adjusted for lease prepayments, lease incentives received, initial direct costs incurred and an estimate of any future restoration, removal or dismantling costs. Straight-line operating lease expense recognition will be replaced with a depreciation charge for the leased asset (included in operating costs) and an interest expense on the recognised lease liability (included in finance costs). In the earlier periods of the lease, the expenses associated with the lease under AASB 16 will be higher when compared to lease expenses under AASB 117. For classification within the statement of cash flows, the lease payments will be separated into both a principal (financing activities) and interest (either operating or financing activities) component. For lessor accounting, the standard does not substantially change how a lessor accounts for leases. The company will adopt this standard from 1 July 2019 but the impact of its adoption is yet to be assessed by the company.
15
Note 2016 2015$ $
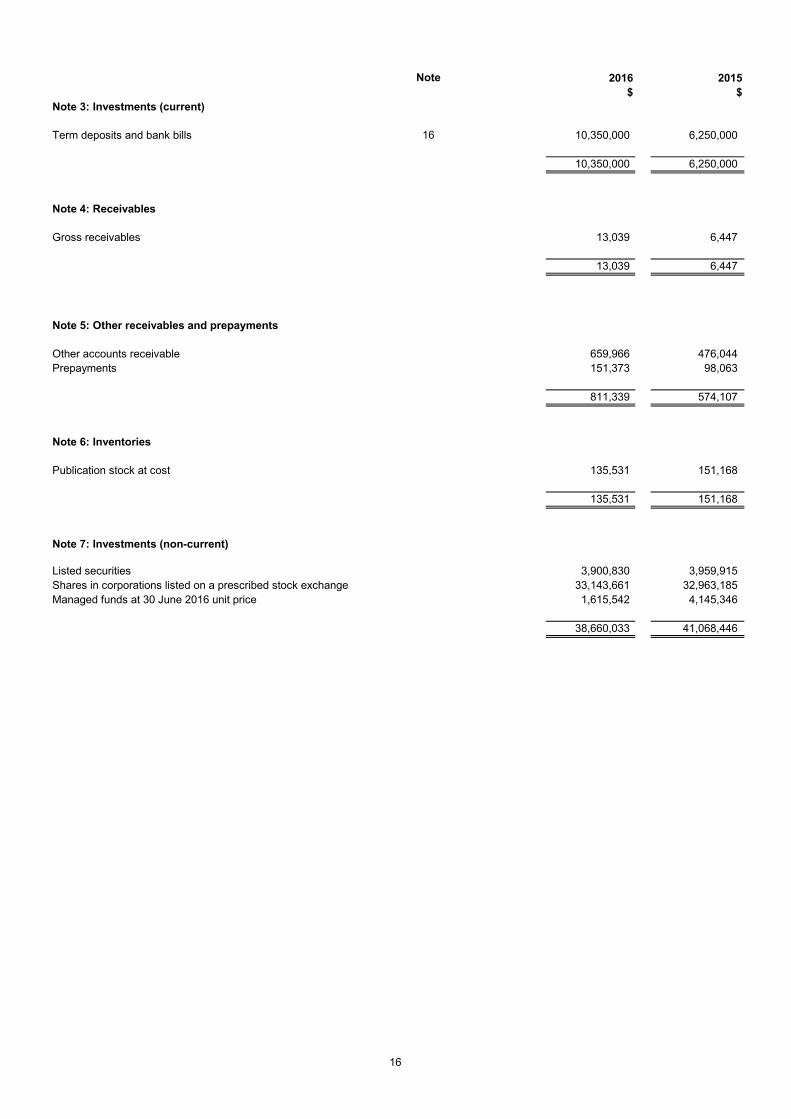
16 10,350,000 6,250,000
10,350,000 6,250,000
Note 4: Receivables
Gross receivables 13,039 6,447
13,039 6,447
Note 5: Other receivables and prepayments
Other accounts receivable 659,966 476,044 Prepayments 151,373 98,063
811,339 574,107
Note 6: Inventories
Publication stock at cost 135,531 151,168
135,531 151,168
Listed securities 3,900,830 3,959,915 33,143,661 32,963,185 1,615,542 4,145,346
38,660,033 41,068,446
Note 7: Investments (non-current)
Shares in corporations listed on a prescribed stock exchange
Note 3: Investments (current)
Managed funds at 30 June 2016 unit price
Term deposits and bank bills
16
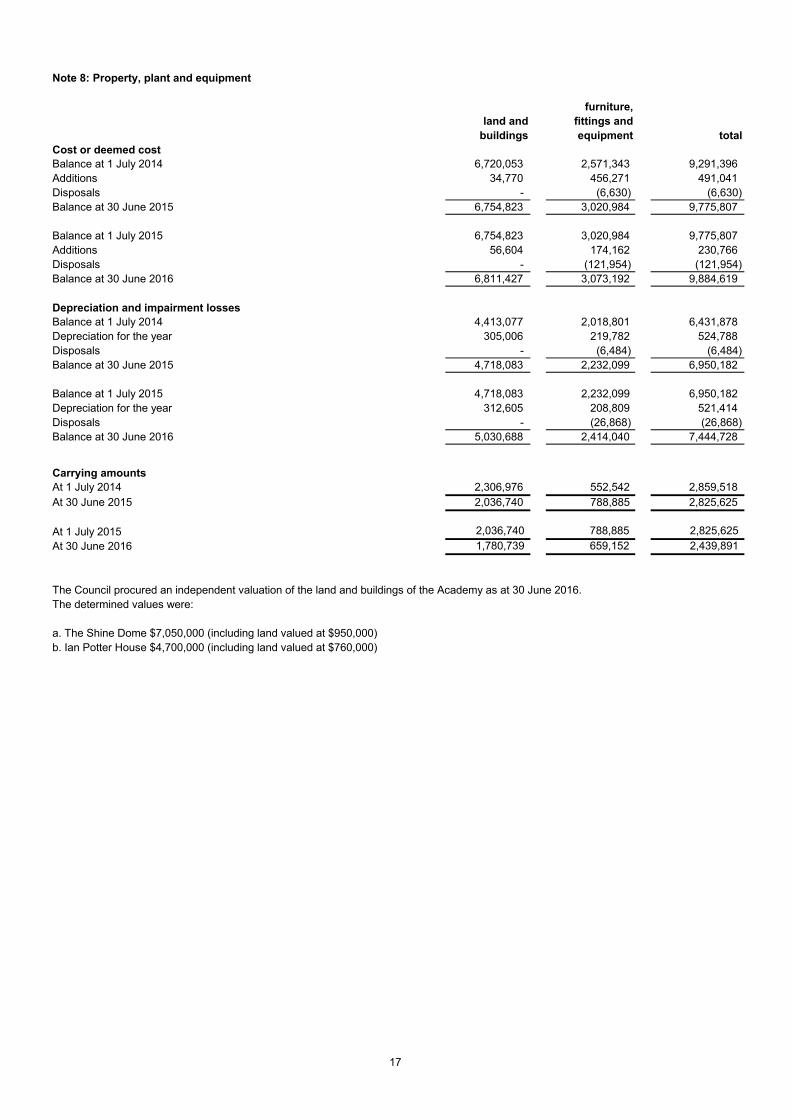
furniture,land and fittings and
buildings equipment totalCost or deemed cost
6,720,053 2,571,343 9,291,396 Additions 34,770 456,271 491,041 Disposals - (6,630) (6,630)Balance at 30 June 2015 6,754,823 3,020,984 9,775,807
6,754,823 3,020,984 9,775,807 Additions 56,604 174,162 230,766 Disposals - (121,954) (121,954)Balance at 30 June 2016 6,811,427 3,073,192 9,884,619
4,413,077 2,018,801 6,431,878 305,006 219,782 524,788
Disposals - (6,484) (6,484)Balance at 30 June 2015 4,718,083 2,232,099 6,950,182
4,718,083 2,232,099 6,950,182 312,605 208,809 521,414
Disposals - (26,868) (26,868)Balance at 30 June 2016 5,030,688 2,414,040 7,444,728
2,306,976 552,542 2,859,518 At 30 June 2015 2,036,740 788,885 2,825,625
At 1 July 2015 2,036,740 788,885 2,825,625 At 30 June 2016 1,780,739 659,152 2,439,891
The Council procured an independent valuation of the land and buildings of the Academy as at 30 June 2016.The determined values were:
a. The Shine Dome $7,050,000 (including land valued at $950,000)b. Ian Potter House $4,700,000 (including land valued at $760,000)
Carrying amountsAt 1 July 2014
Note 8: Property, plant and equipment
Balance at 1 July 2015
Depreciation and impairment losses
Depreciation for the yearBalance at 1 July 2015
Balance at 1 July 2014
Balance at 1 July 2014Depreciation for the year
17
2016 2015 $ $
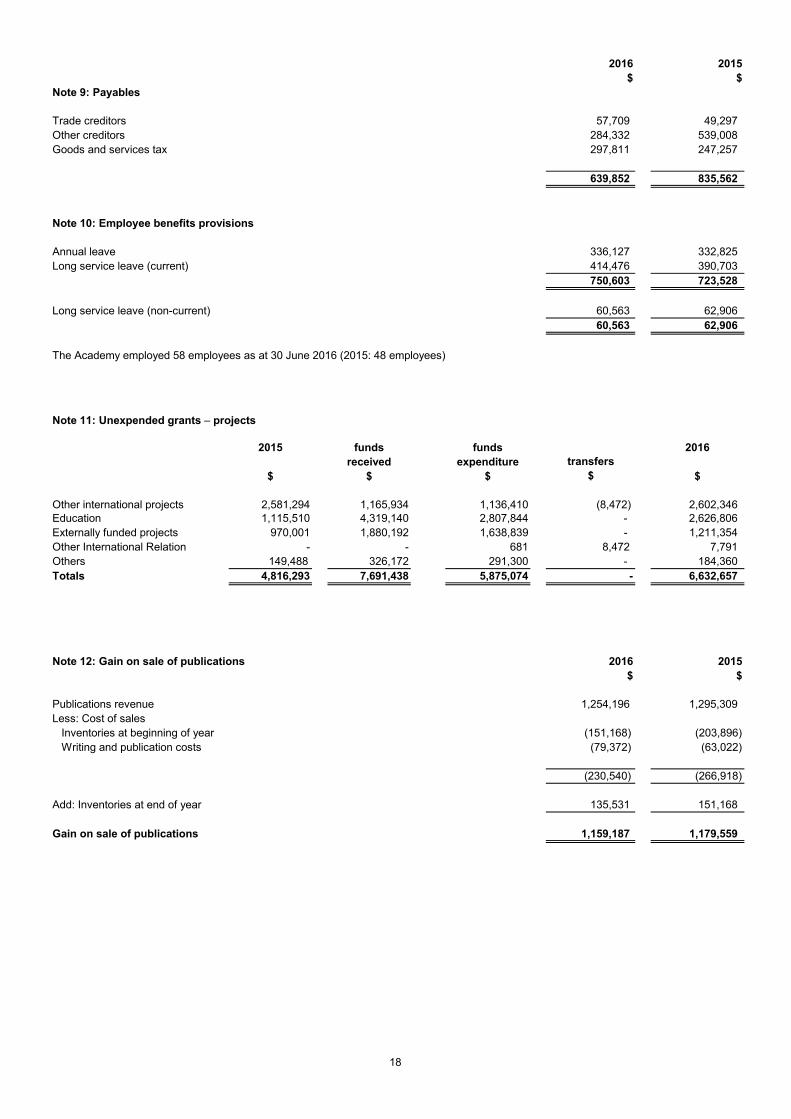
Note 9: Payables
Trade creditors 57,709 49,297 Other creditors 284,332 539,008 Goods and services tax 297,811 247,257
639,852 835,562
Annual leave 336,127 332,825 Long service leave (current) 414,476 390,703
750,603 723,528
Long service leave (non-current) 60,563 62,906 60,563 62,906
2015 funds funds 2016received expenditure transfers
$ $ $ $ $
Other international projects 2,581,294 1,165,934 1,136,410 (8,472) 2,602,346 Education 1,115,510 4,319,140 2,807,844 - 2,626,806Externally funded projects 970,001 1,880,192 1,638,839 - 1,211,354Other International Relation - - 681 8,472 7,791 Others 149,488 326,172 291,300 - 184,360Totals 4,816,293 7,691,438 5,875,074 - 6,632,657
2016 2015$ $
Publications revenue 1,254,196 1,295,309 Less: Cost of sales
Inventories at beginning of year (151,168) (203,896)Writing and publication costs (79,372) (63,022)
(230,540) (266,918)
Add: Inventories at end of year 135,531 151,168
Gain on sale of publications 1,159,187 1,179,559
Note 10: Employee benefits provisions
The Academy employed 58 employees as at 30 June 2016 (2015: 48 employees)
Note 11: Unexpended grants – projects
Note 12: Gain on sale of publications
IGBP and WCRP project was consolidated with Externally funded projects in the 2015 opening balance as the project has now been closed in the current financial year.
18
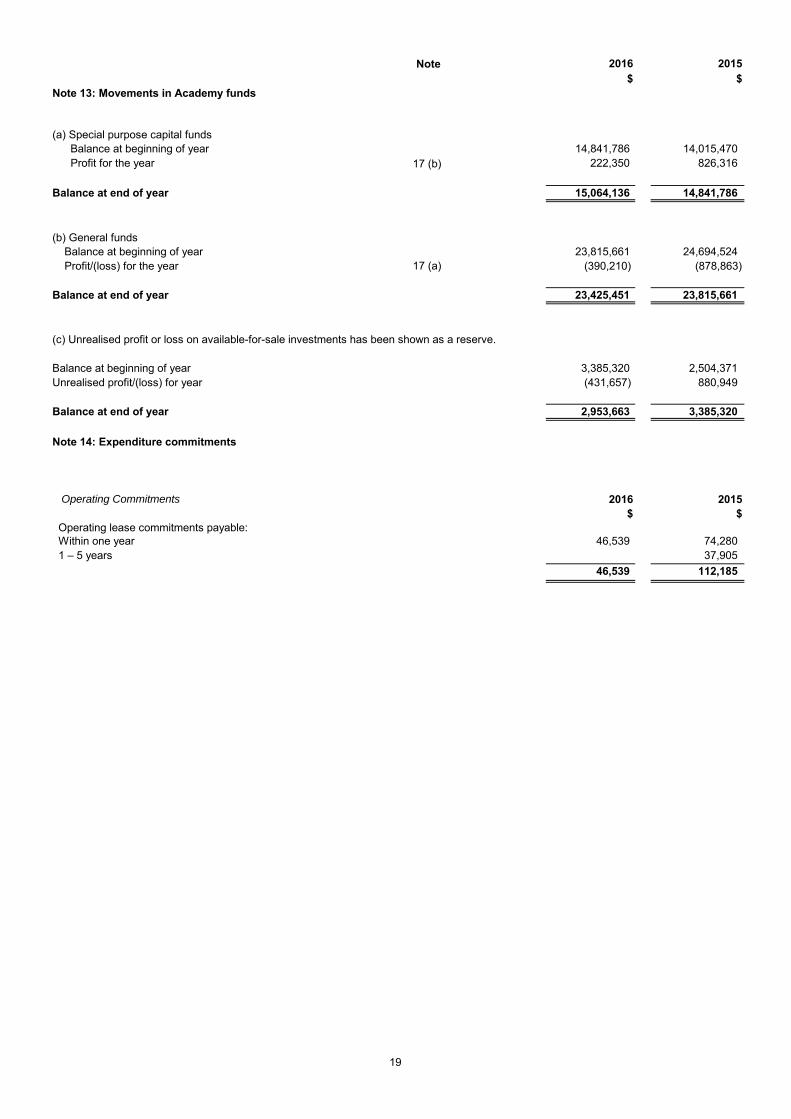
Note 2016 2015$ $
(a) Special purpose capital fundsBalance at beginning of year 14,841,786 14,015,470 Profit for the year 17 (b) 222,350 826,316
Balance at end of year 15,064,136 14,841,786
(b) General fundsBalance at beginning of year 23,815,661 24,694,524 Profit/(loss) for the year 17 (a) (390,210) (878,863)
Balance at end of year 23,425,451 23,815,661
Balance at beginning of year 3,385,320 2,504,371 Unrealised profit/(loss) for year (431,657) 880,949
Balance at end of year 2,953,663 3,385,320
Operating Commitments 2016 2015$ $
Within one year 46,539 74,280 1 – 5 years 37,905
46,539 112,185
(c) Unrealised profit or loss on available-for-sale investments has been shown as a reserve.
Operating lease commitments payable:
Note 14: Expenditure commitments
Note 13: Movements in Academy funds
19
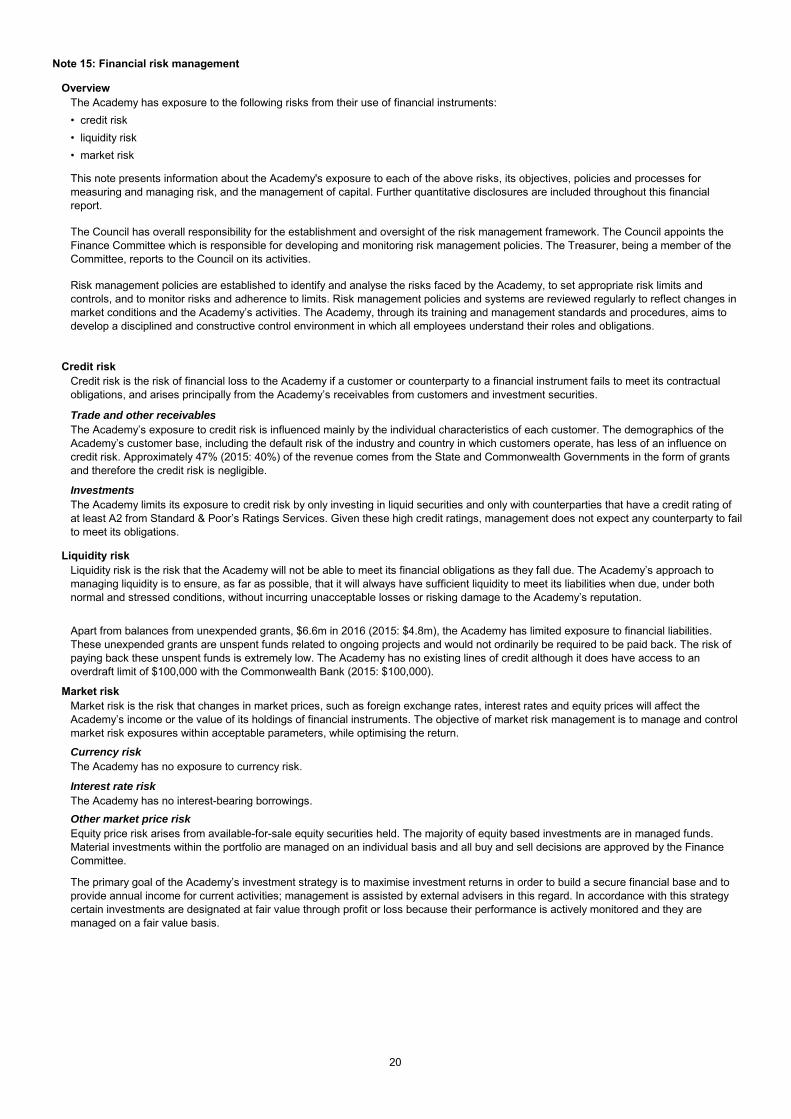
Overview
Credit risk
Trade and other receivables
Investments
Liquidity risk
Market risk
Currency risk
Interest rate risk
Other market price risk
Note 15: Financial risk management
Credit risk is the risk of financial loss to the Academy if a customer or counterparty to a financial instrument fails to meet its contractual obligations, and arises principally from the Academy’s receivables from customers and investment securities.
The Academy’s exposure to credit risk is influenced mainly by the individual characteristics of each customer. The demographics of the Academy’s customer base, including the default risk of the industry and country in which customers operate, has less of an influence on credit risk. Approximately 47% (2015: 40%) of the revenue comes from the State and Commonwealth Governments in the form of grants and therefore the credit risk is negligible.
Apart from balances from unexpended grants, $6.6m in 2016 (2015: $4.8m), the Academy has limited exposure to financial liabilities. These unexpended grants are unspent funds related to ongoing projects and would not ordinarily be required to be paid back. The risk of paying back these unspent funds is extremely low. The Academy has no existing lines of credit although it does have access to an overdraft limit of $100,000 with the Commonwealth Bank (2015: $100,000).
Risk management policies are established to identify and analyse the risks faced by the Academy, to set appropriate risk limits and controls, and to monitor risks and adherence to limits. Risk management policies and systems are reviewed regularly to reflect changes in market conditions and the Academy’s activities. The Academy, through its training and management standards and procedures, aims to develop a disciplined and constructive control environment in which all employees understand their roles and obligations.
The Council has overall responsibility for the establishment and oversight of the risk management framework. The Council appoints the Finance Committee which is responsible for developing and monitoring risk management policies. The Treasurer, being a member of the Committee, reports to the Council on its activities.
The primary goal of the Academy’s investment strategy is to maximise investment returns in order to build a secure financial base and to provide annual income for current activities; management is assisted by external advisers in this regard. In accordance with this strategy certain investments are designated at fair value through profit or loss because their performance is actively monitored and they are managed on a fair value basis.
• liquidity risk
The Academy has no interest-bearing borrowings.
Equity price risk arises from available-for-sale equity securities held. The majority of equity based investments are in managed funds. Material investments within the portfolio are managed on an individual basis and all buy and sell decisions are approved by the Finance Committee.
The Academy has no exposure to currency risk.
• market risk
This note presents information about the Academy's exposure to each of the above risks, its objectives, policies and processes for measuring and managing risk, and the management of capital. Further quantitative disclosures are included throughout this financial report.
Liquidity risk is the risk that the Academy will not be able to meet its financial obligations as they fall due. The Academy’s approach to managing liquidity is to ensure, as far as possible, that it will always have sufficient liquidity to meet its liabilities when due, under both normal and stressed conditions, without incurring unacceptable losses or risking damage to the Academy’s reputation.
The Academy has exposure to the following risks from their use of financial instruments:• credit risk
The Academy limits its exposure to credit risk by only investing in liquid securities and only with counterparties that have a credit rating of at least A2 from Standard & Poor’s Ratings Services. Given these high credit ratings, management does not expect any counterparty to fail to meet its obligations.
Market risk is the risk that changes in market prices, such as foreign exchange rates, interest rates and equity prices will affect the Academy’s income or the value of its holdings of financial instruments. The objective of market risk management is to manage and control market risk exposures within acceptable parameters, while optimising the return.
20
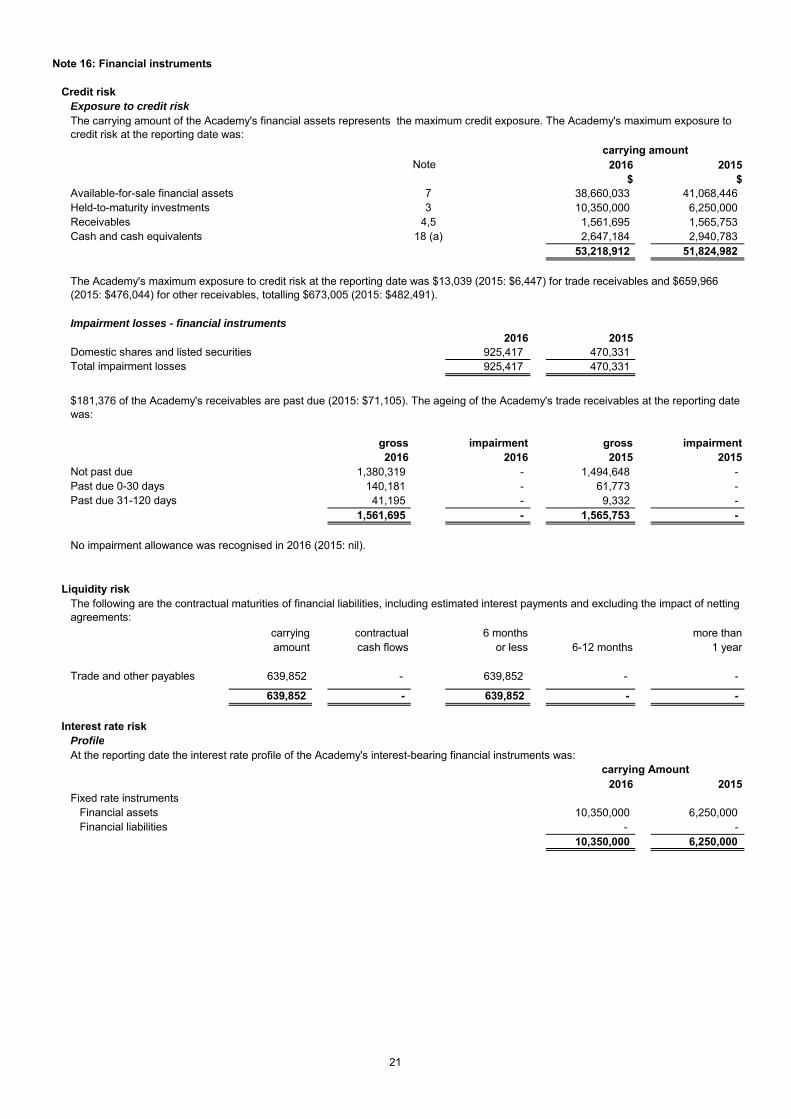
Credit riskExposure to credit risk
Note 2016 2015$ $
Available-for-sale financial assets 7 38,660,033 41,068,446 Held-to-maturity investments 3 10,350,000 6,250,000 Receivables 4,5 1,561,695 1,565,753 Cash and cash equivalents 18 (a) 2,647,184 2,940,783
53,218,912 51,824,982
Impairment losses - financial instruments2016 2015
Domestic shares and listed securities 925,417 470,331 Total impairment losses 925,417 470,331
gross impairment gross impairment2016 2016 2015 2015
Not past due 1,380,319 - 1,494,648 - Past due 0-30 days 140,181 - 61,773 - Past due 31-120 days 41,195 - 9,332 -
1,561,695 - 1,565,753 -
Liquidity risk
carrying contractual 6 months more thanamount cash flows or less 6-12 months 1 year
Trade and other payables 639,852 - 639,852 - -
639,852 - 639,852 - -
Interest rate riskProfile
2016 2015Fixed rate instruments
Financial assets 10,350,000 6,250,000 Financial liabilities - -
10,350,000 6,250,000
Note 16: Financial instruments
No impairment allowance was recognised in 2016 (2015: nil).
$181,376 of the Academy's receivables are past due (2015: $71,105). The ageing of the Academy's trade receivables at the reporting date was:
The carrying amount of the Academy's financial assets represents the maximum credit exposure. The Academy's maximum exposure to credit risk at the reporting date was:
carrying AmountAt the reporting date the interest rate profile of the Academy's interest-bearing financial instruments was:
carrying amount
The Academy's maximum exposure to credit risk at the reporting date was $13,039 (2015: $6,447) for trade receivables and $659,966 (2015: $476,044) for other receivables, totalling $673,005 (2015: $482,491).
The following are the contractual maturities of financial liabilities, including estimated interest payments and excluding the impact of netting agreements:
21
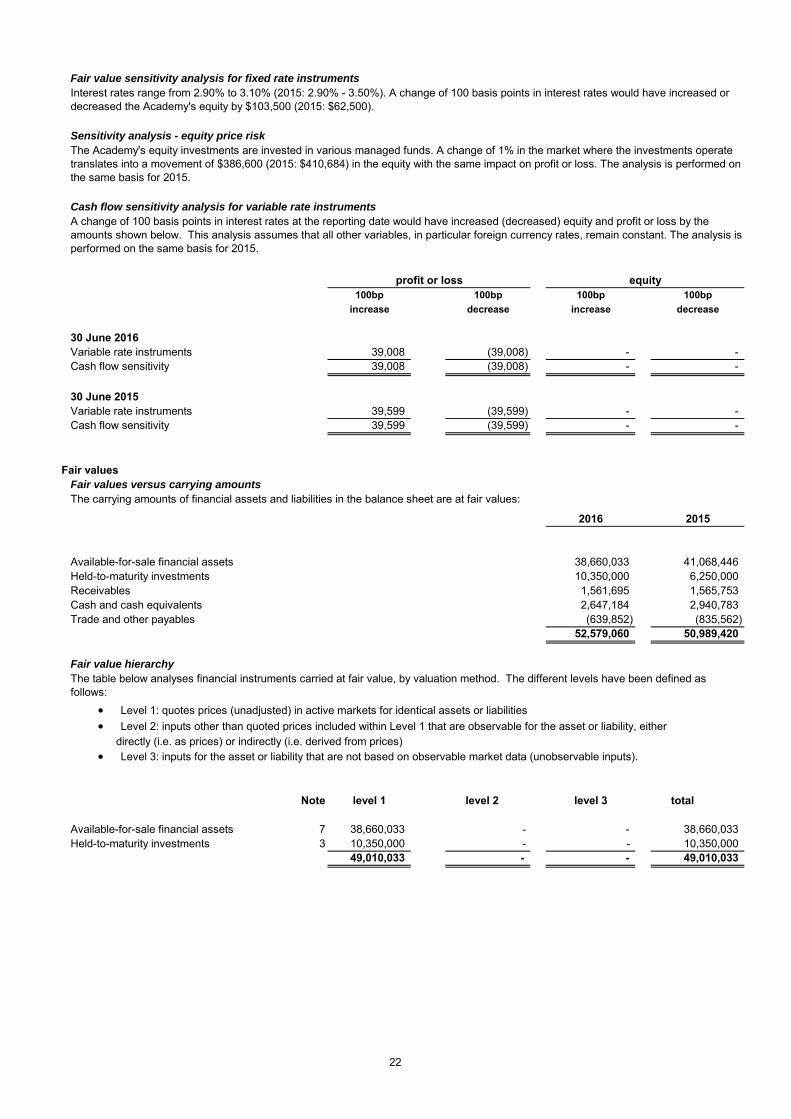
Fair value sensitivity analysis for fixed rate instruments
Sensitivity analysis - equity price risk
Cash flow sensitivity analysis for variable rate instruments
100bp 100bp 100bp 100bpincrease decrease increase decrease
30 June 2016Variable rate instruments 39,008 (39,008) - -Cash flow sensitivity 39,008 (39,008) - -
30 June 2015Variable rate instruments 39,599 (39,599) - -Cash flow sensitivity 39,599 (39,599) - -
Fair valuesFair values versus carrying amounts
2016 2015
Available-for-sale financial assets 38,660,033 41,068,446 Held-to-maturity investments 10,350,000 6,250,000 Receivables 1,561,695 1,565,753 Cash and cash equivalents 2,647,184 2,940,783 Trade and other payables (639,852) (835,562)
52,579,060 50,989,420
Fair value hierarchy
• Level 1: quotes prices (unadjusted) in active markets for identical assets or liabilities• Level 2: inputs other than quoted prices included within Level 1 that are observable for the asset or liability, either
directly (i.e. as prices) or indirectly (i.e. derived from prices)• Level 3: inputs for the asset or liability that are not based on observable market data (unobservable inputs).
Note level 1 level 2 level 3 total
Available-for-sale financial assets 7 38,660,033 - - 38,660,033 Held-to-maturity investments 3 10,350,000 - - 10,350,000
49,010,033 - - 49,010,033
Interest rates range from 2.90% to 3.10% (2015: 2.90% - 3.50%). A change of 100 basis points in interest rates would have increased or decreased the Academy's equity by $103,500 (2015: $62,500).
The table below analyses financial instruments carried at fair value, by valuation method. The different levels have been defined as follows:
The carrying amounts of financial assets and liabilities in the balance sheet are at fair values:
A change of 100 basis points in interest rates at the reporting date would have increased (decreased) equity and profit or loss by the amounts shown below. This analysis assumes that all other variables, in particular foreign currency rates, remain constant. The analysis is performed on the same basis for 2015.
equity
The Academy's equity investments are invested in various managed funds. A change of 1% in the market where the investments operate translates into a movement of $386,600 (2015: $410,684) in the equity with the same impact on profit or loss. The analysis is performed on the same basis for 2015.
profit or loss
22
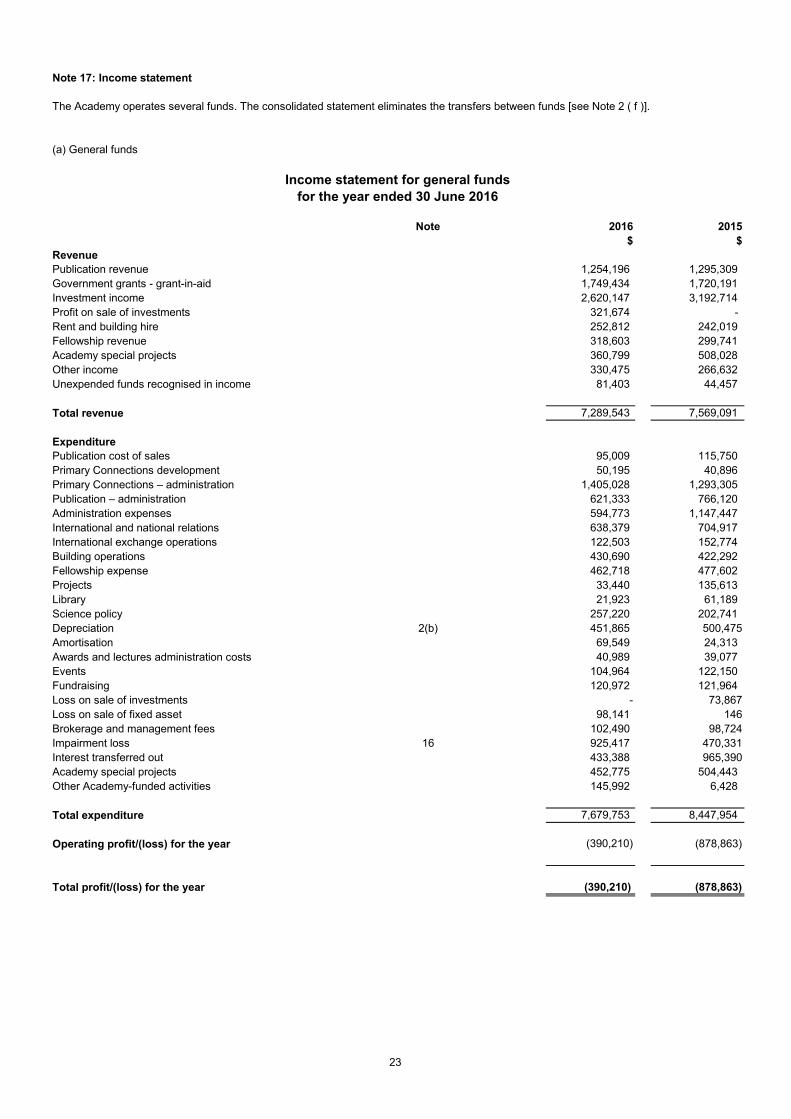
(a) General funds
Note 2016 2015$ $
RevenuePublication revenue 1,254,196 1,295,309 Government grants - grant-in-aid 1,749,434 1,720,191 Investment income 2,620,147 3,192,714 Profit on sale of investments 321,674 - Rent and building hire 252,812 242,019 Fellowship revenue 318,603 299,741 Academy special projects 360,799 508,028 Other income 330,475 266,632
81,403 44,457
Total revenue 7,289,543 7,569,091
ExpenditurePublication cost of sales 95,009 115,750 Primary Connections development 50,195 40,896 Primary Connections – administration 1,405,028 1,293,305 Publication – administration 621,333 766,120 Administration expenses 594,773 1,147,447
638,379 704,917 International exchange operations 122,503 152,774 Building operations 430,690 422,292 Fellowship expense 462,718 477,602 Projects 33,440 135,613 Library 21,923 61,189 Science policy 257,220 202,741 Depreciation 2(b) 451,865 500,475 Amortisation 69,549 24,313
40,989 39,077 Events 104,964 122,150 Fundraising 120,972 121,964 Loss on sale of investments - 73,867Loss on sale of fixed asset 98,141 146 Brokerage and management fees 102,490 98,724 Impairment loss 16 925,417 470,331 Interest transferred out 433,388 965,390 Academy special projects 452,775 504,443 Other Academy-funded activities 145,992 6,428
Total expenditure 7,679,753 8,447,954
(390,210) (878,863)
(390,210) (878,863)
Operating profit/(loss) for the year
Note 17: Income statement
The Academy operates several funds. The consolidated statement eliminates the transfers between funds [see Note 2 ( f )].
NB: Administration fees recovered is derived from charges against grants and special projects for their administration by the Academy.
Unexpended funds recognised in income
International and national relations
for the year ended 30 June 2016Income statement for general funds
Awards and lectures administration costs
Total profit/(loss) for the year
23
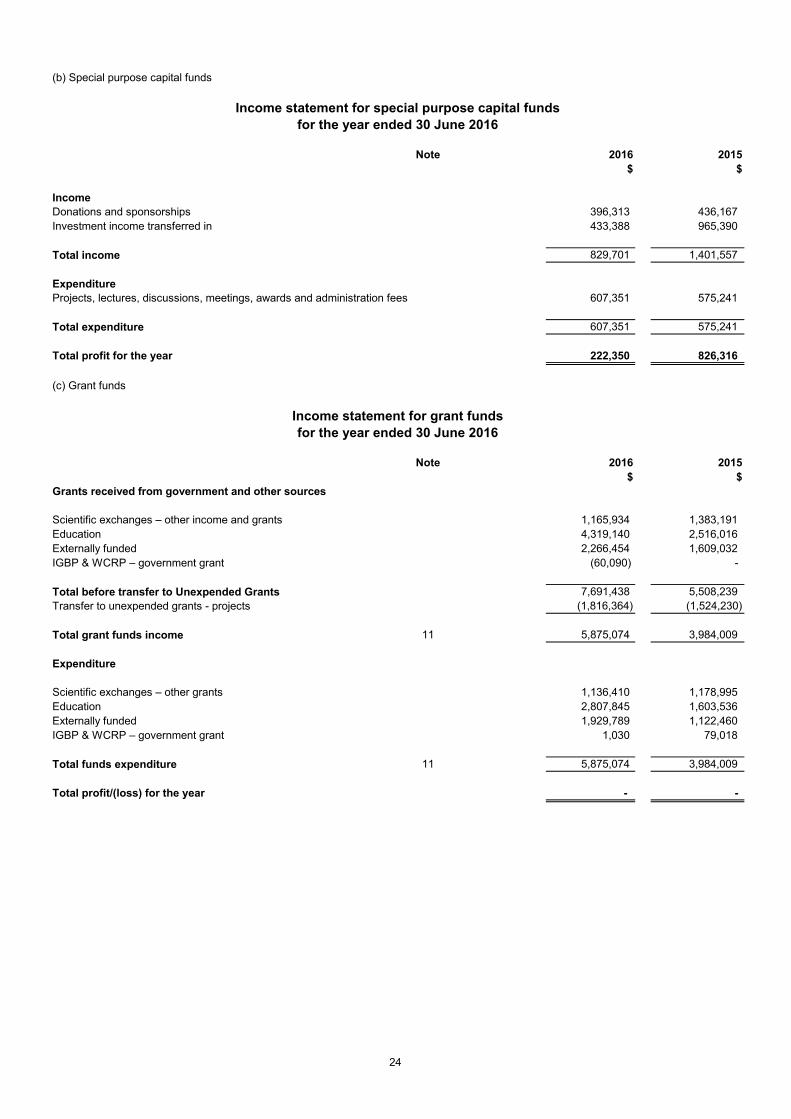
Note 2016 2015$ $
IncomeDonations and sponsorships 396,313 436,167 Investment income transferred in 433,388 965,390
Total income 829,701 1,401,557
ExpenditureProjects, lectures, discussions, meetings, awards and administration fees 607,351 575,241
Total expenditure 607,351 575,241
222,350 826,316
(c) Grant funds
Note 2016 2015$ $
Grants received from government and other sources
1,165,934 1,383,191 Education 4,319,140 2,516,016 Externally funded 2,266,454 1,609,032
(60,090) -
7,691,438 5,508,239 (1,816,364) (1,524,230)
Total grant funds income 11 5,875,074 3,984,009
Expenditure
1,136,410 1,178,995 Education 2,807,845 1,603,536 Externally funded 1,929,789 1,122,460
1,030 79,018
Total funds expenditure 11 5,875,074 3,984,009
- -
Total before transfer to Unexpended Grants
Scientific exchanges – other income and grants
Total profit for the year
(b) Special purpose capital funds
Income statement for special purpose capital funds
Income statement for grant funds
IGBP & WCRP – government grant
Transfer to unexpended grants - projects
for the year ended 30 June 2016
IGBP & WCRP – government grant
for the year ended 30 June 2016
Total profit/(loss) for the year
Scientific exchanges – other grants
24
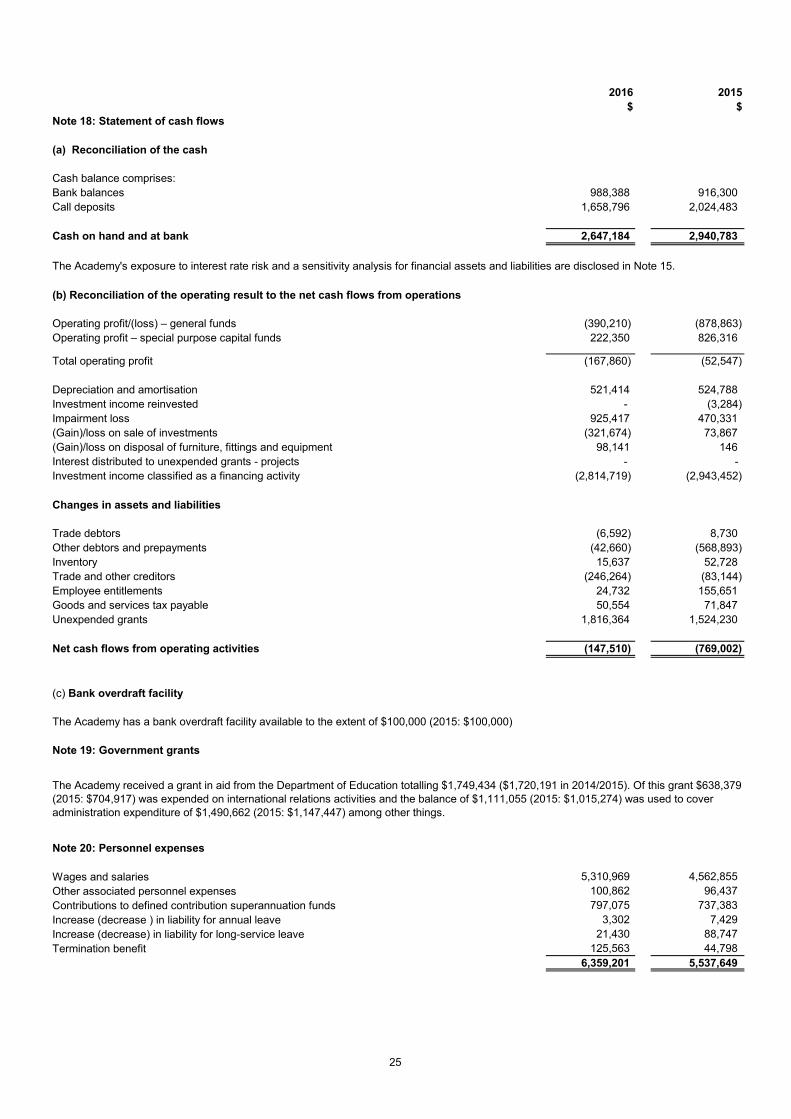
2016 2015$ $
Cash balance comprises:Bank balances 988,388 916,300 Call deposits 1,658,796 2,024,483
Cash on hand and at bank 2,647,184 2,940,783
(390,210) (878,863)222,350 826,316
Total operating profit (167,860) (52,547)
521,414 524,788 Investment income reinvested - (3,284)Impairment loss 925,417 470,331
(321,674) 73,86798,141 146
Interest distributed to unexpended grants - projects - - (2,814,719) (2,943,452)
Trade debtors (6,592) 8,730 Other debtors and prepayments (42,660) (568,893)Inventory 15,637 52,728 Trade and other creditors (246,264) (83,144)Employee entitlements 24,732 155,651 Goods and services tax payable 50,554 71,847 Unexpended grants 1,816,364 1,524,230
(147,510) (769,002)- -
(c) Bank overdraft facility
Note 19: Government grants
Wages and salaries 5,310,969 4,562,855 Other associated personnel expenses 100,862 96,437 Contributions to defined contribution superannuation funds 797,075 737,383 Increase (decrease ) in liability for annual leave 3,302 7,429 Increase (decrease) in liability for long-service leave 21,430 88,747 Termination benefit 125,563 44,798
6,359,201 5,537,649
(b) Reconciliation of the operating result to the net cash flows from operations
Operating profit/(loss) – general funds
Changes in assets and liabilities
Investment income classified as a financing activity
(Gain)/loss on disposal of furniture, fittings and equipment
Operating profit – special purpose capital funds
(a) Reconciliation of the cash
The Academy received a grant in aid from the Department of Education totalling $1,749,434 ($1,720,191 in 2014/2015). Of this grant $638,379 (2015: $704,917) was expended on international relations activities and the balance of $1,111,055 (2015: $1,015,274) was used to cover administration expenditure of $1,490,662 (2015: $1,147,447) among other things.
Net cash flows from operating activities
Note 20: Personnel expenses
The Academy has a bank overdraft facility available to the extent of $100,000 (2015: $100,000)
Note 18: Statement of cash flows
The Academy's exposure to interest rate risk and a sensitivity analysis for financial assets and liabilities are disclosed in Note 15.
Depreciation and amortisation
(Gain)/loss on sale of investments
25
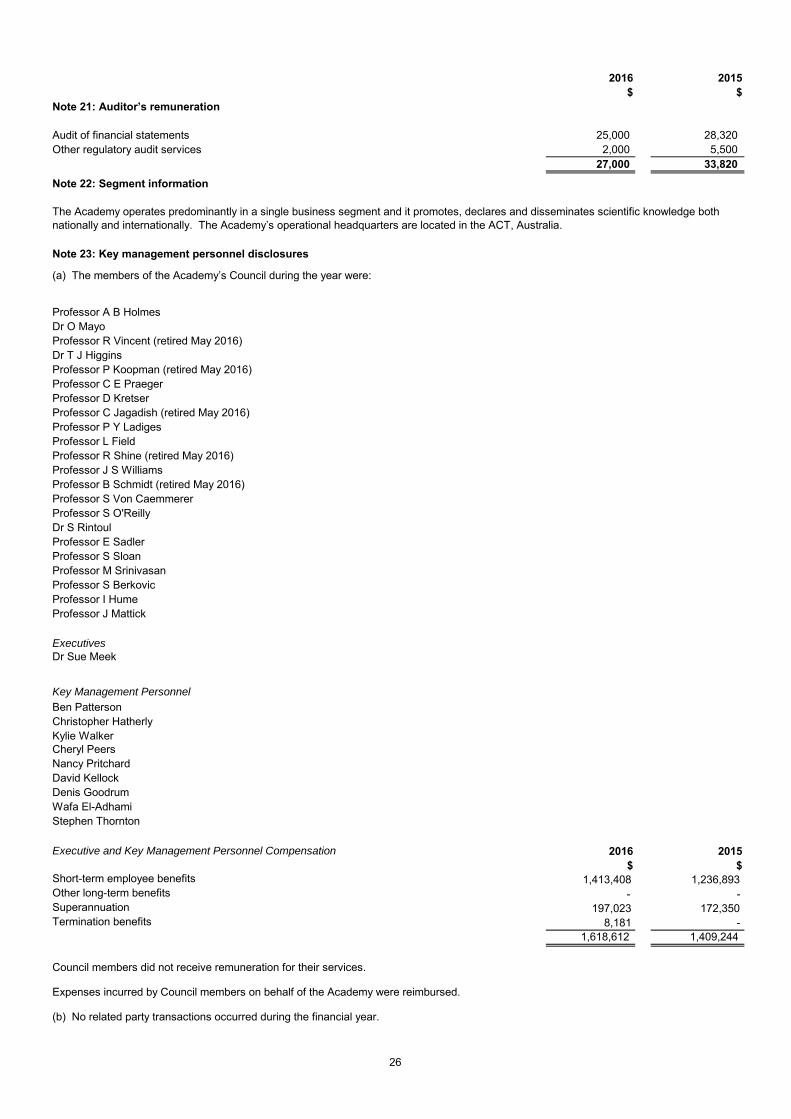
2016 2015$ $
Audit of financial statements 25,000 28,320 Other regulatory audit services 2,000 5,500
27,000 33,820 Note 22: Segment information
Note 23: Key management personnel disclosures
(a) The members of the Academy’s Council during the year were:
Professor A B Holmes Dr O MayoProfessor R Vincent (retired May 2016)Dr T J Higgins Professor P Koopman (retired May 2016)Professor C E Praeger Professor D Kretser Professor C Jagadish (retired May 2016)Professor P Y LadigesProfessor L Field Professor R Shine (retired May 2016)Professor J S WilliamsProfessor B Schmidt (retired May 2016)Professor S Von Caemmerer Professor S O'ReillyDr S RintoulProfessor E SadlerProfessor S SloanProfessor M SrinivasanProfessor S BerkovicProfessor I HumeProfessor J Mattick
ExecutivesDr Sue Meek
Key Management PersonnelBen Patterson Christopher HatherlyKylie WalkerCheryl PeersNancy PritchardDavid KellockDenis GoodrumWafa El-AdhamiStephen Thornton
2016 2015$ $
Short-term employee benefits 1,413,408 1,236,893 Other long-term benefits - - Superannuation 197,023 172,350 Termination benefits 8,181 -
1,618,612 1,409,244
Council members did not receive remuneration for their services.
Expenses incurred by Council members on behalf of the Academy were reimbursed.
(b) No related party transactions occurred during the financial year.
The Academy operates predominantly in a single business segment and it promotes, declares and disseminates scientific knowledge both nationally and internationally. The Academy’s operational headquarters are located in the ACT, Australia.
Executive and Key Management Personnel Compensation
Note 21: Auditor’s remuneration
26

Note 24: Joint arrangement
The Australian Academy of Science or “Academy”, represented by its President, is one of four members of the Australian Council of Learned Academies or “ACOLA” ABN 70 116 968 853, an unincorporated association. The ACOLA Secretariat Ltd or “Secretariat” ABN 40 143 536 805 is a public company limited by guarantee that manages the ACOLA. A management agreement is in place between the Secretariat and ACOLA to oversee its operations. The Chief Executive of the Academy is a member of the Secretariat together with the other Chief Executives of the other three Learned Academies.
ACOLA does not receive any funding from the Academy. Any management decisions made by the Secretariat is independent of the Academy. The Academy does not receive any dividends or earnings from the operations of ACOLA however on wind-up, the Academy has equal rights (25%) to assets and liabilities. During normal ongoing operations of ACOLA, the Academy has no such rights to ACOLA’s assets and/or liabilities. The Academy does not have control of 25% of the ACOLA operations but acts with the other three Learned Academies to oversee 100% of its operations.
27