Embed Size (px)
Citation preview

Australian Advertising Expenditure and its Relation to Demand*
This study is an attempt to analyse the trends in Australian advertising expenditures and to find out whether there is any relation- ship between the propensity to advertise and the income-elasticity of demand. A picture of the society’s advertising commitments, both absolute and relative, is a minimum requirement for any enquiry into the contribution of advertising to the effective operation of the econ- omy. Also, finding out whether there is any association between advertising expenditure and the income-elasticity of demand may con- tribute to our understanding of any relation that may exist between the distribution of advertising expenditure and the number and type of consumers in the market.
I Advertising expenditures in Australia have been increasing
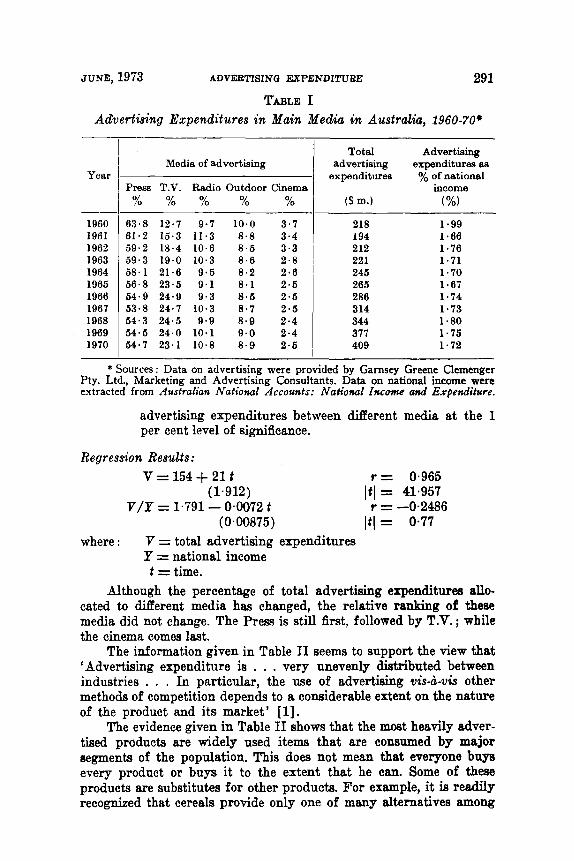
steadily in the past decade. Table I shows this time trend. Three main conclusions can be derived from the data given in Table I and the regreasion results :
(i) Total advertising expenditures in Australia increased by $21 m. every year between 1960 and 1970.
(ii) Although total advertising expenditures have increased in Australia in the past decade, the proportion of national in- come devoted to advertising shows a (statistically insi@;niti- cant) slight decrease in the same period.
(iii) There has been a significant change in the role played by the Merent advertising media in Australia in the last decade. The role of Press has been reduced; that of T.V. enhanced while that of radio and outdoor media remained, more or less, constant. The cinema seems to be losing popularity as a means of communication between advertisers and con- sumers. Using the chi-square test we accept the hypothesis that there is a significant difference in the distribution of
* I wish to thank Garnsey Greene, Clemenger Pty. Ltd., Marketing and Adver- tising Consultants, Brisbane, for providing the necessary data on advertising ; available from the author if required in more detail.
290
JUNE, 1973 ADVERTISINQ EXPENDITURE 291 TABLE I
Advertising Expenditures in Main Media in Australia, 1960-70'
Year
-- 1960 I961 1962 1963 1964 1965 1966 1967 1968 1969 1970
Media of advertising
Press T.V. Radio Outdoor Cinema % % % % %
63.8 12.7 9.7 10.0 3.7 61.2 15.3 11.3 8.8 3.4 59.2 18.4 10.6 8.6 3.3 59.3 19.0 10.3 8.0 2.8 58.1 21.6 9.5 8.2 2 . 6 56.8 23.6 9.1 8.1 2.5 64.9 24.9 9.3 8.5 2.5 53.8 24.7 10.3 8.7 2.5 54.3 24.5 9.9 8.9 2.4 54.5 24.0 10.1 9.0 2.4 54.7 23.1 10.8 8.9 2.5
Total Advertising advertising expenditures aa
expenditures yo of national income
($ m.) (%I 218 1.99 194 1.66 212 1.76 221 1.71 246 1.70 266 1.67 286 1.74 314 1.73 344 1.80 377 1.75 409 1.72
* Sources : Data on advertising were provided by Garnsey Greene Clemenger Pty. Ltd., Marketing and Advertising Consultants. Data on national income were extracted from Australian National Accounts: National Income and Expenditure.
advertising expenditures between different media at the 1 per cent level of significance.
Regression Results: V = 154 + 21 t
(1.912) V/P = 1'791 - 0.0072 t
(0.00875)
r = 0.965 It1 = 41.957 r = -0.2486
It1 = 0.77 where : V = total advertising expenditures
P = national income t = time.
Although the percentage of total advertising expenditures allo- cated to Merent media has changed, the relative ranking of these media did not change. The Press is still first, followed by T.V.; while the cinema comes last.
The information given in Table I1 seems to support the view that 'Advertising expenditure is . . . very unevenly distributed between industries . . . In particular, the use of advertising vk-d-via other methods of competition depends to a considerable extent on the nature of the product and its market' [ l] .
T'he evidence given in Table I1 shows that the most heavily adver- tised products are widely used items that are consumed by major segments of the population. T'his does not mean that everyone buys every product or buys it to the extent that he can. Some of these products are substitutes for other products. For example, it is r e d y recognized that cereals provide only one of many alternatives among
292 THE ECONOMIC RECORD JUNE
breakfast foods. In some instances, heavily advertised products com- pete with each other as, for example, soft drinks and beer [2]. It has also been pointed out that some of the products are '. . . subject to fads and style changes' and that '. . . consumers become restive with existing brands and are prepared to try new varieties'. Illustra- tions include cereals, soaps, clothing and motion pictures [ 31.
The other main finding of Table I1 is that the ranking of the pro- ducts with respect to their advertising expenditures has changed very radically in some c w s in the past decade. These include smoking ac- cessories (which ranked as eighth in 1960; third in 1970) ; travel and tours (thirteenth in 1960 ; fourth in 1970) ; household cleaners (twelfth in 1960; seventh in 1970) ; household equipment (tenth in 1960 ; sixth in 1970) and aspirin types (twenty-sixth in 1960 ; eighteenth in 1970). In some cases (household cleaners and household equipment), the consumer was offered a wide variety of brands from which to choose. Product improvements usually breed competitive product improve- ments and the advertising of these improvements may result in an increase in total advertising for the class of products. In other cases (smoking accessories), when a company embarks on an intensified ad- vertising campaign, its competitors must step up their advertising or other sales efforts to avoid the possible loss of market share, Then again (travel and tour) potential markets expand as incomes rise and con- sumers are able to purchase products they previously could not afford. Continuous large-scale advertising provides information to attract some of these new customers.
T'he reverse trend characterizes such products as men's wear, elec- trical goods, refrigeration, radio and T.V. In these industries other forms of promotion such as personal selling, publicity and larger dis- tributive margins seem to be playing an important role.
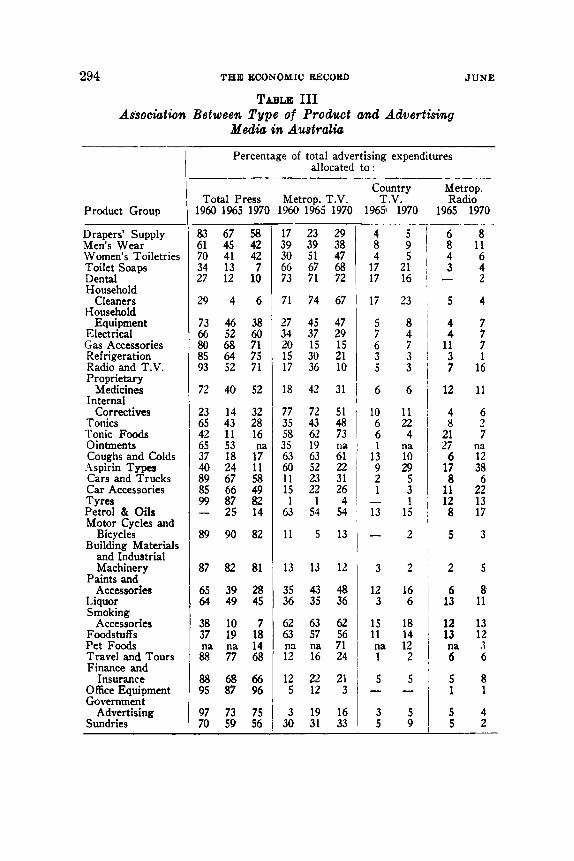
Table I11 shows the association between the type of product and the advertising media in Australia over the period 1960-70. The table also shows the trend in the relative importance of the different media for the different product groups over the same period. Two conclusions can readily be derived from the information given in Table 111: (a) There is a clear association between the type of product and the means of communication. Some products, particularly those related to home consumption (e.g. soaps, dental goods, household cleaners) are T.V. oriented ; others, particularly durable goods, transport equipment and related products and industrial machinery are Press oriented. (b) The relative importance of the different advertising media has changed significantly in the past decade, with T.V. attracting a larger propor- tion of total advertising expenditures fo r almost every product.
It is impossible to know with precision how much advertising is informational in Australia. Classified advertising and local advertising which are considered overwhelmingly informational in nature, averaged approximately 24 per cent of total advertising expenditure in Aust- ralia in the last decade. It must, however, be realized that a significant part of national advertising is for promotion of new products for

1973 ADVERTISINQ EXPENmITURE 293 which the informational role is vital. Also, some part of advertising that does not seem to have a clear informative role may perform a valuable marketing task in some trades by contributing to economies of scale in production and efficiency in distribution.
I I D,if€erences in competitive conditions were considered by many
economists as the key factor in determining the magnitude of advertis- ing expenditures. Kaldor and Silverman [4], fo r example, concluded : ‘Large scale advertising appears peculiar to industrial situations which are neither monopolistic nor competitive, but which in the language of
TABLE I1 Ranking of Products Groups According to the Intensity of
their Advertising Expenditures
Product group
Drapers’ Supply Men’s Wear Women’s Toiletries Toilet Soaps Dental Household Cleaners Household Equipment Electrical Goods Gas Accessories Refrigeration Radio and T.V. Proprietary Medicines Internal Correctives Tonics Tonic Foods Ointments Coughs and Colds Aspirin Types Cars and Trucks Car Accessories Tyres Motor Cycles and Bicycles Petrol and Oils Building Materials and
Industrial Machinery Paints and Accessories Liquor Smoking Accessories Foodstuffs Pet Foods Travel and Tours Finance and Insurance Office Equipment Government Sundries
Percentage of total advertising expenditure
1960 1965 1970
5.26 4.29 4.01 0.90 0.95 3.28 3.71 5.79 0.56 1.75 2.45 1.63 0.67 0.44 0.56 0.26 1.01 0.60 5.83 0.71 1.10 0.17 3.92
3.46 2.17 2.72 4.00
13.29 na
2.94 8.58 0.37 2.34 10.28
4.50 3.92 5.07 1.13 1.11 3.91 4.29 4.60 0.47 0.77 0.83 1.53 0.87 0.31 0.24 0.09 0.77 1 *01 6.38 0.59 0.67 0.08 4.58
3.26 1.56 2.69 8.32
16.40 na
3.54 3.98 0.60 2.86 9.07
4.18 2.76 4.06 0.70 0.68 4.44 4.45 3.67 0.35 0.62 0.63 1 *42 0.38 0.22 0.18 0.04 0.49 0.94 9.05 0.48 0.83 0.19 3.60
3.16 0.79 3.15 5.46
15.78 1.34 5.45 5.30 0.55 2.91
11.75
Product ranking
1960 1965 1970
5 6 7
23 22 12 10 4 28 18 15 19 25 29 27 31 21 26 3
24 20 32 9
11 17 14 8 1
na 13 2
30 16 -
7 10 4
18 19 13 8 5
28 23 22 17 21 29 30 31 24 20 3
27 25 32 6
13 17 15 2 1
na 12 9
26 14 -
8 15 9
21 22 7 6
10 29 24 23 16 28 30 32 33 26 18 2
27 19 31 11
12 20 13 3 1
17 4 5
25 14 -
294 THE ECONOMIC RECORD JUNE
TABLE I11 Association Between Type of Product m d Advertising
Media in Australia
61 70 34 27
8 6 1 3 11 22 - 1 12 13 13 15 I 8 17
I
65 64
38 37 na 88
88 95
97 70
Percentage of total advertising expenditures allocated to :
Country Metrop. Total Press Metrop. T.V. T.V. Radio
Product Group 1960 1965 1970 1960 1965 1970 19651 1970 1965 1970 - I - -
67 45
- 58 42 42 7
10
6
4 5 ' 6 8 8 9 1 8 11 4 5 ' 4 6
17 21 ' 3 4 17 16 i - 2
Drapers' Supply Men's Wear Women's Toiletries Toilet Soaps Dental Household
Cleaners Household
Equipment Electrical Gas Accessories
17 23 29 39 39 38 30 51 47 41
13 12
66 67 68 73 71 72
I 29 4
46 52 68 64 52
40
14 43 11 53 18 24
71 74 67
27 45 47 34 37 29 20 15 15 15 30 21 17 36 10
1 7 2 3 i 5 5 8 1 4 7
7 4 1 4 7 6 7 1 1 1 7
73
I f 38 60 71
Refrigeration Radio and T.V.
75 71
3 3 1 3 1 5 3 1 7 16
Proprietary Medicines
Internal 18 42 31 6 6 I 12 11
I I 52
32 28 16
Correctives Tonics Tonic Foods 42
65 37 40 89 8s 99
89
87
-
Ointments Coughs and Colds Aspirin Tvpes Cars and Trucks Car Accessories Tyres Petrol & Oils Motor Cycles and
Bicycles Building Materials
and Industrial Machinery
Paints and Accessories
Liquor Smoking
Accessories Foodstuffs Pet Foods Travel and Tours Finance and
Insurance Office Equipment Government
Advertising Sundries
na 17 11 58 49 82 14
67 66 87
11 23 31 15 22 26 1 1 4
63 54 54 25
90 82
82
39 49
10 19 na 77
68 87
73 59
81
28 45
7 18 14 68
66 96
7s 56
13 13 3 2 2 5 I
35 43 48 1 12 8 1 36 35 36 3 '66 1 I f 11
62 63 62 63 57 56 na na 71
' 12 16 24
12 22 21 5 12 3
15 18 11 14 na 12 1 2
5 5 1 - -
13 12 na 3 6 6
5 8 1 1
3 1 9 1 6 3 5 1 5 4 30 31 3 3 1 5 9 , 5 2
1973 ADVERTISINQ EXPENDITURE 295
economic theory, are called oligopoly-the market being divided be- tween a few competitive producers.'
Jastram [5], however, shows that irrespective of degree of seller concentration industrial goods and consumer durables have markedly less advertising than non-durables. Tesler 's econometric study of ad- vertising and competition [6] shows no empirical support for an asso- ciation between advertising and industrial concentration.
T'he cost of advertising as a percentage of sales was the subject- matter of some research [7] and [8] but no attempt was made to in- vestigate the functional relationship between the relative expenditures for advertising and the product's characteristics. Instead, sometimes an arbitrary percentage, such as 5 per cent, is selected 88 the dividing line between 'high' and more 'reasonable' levels of expenditures [8].
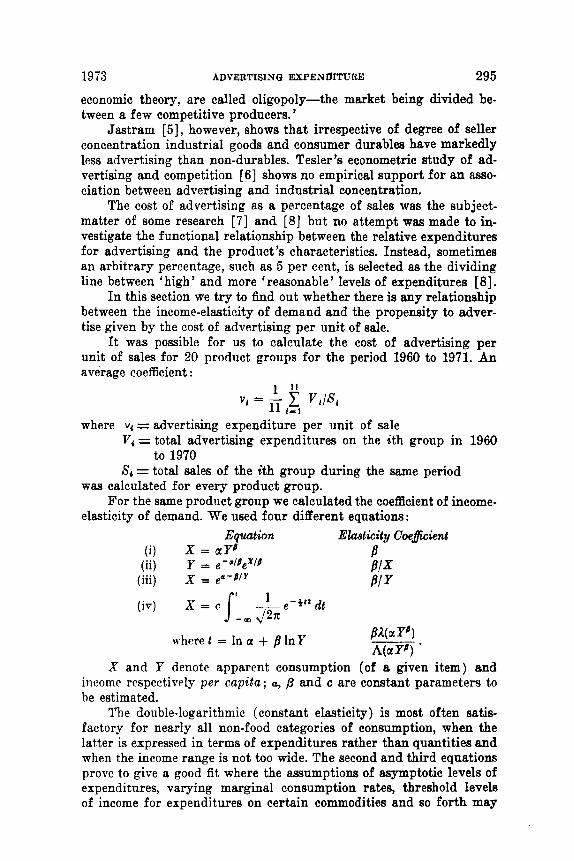
In this section we t ry to find out whether there is any relationship between the income-elasticity of demand and the propensity to adver- tise given by the cost of advertising per unit of sale.
It was possible for us to calculate the cost of advertising per unit of sales for 20 product groups for the period 1960 to 1971. An average coefficient :
where vi = advertising expenditure per unit of sale V , = total advertising expenditures on the ith group in 1960
8, = total sales of the ith group during the same period to 1970
was calculated for every product group.
elasticity of demand. We used four different equations : For the same product group we calculated the coeflcient of income-
Eqzuztion Eht i c i t y Coe&iend ( i ) X = aYP B
BlX (iii) AY = ea-P/" BI y
(ii) y = , - J P , X / P
where t = In a + f l h Y
X and P denote apparent consumption (of a given item) and income respectively per cupitu; a, /3 and c are constant parameters to be estimated.
T'he double-logarithmic (constant elasticity) is most often satis- factory for nearly all non-food categories of consumption, when the latter is expressed in terms of expenditures rather than quantities and when the income range is not too wide. The second and third equations prove to give a good fit where the assumptions of asymptotic levels of expenditures, varying marginal consumption rates, threshold levels of income for expenditures on certain commodities and so forth may
296 THE ECONOMIC RECORD JUNE
be appropriate [ 91. The log-normal is used frequently for it has three parameters and hence involves more flexible characteristics.
The data used are time series and relate to the period 1955-70. Apparent consumption was calculated as :
Domestic production + Imports - Exports. The first three equations were fitted to the data by the least squares
method using an appropriate transformation.l In the last equation A ( t ) designates the area and A ( t ) the ordinates of the log-normal dis- tribution function at the value of t = In(ay8). The method of maxi- mum-likelihood was used to estimate the three parameters c; a and p
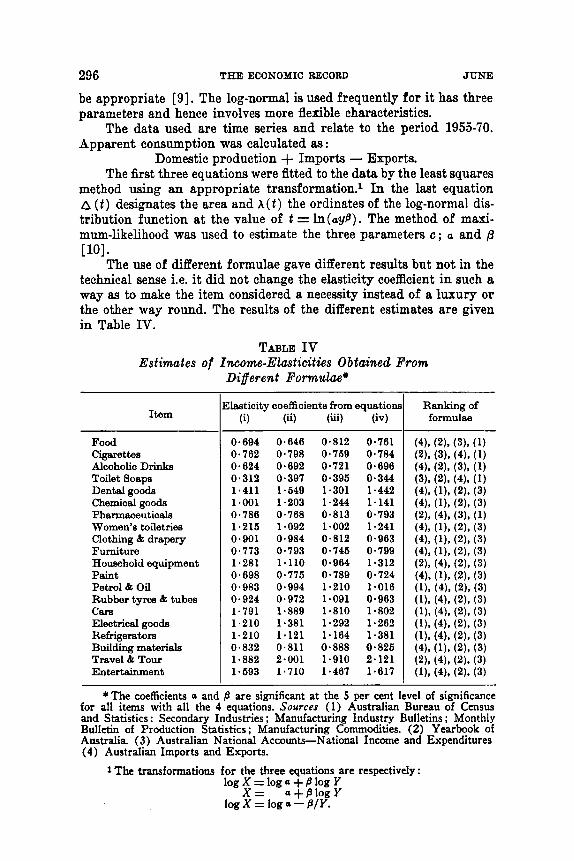
"'he use of different formulae gave different results but not in the technical sense i.e. it did not change the elasticity coefficient in such a way as to make the item considered a necessity instead of a luxury or the other way round. The results of the different estimates are given in Table N.
TABLE IV Estimates of Income-Elasticities Obtained From
Different Formuh*
[101.
Item
Food
Alcoholic Drinka Toilet Soaps Dental goods Chemical goods Pharmaceuticals Women's toiletries Clothing & drapery Furniture Household equipment Paint Petrol & Oil Rubber tyres & tubes CarS Electrical goods Refrigerators Building materib Travel & Tour Entertainment
Cigarettes
:lassticity coefficients from equatiom (i) (ii) (iii) (iv)
0.694 0.646 0.812 0.761 0.762 0.798 0.769 0.784 0.624 0.692 0.721 0.696 0.312 0.397 0.396 0.344 1.411 1.649 1.301 1.442 1.001 1.203 1.244 1.141 0.786 0-768 0.813 0.793 1.216 1.092 1.002 1.241 0.901 0.984 0.812 0.963 0.773 0.793 0.748 0.799 1.281 1.110 0.964 1.312 0.698 0.776 0.789 0.724 0.983 0.994 1.210 1.016 0-924 0.972 1.091 0.963 1-791 1-889 1.810 1.802 1.210 1.381 1.292 1.262 1.210 1.121 1.164 1.381 0.832 0.811 0.888 0.826 1.882 2-001 1.910 2.121 1.693 1.710 1.467 1.617
*The coefficients a and B are significant at the 5 per cent level of significance for all items with all the 4 equations. Sources (1) Australian Bureau of Census and Statistics : Secondary Industries ; Manufacturing Industry Bulletins ; Monthly Bulletin of Production Statistics; Manufacturing Commodities. (2) Yearbook of Australia. (3) Australian National Accounts-National Income and Expenditures (4) Australian Imports and Exports.
1 The transformations for the three equations are respectively : log X = log a + B log Y
X = a + B l o g Y log X = log a - B/Y.

1973 ADVERTISINQ FXPENDITURE 297 Among the alternative sets of estimates the one which minimizes
the error variance,
where E(X) is the expected value of X obtained from each regression, has been used to compare with the cost of advertising per unit of sale ( v ~ ) . The comparison is given in Table V.
Table V reveals some association between the income-elasticity of demand and the cost of advertising per unit of sale. To test this aaso- ciation statistically we used three models :2
s2 = Z{X - E ( X ) } Z ,
(9 v = a + j q (ii) v = aeBq
(iii) v = a + jq + yq2 where T is the elasticity coefficient given by the curve of best fit.
Item
Food Cigarettes Alchoholic drinks Toilet soap Dental goods Chemical goods Pharmaceuticals Women’s toiletries Clothing and drapery Furniture Household equipment Paint Petrol and oil Rubber tyres and tubes Cars Electrical goods Refrigerators Building Materials Travel and Tour Entertainment
VC 84
0.0081 0.761 0.0401 0.798 0,0099 0.6% 0~0101 0.395 0.0532 1 442 0.0187 1.141 0.0068 0.768 0.0331 1.366 0.0120 0.969 0.0081 0.799 0.031 1 1-281 0.0103 0.724 0,0144 0.983 0.01 12 0.924 0.0663 1.791 0.0231 1.210 0.0162 1.182 0.0101 0.825 0.0851 1.882 0.0392 1.593

298 THE ECONOMIC RECORD JUNE
mand. The second model, however, gives a better fit than the other two model^.^ This significant association between advertising expenditure per unit sold and the income-elasticity of demand may be explained by the following factors, which are by no means exhaustive :
(i) High income-elastic goods are too expensive fo r the consumers in the low income group. To buy these goods, most of these consumers will probably have to run deficits. Thus it needs a really persuasive effort to attract these potential customers. Heavy advertising cam- paigns could be one means.
(ii) A large number of high income-elastic goods requires larger- scale production. Because of market limitations, this production can be carried out efficiently by few producers. Hence, an oligopolistic market situation develops. Various studies confirm an association be- tween advertising and oligopoly [ ll], [ 121.
(iii) High income-elastic items usually carry a higher profit mar- gin. A producer with a high profit margin can afford to spend more on promoting his product. Advertising is one form of promotion.
ZII Despite its great limitations, this study has some important
findings : (i) The total amount of resources allocated to advertising in Aus-
tralia has increased steadily in the past decade. The ratio of adver- tising expenditures to national income, however, has remained prac- tically constant.
(ii) The relative importance of the different advertising media in Australia has changed in the past decade. The ranking of the different media according to the proportion of advertising expenditures allo- cated to each of them at the beginning and at the end of the last de- cade did not change.
(iii) There is a significant association between the type of product and the media of advertising in Australia, but the advertisers, in general, seem to be making more use of T.V. (particularly in country areas).
(iv) There is a strong positive correlation between advertising es- penditures per unit sold and the income-elasticity of demand in Aus- tralia. The relationship, however, is not a linear one. This significant relationship is explained here by the persuasive effect of advertising ; the association between income-elasticity and scale of production on the one hand and between scale of production, marketing structure and advertising expenditures on the other hand and by the association between income-elasticity, profit margins and promotion expenditures.
(v) Further research is urgently needed, particularly case studies on industries with a relatively high advertising-to-sales ratio. Such studies may succeed in indentifying those industries where the costs of
3 The second model minimizes the error variance SZ = I: [ Y - E (v) ] 2 where E ( v ) is the expected value of 1 obtained from each regression.

1973 ADVERTISINQ EXPENDITURE 299 advertising appear to outweigh any benefits which are likely to be received by consumers.
M. M. METWALLY University o f Queensland
REFERENCES Doyle, P., ‘Economic Aspects of Advertising : A Survey’. Economic Journal, Vol. LXXVIII, September 1968. Backman, J., ‘Is Advertising Wasteful?’ Journal of Markefing, Vol. 32, January, 1968. Tesler. L.. ‘How Much Does It Pav Whom to Advertise?’ American Eco- nomic’R&ew, Vol. LI, May 1961. - Kaldor, N. and R. Silverman, A Statistical Analysis of Advertising Expen- diture of the Press (Cambridge University Press, London, 1948). Jastram, R. W., ‘A Treatment of Distributed Lags in the Theory of Adver- tising Expenditure’, Journal of Marketing, Vol. 20, July 1955. Tesler, L., ‘Advertising and Cigarettes’, Journal of Politicid Economy, Vol. LXX, October 1962. Bain, J., Indristrial Organimtion (Wiley, New York, 1959), pp. 390-1 Labour Party, Report of a Commission of Enquiry into Advertising (Lon- don, 1966), p. 42. Metwally, M. M., ‘Household Expenditure Patterns : Hamilton New Zealand‘, Economic Record, Vol. 46, March 1970. Aitchison, J. and J. A. C. Brown, The Lognormal Distribution with Special Reference to Its Uses in Economics. Department of Applied Economics, Monograph 5 (University of Cambridge, 1957). Dortman, R. and P. 0. Steiner, ‘Optimal Advertising and Optimal Quality’, in F. M. Bass et al. (eds.), Mathematical Models and Methods in Marketing (Irwin, Homewood, Ill., 1961). Gupta, J. K. and K. S. Krishnan, ‘Mathematical Models in Marketing’, Operations Research, Vol. 15, November-December 1967.