Embed Size (px)
Citation preview
1
Australian and Chinese Visitors to New Zealand – Perceptions of
Accommodation and Food and Beverage
Chris Ryan
August 2013
2
Executive Summary
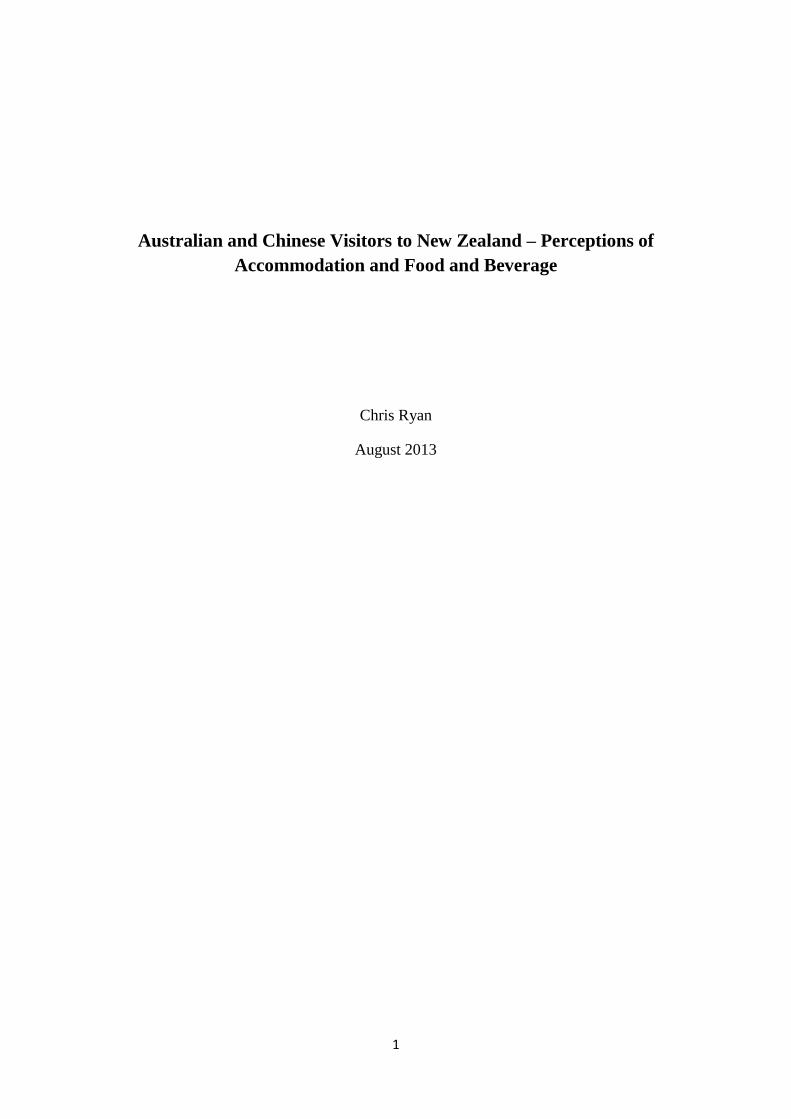
The analysis is based upon data provided by TIANZ and TNZ relating to Australian and
Chinese assessments of accommodation and food and beverage in New Zealand for two time
periods, 2009-9 and 2009-10.
The samples were:
Australians 2008-9 758
Australians 2009-10 976
Chinese 2008-9 127
Chinese 2009-10 150
To measure satisfaction scales of one to ten were provided with ten representing the highest
score. The scores achieved were:
N Mean Std. Deviation
Australian Perception of Accommodation 2008 758 8.57 1.32
Australian perceptions of accommodation 2010 976 8.58 1.37
Chinese perceptions of Accommodation 2008
127 8.00 1.75
Chinese perceptions of accommodation 2010 150 8.16 1.40
Australian perceptions of Food and Beverage 2008 791 8.25 1.42
Australian perception of Food and Beverage 2010 1108 8.37 1.34
Chinese perceptions of Food and Beverage 2008 128 7.92 1.72
Chinese perceptions of Food and Beverage 2010 158 7.96 1.56
In terms of dis-satisfaction, for the most part this sentiment is generally encountered where
the accommodation is found deficient, or where staff have been unhelpful. There are
potentially other issues that include perceptions of some accommodation being expensive, or
examples where amenities are thought to be less than modern or properties are in need of
refurbishment – but overall there is a sense that these are tolerated by tourists if:
a) Properties are clean;
b) Staff are friendly and helpful;
c) Their occurrences are exceptional rather than the norm
3
List of Contents
Executive summary 2
Introduction 4
Statistical Analysis 7
Australians’ Assessments of Accommodation 2008-9 8
Australians’ Assessments of Accommodation 2009-10 12
Chinese Assessments of Accommodation 2008-9 15
Chinese Assessments of Accommodation 2009-10 20
Australians’ Assessments of Food and Beverage 2008-9 23
Australians’ Assessments of Food and Beverage 2009-10 26
Chinese Assessments of Food and Beverage 2008-9 27
Chinese Assessments of Food and Beverage 2009-10 28
Conclusions and Discussion 30
Appendix 33
4
1.0 Introduction
1.1 This report represents an interim paper utilising data provided by Tourism
Industry Association New Zealand and Tourism New Zealand. The core of
that data relates to comments made by international visitors to New Zealand
with reference to various aspects of their trip to New Zealand; which
comments include those relating to accommodation and restaurants and
catering outlets. This report uses but part of that data to meet the needs for a
report by August 28th
2013, having been commissioned on Friday 16th
August.
It is anticipated that a fuller analysis may be required at a later date.
1.2 The report therefore draws only on two groups of tourists, namely the
Australians and Chinese, but these two nationalities represent the two largest
sources of visitors to New Zealand. Thus, for example, in June 2013
Australians accounted for 53 per cent of all visitors to New Zealand in that
month, and the Chinese accounted for 7 per cent. However the latter showed a
growth rate of over 20 per cent in a period of 12 months.
1.3 The data comprised basically two sets of information – the first being a rating
on a 10-point scale where 10 represented the highest score on the variable
being assessed (in this instance accommodation and separately, food and
beverage), and the second being a series of statements by respondents
providing reasons for the score provided. The data covered two time periods,
that from 2008-9, and 2009-10.
1.4 The sample sizes were as follows:
Australians 2008-9 758
Australians 2009-10 976
Chinese 2008-9 127
Chinese 2009-10 150
1.5 The report thus commences with first a statistical analysis of the overall scores and
second with an analysis of the comments.
5
1.6 With reference to the analysis of the textual data the limited time available meant that
while broad themes were identified, a statistical breakdown of the frequency of the
themes was not possible. The analysis of the textual data were undertaken by first
reading (and translating Mandarin text), and then having to correct many grammatical
errors and misspellings to then second, identifying themes by using two pieces of
textual analysis. The software used were the packages CatPac and Leximancer.
1.7 For its part CatPac is devised based on the principles of Artificial Neural Networks
(ANN). These principles are examined by Woelfel (1993), the designer of the CatPac
program. This program he describes as:
An unsupervised neural network that is designed to read and "understand"
text. CATPAC reads any ASCII text; discards minor words such as articles,
prepositions, and the like from a prewritten exclude file; and discards
additional words that fall below an arbitrary, user-set frequency of occurrence.
For each remaining word, an artificial neuron is constructed that represents
that word. A scanning window of user-set size is then passed through the text.
Whenever a given word is in the scanning window, the neuron that represents
that word is activated (its activation value is set to 1.0). (Woelfel, 1993, p.72).
1.8 The output from this program includes counts of words and a dendogram that shows
the groupings of words that help form a theme.
1.9 Smith and Humphreys (2006, p.262) explain the principles of Leximancer thus:
A unified body of text is examined to select a ranked list of important lexical
terms on the basis of word frequency and co-occurrence usage. These terms
then seed a bootstrapping thesaurus builder, which learns a set of classifiers
from the text by iteratively extending the seed word definitions. The resulting
weighted term classifiers are then referred to as concepts. Next, the text is
classified using these concepts at a high resolution, which is normally every
three sentences. This produces a concept index for the text and a concept co-
occurrence matrix. By calculating the relative co-occurrence frequencies of the
concepts, an asymmetric co-occurrence matrix is obtained. This matrix is used
6
to produce a two-dimensional concept map via a novel emergent clustering
algorithm. The connectedness of each concept in this semantic network is
employed to generate a third hierarchical dimension, which displays the more
general parent concepts at the higher levels.
1.10 Such programs have been commonly used in many areas of research by researchers
using text based materials, whether secondary documentation or transcribed materials.
For example Lockyer (2005), Stepchenkova and Morrison (2006), and Ryan and Cave
(2005) among many others used CatPac to assess destination image and people’s
perceptions of the role of cleanliness in hotel selection. Leximancer was used by
Darcy and Pegg (2011) to assess hotel managers’ perceptions of services for those
with disabilities, while Ho et al. (2012) discusses the use of such programs more
widely in the context of text mining and web 2.0. Other similar programs like NVivo
and Atlas ti have also been extensively used. The use of this software in this report
therefore follows a conventional form of analysis among those who use such
approaches.
1.11 The first stages in the analysis comprised a reading and re-reading of the total text and
two processes were initially undertaken. The first comprised identification of themes
and discussion between the authors, and the second represented a paring down of the
text to the core themes by a simplification of the text. This process of simplification
required a number of stages that included:
a) Standardization of the text by using the singular or plural consistently unless it
was thought a distinction was being made in the main text that required a
distinction to be made;
b) Standardization of text through examining the tense of verbs, adverbs and
adjectives, and the presence of active or passive voice in statements. Again
distinctions were retained when they supported different themes.
c) Identification of the negative and positive with reference to themes. In a sense
this represents an evaluation of a theme, or perhaps in some instances a
description. For example the text may refer to ‘good food’ or ‘good service’
while another illustration of the themes of ‘food’ and ‘service’ might refer to
7
‘poor food’ or ‘poor service’. Thus the ‘dominant themes’ of food and service
can possess both a positive and a negative evaluation – but both aspects
reinforce the importance of ‘food’ and ‘service’ as a key component in tourist
evaluations of their experiences.
1.12 In the following graphs and diagrams it will be noted that several words such as
‘hotels’, and ‘restaurants’ appear in both the singular and the plural – and this
indicates a distinction between a respondents talking about hotels in general such as in
the statement ‘I found all the hotels to be of a good standard’ and then commenting
about a specific hotel such as saying ‘I found the xxx hotel to be particularly poor for
the money I paid’. The text was carefully examined as noted above and thus these
distinctions were retained to aid subsequent analysis.
2.0 The Statistical Analysis
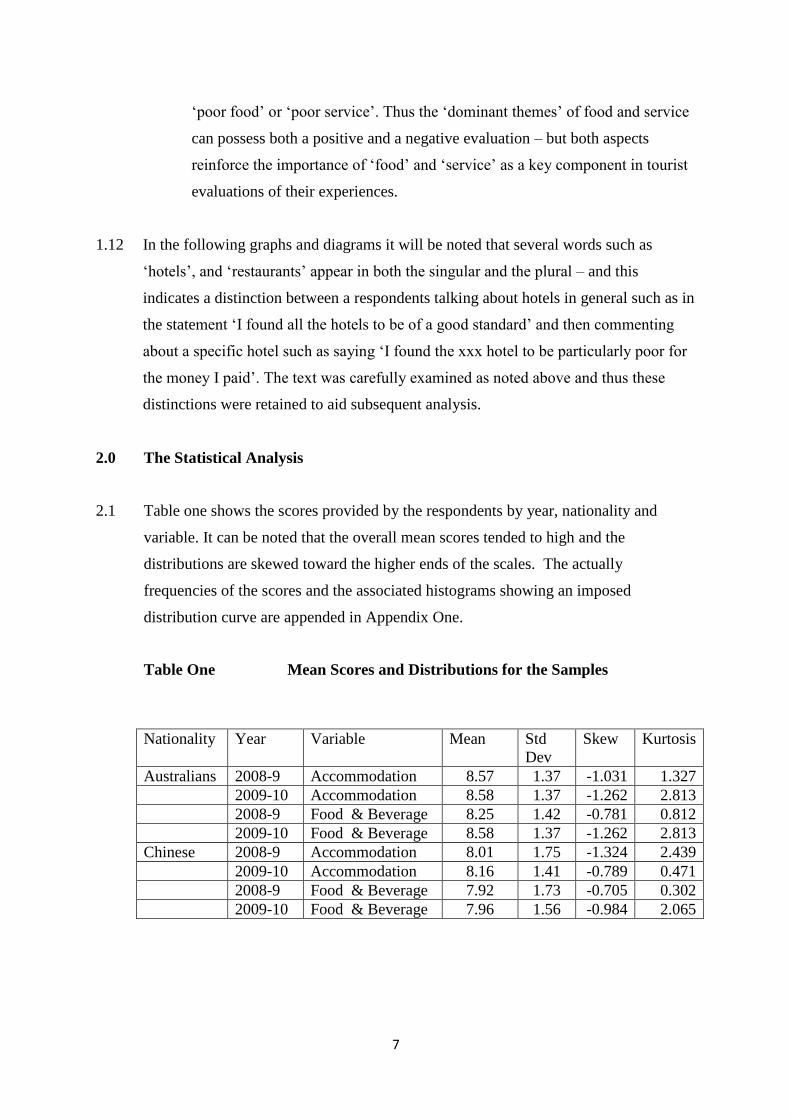
2.1 Table one shows the scores provided by the respondents by year, nationality and
variable. It can be noted that the overall mean scores tended to high and the
distributions are skewed toward the higher ends of the scales. The actually
frequencies of the scores and the associated histograms showing an imposed
distribution curve are appended in Appendix One.
Table One Mean Scores and Distributions for the Samples
Nationality Year Variable Mean Std
Dev
Skew Kurtosis
Australians 2008-9 Accommodation 8.57 1.37 -1.031 1.327
2009-10 Accommodation 8.58 1.37 -1.262 2.813
2008-9 Food & Beverage 8.25 1.42 -0.781 0.812
2009-10 Food & Beverage 8.58 1.37 -1.262 2.813
Chinese 2008-9 Accommodation 8.01 1.75 -1.324 2.439
2009-10 Accommodation 8.16 1.41 -0.789 0.471
2008-9 Food & Beverage 7.92 1.73 -0.705 0.302
2009-10 Food & Beverage 7.96 1.56 -0.984 2.065
8
2.2 Given the lack of time and the other as yet un-used data existing, it is envisaged that a
final report can provide a testing of the statistical difference between various national
groupings and the consistency of their responses.
3.0 Australians’ Assessments of Accommodation in 2008-9
3.1 Reading the text indicated the existence of themes based around the cleanliness of
accommodation, the friendliness of hosts, the comfort and facilities of rooms, and
value for money, leading to a conclusion that dissatisfaction arises when faults are
found in the above list of items. The presence of each of these factors contribute to
assessments that the accommodation is ‘good’. Location is secondary in the
assessments for while the destination is the place visited, each destination tends to
offer a choice of accommodation, and thus the assessment of accommodation is based
upon the quality of service offered at the selected hotel, motel or holiday park. It is
this assessment that lead people to conclude whether accommodation represented
good value for money. These three named forms of accommodation accounted for
most of the references and although a count remains to be done it would seem that
motels account for most of the entries, followed by hotels, then camp grounds –
particularly those of the top 10 holiday parks, followed by staying with friends and
relatives.
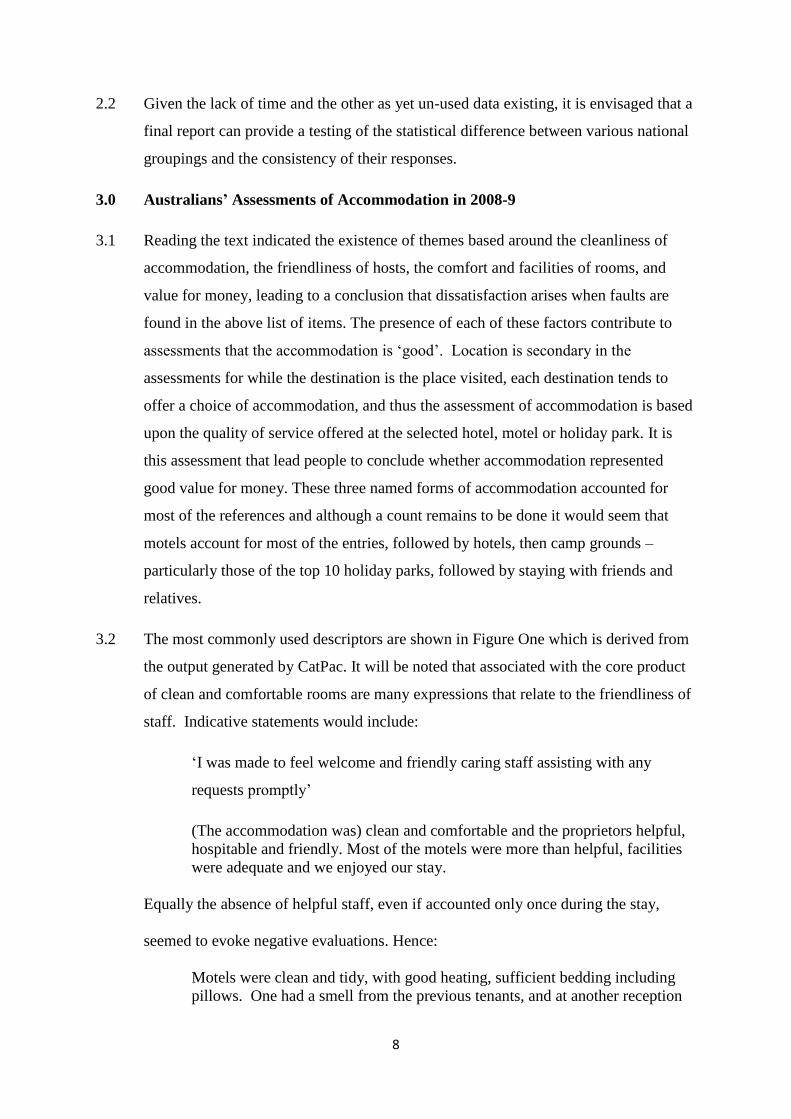
3.2 The most commonly used descriptors are shown in Figure One which is derived from
the output generated by CatPac. It will be noted that associated with the core product
of clean and comfortable rooms are many expressions that relate to the friendliness of
staff. Indicative statements would include:
‘I was made to feel welcome and friendly caring staff assisting with any
requests promptly’
(The accommodation was) clean and comfortable and the proprietors helpful,
hospitable and friendly. Most of the motels were more than helpful, facilities
were adequate and we enjoyed our stay.
Equally the absence of helpful staff, even if accounted only once during the stay,
seemed to evoke negative evaluations. Hence:
Motels were clean and tidy, with good heating, sufficient bedding including
pillows. One had a smell from the previous tenants, and at another reception
9
staff were not overly helpful. Otherwise all motels were very good." And
again:
Two hotels and one apartment were generally good; XXX apartment in
Auckland was comfortable, but staff seemed sometimes out of their depth and
parking arrangements were totally unsatisfactory
3.3 However, comments about a lack of help from staff were rare, and indeed such was
the performance of staff that respondents provided comments that indicated that such
was the friendliness of the service they would overlook what was regarded as ‘tired’
furnishings or otherwise deficient accommodation.
Figure One Most common words
10
3.4 While the majority of statements relating to accommodation were positive as
indicated by the high mean score on this item, there was little doubt that a number of
informants would come across some accommodation that they felt to be poor, or if not
poor, somewhat basic for the prices they were paying. Examples of such statements
include:
The staff and owners were displaying a high standard of service and were
prepared to go beyond the call of duty when a situation required such an event.
… it was close to everything, clean and relatively cheap. With friendly staff.
It was because of very good service even though the hotel needs some
attraction/refurbishments. Staff were so nice and efficient.
3.5 Support for the themes found through interpreting the text was found in the following
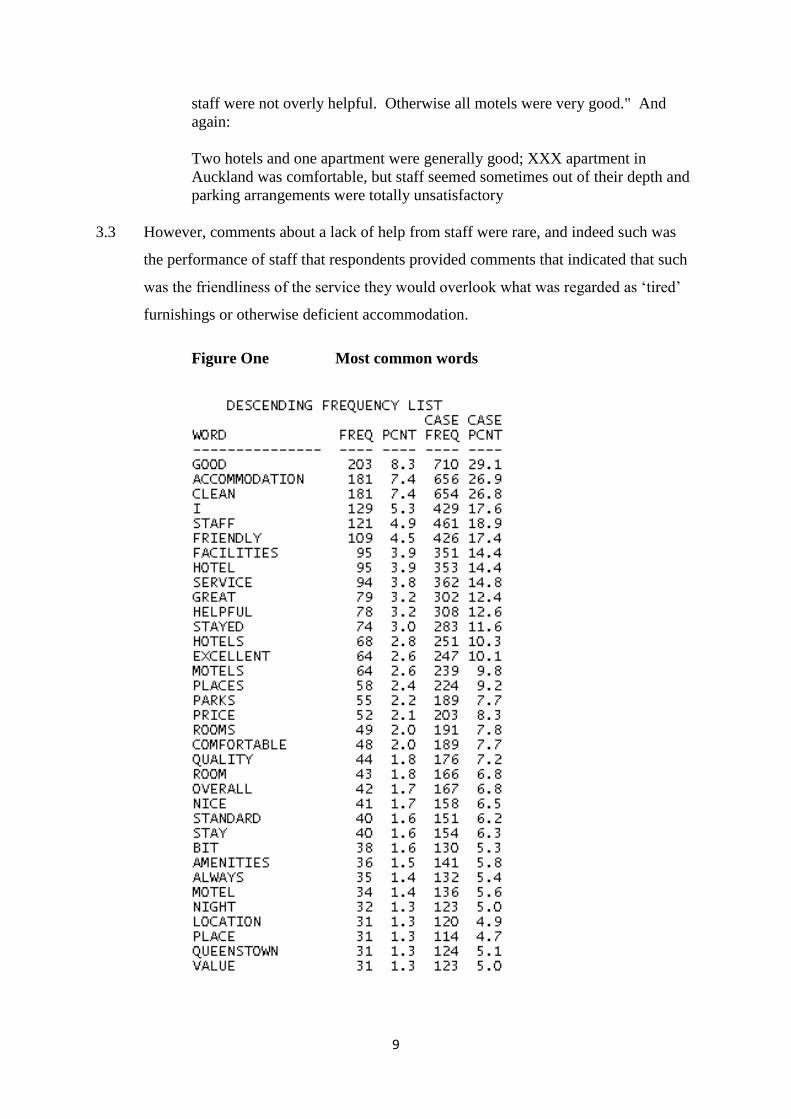
diagrams generated by the software.
Figure Two Word Map of Themes
3.6 Figure Two indicates a word map derived from Leximancer and the interpretation of
such maps is based on the size of words and their proximity to each other, and the
colour rating. Those colours that are oriented toward shades of red are ‘warm’ and
‘positive’ while those words that are oriented toward blue represent rather more
11
negative sentiments. It can be seen that (perhaps not surprisingly, given the question)
that accommodation is important, and its shading represents the overall positive
comments made about accommodation and facilities in New Zealand. Red comments
show the overall satisfaction found with cleanliness and the friendliness of staff. As
noted – where these were absent, they were sources of dissatisfaction and drew
specific comments about individual motels or hotels.
3.7 Among the negative features of rooms that were general as distinct from the
occasional smelly, or messy room, was the comment that today there should be
efficient wif-fi and preferably free wi-fi services – but only 3 respondents made such
comments. It will be noted in the Figure that the ‘parks’ are in mauve – indicating
some tendency toward the lower end of the scale. In most instances this set of
comments refer to the holiday parks, and it must be emphasised that most comments
were positive, and some individual parks drew high praise. However, two factors
support the ‘cooler’ nature of the comments, and these related to (a) the somewhat
variable standard found between the different caravan and holiday parks, and (b) a
sentiment expressed by some that the parks tended to be a little expensive for what
was on offer. For example, among these comments were:
The gardens and general surrounds of parks are not as nice as we have in
Australia. It is a little disappointing to go into a park and just park on a spot
next to another vehicle. There was often not a lot of space between vans.
Amenities were generally excellent in kitchens etc. but showers were a little
shabby at times.
Only a few parks had less than good amenities, but in general, they were all
quite good.
Most of the caravan parks we stayed at were fine, but one on the East coast on
the way to Marlborough wasn't much good.
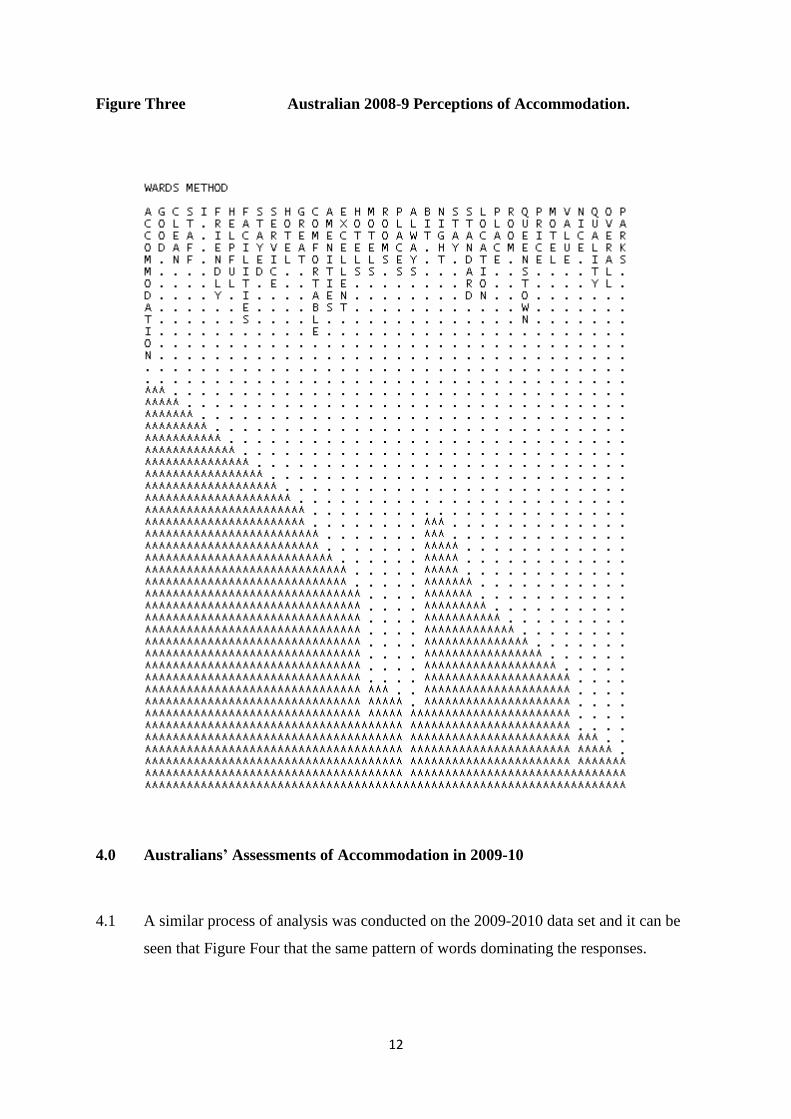
3.8 The dendogram generated by CatPac is shown in Figure Three and this tends to
support the above interpretation with the left hand side of the diagram emphasising
the importance and connectedness of the main themes of clean accommodation and
helpful and friendly staff leading to good experiences and in many cases ratings of
excellence.
12
Figure Three Australian 2008-9 Perceptions of Accommodation.
4.0 Australians’ Assessments of Accommodation in 2009-10
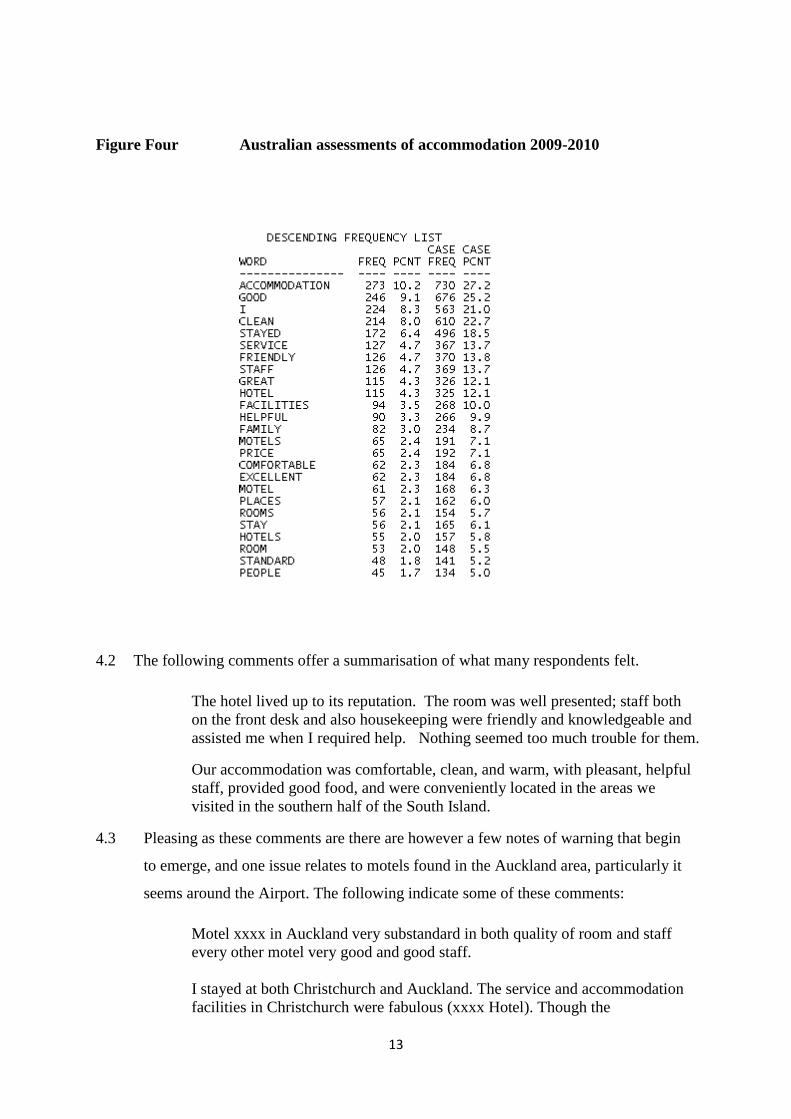
4.1 A similar process of analysis was conducted on the 2009-2010 data set and it can be
seen that Figure Four that the same pattern of words dominating the responses.
13
Figure Four Australian assessments of accommodation 2009-2010
4.2 The following comments offer a summarisation of what many respondents felt.
The hotel lived up to its reputation. The room was well presented; staff both
on the front desk and also housekeeping were friendly and knowledgeable and
assisted me when I required help. Nothing seemed too much trouble for them.
Our accommodation was comfortable, clean, and warm, with pleasant, helpful
staff, provided good food, and were conveniently located in the areas we
visited in the southern half of the South Island.
4.3 Pleasing as these comments are there are however a few notes of warning that begin
to emerge, and one issue relates to motels found in the Auckland area, particularly it
seems around the Airport. The following indicate some of these comments:
Motel xxxx in Auckland very substandard in both quality of room and staff
every other motel very good and good staff.
I stayed at both Christchurch and Auckland. The service and accommodation
facilities in Christchurch were fabulous (xxxx Hotel). Though the
14
accommodation in Auckland were still good, but not fantastic as there were
stains on the carpet and cramped accommodation (xxx hotel).
4.4 Not that problems were confined to Auckland. Thus:
See previous comments - there was no standard amongst B&B and Homestay
operators, only run down facilities and DIY renovations, yet still considered
themselves ""luxury"". Many were for sale.
Motels were better - at least the room was decent and clean. The cheaper
motel in Rotorua had dangerous electrical faults (switches falling apart) and
plumbing threatening to flood the room. Toilet pipes held together with tape
with a container underneath to drip into - which was full! No drain in the
bathroom meant a flood was result. Money grabbing owner prowling the car
park in the morning was not a good look either.
4.5 The last comment does however, stick out, and as generally as indicated by the overall
mean score, the ratings remained high. Indeed, in 2009-10, 80.7 per cent of the
respondents scored 8 and above for their accommodation, equivalent to 2008-9 when
80.6 per cent so scored.
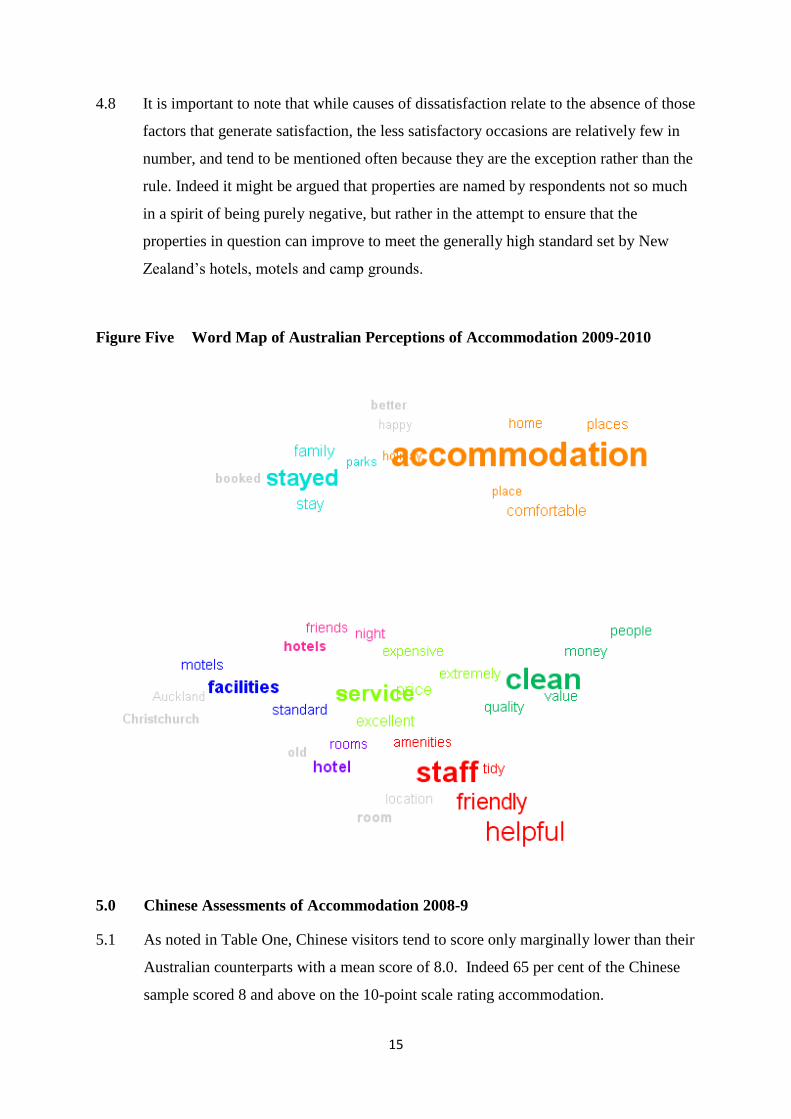
4.6 In this regard Figure Five reinforces the findings of the 2008-9 data and indicates that
the friendliness of staff remain a significant asset for accommodation, while the
accommodation itself retains generally high ratings although, as previously noted
comments are made about some accommodation being more basic than was thought
necessary, being in need of refurbishment and being expensive for what it is.
Comparisons are made with Australia, generally, but not always favourably. Minor
items emerge – such as the lack of space for car parking, the lack of free wi-fi and the
outmoded and poor condition of some of the hardware supplied for use in some of the
kitchen units for cooking purposes. In some instances there was an adverse comment
about the lack of a microwave cooker, or the want of a working microwave cooker.
4.7 Cleanliness and service are generally favourable commented upon and are important,
but the colouring of the chart indicates the existence of critical comment when tourists
feel these to be missing or below the standard they expect. The variation of the
standard found in motels was also a negative factor, and a handful of respondents
queried the usefulness of the Qualmark brand, feeling that it over-stated the star value
of the property in question.
15
4.8 It is important to note that while causes of dissatisfaction relate to the absence of those
factors that generate satisfaction, the less satisfactory occasions are relatively few in
number, and tend to be mentioned often because they are the exception rather than the
rule. Indeed it might be argued that properties are named by respondents not so much
in a spirit of being purely negative, but rather in the attempt to ensure that the
properties in question can improve to meet the generally high standard set by New
Zealand’s hotels, motels and camp grounds.
Figure Five Word Map of Australian Perceptions of Accommodation 2009-2010
5.0 Chinese Assessments of Accommodation 2008-9
5.1 As noted in Table One, Chinese visitors tend to score only marginally lower than their
Australian counterparts with a mean score of 8.0. Indeed 65 per cent of the Chinese
sample scored 8 and above on the 10-point scale rating accommodation.
16
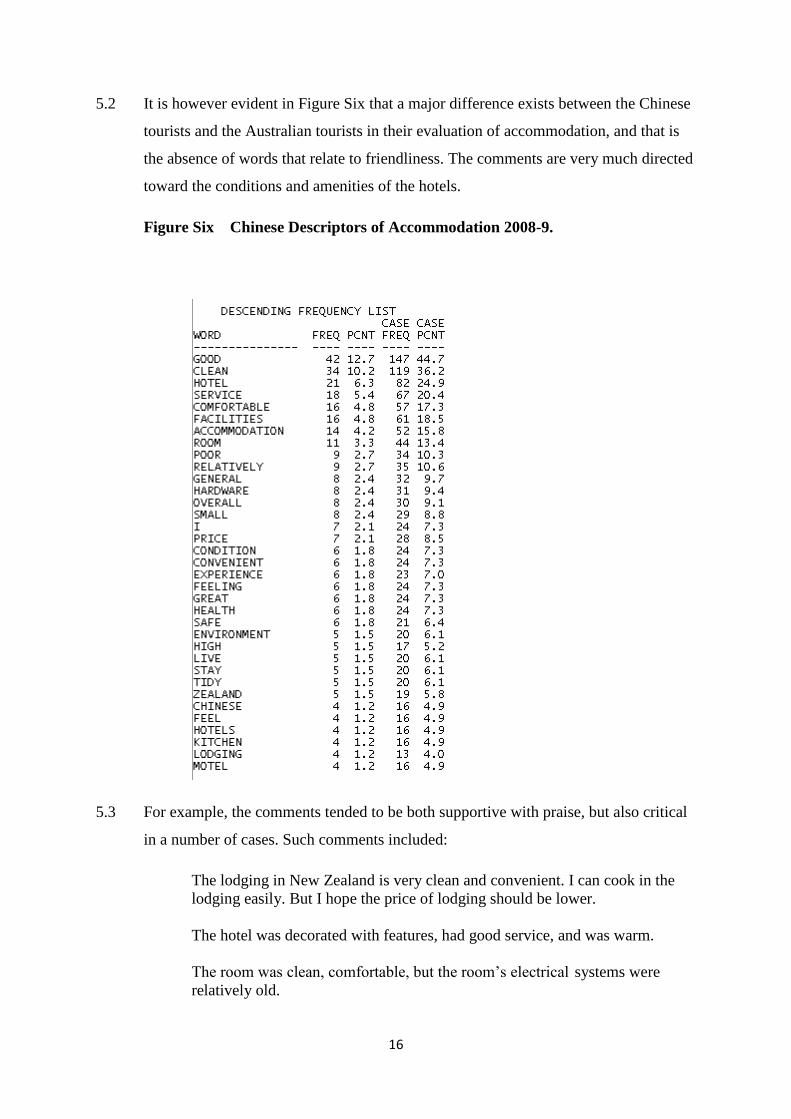
5.2 It is however evident in Figure Six that a major difference exists between the Chinese
tourists and the Australian tourists in their evaluation of accommodation, and that is
the absence of words that relate to friendliness. The comments are very much directed
toward the conditions and amenities of the hotels.
Figure Six Chinese Descriptors of Accommodation 2008-9.
5.3 For example, the comments tended to be both supportive with praise, but also critical
in a number of cases. Such comments included:
The lodging in New Zealand is very clean and convenient. I can cook in the
lodging easily. But I hope the price of lodging should be lower.
The hotel was decorated with features, had good service, and was warm.
The room was clean, comfortable, but the room’s electrical systems were
relatively old.
17
The New Zealand accommodation environment is very clean and tidy, and
service is very attentive, but the hardware needs to be upgraded.
The facilities were in perfect condition - very comfortable.
Generally quite good & clean in the South Island but so many crappy ones in
Wellington and Auckland
Some of the accommodation were great and beyond my expectation, while
some were below average. Sometimes the description was not consistent with
the real condition, which made me difficult to decide where to stay.
5.4 The Chinese do differ from Australians in their assessments, yet tend to score
almost as highly as the Australians. There are a number of comments that can be
made about why such results arise. These include:
Chinese culture is in part about mianzi or face, and it is not polite to make
critical comments about a host.
Australians did cite the advantage of their dollar being higher than that of the
New Zealand dollar, and thus felt that prices in New Zealand tended to be
lower and at worse, acceptable. Chinese tourists were facing what for them
was a high New Zealand dollar, and thus they tend to be more price sensitive.
Chinese tourists are less likely to be free independent tourists (FIT) and can be
classified as existing on a continuum from low priced shopping package
tourists to quality package tours to free independent tourists. Those on
shopping tours are more likely to stay in lower priced accommodation and
hence more likely to come across some of the issues referred to above.
5.5 With reference to specific points comparisons were made with hotels in other
countries, including China. It was thus noted that beds were small compared to those
in China, the amenities were not so modern as many had expected, but on the other
hand a double bed room with four bedspaces made a four-star hotel reasonable in
price per person, while many enjoyed the facility of a small kitchen area in motels as
this is uncommon in China, and it permitted self-catering that helped to save money.
It can also be noted that Chinese tend to like a firm mattress and it is suggested that
this may lie behind comments of being ‘uncomfortable’.
18
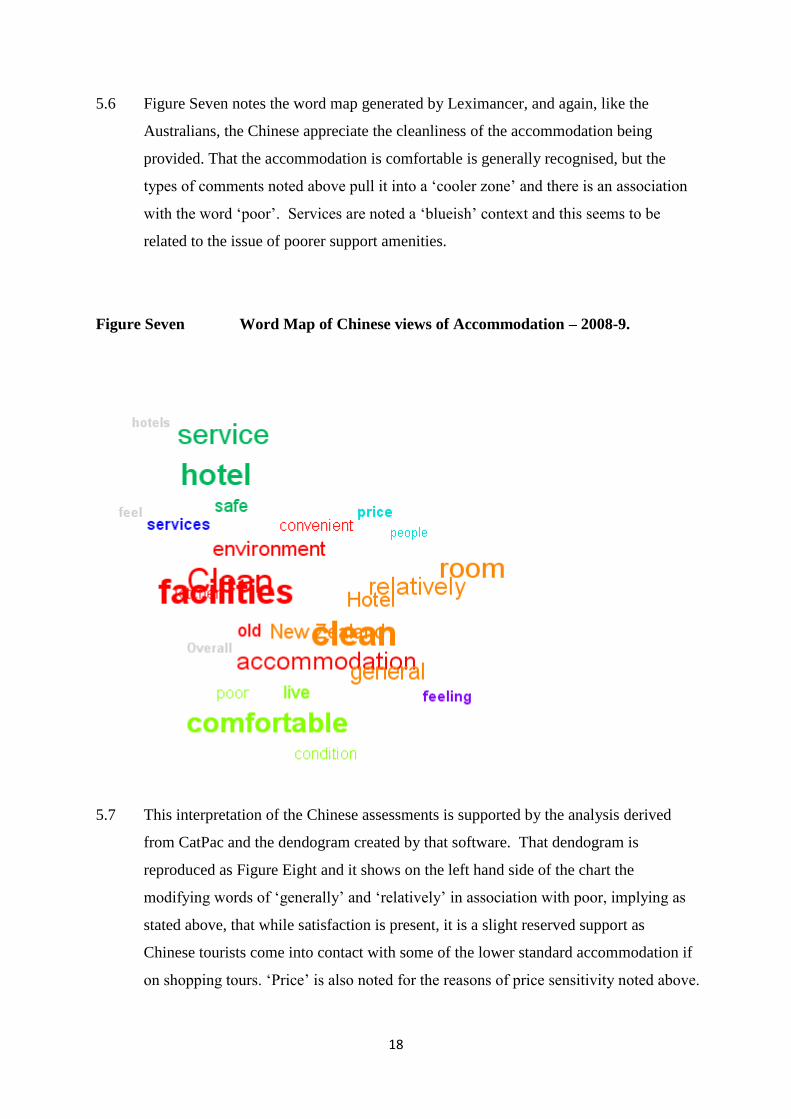
5.6 Figure Seven notes the word map generated by Leximancer, and again, like the
Australians, the Chinese appreciate the cleanliness of the accommodation being
provided. That the accommodation is comfortable is generally recognised, but the
types of comments noted above pull it into a ‘cooler zone’ and there is an association
with the word ‘poor’. Services are noted a ‘blueish’ context and this seems to be
related to the issue of poorer support amenities.
Figure Seven Word Map of Chinese views of Accommodation – 2008-9.
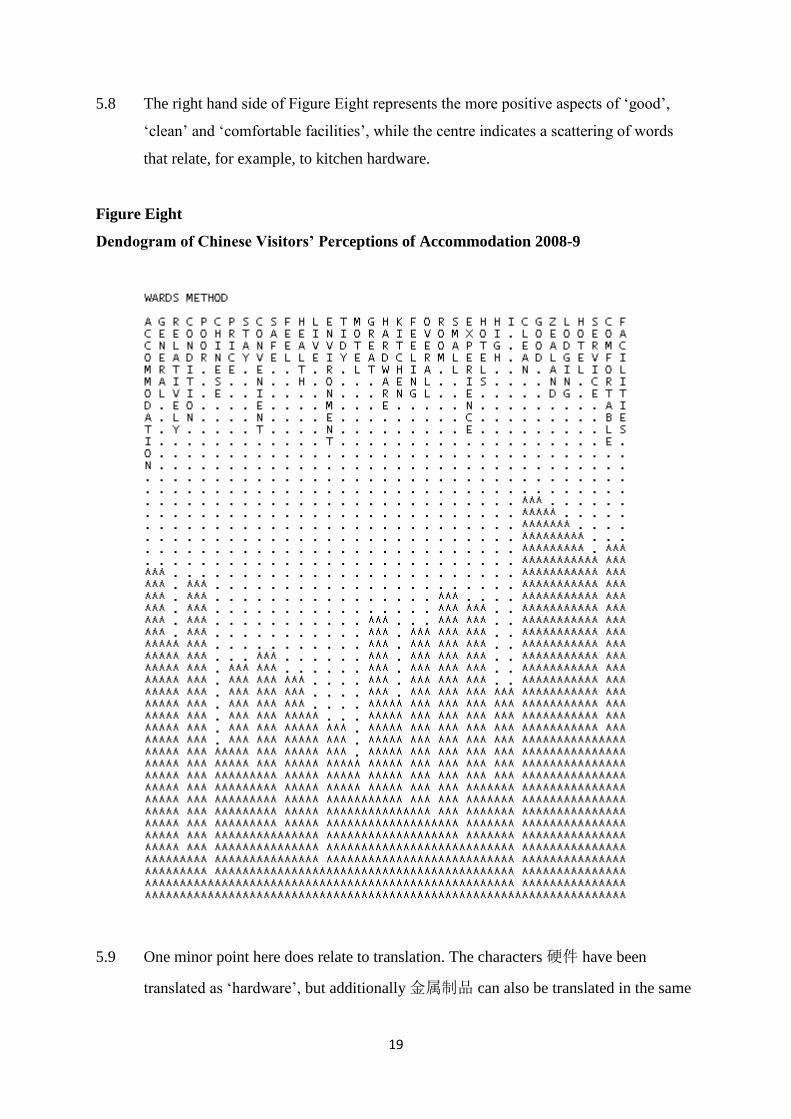
5.7 This interpretation of the Chinese assessments is supported by the analysis derived
from CatPac and the dendogram created by that software. That dendogram is
reproduced as Figure Eight and it shows on the left hand side of the chart the
modifying words of ‘generally’ and ‘relatively’ in association with poor, implying as
stated above, that while satisfaction is present, it is a slight reserved support as
Chinese tourists come into contact with some of the lower standard accommodation if
on shopping tours. ‘Price’ is also noted for the reasons of price sensitivity noted above.
19
5.8 The right hand side of Figure Eight represents the more positive aspects of ‘good’,
‘clean’ and ‘comfortable facilities’, while the centre indicates a scattering of words
that relate, for example, to kitchen hardware.
Figure Eight
Dendogram of Chinese Visitors’ Perceptions of Accommodation 2008-9
5.9 One minor point here does relate to translation. The characters 硬件 have been
translated as ‘hardware’, but additionally 金属制品 can also be translated in the same
20
manner, but referring to metal objects. Equally Chinese like hotels with ‘impressive’
public areas and under certain circumstances this might be seen as part of the ‘ware’
or product of the hotel.
5.10 Overall though the scores are favourable with reference to accommodation and
highlight many of the same characteristics as the Australians. However the
‘friendliness’ of New Zealanders as hosts is more muted as a concept, perhaps
because of language issues, although only one respondent specifically referred to a
lack of linguistic skills, and this was of Cantonese. Two militating factors can also be
noted, namely (a) in interpreting the score one must be aware of a relative
unwillingness to criticize and (b) the Chinese sample is thought to be less
homogenous than their Australian counterparts in terms of travel patterns with, for
example, shopping tours being more oriented to North Island.
6.0 Chinese Assessments of Accommodation 2009-10
6.1 When the list of descriptors for 2009-2010 is looked at (see Figure Nine), it can be
found that similarities exist with those of 2008-9. The cleanliness of accommodation
emerges as being both important and appreciated by Chinese tourists. The overall
experience is seen as positive (as indicated by a mean score of 8.1) yet there are again
comments about some poorly furnished and basic accommodation, and some older
amenities to be found in some accommodation. Again comments are to be found
about the mixed quality of the provision of accommodation, although it is recognized
that the overall standard is high. Price sensitivity is also an issue, and tends to emerge
more strongly than in 2008-9, reflecting possibly the increase in the New Zealand
dollar over the period.
6.2 With reference to comments about expense, a number of comments illustrate that
while the Chinese are not being deterred by price, nonetheless in 2009-10 there did
seem to be a little more concern about value for money. Thus comments included:
Expensive prices even if accommodation is generally good.
Accommodation is OK, but the price of some is expensive.
21
Homestay is also good, but a little expensive.
European countries, represent more economic prices, better style and services
made me feel at ease and satisfied.
6.3 Nonetheless it is suggested that the reasons listed in section 5.4 remain true in the
later year of 2009-10.
Figure Nine Descriptors of Chinese Assessments of Accommodation 2009-2010
6.4 For the completeness of the record, the Leximancer software generated similar
patterns and comments as is briefly noted in the Figures below.

22
Figures Ten and Eleven Chinese Assessments of Accommodation 2009-2010
23
7.0 Australians’ Assessment of Food and Beverage 2008-9
7.1 In this instance approximately 73 per cent of Australian provided scores of 8 and
above in their assessments of Food and Beverage in New Zealand. Figure Twelve
derived from the word counts indicate the dominance of words such as ’good’, ‘great’,
‘excellent’ and ‘fresh’.
Figure Twelve Australian Assessments of Food and Beverage 2008-9
7.2 Examples of such comments include:
Even when I was meeting up with friends somewhere I hadn't been before the standard
of service and quality of food is MUCH nicer than can be found in Melbourne.
Overall most of the cafe/restaurants had excellent food and service with the exception
of a couple.
All the food was extremely delicious and the staff very friendly and polite
24
Great service, fantastic food and value for money
Presentation of meals was excellent, experienced different flavour combinations.
Everywhere we went staff polite, helpful and informative.
We were never disappointed with any meal.
7.3 As with issues of accommodation, some exceptions to the generally high quality of
food, service and value for money were found, and these seem to have been issues of
staff responses – such as the example of being refused just a coffee because a
breakfast was not ordered, or the comment that staff could be taught how to smile at
one location.
7.4 There were 113 uses of the word ‘expensive’ and this was examined within the data
sets. The overall impression is that Australians do find the price of food more
expensive than that to which they are accustomed, and even the supermarket prices
are thought more expensive. To a small degree this is offset a little by some comments
that the quality is better, but nonetheless, even allowing for the strength of the
Australian dollar the impression remains that for Australians eating out, especially in
the more upmarket restaurants is regarded as expensive.
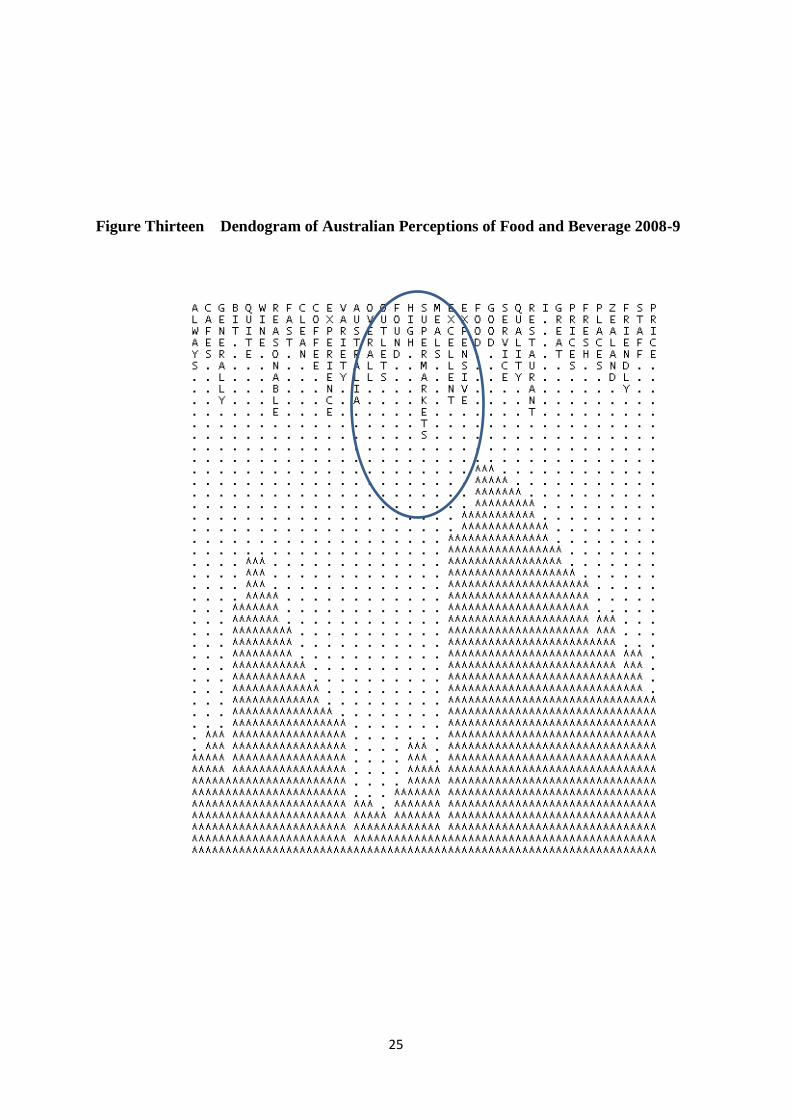
7.5 This conclusion was supported by the analysis derived from the dendogram generated
by CatPac and the perceptual map derived from Leximancer. In the dendogram
shown as Figure thirteen one finds the cluster ‘good food, quality, excellence and
restaurants’ incorporate the term ‘expensive’. Equally staff are ‘friendly’ and
Australians will call New Zealand wines ‘generally quite reasonable’!
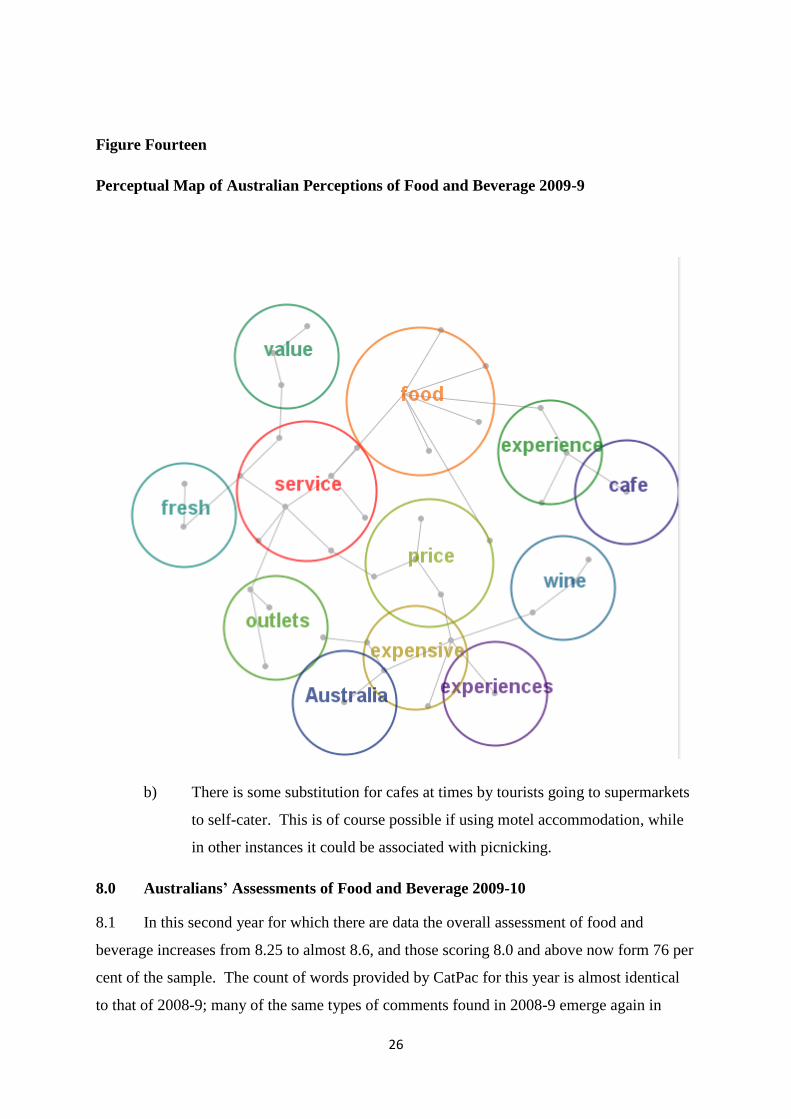
7.6 Figure fourteen reproduces the perceptual map generated by Leximancer and again
the same themes dominate the analysis. As before the distinction between the words
‘experience’ and ‘experiences’ is that the latter refers to the general assessment while
the former refers to a specific outlet. There also appears to be two substitution effects
occurring because of perceptions of meals being expensive, and these are:
a) A willingness to patronise cafes because the quality of food and
service is thought to be high, and hence restaurants are losing some
trade to the cafes; and
25
Figure Thirteen Dendogram of Australian Perceptions of Food and Beverage 2008-9
26
Figure Fourteen
Perceptual Map of Australian Perceptions of Food and Beverage 2009-9
b) There is some substitution for cafes at times by tourists going to supermarkets
to self-cater. This is of course possible if using motel accommodation, while
in other instances it could be associated with picnicking.
8.0 Australians’ Assessments of Food and Beverage 2009-10
8.1 In this second year for which there are data the overall assessment of food and
beverage increases from 8.25 to almost 8.6, and those scoring 8.0 and above now form 76 per
cent of the sample. The count of words provided by CatPac for this year is almost identical
to that of 2008-9; many of the same types of comments found in 2008-9 emerge again in
27
2009-10. Given this similarity, in this year closer examination were given to the negative
comments, and these included:
I’m in hospitality, so super critical of lax service, a lot of cafe food is
overpriced, service patchy, exceptions here and there of course. Mostly do my
own food, and supermarkets are vile places to be in, sadly that’s where the
food is though. Buy from common sense organics, farmers markets where
available.
Loved pub meals; cafe food was ok and restaurant less than average; the
waiters were quite rude. When returning to New Zealand will stick to the pub
meals; the service and bar staff were excellent.
High price in Wellington restaurant with only average food. Moderate price
paid in Te Anau for excellent food.
The food and service is ok, but it is quite expensive for what you get - even
compared to Australia where wage rates are generally higher
8.2 In conclusion, the same conclusions can be drawn, namely that overall there are high
levels of satisfaction, but there is an impression that prices are high, that exceptions to
the generally high standards are experienced, and that restaurants may represent an
expensive option when compared to cafes.
9.0 Chinese Assessments of Food and Beverage 2008-9
9.1 It was earlier noted that the Chinese market is influenced by the existence of the
shopping tours, and this too is evident in some of the comments made respondents.
For example:
… because we are into travel agency with a Chinese restaurant, the food is of
poor quality, bad service.
(Being in a group tour) there were excessively reduced costs, resulting in
group meals and humble, poor food and I failed to contact with local New
Zealand cuisine!
9.2 Because of this phenomenon and the tendency for these packaged tours to use Chinese
restaurants, there are a number of comments directed at the nature of food being served
in New Zealand’s Chinese restaurants, including, for example:
… since the choices are Chinese restaurants, I can say it leaves a bad taste and
the food is not authentic, thought this may be a matter of taste.
28
…you can't expect a 10 mark for Chinese food in New Zealand!
9.3 This is not to say that all respondents thought it a bad thing to dine at Chinese
restaurants as some commented that Western cuisine was not their liking, and hence
while the Chinese food was not to the standard they were used too, it was nonetheless
appreciated that they could obtain Chinese food easily.
9.4 There were Chinese tourists who were enthusiastic about the quality of food offered
by New Zealand cafes and restaurants, and hence comments included:
I only cared whether the food is clean and fresh, and New Zealand does this
well.
Great wine; especially the whites! We ate too much!
Healthy, delicious and real benefits.
A good service and reasonable prices
… clean, healthy, and assured food quality.
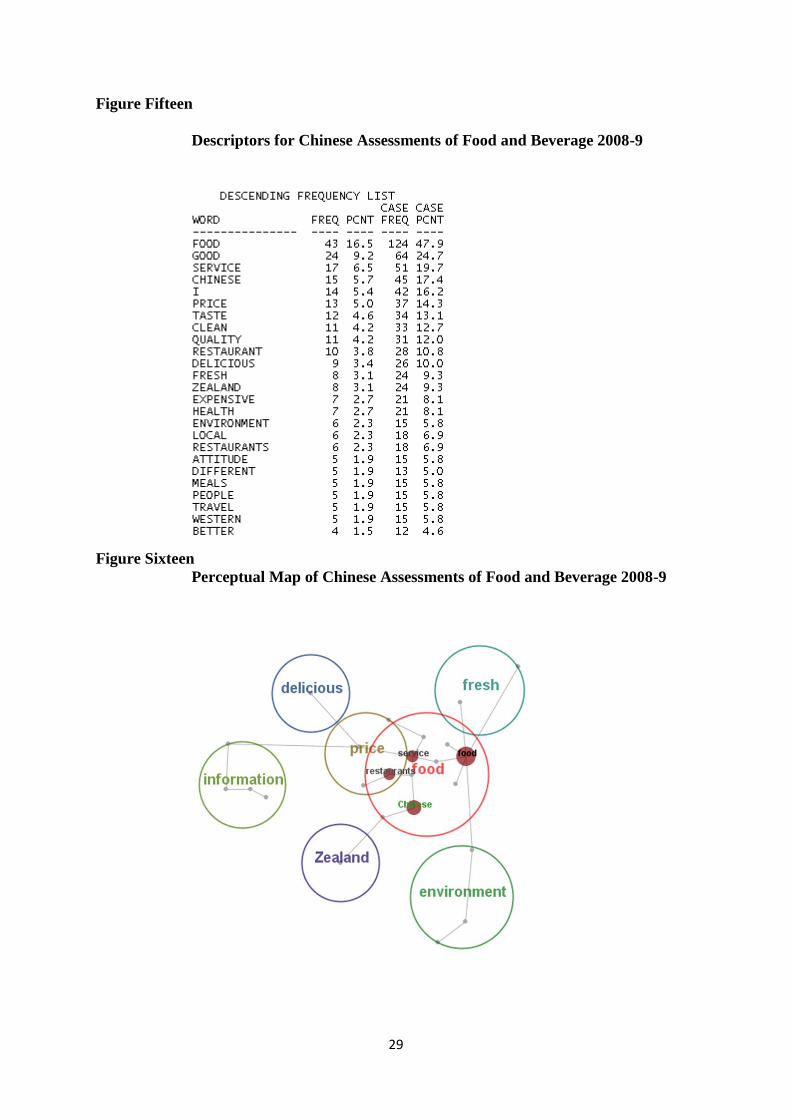
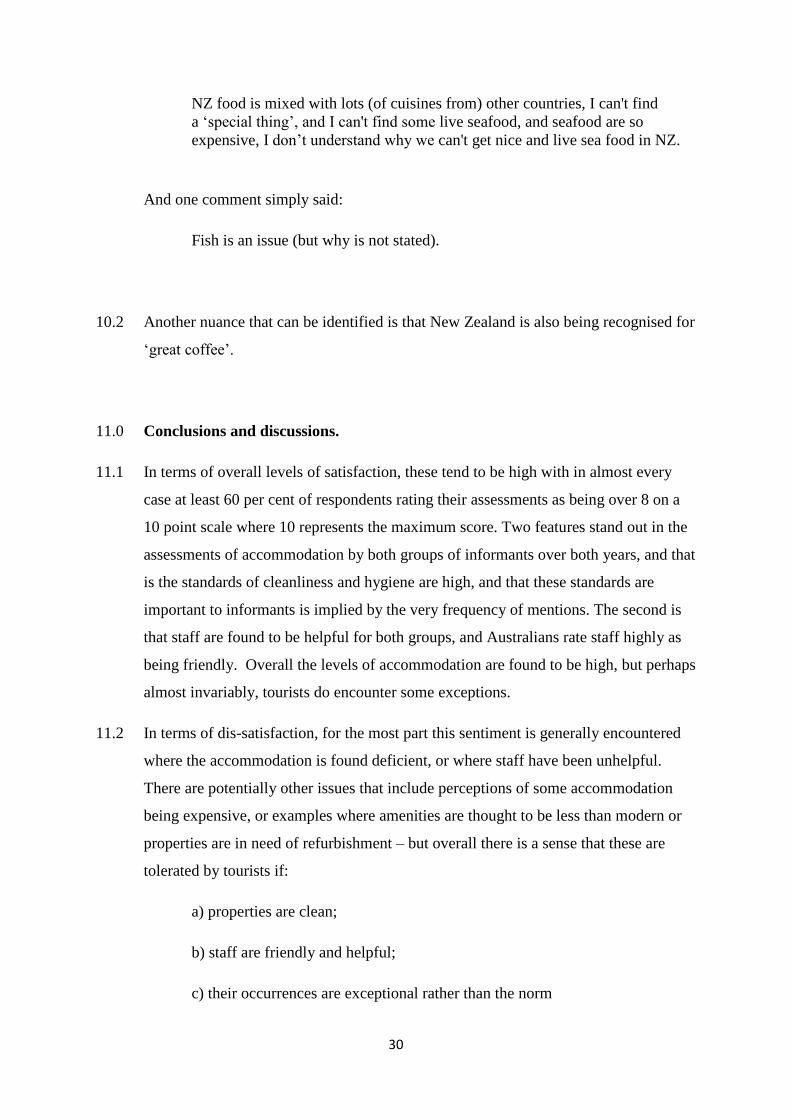
9.5 Figure Fifteen replicates the list of key words found in the text and it has a similarity
to that generated by Australia informants – namely the food is generally perceived as
being fresh and of good quality. This is also evidenced by perceptual map shown in
Figure Sixteen. Again it can be noted that price emerges as a factor, but as previously
noted, it is thought that this is in part because of the heterogeneous nature of the
Chinese market for New Zealand.
10.0 Chinese Assessments of Food and Beverage 2009-10
10.1 Again it must be noted that levels of assessment are again high at 7.9 overall, with 65.8
of the sample scoring 8.0 and above. Indeed the descriptors and the maps tend to mirror
those for 2008-9. However some nuanced differences did emerge. One related to sea
food. The Chinese are used to being offered a whole steamed fish, and thus the
conventional New Zealand modes of presentation with fillets of fish is one that some
informants found to be ‘different’. Hence one respondent commented
29
Figure Fifteen
Descriptors for Chinese Assessments of Food and Beverage 2008-9
Figure Sixteen
Perceptual Map of Chinese Assessments of Food and Beverage 2008-9
30
NZ food is mixed with lots (of cuisines from) other countries, I can't find
a ‘special thing’, and I can't find some live seafood, and seafood are so
expensive, I don’t understand why we can't get nice and live sea food in NZ.
And one comment simply said:
Fish is an issue (but why is not stated).
10.2 Another nuance that can be identified is that New Zealand is also being recognised for
‘great coffee’.
11.0 Conclusions and discussions.
11.1 In terms of overall levels of satisfaction, these tend to be high with in almost every
case at least 60 per cent of respondents rating their assessments as being over 8 on a
10 point scale where 10 represents the maximum score. Two features stand out in the
assessments of accommodation by both groups of informants over both years, and that
is the standards of cleanliness and hygiene are high, and that these standards are
important to informants is implied by the very frequency of mentions. The second is
that staff are found to be helpful for both groups, and Australians rate staff highly as
being friendly. Overall the levels of accommodation are found to be high, but perhaps
almost invariably, tourists do encounter some exceptions.
11.2 In terms of dis-satisfaction, for the most part this sentiment is generally encountered
where the accommodation is found deficient, or where staff have been unhelpful.
There are potentially other issues that include perceptions of some accommodation
being expensive, or examples where amenities are thought to be less than modern or
properties are in need of refurbishment – but overall there is a sense that these are
tolerated by tourists if:
a) properties are clean;
b) staff are friendly and helpful;
c) their occurrences are exceptional rather than the norm
31
11.3 There is a view on the part of many that accommodation does tend to be expensive in
some instances for what is on offer, but equally what is very rarely being stated is a
view that the accommodation is a ‘rip off’. There is perhaps an appreciation that,
simply put, prices are reflecting the current high value of the dollar. This seems to be
true even for some Australians who have also enjoyed a high dollar – and this is
particularly the case for food and beverage services and food prices in supermarkets.
11.4 While prices were thought to be high by some – it appears those expressing these
views are in a minority (a subsequent analysis will better quantify how large this
minority is, but an intuitive feeling would be that it represents about one-third of
respondents in both instances). Equally, however, the quality of the food and service
is helping to sustain the perceived high prices and again there are few examples of
people feeling overly aggrieved or taken advantage of. As always though, exceptions
exist to any generalised statement, and food and beverage share similar qualities to
those of accommodation – namely if the food is thought to be poor, and the service is
also thought poor, then a price that would be accepted if food or service is good, now
becomes too high and value for money is simply not being provided. Hence again
dissatisfaction is a result of the deficiencies in quality and service.
11.5 Another aspect of the tourism product is that tourists are able to engage in substitution
strategies, and that is evident in both cases of accommodation and food and beverage.
Tourists will happily switch motels for hotels if hotels are perceived as too expensive
because:
a) Motels offer generally high standards of accommodation; and
b) Offer the option of self-catering.
In this sense it can be observed that generally holiday parks are not being seen as
cheaper alternatives to motels, but as having a distinctly different experience offer.
This is true for the Australian market – there is little evidence of Chinese tourists
using holiday parks.
11.6 One facet in understanding the scores of the Chinese respondents is that very different
market segments co-exist, and it is suggested that a continuum exists between
shopping tours at one end and FITs at the other. Equally, in the case of some
Australian tourists, one segment that provides a slightly different pattern of responses
32
is the VFR sector. As one Australian informant wrote about food and beverage – the
purpose of my holiday is to see Mum, and Mum’s cooking is great!
11.7 In terms of any specific recommendations it can be noted that:
a) Some motels especially in Auckland and to a lesser degree in Wellington do
require refurbishment, especially perhaps some of the motels in the vicinity of
Auckland airport;
b) Some motels could upgrade the pots and pans being made available for guests,
and microwave ovens are expected as a standard provision;
c) The standard of food being provided by many Chinese restaurants is thought
to be deficient on the part of some Chinese tourist. Historically many Chinese
restaurants in New Zealand are actually Cantonese, and there are differences
in cuisine between Shanghai and Beijing on the one hand and the south of
China on the other, and hence there is a need for some greater variety of
regional cuisines.
11.8 Of interest is what has not emerged in this analysis, and that is on the part of the
Chinese, few have commented about an absence of Mandarin speaking skills. Various
reasons may account for this – the lower cost tours and indeed ‘quality tours’ are
accompanied by English speaking tour guides, and second, given the size of its
population, it could be claimed that China is the country with the highest numbers of
English speakers in the world. The FIT market tends to be well educated and of above
average income, and hence given that much post-graduate education is in English,
many of the FIT tourists will be English speaking.
11.9 Finally, it should be noted that this report was written within a time restraint that
means that further sets of data remain to be analysed. It can be stated that if this report
is thought sufficient, such further analysis can be undertaken of other national
groupings, thereby permitting greater comparisons.
33
Appendices
Histograms for overall scores
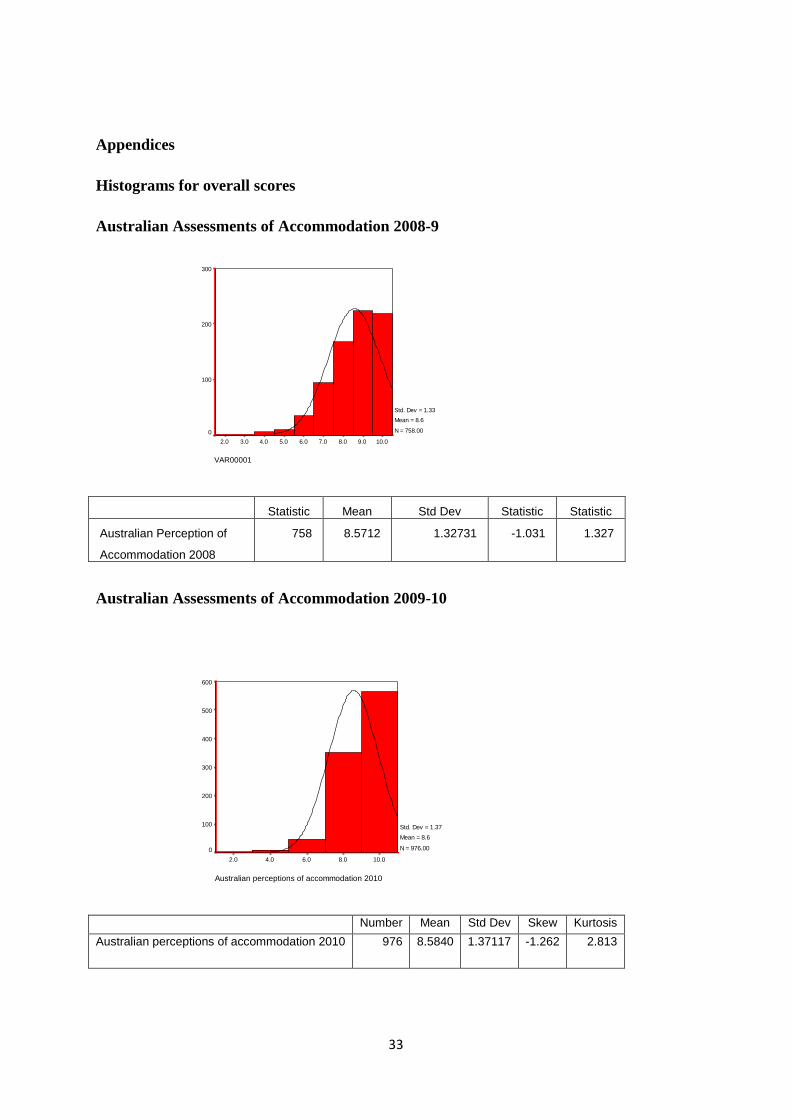
Australian Assessments of Accommodation 2008-9
VAR00001
10.09.08.07.06.05.04.03.02.0
300
200
100
0
Std. Dev = 1.33
Mean = 8.6
N = 758.00
Statistic Mean Std Dev Statistic Statistic
Australian Perception of
Accommodation 2008
758 8.5712 1.32731 -1.031 1.327
Australian Assessments of Accommodation 2009-10
Australian perceptions of accommodation 2010
10.08.06.04.02.0
600
500
400
300
200
100
0
Std. Dev = 1.37
Mean = 8.6
N = 976.00
Number Mean Std Dev Skew Kurtosis
Australian perceptions of accommodation 2010 976 8.5840 1.37117 -1.262 2.813
34
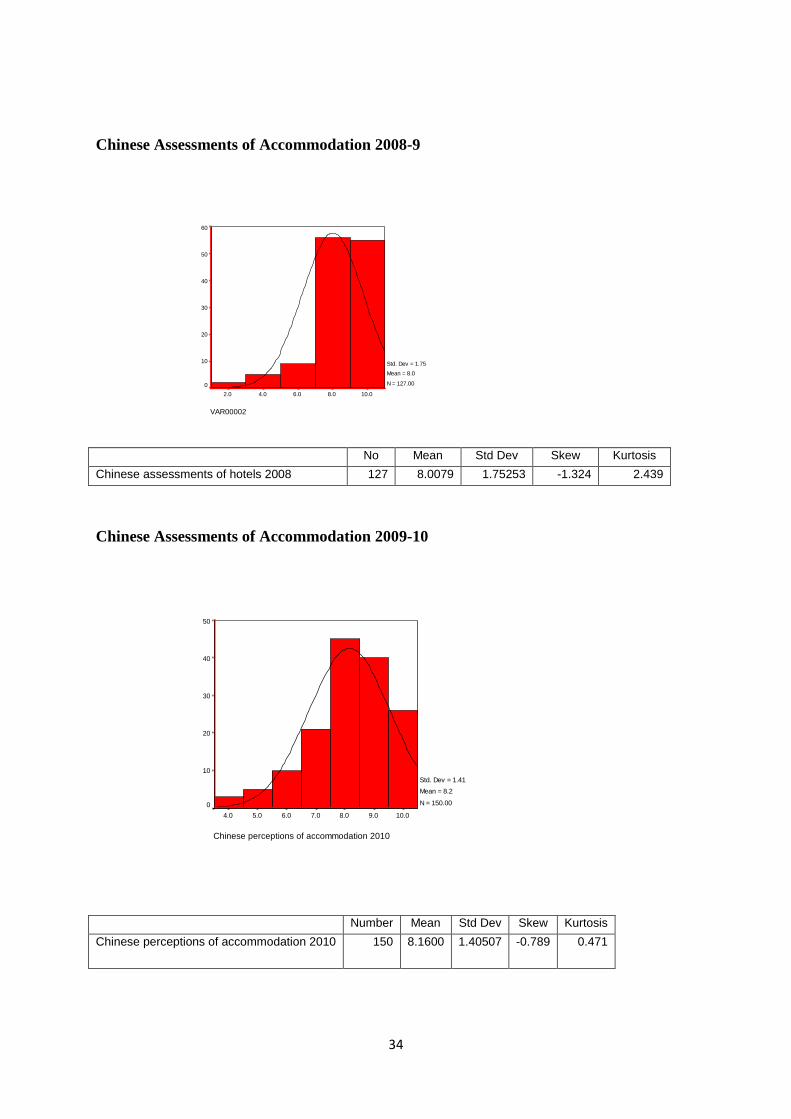
Chinese Assessments of Accommodation 2008-9
VAR00002
10.08.06.04.02.0
60
50
40
30
20
10
0
Std. Dev = 1.75
Mean = 8.0
N = 127.00
No Mean Std Dev Skew Kurtosis
Chinese assessments of hotels 2008 127 8.0079 1.75253 -1.324 2.439
Chinese Assessments of Accommodation 2009-10
Chinese perceptions of accommodation 2010
10.09.08.07.06.05.04.0
50
40
30
20
10
0
Std. Dev = 1.41
Mean = 8.2
N = 150.00
Number Mean Std Dev Skew Kurtosis
Chinese perceptions of accommodation 2010 150 8.1600 1.40507 -0.789 0.471
35
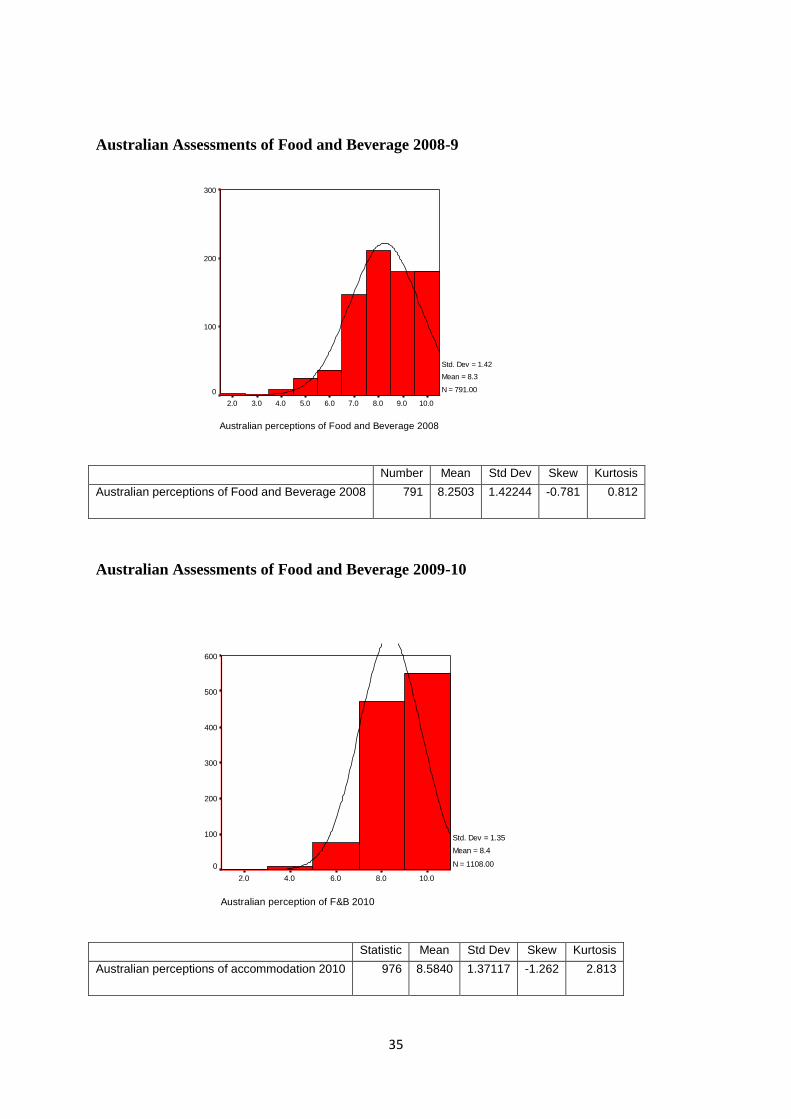
Australian Assessments of Food and Beverage 2008-9
Australian perceptions of Food and Beverage 2008
10.09.08.07.06.05.04.03.02.0
300
200
100
0
Std. Dev = 1.42
Mean = 8.3
N = 791.00
Number Mean Std Dev Skew Kurtosis
Australian perceptions of Food and Beverage 2008 791 8.2503 1.42244 -0.781 0.812
Australian Assessments of Food and Beverage 2009-10
Australian perception of F&B 2010
10.08.06.04.02.0
600
500
400
300
200
100
0
Std. Dev = 1.35
Mean = 8.4
N = 1108.00
Statistic Mean Std Dev Skew Kurtosis
Australian perceptions of accommodation 2010 976 8.5840 1.37117 -1.262 2.813
36
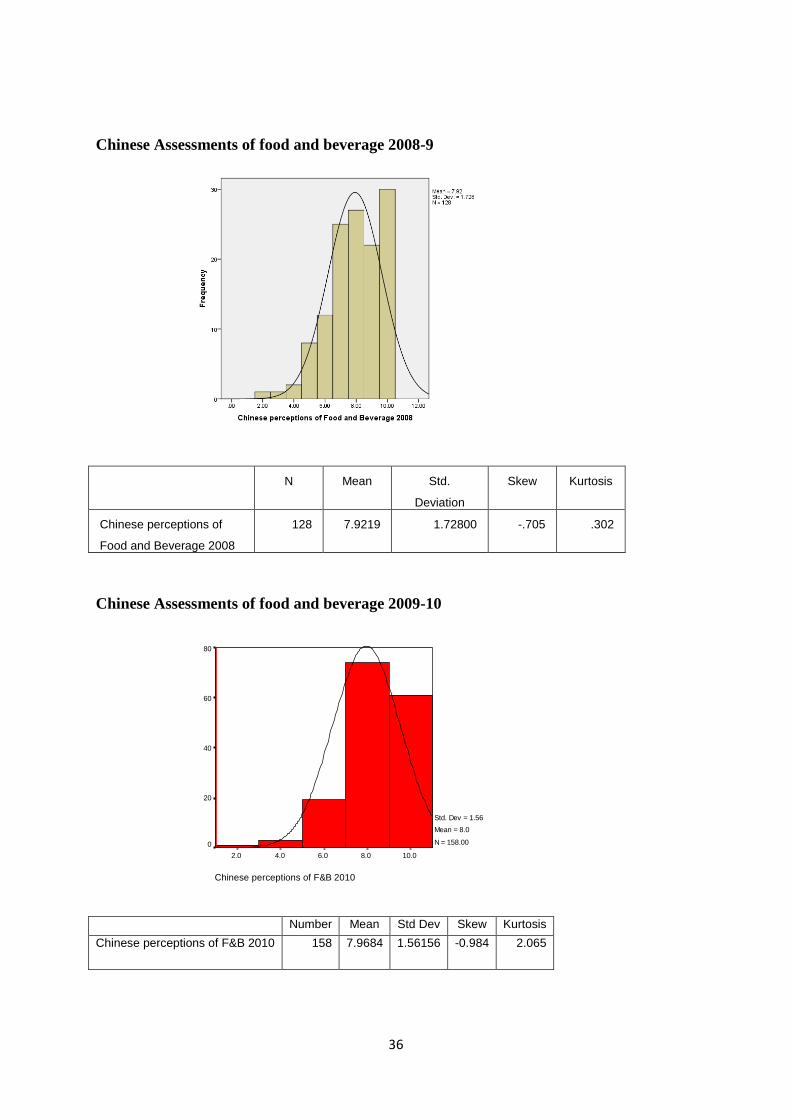
Chinese Assessments of food and beverage 2008-9
N Mean Std.
Deviation
Skew Kurtosis
Chinese perceptions of
Food and Beverage 2008
128 7.9219 1.72800 -.705 .302
Chinese Assessments of food and beverage 2009-10
Chinese perceptions of F&B 2010
10.08.06.04.02.0
80
60
40
20
0
Std. Dev = 1.56
Mean = 8.0
N = 158.00
Number Mean Std Dev Skew Kurtosis
Chinese perceptions of F&B 2010 158 7.9684 1.56156 -0.984 2.065