Embed Size (px)
Citation preview
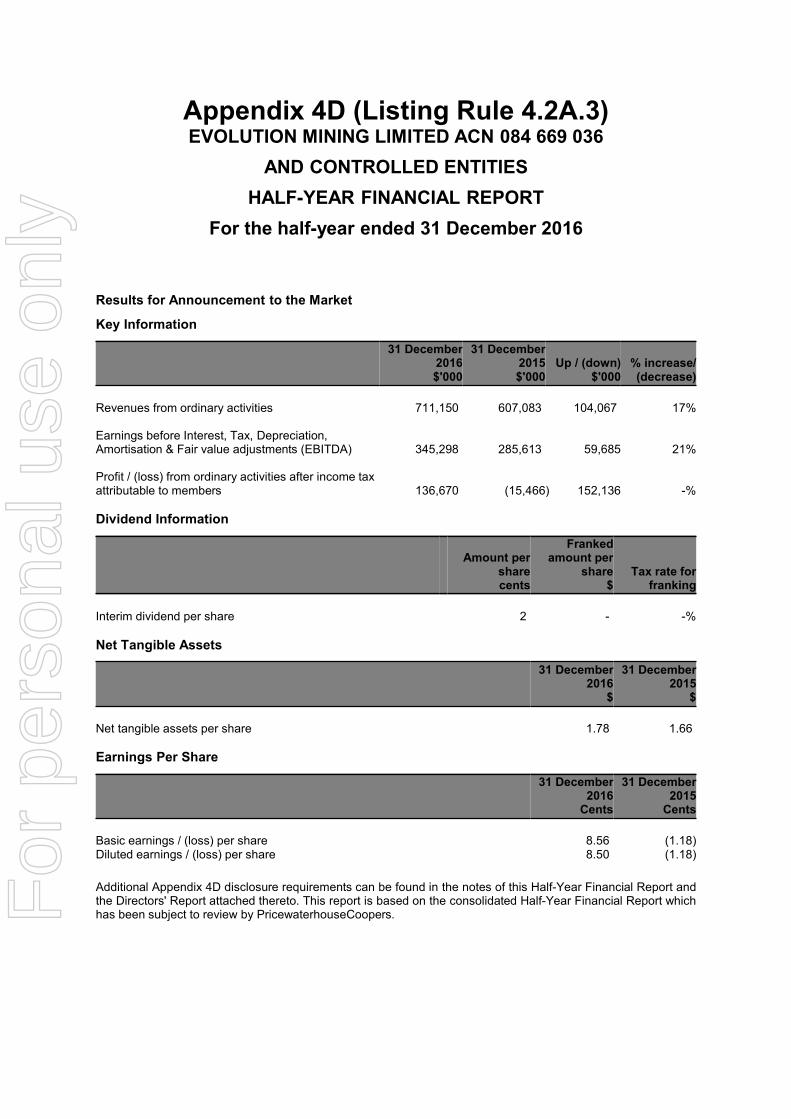
Appendix 4D (Listing Rule 4.2A.3)EVOLUTION MINING LIMITED ACN 084 669 036
AND CONTROLLED ENTITIES
HALF-YEAR FINANCIAL REPORT
For the half-year ended 31 December 2016
Results for Announcement to the Market
Key Information
31 December2016$'000
31 December2015$'000
Up / (down)$'000
% increase/(decrease)
Revenues from ordinary activities 711,150 607,083 104,067 17%SPACEEarnings before Interest, Tax, Depreciation,Amortisation & Fair value adjustments (EBITDA) 345,298 285,613 59,685 21%SPACEProfit / (loss) from ordinary activities after income taxattributable to members 136,670 (15,466) 152,136 -%
Dividend Information
Amount persharecents
Frankedamount per
share$
Tax rate forfranking
Interim dividend per share 2 - -%
Net Tangible Assets
31 December2016
$
31 December2015
$
Net tangible assets per share 1.78 1.66
Earnings Per Share
31 December2016Cents
31 December2015Cents
Basic earnings / (loss) per share 8.56 (1.18)Diluted earnings / (loss) per share 8.50 (1.18)
Additional Appendix 4D disclosure requirements can be found in the notes of this Half-Year Financial Report andthe Directors' Report attached thereto. This report is based on the consolidated Half-Year Financial Report whichhas been subject to review by PricewaterhouseCoopers.F
or p
erso
nal u
se o
nly

For
per
sona
l use
onl
y
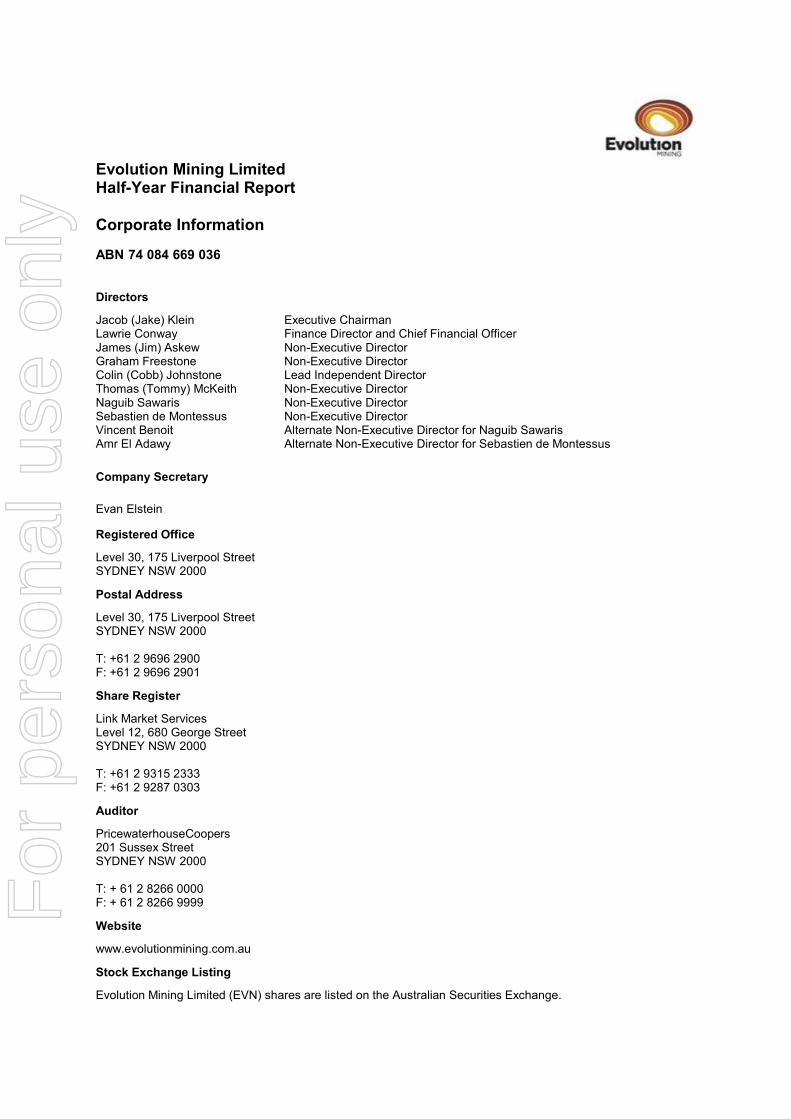
Evolution Mining LimitedHalf-Year Financial Report
Corporate Information
ABN 74 084 669 036
Directors
Jacob (Jake) Klein Executive ChairmanLawrie Conway Finance Director and Chief Financial OfficerJames (Jim) Askew Non-Executive DirectorGraham Freestone Non-Executive DirectorColin (Cobb) Johnstone Lead Independent DirectorThomas (Tommy) McKeith Non-Executive DirectorNaguib Sawaris Non-Executive DirectorSebastien de Montessus Non-Executive DirectorVincent Benoit Alternate Non-Executive Director for Naguib SawarisAmr El Adawy Alternate Non-Executive Director for Sebastien de Montessus
Company Secretary
Evan Elstein
Registered Office
Level 30, 175 Liverpool StreetSYDNEY NSW 2000
Postal Address
Level 30, 175 Liverpool StreetSYDNEY NSW 2000
T: +61 2 9696 2900F: +61 2 9696 2901
Share Register
Link Market ServicesLevel 12, 680 George StreetSYDNEY NSW 2000
T: +61 2 9315 2333F: +61 2 9287 0303
Auditor
PricewaterhouseCoopers201 Sussex StreetSYDNEY NSW 2000
T: + 61 2 8266 0000F: + 61 2 8266 9999
Website
www.evolutionmining.com.au
Stock Exchange Listing
Evolution Mining Limited (EVN) shares are listed on the Australian Securities Exchange.
For
per
sona
l use
onl
y
Evolution Mining LimitedHalf-Year Financial Report
Table of ContentsPage
Directors' Report 1Auditor's Independence Declaration 11Half-Year Financial Report
Consolidated Statement of Profit or Loss and Other Comprehensive Income 12Consolidated Balance Sheet 13Consolidated Statement of Changes in Equity 14Consolidated Statement of Cash Flows 15Notes to the Consolidated Financial Statements 16Directors' Declaration 34
Independent Auditor's Review Report to the Members 35
1
For
per
sona
l use
onl
y
Evolution Mining LimitedHalf-Year Financial ReportDirectors' Report31 December 2016
Directors' Report
The Directors present their report on the consolidated entity ("the Group") consisting of Evolution Mining Limited("the Company") and the entities it controlled at the end of, or during, the half-year ended 31 December 2016("the period").
Directors
Jacob (Jake) Klein Executive ChairmanLawrie Conway Finance Director and Chief Financial OfficerJames (Jim) Askew Non-Executive DirectorGraham Freestone Non-Executive DirectorColin (Cobb) Johnstone Lead Independent DirectorThomas (Tommy) McKeith Non-Executive DirectorNaguib Sawaris Non-Executive DirectorSebastien de Montessus Non-Executive DirectorVincent Benoit Alternate Non-Executive Director for Naguib SawarisAmr El Adawy Alternate Non-Executive Director for Sebastien de Montessus
Company Secretary
The name of the Company Secretary during the whole of the half-year ended 31 December 2016 and up to thedate of this report is as follows:
Evan Elstein
Principal activities
The Group's principal activities during the financial period were operating, identifying and developing gold relatedmining projects in both Australia and New Zealand.
There was no significant change in the nature of the activity of the Group during the period.
Dividends
In June 2016, the Directors approved a change to the dividend policy of whenever possible paying a half-yearlydividend equivalent to 4% of the Group's sales revenue. The change in policy doubled the payout ratio from theprevious level of 2% to 4% of revenue. The change was effective immediately and was applied to the finaldividend for 2016 and interim dividend for 2017.
The Board has confirmed that Evolution is in a sound position to continue its commitment to pay an interimunfranked dividend for the current period of 2 cents per share, totalling $33.595 million. This equates to 4.7% ofsales revenue for the half-year ended 31 December 2016 which is higher than the 4% policy level. This is due tothe fact the Company issued equity during the period as part of acquiring an economic interest in the ErnestHenry Copper-Gold Operation; however, this asset will not commence generating full revenue until the secondhalf of the year. For consistency, the Board has decided to maintain the dividend at 2 cents per share for theinterim period. Evolution shares will trade excluding entitlement to the dividend on 23 February 2017, with therecord date being 27 February 2017 and payment date of 27 March 2017.
In relation to Evolution’s dividend policy, the Board of Directors approved the implementation of a DividendReinvestment Plan (“DRP”). The DRP allows shareholders to elect to reinvest all or part of any dividends payableon their Evolution shares to acquire additional Evolution shares. The allotted shares in respect of the first FY17dividend will be issued at a 5.0% discount to the daily VWAP for the 5 days immediately after the record date.
1
For
per
sona
l use
onl
y
Evolution Mining LimitedHalf-Year Financial ReportDirectors' Report31 December 2016
Dividends (continued)
The Company paid a final unfranked dividend (relating to sales in the six month period to 30 June 2016) of$29.365 million in September 2016.
Dividends paid, pre DRP, to members during the financial period were as follows:
2016$'000
2015$'000
Final dividendFinal dividend for the year ended 30 June 2016 of 2 cents per shareunfranked (30 June 2015: 1 cent per share unfranked) per fully paid sharepaid on 23 September 2016 29,365 14,405
29,365 14,405
Review of operations
Overview
Evolution is a leading, growth-focused Australian gold company. As at 31 December 2016, the Group consistedof six wholly-owned operating gold mines: Cowal in New South Wales, Cracow, Mt Carlton and Mt Rawdon inQueensland and Mungari and Edna May in Western Australia and an economic interest in the Ernest HenryCopper-Gold Operation (100% of gold and 30% of copper and silver) in Queensland.
The Group posted a half-year ended 31 December 2016 record underlying net profit after tax of $136.252 million,an increase of 26% (31 December 2015: underlying net profit after tax of $107.850 million), driven by record halfproduction, strong gold price and a continued focus on cost control.
The period also saw two months contribution from the acquisition of the economic interest in the Ernest HenryCopper-Gold Operation which is expected to improve the quality and longevity of Evolution's portfolio as well asmaterially reduce the Group's cost profile. In September 2016, the Group disposed of the Pajingo asset to MinjarGold Pty Limited as part of its strategy to maintain a quality asset portfolio of 6 to 8 producing mines.
The statutory net profit after tax for the period was $136.670 million (31 December 2015: net loss after tax of$15.466 million) and includes one-off transaction and non-operating costs which have been excluded from theGroup's underlying profit after tax. These costs include acquisition and integration costs of $6.107 million incurredon the Ernest Henry and Pajingo transactions, tax effected fair value accounting adjustments of $21,977 millionincurred on the prior year Cowal and Mungari transactions, a loss of $2.378 million on the sale of Pajingo and anon-cash deferred tax benefit of $30.880 million which is related to the recognition of previously unrecognised taxlosses.
All operations produced positive operating mine cash flows totalling $339.426 million (31 December 2015:$289.322 million) representing a 17% improvement. Total capital expenditure increased 46% which was in linewith plan at $125.780 million (including all sustaining and major capital expenditure and capital stripping) and hada large impact on the resulting 5% increase in net mine cash flow.
As a result of the significant net cash flows in excess of capital requirements during the period, the Group hasbeen able to accelerate repayments on the Senior Secured Syndicated Revolving and Term Facility. The Groupmade mandatory and voluntary repayments of $160 million during the period with commitments met up toOctober 2017.
2
For
per
sona
l use
onl
y
Evolution Mining LimitedHalf-Year Financial ReportDirectors' Report31 December 2016
Review of operations (continued)
Overview (continued)
The consolidated operating and financial results for the current and prior period are summarised below. All $figures refer to Australian thousand dollars (A$'000) unless otherwise stated.
Key Business Metrics31 December
201631 December
2015 % Change
Total underground ore mined (kt) 1,700 707 140%Total underground lateral development (m) 5,017 5,803 (14)%Total open pit ore mined (kt) 9,957 7,154 39%Total open pit waste mined (kt) 16,622 18,539 (10)%Processed tonnes (kt) 9,335 7,723 21%Gold grade processed (g/t) 1.63 1.75 (7)%Gold production (oz) 423,120 377,869 12%Unit cash operating cost (A$/oz) (i) 667 700 5%All in sustaining cost (A$/oz) (i) 978 954 (3)%All in cost ($/oz) (i) 1,120 1,095 (2)%Gold price achieved (A$/oz) 1,656 1,547 7%Silver price achieved (A$/oz) 24.32 20.35 20%Copper price achieved (A$/t) 7,456 6,728 11%Total Revenue 711,150 607,083 17%Cost of sales (excluding D&A and fair value adjustments (i)) (348,661) (308,642) (13)%Corporate, admin, exploration and other costs (excluding D&A) (17,191) (12,828) (34)%EBIT (i) (ii) 173,471 127,678 36%EBITDA (i) (ii) 345,298 285,613 21%Statutory profit/(loss) after income tax 136,670 (15,466) (984)%Underlying profit after income tax 136,252 107,850 26%Mine operating cash flow 339,426 289,322 17%Capital expenditure (125,780) (86,442) (46)%Net mine cash flow 213,646 202,880 5%
(i) EBITDA, EBIT, Unit cash operating cost, All in sustaining cost (AISC), and All in cost (AIC) are non-IFRS financial
information and are not subject to audit.
(ii) All in sustaining cost (AISC) and All in cost (AIC) are calculated on a per ounce sold basis.
Mining Operations
Cowal
Cowal achieved record gold production under Evolution ownership in the December quarter with 71,903oz of goldproduced and record total gold production for the half year ended 31 December 2016 of 135,935oz. The unitcash operating cost for the period stood at $598/oz, with an AISC and AIC of $862/oz and $865/oz respectively(31 December 2015: $583/oz, $693/oz, and $700/oz).
Mining continued in the Stage G cutback with 6,317kt of material moved, comprised of 5,217kt of ore mined at anaverage grade of 1.24g/t and 1,100kt of operating waste (31 December 2015: 3,966kt, 1.06g/t, 1,972kt). Higherore mined tonnes were driven by an increase in ex pit volumes, positive ore reconciliations and a focus on miningin high grade areas.
3
For
per
sona
l use
onl
y
Evolution Mining LimitedHalf-Year Financial ReportDirectors' Report31 December 2016
Review of operations (continued)
Mining Operations (continued)
Cowal (continued)
Resource definition drilling was completed during the period as part of the Stage H cutback feasibility study. Thiswas completed ahead of time, under budget and delivered strong results.
Total ore processed for the period was 3,599kt at an average grade of 1.40g/t with gold recovery of 83.6% (31December 2015: 3,060kt, 1.23g/t, 83.5%)
Cowal generated a record $97.082 million in net mine cash flows during the period, further solidifying the qualityof this asset.
Mungari
Mungari finished the period as the Group's second highest producer with 79,940oz at a unit cash operating costof $835/oz, AISC of $1,047/oz and AIC of $1,285/oz (31 December 2015: 59,782oz, $737/oz, $963/oz,$1,036/oz). Despite the increase in production, costs were higher as a result of reduced average mined andprocessed grades.
Underground ore mined at Frog's Leg for the period totalled 363kt at an average grade mined of 5.12g/t (31December 2015: 277kt, 5.38g/t). Mining targeted the Fog, Dwarf, Mist and Rocket orebodies, with some higherthan expected grade stopes in the Mist orebody. A drill platform for the Mist orebody will be developed in the sixmonths to June 2017 to test the resource at further depth.
Open pit ore mined from White Foil for the period was 537kt at an average grade mined of 1.18g/t with totalmaterial moved of 5,471kt (31 December 2015: 509kt, 1.36g/t, 3,755kt). Production completed in the Stage 2aarea of the pit and focus moved to the Stage 2b cutback and Stage 3 areas. Water in Stage 2b significantlyreduced drill and blast activities. However drilling capacity is being sourced to address the ground and waterconditions in the second half of the year.
Mt Carlton
As the Group's only wholly owned concentrate producing mine, Mt Carlton produced 51,218oz of payable gold forthe period at a low unit cash operating cost of $300/oz, AISC of $682/oz and AIC of $834/oz (December 2015:54,239oz, $408/oz, $658/oz, $816/oz).
Mining of the Stage 2 pit area was completed during the period leading to accelerated mining of the Stage 3a pitarea which would allow access to high-grade ore in the second half of the year. Blasting of the Stage 3b pre-stripsediments commenced in December.
Construction of concrete civils for the gravity recovery of gold circuit commenced in December and is expected tobe commissioned in the March quarter.
Mt Rawdon
Mt Rawdon produced 50,862oz of gold for the period at a unit cash operating cost of $594/oz, AISC of $833/ozand AIC of $1058/oz (31 December 2015: 48,275oz, $656/oz, $942/oz, $1386/oz). These lower costs are arealisation of a declining strip ratio as the cutback nears completion and increased processing grades of 1.05 g/t(31 December 2015: 0.96 g/t).
4
For
per
sona
l use
onl
y
Evolution Mining LimitedHalf-Year Financial ReportDirectors' Report31 December 2016
Review of operations (continued)
Mining Operations (continued)
Mt Rawdon (continued)
Mining activity has been focused on the completion of Stage 3 and the progression of the Stage 4 cutback withtotal material moved of 8,741kt comprising 2,521kt of ore mined and 6,220kt of capital and operation waste. Theore extracted from Stage 4 provided the majority of the mill feed and continues to reconcile positively against theresource model.
Edna May
Edna May produced 38,600oz of gold for the period at a unit cash operating cost of $1,338/oz, AISC of $1,475/ozand AIC of $1,811/oz (31 December 2014: 36,035oz, $1,298/oz, $1,411/oz, $1,551/oz). Costs remained highfollowing a decrease in production and an increase in capital expenditure for the underground. The lower materialmovement in the prior year due to weather events and mine scheduling issues are continuing to impactperformance during the period.
Following the performance issues encountered in the prior year and the beginning of the current year a full reviewof Edna May was undertaken. As a result of this review, plans have been implemented to target higher volumeopen pit mining, increasing material movements to 1Mt per month for the remainder of the current year. This willbenefit the production and cost performance in the latter stages of the second half of the year.
Mining activity during the period continued to focus on the Stage 2 cutback. With total material moved of 3,496ktcomprising ore mined of 824kt and capital and operating waste of 2,672kt (31 December 2015: 1,087kt, 4,194kt).An increase in ore grade is anticipated in the second half of the year as mining nears the base of the Stage 2cutback.
Cracow
Cracow continued its track record of production reliability in the period with 41,317oz produced at a unit cashoperating cost of $820/oz, AISC of $1,267/oz and AIC of $1,365/oz (31 December 2015: 46,010oz, $710/oz,$1,026/oz, $1,122/oz). Planned capital expenditure including a tailings storage facility lift, increased resourcedefinition drilling and the Fine Grind Mill project impacted AISC and AIC.
The period saw ore mined of 263kt of ore mined at an average grade of 5.05g/t (31 December 2015: 227kt,6.34g/t). This was primarily sourced from the Kilkenny, Empire and Klondyke orebodies. Grades are expected toimprove in the second half of the year with the increased production from Kilkenny and Empire orebodies.
Total lateral development of 1,518m (31 December 2015: 2,626m) focused on the Coronation and Griffindeposits while a drill platform for testing the Baz and Killarney deposits was completed.
Pajingo
Pajingo was sold on 1 September 2016 to Minjar Gold Pty Limited for total proceeds of up to $52 millionconsisting of a $42.0 million upfront cash payment and a 1% NSR (net smelter return) royalty of up to $10.0million for gold production above 130,000oz.
During the 62 days of the period Pajingo was still under Evolution ownership, Pajingo produced 10,991oz of goldat a unit cash operating cost of $897/oz, AISC of $1,422/oz and AIC of $1,577/oz (31 December 2015: 32,317oz,$869/oz, $1,221/oz, $1,364/oz).
5
For
per
sona
l use
onl
y
Evolution Mining LimitedHalf-Year Financial ReportDirectors' Report31 December 2016
Review of operations (continued)
Mining Operations (continued)
Ernest Henry
The Ernest Henry transaction was completed on 1 November 2016 and is expected to improve the quality andlongevity of the Group's portfolio as well as materially reduce the cost profile.
Attributable production for the period commencing 1 November 2016 was14,257oz of gold and 3,125t of copperat a unit cash operating cost of $(481)/oz, AISC of $(114)/oz and AIC of $(114)/oz. Gold production does notcontribute towards the Group's gold sold for the period and is instead classified as inventory until sold which willbegin in the second half of the year. The Group anticipates contributions from Ernest Henry of annualised goldequivalent production of 80,000 - 85,000oz at an AISC of $100 - $150/oz which includes copper and silverby-product credits.
Financial Performance
Profit or Loss
Revenue for the period ended 31 December 2016 increased by 17% to $711.150 million (31 December 2015:$607.083 million). This is largely a product of the increase in gold sold of 5% to 404,640oz (31 December 2015:385,120oz) and the increase in achieved gold price to $1,656/oz (31 December 2015: $1,547/oz) whichcontributed $74.431 million in gold sales. Copper sales also increased as a result of the two months salescontributed by Ernest Henry which totalled $24.085 million.
Deliveries into the hedge book were 127,501oz at an average price of $1,578/oz (31 December 2015: 105,474oz,$1,590/oz). The remaining 277,139oz were sold at spot price achieving an average price of $1,656/oz (31December 2015: 279,646oz, $1,526/oz). The Group's hedge book totals 579,487oz as at 31 December 2016 atan average price of $1,633/oz for deliveries to December 2020.
Operating costs, excluding depreciation, amortisation and fair value adjustments of $203.223 million, increased to$348.273 million (31 December 2015: $308.084 million) largely as a result of the inclusion of two months ofErnest Henry and the shift from capital to operating stripping at both Edna May and Mt Rawdon.
The Group's All in Sustaining Cost increased 2% to $978/oz (31 December 2015: $954/oz) despite the increasein gold sold of 5% during the period offset by the increase in sustaining capital of 70% to $194/oz (31 December2015: $114/oz).
Total exploration expenditure for the period was $17.968 million (31 December 2015: $11.113 million) with anexploration write-off of $3.715 million (31 December 2015: $0.807 million).
Balance Sheet
The Group’s net assets increased by 34% to $2.070 billion (30 June 2016: $1.551 billion), primarily due to thecompletion of the Ernest Henry transaction which contributed net assets of $886.925 million offset by theresulting draw down of $475 million on the Senior Secured Syndicated Revolving and Term Facility. At 31December 2016, the Group held a cash balance of $14.479 million and total debt of $603.013 million. Total debtcomprises $587.598 million of corporate debt (inclusive of $12.402 million of capitalised borrowing costs), $5.086million of finance leases and $10.329 million of other short-term debt.
6
For
per
sona
l use
onl
y
Evolution Mining LimitedHalf-Year Financial ReportDirectors' Report31 December 2016
Review of operations (continued)
Financial Performance (continued)
Balance Sheet (continued)
Total assets increased during the period to $3.014 billion (30 June 2016: $2.187 billion), representing a 38%movement. This increase was largely due to the completion of the Ernest Henry transaction which contributed$909.380 million offset by the sale of Pajingo which reduced total assets by $77.621 million. Excluding the ErnestHenry and Pajingo transactions, total assets held steady which can be attributed to the decrease in property,plant and equipment of 7% offset by the 7% increase in ore inventories. Capital additions for property, plant andequipment totalled $37.700 million, while depreciation totalled $68.976 million. Mine development and explorationadditions totalled $105.475 million mainly as a result of continued stripping at several sites, while amortisationtotalled $110.625 million.
Total liabilities for the Group increased to $943.646 million as at 31 December 2016 from $635.726 as at 30 June2016. This increase is largely due to the draw down on a new $475 million Term Facility which was used to fundthe Ernest Henry transaction. The balance of the Facility as at 31 December 2016 was $445 million.
Cash Flow
The Group ended the period with a cash balance of $14.479 million and available credit of $225 million throughits Senior Secured Syndicated Revolving and Term Facility.
Net cash inflow from operating activities was $296.713 million, an increase of $83.638 million (31 December2015: $213.075 million).
Net cash outflows from investment activities were $989.022 million, a $157.700 million increase (31 December2015: $831.322 million) consisting of payments for the acquisition of the economic interest in Ernest HenryCopper-Gold Operation of $884.004 million (including capitalised transaction fees) and receipt of $41.900 millionon the sale of Pajingo. Capital investments excluding the payment for Ernest Henry for the period includeproperty plant and equipment of $35.610 million and mine development and exploration of $105.198 million.
Net cash inflows from financing activities were $689.453 million, an increase of $231.875 million (31 December2015: outflow $457.578 million). Financing for the period included the drawing of $475 million on the SeniorSecured Syndicated Revolving and Term Facility and the subsequent repayments totalling $160 million, netproceeds received on the issue of shares to fund the Ernest Henry transaction of $395.244 million, dividendpayment of $25.323 million and a net drawing of $1.857million for Mt Carlton shipment refinancing and insurancepremiums.
Taxation
During the period, the Group made the determination to recognise previously unrecognised tax losses on thebalance sheet. The Company recognised a tax benefit of $15.653 million (31 December 2015: $nil) in the currentperiod consisting of a current tax liability of $7.605 million, deferred tax liability of $7.622 million and deferred taxasset on previously unrecognised tax losses of $30.880 million.
7
For
per
sona
l use
onl
y
Evolution Mining LimitedHalf-Year Financial ReportDirectors' Report31 December 2016
Review of operations (continued)
Financial Performance (continued)
Capital Expenditure
Capital expenditure for the period totalled $125.780 million (31 December 2015: $86.442 million) with the mainchange being the inclusion of Cowal and Mungari in the Group for a full half-year to 31 December 2016compared to the prior half-year to 31 December 2015. This consists of sustaining capital, including near mineexploration and resource definition of $70.900 million (31 December 2015: $32.051 million) and minedevelopment of $54.880 million (31 December 2015: $54.390 million). The main capital projects include theCowal resource definition drilling, Edna May underground mine project, capital waste stripping and developmentat Mt Rawdon, the Edna May North and South cutbacks, Mungari capital stripping and undergrounddevelopment, Cracow underground mine development, and the Mt Carlton mine development and Stage 2 NorthWaste block.
Financing
Total finance costs for the period were $13.861 million (31 December 2015: $20.860 million), a decrease of 34%which is largely attributable to the reduction in interest expense as a result of lower interest rates. Included in totalfinance costs is amortisation of debt establishment costs of $2.131 million (31 December 2015: $4.847 million)and discount unwinding on mine rehabilitation liabilities of $1.511 million (31 December 2015: 2.076 million).
In September 2016, the Group entered into a new financing arrangement ("the New Facility") comprising a $475million Senior Secured Term Loan (“Facility D”) and an amendment to the repayment profile of the existing $300million Senior Secured Revolving Loan ("Facility A") to reflect the Group's accelerated repayments on theprevious Facility. No changes have been made to the existing $400 million Senior Secured Term Loan ("FacilityB") or the $155 million Performance Bond Facility ("Facility C").
The new Facility was executed on 29 September 2016 and was effective from that date.
The new Facility was drawn down on 31 October 2016 on completion of the Ernest Henry acquisition. Therepayment periods and the outstanding balances as at 31 December 2016 on each facility are set out below:
Facility Term date Outstandingbalance
Senior Secured Revolving Loan - Facility A 31 July 2018 $75 millionSenior Secured Term Loan - Facility B 15 July 2018 $80 millionPerformance Bond Facility - Facility C 20 July 2018 $124 millionSenior Secured Term Loan - Facility D 31 October 2021 $445 million
8
For
per
sona
l use
onl
y
Evolution Mining LimitedHalf-Year Financial ReportDirectors' Report31 December 2016
Matters subsequent to the end of the financial year
No matter or circumstance has occurred subsequent to the period end that has significantly affected, or maysignificantly affect, the operations of the Group, the results of those operations or state of affairs of the Group oreconomic entity in subsequent financial periods except for the following matters:
(a) On 20 January 2017, Evolution obtained an Australian Taxation Office (ATO) Private Ruling ruling whichallows the Group to amortise the $880 million upfront payment along with the monthly production costsas parcels of metal are delivered each month. A similar methodology has been adopted for tax andaccounting purposes.
(b) On 9 February, Evolution was granted regulatory approval from the NSW Department of Planning andEnvironment to extend the Cowal operations mine life to 2032.
(c) On 15 February, the Board approved the commencement of the E42 Stage H cutback and Dual LeachProject at the Cowal operation.
9
For
per
sona
l use
onl
y
Evolution Mining LimitedHalf-Year Financial ReportDirectors' Report31 December 2016
Auditor's independence declaration
A copy of the auditor's independence declaration as required under section 307C of the Corporations Act 2001 isset out on page 11.
Rounding of amounts
The Company is of a kind referred to in Class Order 98/100, issued by the Australian Securities and InvestmentsCommission, relating to the 'rounding off' of amounts in the Directors' Report. Amounts in the Directors' Reporthave been rounded off in accordance with that Class Order to the nearest thousand dollars, or in certain cases,to the nearest dollar.
This report is made in accordance with a resolution of Directors.
Jacob (Jake) KleinExecutive Chairman
Graham FreestoneChairman of the Audit Committee
Sydney
10
For
per
sona
l use
onl
y
For
per
sona
l use
onl
y
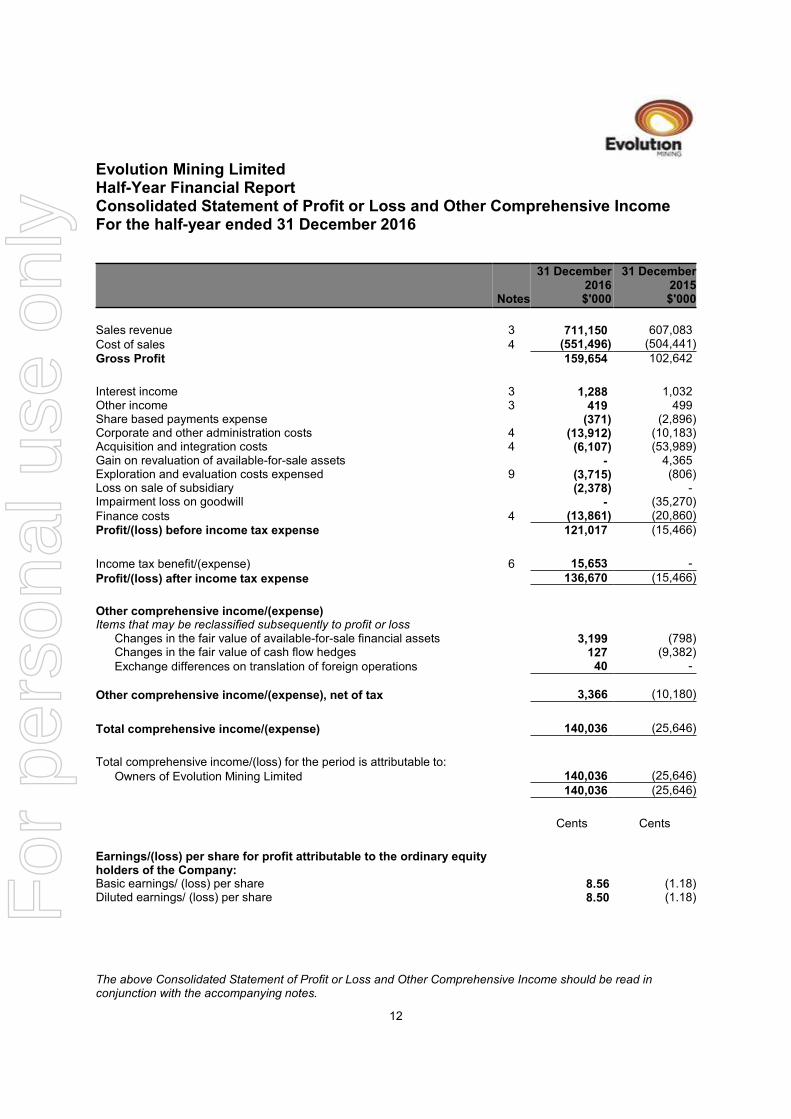
Evolution Mining LimitedHalf-Year Financial ReportConsolidated Statement of Profit or Loss and Other Comprehensive IncomeFor the half-year ended 31 December 2016
Notes
31 December2016$'000
31 December2015$'000
Sales revenue 3 711,150 607,083Cost of sales 4 (551,496) (504,441)
Gross Profit 159,654 102,642
Interest income 3 1,288 1,032Other income 3 419 499Share based payments expense (371) (2,896)Corporate and other administration costs 4 (13,912) (10,183)Acquisition and integration costs 4 (6,107) (53,989)Gain on revaluation of available-for-sale assets - 4,365Exploration and evaluation costs expensed 9 (3,715) (806)Loss on sale of subsidiary (2,378) -Impairment loss on goodwill - (35,270)Finance costs 4 (13,861) (20,860)Profit/(loss) before income tax expense 121,017 (15,466)
Income tax benefit/(expense) 6 15,653 -
Profit/(loss) after income tax expense 136,670 (15,466)
Other comprehensive income/(expense)Items that may be reclassified subsequently to profit or loss
Changes in the fair value of available-for-sale financial assets 3,199 (798)Changes in the fair value of cash flow hedges 127 (9,382)Exchange differences on translation of foreign operations 40 -
BlankOther comprehensive income/(expense), net of tax 3,366 (10,180)
Total comprehensive income/(expense) 140,036 (25,646)
Total comprehensive income/(loss) for the period is attributable to:Owners of Evolution Mining Limited 140,036 (25,646)
140,036 (25,646)
Cents Cents
Earnings/(loss) per share for profit attributable to the ordinary equityholders of the Company:Basic earnings/ (loss) per share 8.56 (1.18)Diluted earnings/ (loss) per share 8.50 (1.18)
The above Consolidated Statement of Profit or Loss and Other Comprehensive Income should be read inconjunction with the accompanying notes.
12
For
per
sona
l use
onl
y
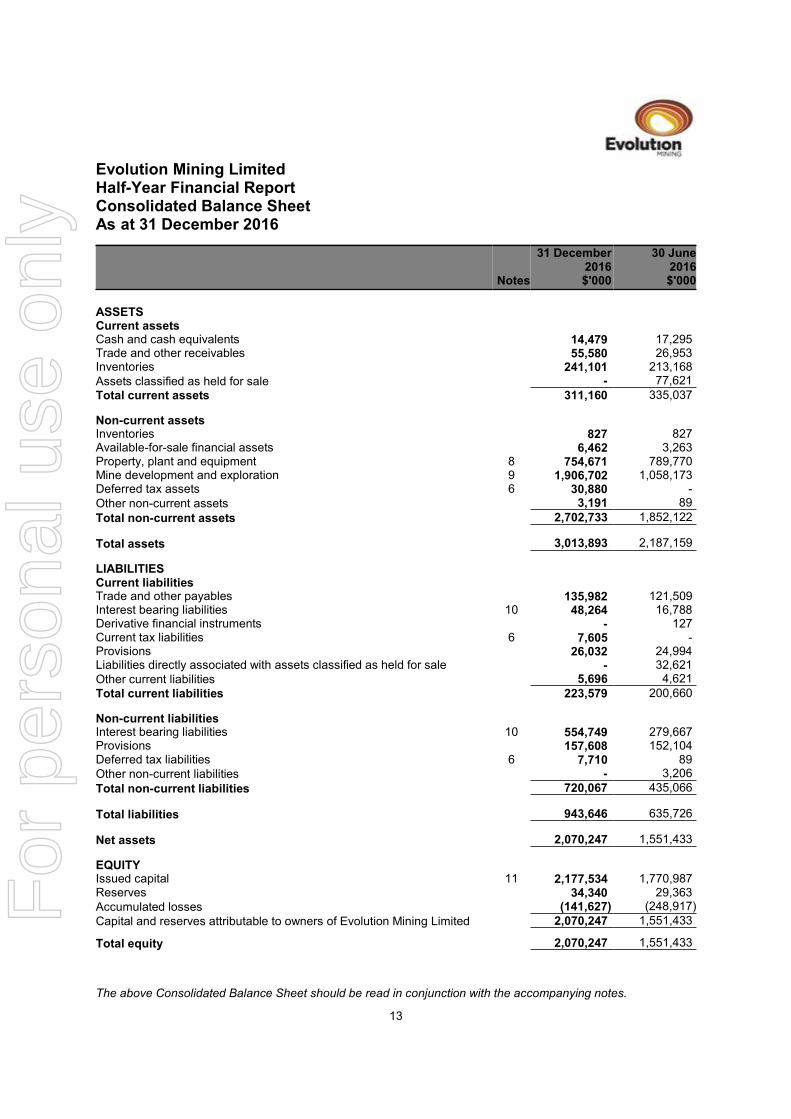
Evolution Mining LimitedHalf-Year Financial ReportConsolidated Balance SheetAs at 31 December 2016
Notes
31 December2016$'000
30 June2016$'000
ASSETSCurrent assetsCash and cash equivalents 14,479 17,295Trade and other receivables 55,580 26,953Inventories 241,101 213,168Assets classified as held for sale - 77,621
Total current assets 311,160 335,037
Non-current assetsInventories 827 827Available-for-sale financial assets 6,462 3,263Property, plant and equipment 8 754,671 789,770Mine development and exploration 9 1,906,702 1,058,173Deferred tax assets 6 30,880 -Other non-current assets 3,191 89
Total non-current assets 2,702,733 1,852,122
Total assets 3,013,893 2,187,159
LIABILITIESCurrent liabilitiesTrade and other payables 135,982 121,509Interest bearing liabilities 10 48,264 16,788Derivative financial instruments - 127Current tax liabilities 6 7,605 -Provisions 26,032 24,994Liabilities directly associated with assets classified as held for sale - 32,621Other current liabilities 5,696 4,621
Total current liabilities 223,579 200,660
Non-current liabilitiesInterest bearing liabilities 10 554,749 279,667Provisions 157,608 152,104Deferred tax liabilities 6 7,710 89Other non-current liabilities - 3,206
Total non-current liabilities 720,067 435,066
Total liabilities 943,646 635,726
Net assets 2,070,247 1,551,433
EQUITYIssued capital 11 2,177,534 1,770,987Reserves 34,340 29,363Accumulated losses (141,627) (248,917)
Capital and reserves attributable to owners of Evolution Mining Limited 2,070,247 1,551,433
Total equity 2,070,247 1,551,433
The above Consolidated Balance Sheet should be read in conjunction with the accompanying notes.
13
For
per
sona
l use
onl
y
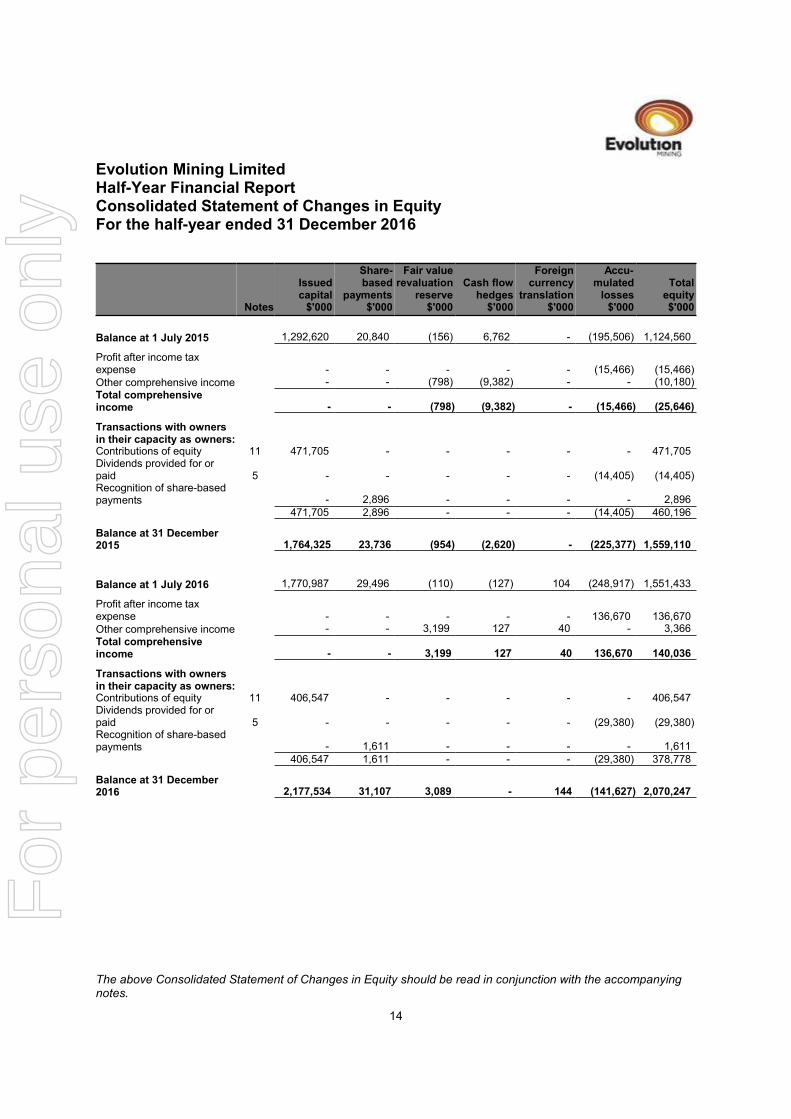
Evolution Mining LimitedHalf-Year Financial ReportConsolidated Statement of Changes in EquityFor the half-year ended 31 December 2016
Notes
Issuedcapital$'000
Share-based
payments$'000
Fair valuerevaluation
reserve$'000
Cash flowhedges$'000
Foreigncurrency
translation$'000
Accu-mulatedlosses$'000
Totalequity$'000
Balance at 1 July 2015 1,292,620 20,840 (156) 6,762 - (195,506) 1,124,560
Profit after income taxexpense - - - - - (15,466) (15,466)Other comprehensive income - - (798) (9,382) - - (10,180)Total comprehensiveincome - - (798) (9,382) - (15,466) (25,646)
Transactions with ownersin their capacity as owners:Contributions of equity 11 471,705 - - - - - 471,705Dividends provided for orpaid 5 - - - - - (14,405) (14,405)Recognition of share-basedpayments - 2,896 - - - - 2,896
471,705 2,896 - - - (14,405) 460,196
Balance at 31 December2015 1,764,325 23,736 (954) (2,620) - (225,377) 1,559,110
Balance at 1 July 2016 1,770,987 29,496 (110) (127) 104 (248,917) 1,551,433
Profit after income taxexpense - - - - - 136,670 136,670Other comprehensive income - - 3,199 127 40 - 3,366Total comprehensiveincome - - 3,199 127 40 136,670 140,036
Transactions with ownersin their capacity as owners:Contributions of equity 11 406,547 - - - - - 406,547Dividends provided for orpaid 5 - - - - - (29,380) (29,380)Recognition of share-basedpayments - 1,611 - - - - 1,611
406,547 1,611 - - - (29,380) 378,778
Balance at 31 December2016 2,177,534 31,107 3,089 - 144 (141,627) 2,070,247
The above Consolidated Statement of Changes in Equity should be read in conjunction with the accompanyingnotes.
14
For
per
sona
l use
onl
y
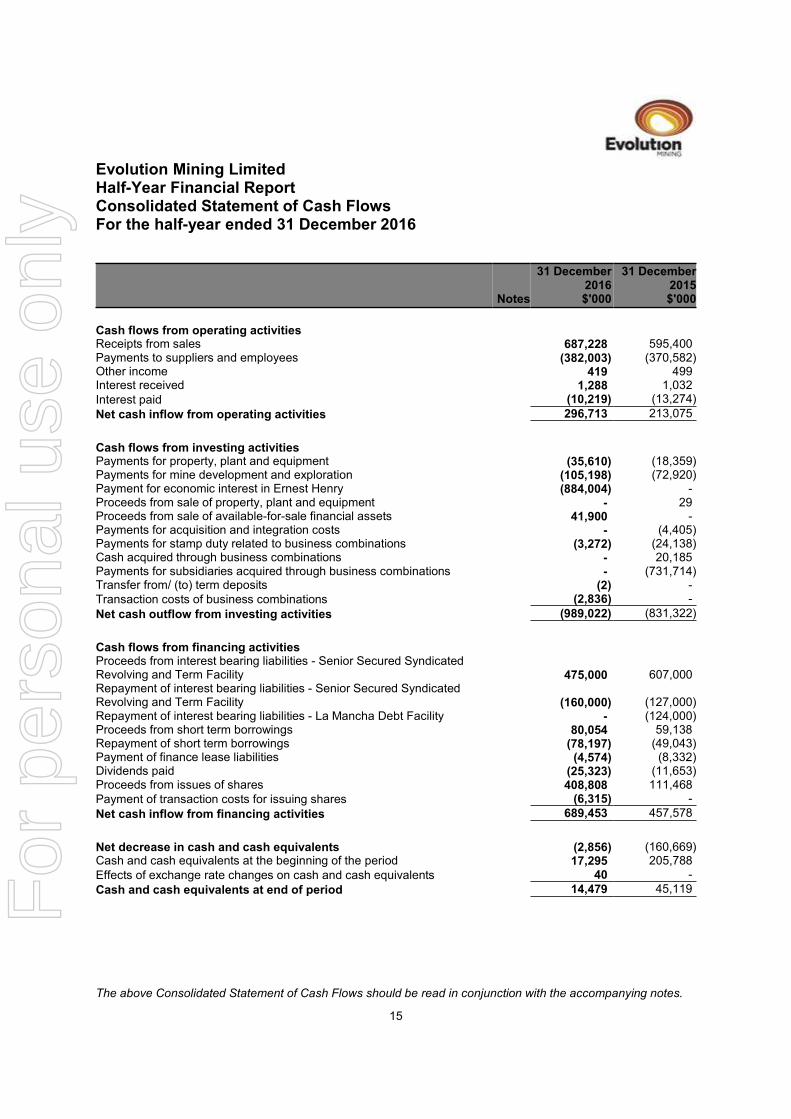
Evolution Mining LimitedHalf-Year Financial ReportConsolidated Statement of Cash FlowsFor the half-year ended 31 December 2016
Notes
31 December2016$'000
31 December2015$'000
Cash flows from operating activitiesReceipts from sales 687,228 595,400Payments to suppliers and employees (382,003) (370,582)Other income 419 499Interest received 1,288 1,032Interest paid (10,219) (13,274)
Net cash inflow from operating activities 296,713 213,075
Cash flows from investing activitiesPayments for property, plant and equipment (35,610) (18,359)Payments for mine development and exploration (105,198) (72,920)Payment for economic interest in Ernest Henry (884,004) -Proceeds from sale of property, plant and equipment - 29Proceeds from sale of available-for-sale financial assets 41,900 -Payments for acquisition and integration costs - (4,405)Payments for stamp duty related to business combinations (3,272) (24,138)Cash acquired through business combinations - 20,185Payments for subsidiaries acquired through business combinations - (731,714)Transfer from/ (to) term deposits (2) -Transaction costs of business combinations (2,836) -
Net cash outflow from investing activities (989,022) (831,322)
Cash flows from financing activitiesProceeds from interest bearing liabilities - Senior Secured SyndicatedRevolving and Term Facility 475,000 607,000Repayment of interest bearing liabilities - Senior Secured SyndicatedRevolving and Term Facility (160,000) (127,000)Repayment of interest bearing liabilities - La Mancha Debt Facility - (124,000)Proceeds from short term borrowings 80,054 59,138Repayment of short term borrowings (78,197) (49,043)Payment of finance lease liabilities (4,574) (8,332)Dividends paid (25,323) (11,653)Proceeds from issues of shares 408,808 111,468Payment of transaction costs for issuing shares (6,315) -
Net cash inflow from financing activities 689,453 457,578
Net decrease in cash and cash equivalents (2,856) (160,669)Cash and cash equivalents at the beginning of the period 17,295 205,788Effects of exchange rate changes on cash and cash equivalents 40 -
Cash and cash equivalents at end of period 14,479 45,119
The above Consolidated Statement of Cash Flows should be read in conjunction with the accompanying notes.
15
For
per
sona
l use
onl
y
Evolution Mining LimitedHalf-Year Financial ReportNotes to the Consolidated Financial Statements
1 Significant changes in the current reporting period
The financial position and performance of the group was particularly affected by the following events andtransactions during the reporting period:
• The institutional and retail share offer to fund the acquisition of an economic interest in the Ernest HenryCopper-Gold Operation.
• The entry into a new financing agreement to secure funding for the consideration of the Ernest Henrytransaction and to realign the repayment schedule to reflect the Group's accelerated repayments onprevious Facilities.
• The completion of the acquisition of an economic interest in the Ernest Henry Copper-Gold Operation.
• The sale of the Pajingo operation to Minjar Gold Pty Limited.
For a detailed discussion about the group’s performance and financial position please refer to our review ofoperations on pages 2 to 8.
16
For
per
sona
l use
onl
y
Evolution Mining LimitedHalf-Year Financial ReportNotes to the Consolidated Financial Statements
2 Segment information
(a) Description of segments
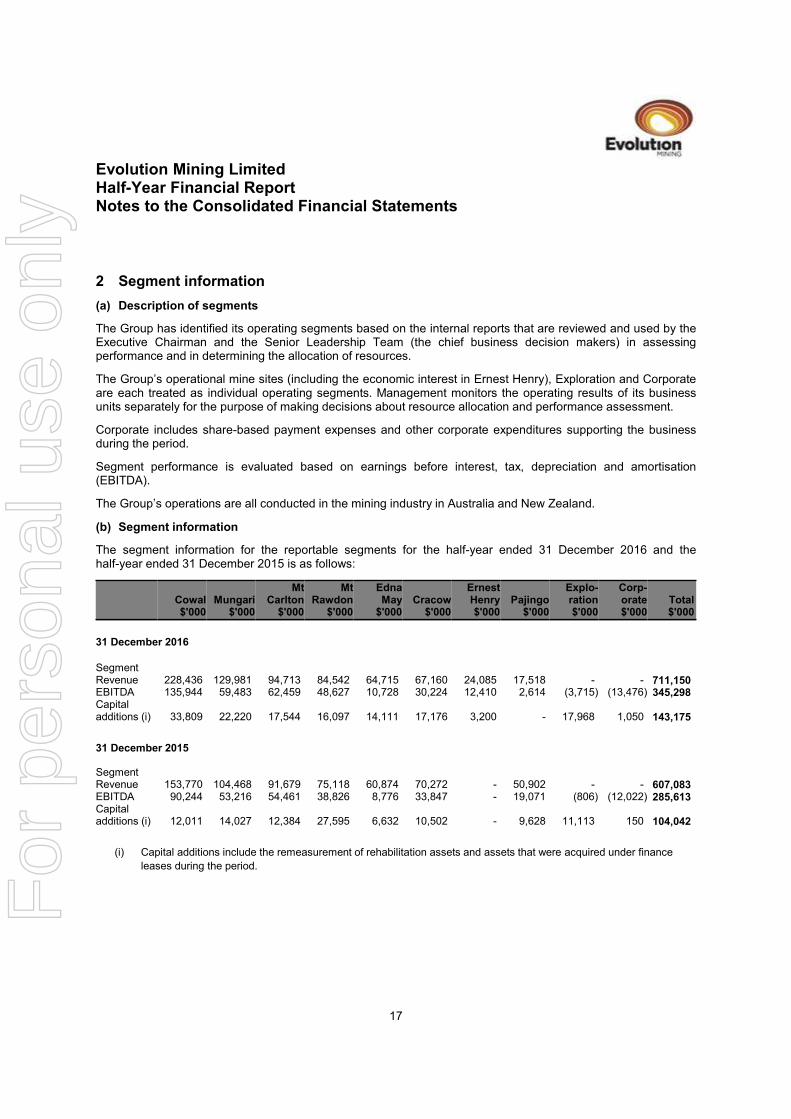
The Group has identified its operating segments based on the internal reports that are reviewed and used by theExecutive Chairman and the Senior Leadership Team (the chief business decision makers) in assessingperformance and in determining the allocation of resources.
The Group’s operational mine sites (including the economic interest in Ernest Henry), Exploration and Corporateare each treated as individual operating segments. Management monitors the operating results of its businessunits separately for the purpose of making decisions about resource allocation and performance assessment.
Corporate includes share-based payment expenses and other corporate expenditures supporting the businessduring the period.
Segment performance is evaluated based on earnings before interest, tax, depreciation and amortisation(EBITDA).
The Group’s operations are all conducted in the mining industry in Australia and New Zealand.
(b) Segment information
The segment information for the reportable segments for the half-year ended 31 December 2016 and thehalf-year ended 31 December 2015 is as follows:
Cowal$'000
Mungari$'000
MtCarlton$'000
MtRawdon
$'000
EdnaMay$'000
Cracow$'000
ErnestHenry$'000
Pajingo$'000
Explo-ration$'000
Corp-orate$'000
Total$'000
31 December 2016
SPACESegmentRevenue 228,436 129,981 94,713 84,542 64,715 67,160 24,085 17,518 - - 711,150EBITDA 135,944 59,483 62,459 48,627 10,728 30,224 12,410 2,614 (3,715) (13,476) 345,298Capitaladditions (i) 33,809 22,220 17,544 16,097 14,111 17,176 3,200 - 17,968 1,050 143,175
31 December 2015SPACESegmentRevenue 153,770 104,468 91,679 75,118 60,874 70,272 - 50,902 - - 607,083EBITDA 90,244 53,216 54,461 38,826 8,776 33,847 - 19,071 (806) (12,022) 285,613Capitaladditions (i) 12,011 14,027 12,384 27,595 6,632 10,502 - 9,628 11,113 150 104,042
(i) Capital additions include the remeasurement of rehabilitation assets and assets that were acquired under finance
leases during the period.
17
For
per
sona
l use
onl
y
Evolution Mining LimitedHalf-Year Financial ReportNotes to the Consolidated Financial Statements
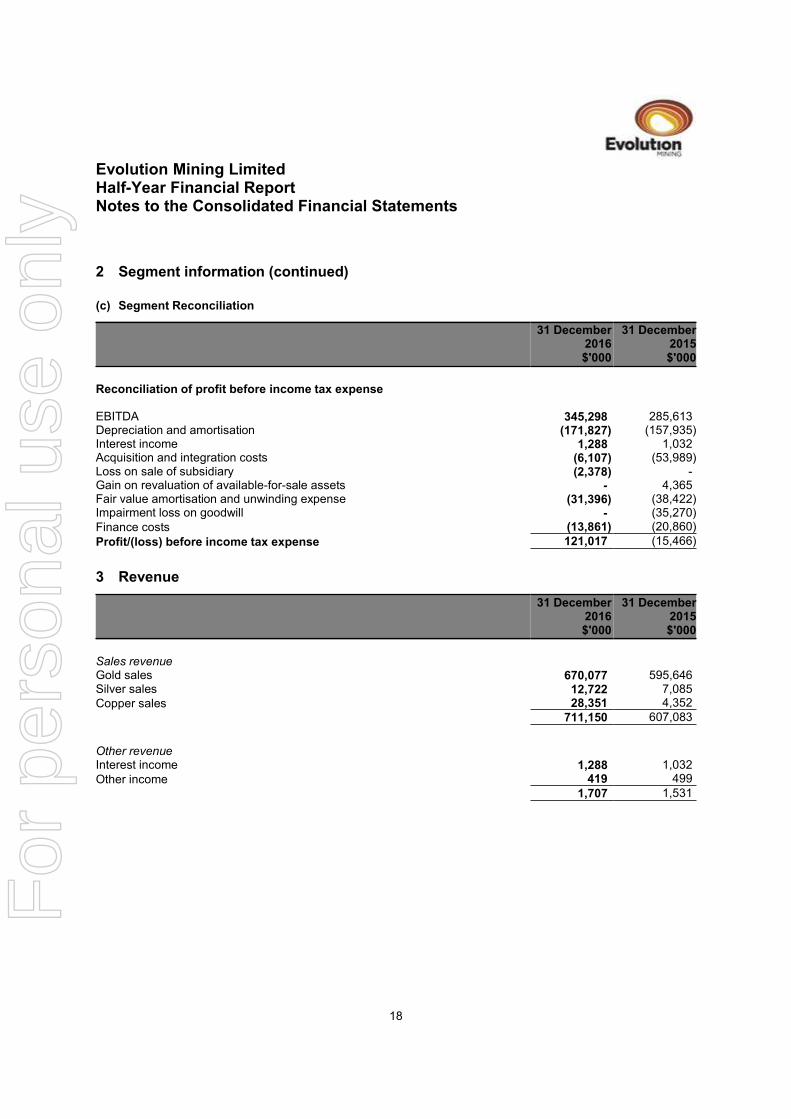
2 Segment information (continued)
(c) Segment Reconciliation
31 December2016$'000
31 December2015$'000
Reconciliation of profit before income tax expenseSPACEEBITDA 345,298 285,613Depreciation and amortisation (171,827) (157,935)Interest income 1,288 1,032Acquisition and integration costs (6,107) (53,989)Loss on sale of subsidiary (2,378) -Gain on revaluation of available-for-sale assets - 4,365Fair value amortisation and unwinding expense (31,396) (38,422)Impairment loss on goodwill - (35,270)Finance costs (13,861) (20,860)
Profit/(loss) before income tax expense 121,017 (15,466)
3 Revenue
31 December2016$'000
31 December2015$'000
Sales revenueGold sales 670,077 595,646Silver sales 12,722 7,085Copper sales 28,351 4,352
711,150 607,083
Other revenueInterest income 1,288 1,032Other income 419 499
1,707 1,531
18
For
per
sona
l use
onl
y
Evolution Mining LimitedHalf-Year Financial ReportNotes to the Consolidated Financial Statements
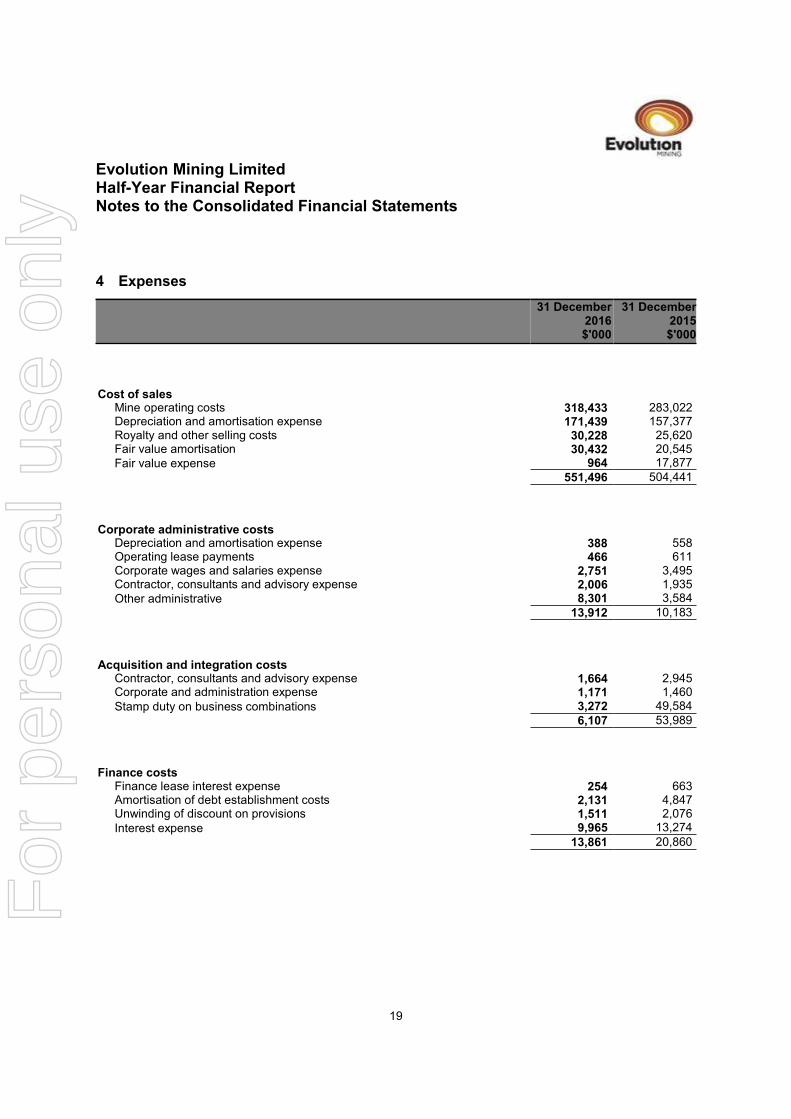
4 Expenses
31 December2016$'000
31 December2015$'000
Cost of salesMine operating costs 318,433 283,022Depreciation and amortisation expense 171,439 157,377Royalty and other selling costs 30,228 25,620Fair value amortisation 30,432 20,545Fair value expense 964 17,877
551,496 504,441
Corporate administrative costsDepreciation and amortisation expense 388 558Operating lease payments 466 611Corporate wages and salaries expense 2,751 3,495Contractor, consultants and advisory expense 2,006 1,935Other administrative 8,301 3,584
13,912 10,183
Acquisition and integration costsContractor, consultants and advisory expense 1,664 2,945Corporate and administration expense 1,171 1,460Stamp duty on business combinations 3,272 49,584
6,107 53,989
Finance costsFinance lease interest expense 254 663Amortisation of debt establishment costs 2,131 4,847Unwinding of discount on provisions 1,511 2,076Interest expense 9,965 13,274
13,861 20,860
19
For
per
sona
l use
onl
y
Evolution Mining LimitedHalf-Year Financial ReportNotes to the Consolidated Financial Statements
4 Expenses (continued)
31 December2016$'000
31 December2015$'000
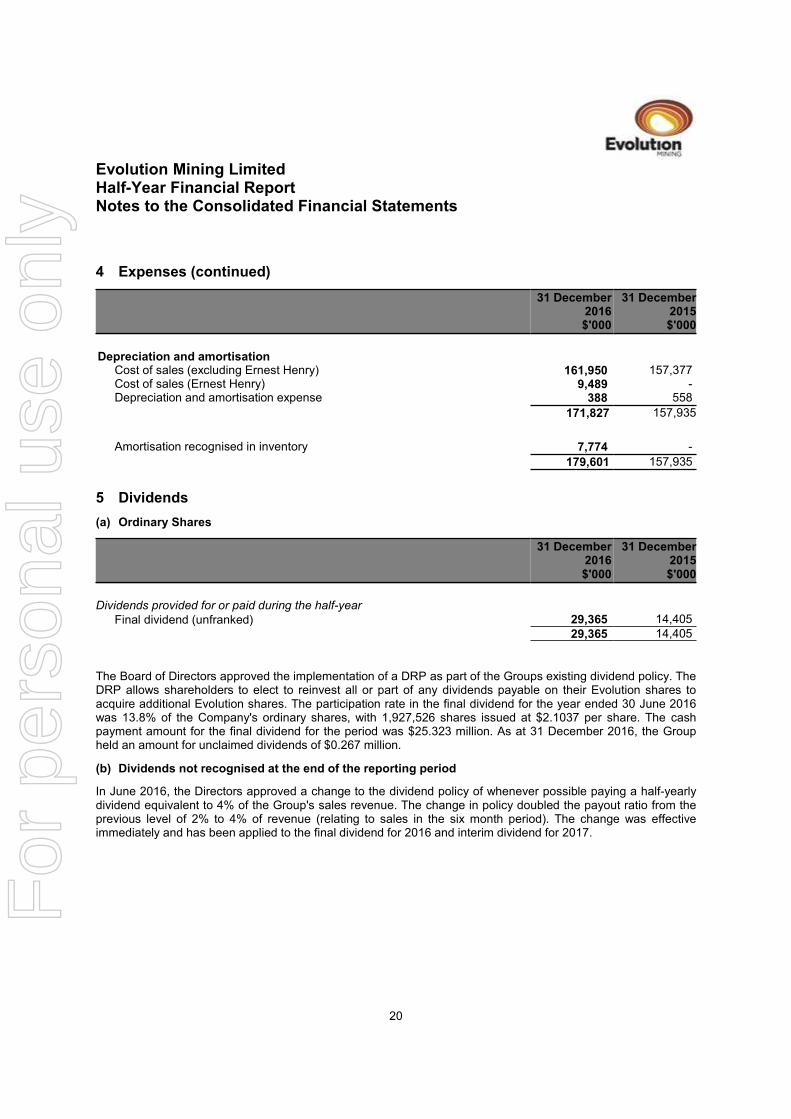
Depreciation and amortisationCost of sales (excluding Ernest Henry) 161,950 157,377Cost of sales (Ernest Henry) 9,489 -Depreciation and amortisation expense 388 558
171,827 157,935
Amortisation recognised in inventory 7,774 -
179,601 157,935
5 Dividends
(a) Ordinary Shares
31 December2016$'000
31 December2015$'000
Dividends provided for or paid during the half-year
Final dividend (unfranked) 29,365 14,405
29,365 14,405
The Board of Directors approved the implementation of a DRP as part of the Groups existing dividend policy. TheDRP allows shareholders to elect to reinvest all or part of any dividends payable on their Evolution shares toacquire additional Evolution shares. The participation rate in the final dividend for the year ended 30 June 2016was 13.8% of the Company's ordinary shares, with 1,927,526 shares issued at $2.1037 per share. The cashpayment amount for the final dividend for the period was $25.323 million. As at 31 December 2016, the Groupheld an amount for unclaimed dividends of $0.267 million.
(b) Dividends not recognised at the end of the reporting period
In June 2016, the Directors approved a change to the dividend policy of whenever possible paying a half-yearlydividend equivalent to 4% of the Group's sales revenue. The change in policy doubled the payout ratio from theprevious level of 2% to 4% of revenue (relating to sales in the six month period). The change was effectiveimmediately and has been applied to the final dividend for 2016 and interim dividend for 2017.
20
For
per
sona
l use
onl
y
Evolution Mining LimitedHalf-Year Financial ReportNotes to the Consolidated Financial Statements
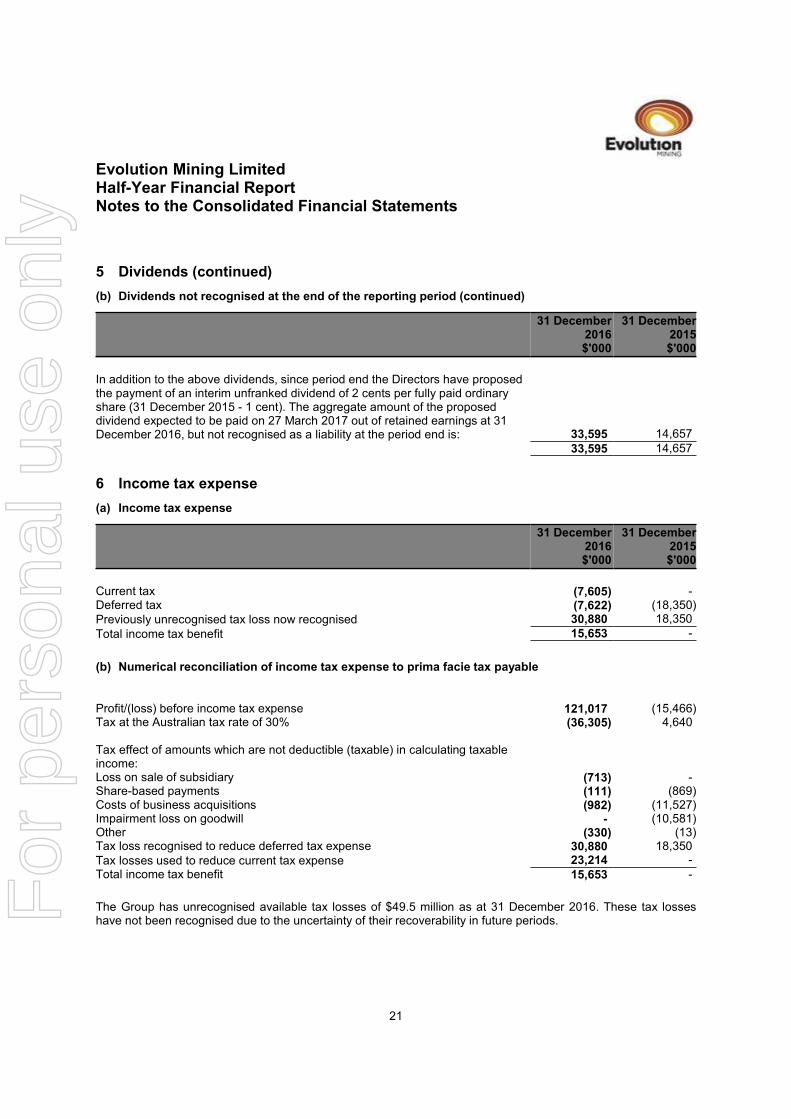
5 Dividends (continued)
(b) Dividends not recognised at the end of the reporting period (continued)
31 December2016$'000
31 December2015$'000
In addition to the above dividends, since period end the Directors have proposedthe payment of an interim unfranked dividend of 2 cents per fully paid ordinaryshare (31 December 2015 - 1 cent). The aggregate amount of the proposeddividend expected to be paid on 27 March 2017 out of retained earnings at 31December 2016, but not recognised as a liability at the period end is: 33,595 14,657
33,595 14,657
6 Income tax expense
(a) Income tax expense
31 December2016$'000
31 December2015$'000
Current tax (7,605) -Deferred tax (7,622) (18,350)Previously unrecognised tax loss now recognised 30,880 18,350
Total income tax benefit 15,653 -
(b) Numerical reconciliation of income tax expense to prima facie tax payable
Profit/(loss) before income tax expense 121,017 (15,466)Tax at the Australian tax rate of 30% (36,305) 4,640SPACETax effect of amounts which are not deductible (taxable) in calculating taxableincome:Loss on sale of subsidiary (713) -Share-based payments (111) (869)Costs of business acquisitions (982) (11,527)Impairment loss on goodwill - (10,581)Other (330) (13)Tax loss recognised to reduce deferred tax expense 30,880 18,350Tax losses used to reduce current tax expense 23,214 -Total income tax benefit 15,653 -
The Group has unrecognised available tax losses of $49.5 million as at 31 December 2016. These tax losseshave not been recognised due to the uncertainty of their recoverability in future periods.
21
For
per
sona
l use
onl
y
Evolution Mining LimitedHalf-Year Financial ReportNotes to the Consolidated Financial Statements
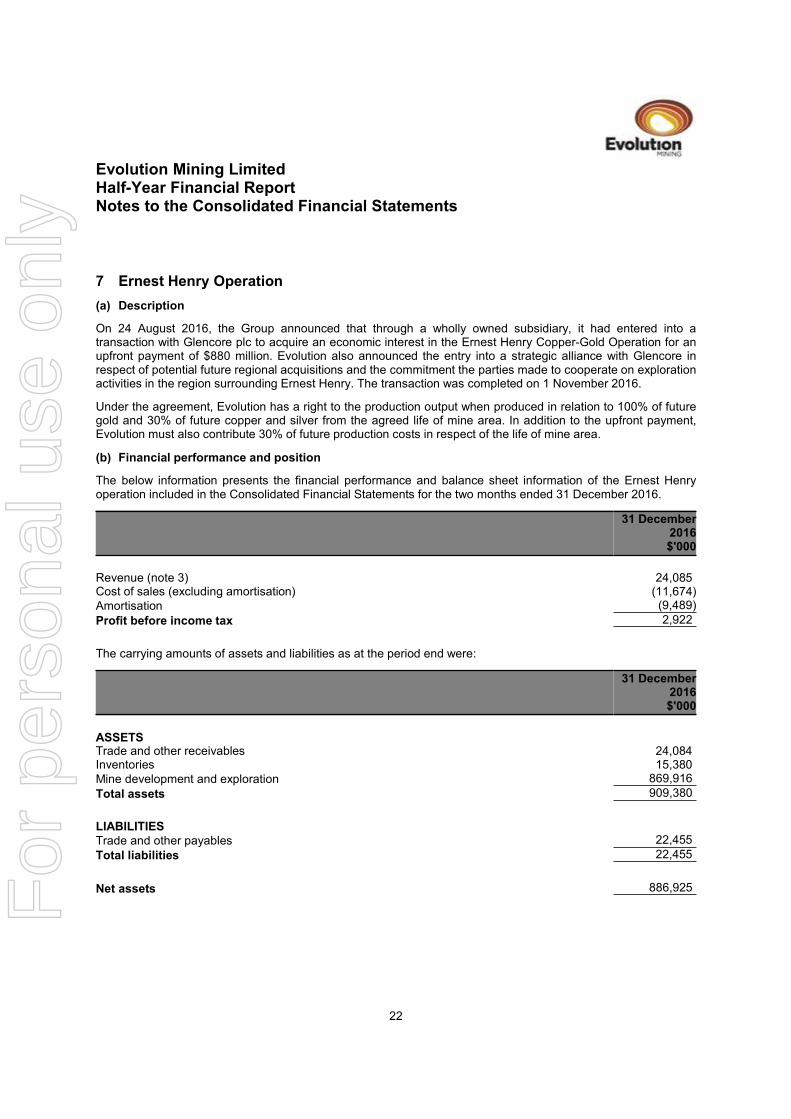
7 Ernest Henry Operation
(a) Description
On 24 August 2016, the Group announced that through a wholly owned subsidiary, it had entered into atransaction with Glencore plc to acquire an economic interest in the Ernest Henry Copper-Gold Operation for anupfront payment of $880 million. Evolution also announced the entry into a strategic alliance with Glencore inrespect of potential future regional acquisitions and the commitment the parties made to cooperate on explorationactivities in the region surrounding Ernest Henry. The transaction was completed on 1 November 2016.
Under the agreement, Evolution has a right to the production output when produced in relation to 100% of futuregold and 30% of future copper and silver from the agreed life of mine area. In addition to the upfront payment,Evolution must also contribute 30% of future production costs in respect of the life of mine area.
(b) Financial performance and position
The below information presents the financial performance and balance sheet information of the Ernest Henryoperation included in the Consolidated Financial Statements for the two months ended 31 December 2016.
31 December2016$'000
Revenue (note 3) 24,085Cost of sales (excluding amortisation) (11,674)Amortisation (9,489)
Profit before income tax 2,922
The carrying amounts of assets and liabilities as at the period end were:
31 December2016$'000
ASSETSTrade and other receivables 24,084Inventories 15,380Mine development and exploration 869,916
Total assets 909,380
LIABILITIESTrade and other payables 22,455
Total liabilities 22,455
Net assets 886,925
22
For
per
sona
l use
onl
y
Evolution Mining LimitedHalf-Year Financial ReportNotes to the Consolidated Financial Statements
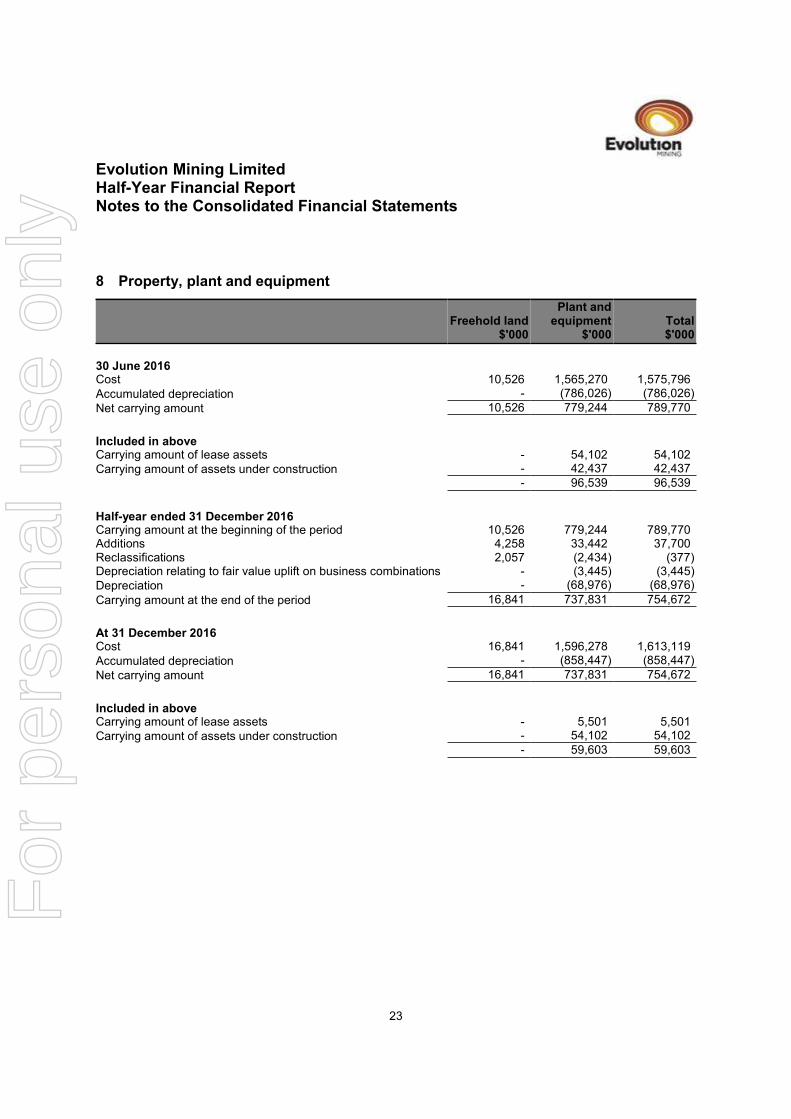
8 Property, plant and equipment
Freehold land$'000
Plant andequipment
$'000Total$'000
30 June 2016Cost 10,526 1,565,270 1,575,796Accumulated depreciation - (786,026) (786,026)
Net carrying amount 10,526 779,244 789,770
Included in aboveCarrying amount of lease assets - 54,102 54,102Carrying amount of assets under construction - 42,437 42,437
- 96,539 96,539
Half-year ended 31 December 2016Carrying amount at the beginning of the period 10,526 779,244 789,770Additions 4,258 33,442 37,700Reclassifications 2,057 (2,434) (377)Depreciation relating to fair value uplift on business combinations - (3,445) (3,445)Depreciation - (68,976) (68,976)
Carrying amount at the end of the period 16,841 737,831 754,672
At 31 December 2016Cost 16,841 1,596,278 1,613,119Accumulated depreciation - (858,447) (858,447)
Net carrying amount 16,841 737,831 754,672
Included in aboveCarrying amount of lease assets - 5,501 5,501Carrying amount of assets under construction - 54,102 54,102
- 59,603 59,603
23
For
per
sona
l use
onl
y
Evolution Mining LimitedHalf-Year Financial ReportNotes to the Consolidated Financial Statements
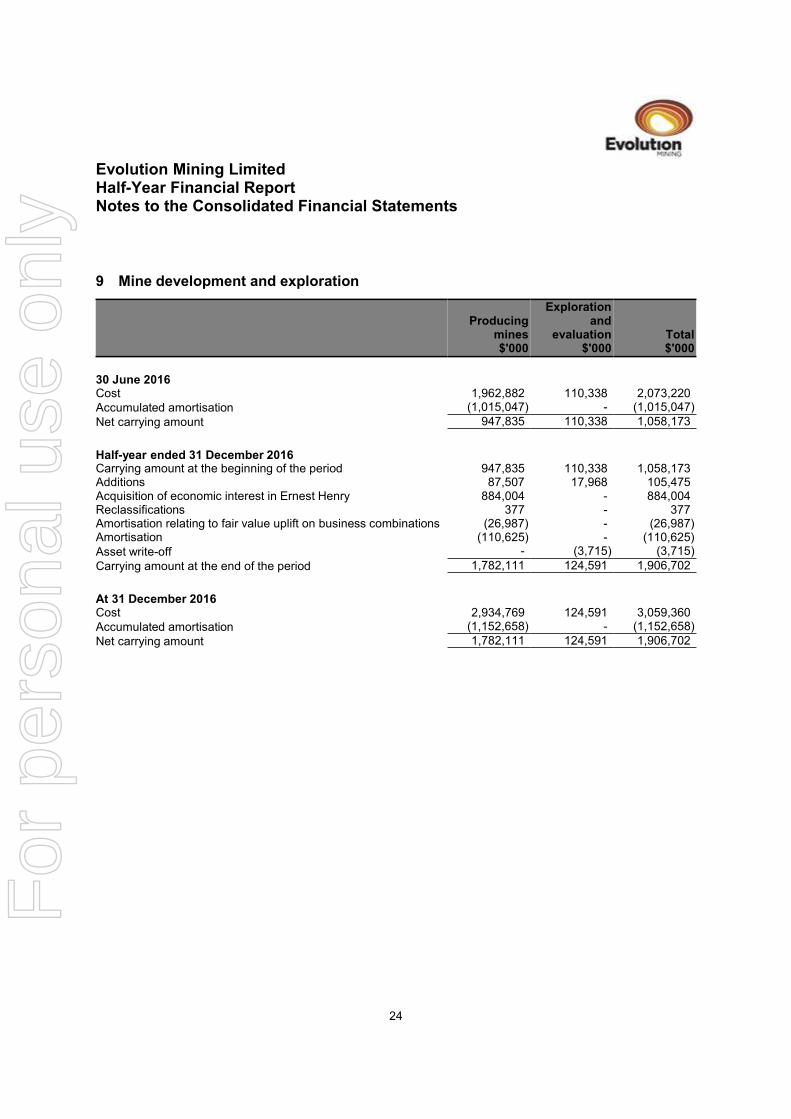
9 Mine development and exploration
Producingmines$'000
Explorationand
evaluation$'000
Total$'000
30 June 2016Cost 1,962,882 110,338 2,073,220Accumulated amortisation (1,015,047) - (1,015,047)
Net carrying amount 947,835 110,338 1,058,173
Half-year ended 31 December 2016Carrying amount at the beginning of the period 947,835 110,338 1,058,173Additions 87,507 17,968 105,475Acquisition of economic interest in Ernest Henry 884,004 - 884,004Reclassifications 377 - 377Amortisation relating to fair value uplift on business combinations (26,987) - (26,987)Amortisation (110,625) - (110,625)Asset write-off - (3,715) (3,715)
Carrying amount at the end of the period 1,782,111 124,591 1,906,702
At 31 December 2016Cost 2,934,769 124,591 3,059,360Accumulated amortisation (1,152,658) - (1,152,658)
Net carrying amount 1,782,111 124,591 1,906,702
24
For
per
sona
l use
onl
y
Evolution Mining LimitedHalf-Year Financial ReportNotes to the Consolidated Financial Statements
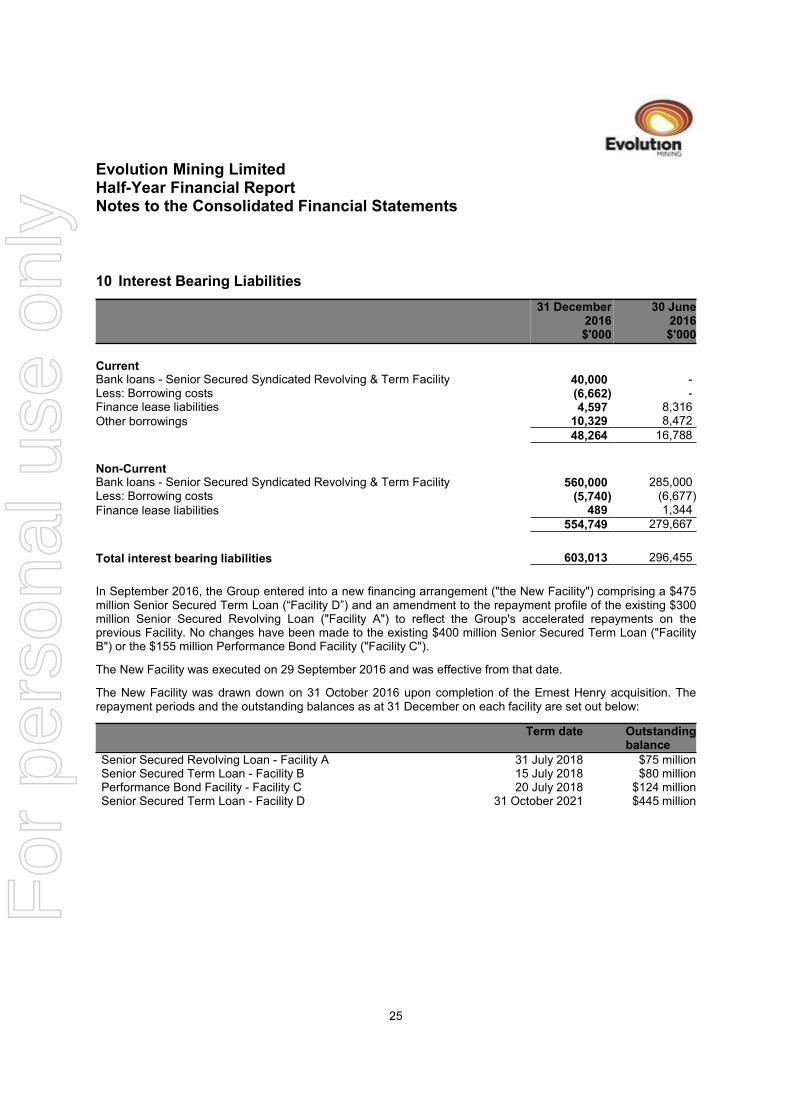
10 Interest Bearing Liabilities
31 December2016$'000
30 June2016$'000
CurrentBank loans - Senior Secured Syndicated Revolving & Term Facility 40,000 -Less: Borrowing costs (6,662) -Finance lease liabilities 4,597 8,316Other borrowings 10,329 8,472
48,264 16,788
Non-CurrentBank loans - Senior Secured Syndicated Revolving & Term Facility 560,000 285,000Less: Borrowing costs (5,740) (6,677)Finance lease liabilities 489 1,344
554,749 279,667
Total interest bearing liabilities 603,013 296,455
In September 2016, the Group entered into a new financing arrangement ("the New Facility") comprising a $475million Senior Secured Term Loan (“Facility D”) and an amendment to the repayment profile of the existing $300million Senior Secured Revolving Loan ("Facility A") to reflect the Group's accelerated repayments on theprevious Facility. No changes have been made to the existing $400 million Senior Secured Term Loan ("FacilityB") or the $155 million Performance Bond Facility ("Facility C").
The New Facility was executed on 29 September 2016 and was effective from that date.
The New Facility was drawn down on 31 October 2016 upon completion of the Ernest Henry acquisition. Therepayment periods and the outstanding balances as at 31 December on each facility are set out below:
Term date Outstandingbalance
Senior Secured Revolving Loan - Facility A 31 July 2018 $75 millionSenior Secured Term Loan - Facility B 15 July 2018 $80 millionPerformance Bond Facility - Facility C 20 July 2018 $124 millionSenior Secured Term Loan - Facility D 31 October 2021 $445 million
25
For
per
sona
l use
onl
y
Evolution Mining LimitedHalf-Year Financial ReportNotes to the Consolidated Financial Statements
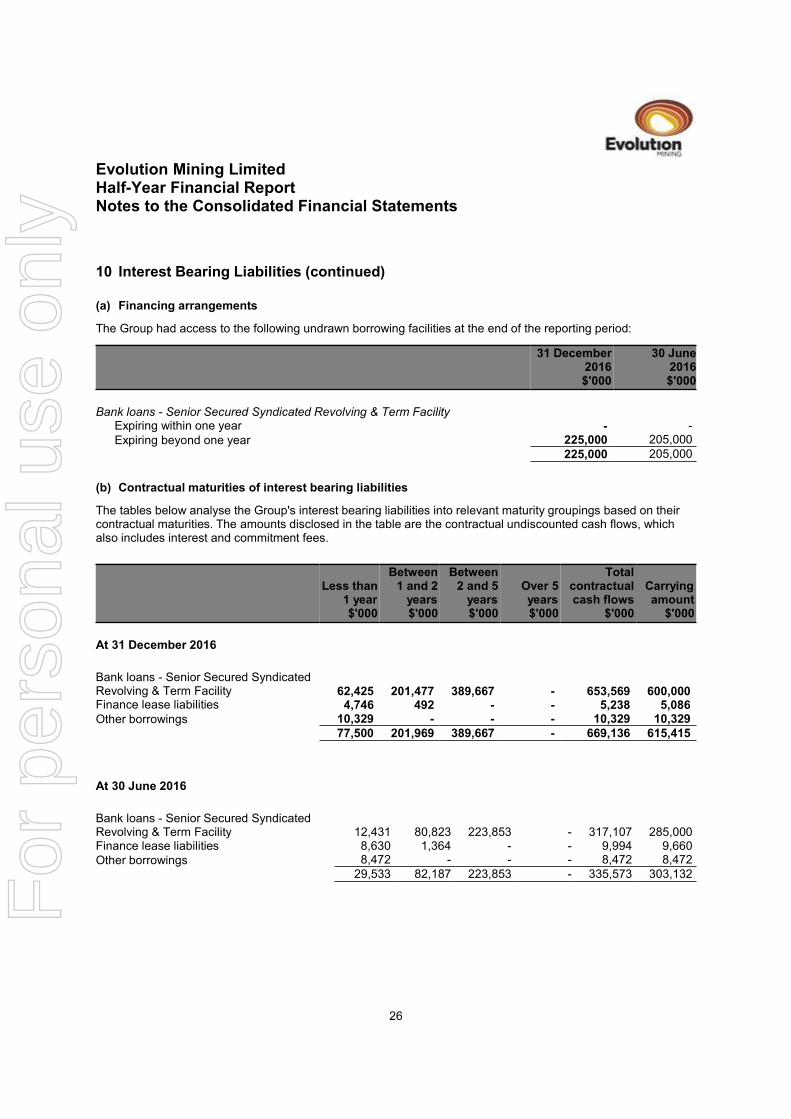
10 Interest Bearing Liabilities (continued)
(a) Financing arrangements
The Group had access to the following undrawn borrowing facilities at the end of the reporting period:
31 December2016$'000
30 June2016$'000
Bank loans - Senior Secured Syndicated Revolving & Term FacilityExpiring within one year - -Expiring beyond one year 225,000 205,000
225,000 205,000
(b) Contractual maturities of interest bearing liabilities
The tables below analyse the Group's interest bearing liabilities into relevant maturity groupings based on theircontractual maturities. The amounts disclosed in the table are the contractual undiscounted cash flows, whichalso includes interest and commitment fees.
Less than1 year$'000
Between1 and 2years$'000
Between2 and 5years$'000
Over 5years$'000
Totalcontractualcash flows
$'000
Carryingamount
$'000
At 31 December 2016
Bank loans - Senior Secured SyndicatedRevolving & Term Facility 62,425 201,477 389,667 - 653,569 600,000Finance lease liabilities 4,746 492 - - 5,238 5,086Other borrowings 10,329 - - - 10,329 10,329
77,500 201,969 389,667 - 669,136 615,415
At 30 June 2016
Bank loans - Senior Secured SyndicatedRevolving & Term Facility 12,431 80,823 223,853 - 317,107 285,000Finance lease liabilities 8,630 1,364 - - 9,994 9,660Other borrowings 8,472 - - - 8,472 8,472
29,533 82,187 223,853 - 335,573 303,132
26
For
per
sona
l use
onl
y
Evolution Mining LimitedHalf-Year Financial ReportNotes to the Consolidated Financial Statements
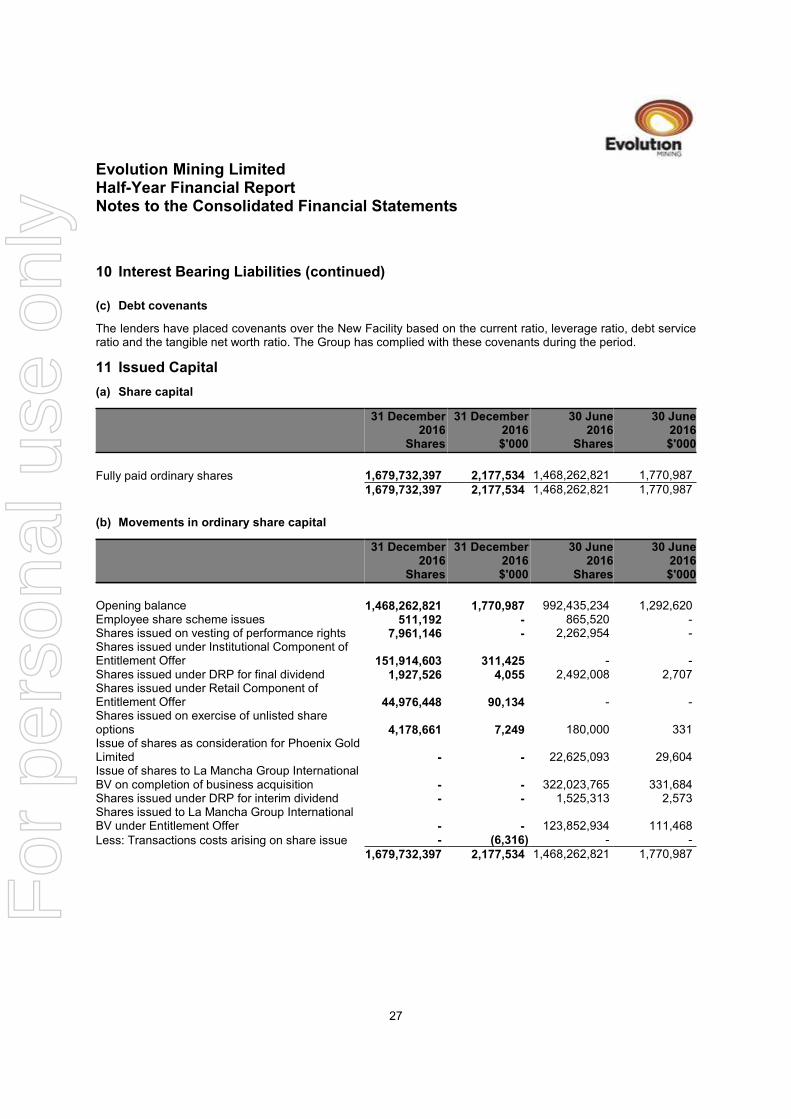
10 Interest Bearing Liabilities (continued)
(c) Debt covenants
The lenders have placed covenants over the New Facility based on the current ratio, leverage ratio, debt serviceratio and the tangible net worth ratio. The Group has complied with these covenants during the period.
11 Issued Capital
(a) Share capital
31 December2016
Shares
31 December2016$'000
30 June2016
Shares
30 June2016$'000
Fully paid ordinary shares 1,679,732,397 2,177,534 1,468,262,821 1,770,9871,679,732,397 2,177,534 1,468,262,821 1,770,987
(b) Movements in ordinary share capital
31 December2016
Shares
31 December2016$'000
30 June2016
Shares
30 June2016$'000
Opening balance 1,468,262,821 1,770,987 992,435,234 1,292,620Employee share scheme issues 511,192 - 865,520 -Shares issued on vesting of performance rights 7,961,146 - 2,262,954 -Shares issued under Institutional Component ofEntitlement Offer 151,914,603 311,425 - -Shares issued under DRP for final dividend 1,927,526 4,055 2,492,008 2,707Shares issued under Retail Component ofEntitlement Offer 44,976,448 90,134 - -Shares issued on exercise of unlisted shareoptions 4,178,661 7,249 180,000 331Issue of shares as consideration for Phoenix GoldLimited - - 22,625,093 29,604Issue of shares to La Mancha Group InternationalBV on completion of business acquisition - - 322,023,765 331,684Shares issued under DRP for interim dividend - - 1,525,313 2,573Shares issued to La Mancha Group InternationalBV under Entitlement Offer - - 123,852,934 111,468Less: Transactions costs arising on share issue - (6,316) - -
1,679,732,397 2,177,534 1,468,262,821 1,770,987
27
For
per
sona
l use
onl
y
Evolution Mining LimitedHalf-Year Financial ReportNotes to the Consolidated Financial Statements
11 Issued Capital (continued)
(c) Ordinary shares
Ordinary shares entitle the holder to participate in dividends and the proceeds on winding up of the Company inproportion to the number of and amounts paid on the shares held.
On a show of hands every holder of ordinary shares present at a meeting in person or by proxy, is entitled to onevote, and upon a poll each share is entitled to one vote.
Ordinary shares have no par value and the Company does not have a limited amount of authorised capital.
12 Related party transactions
(a) Transactions with other related parties
Directors fees in the amount of $56,250 was paid to International Mining and Finance Corp, a company of whichMr James Askew is a Director for services provided during the period (31 December 2015: $27,500).
Directors fees in the amount of $100,000 was paid to DAK Corporation, a company of which Mr Jacob Klein is aDirector for services provided during the period (31 December 2015: $100,000).
Directors fees in the amount of $65,783 was paid to Lazy 7 Pty Ltd, a company of which Mr Colin Johnstone is aDirector for services provided during the period (31 December 2015: $56,028).
Directors fees in the amount of $47,500 was paid to Mr Naguib Sawaris as a Director for services provided duringthe period (31 December 2015: $ nil).
Directors fees in the amount of $51,875 was paid to Mr Sebastien de Montessus as a Director for servicesprovided during the period (31 December 2015: $ nil)
13 Contingencies
(a) Contingent liabilities
The Group had contingent liabilities at 31 December 2016 in respect of:
(i) Claims
Edna May Operations Pty Ltd, a wholly owned subsidiary of Evolution Mining Limited, received a Writ ofSummons from the Supreme Court of Western Australia on 9 July 2014 together with a Statement of Claim filedby Mineral Crushing Services (WA) Pty Ltd claiming damages of approximately $3 million in relation to contractcrushing services provided at the Edna May operation. The Group is vigorously defending the claim.
(ii) Guarantees
The Group has provided bank guarantees in favour of various government authorities and service providers withrespect to site restoration, contractual obligations and premises at 31 December 2016. The total of theseguarantees at 31 December 2016 was $123.634 million with various financial institutions (30 June 2016:$141.627 million).
28
For
per
sona
l use
onl
y
Evolution Mining LimitedHalf-Year Financial ReportNotes to the Consolidated Financial Statements
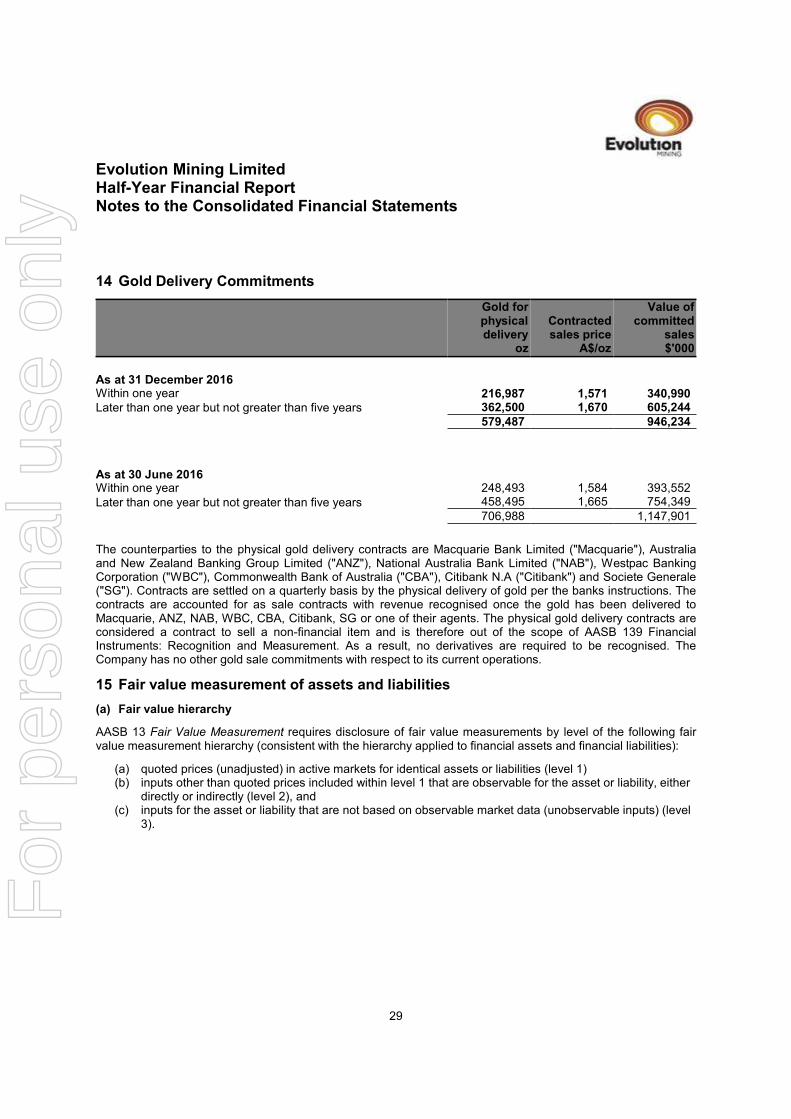
14 Gold Delivery Commitments
Gold forphysicaldelivery
oz
Contractedsales price
A$/oz
Value ofcommitted
sales$'000
As at 31 December 2016Within one year 216,987 1,571 340,990Later than one year but not greater than five years 362,500 1,670 605,244
579,487 3,241 946,234
As at 30 June 2016Within one year 248,493 1,584 393,552Later than one year but not greater than five years 458,495 1,665 754,349
706,988 3,249 1,147,901
The counterparties to the physical gold delivery contracts are Macquarie Bank Limited ("Macquarie"), Australiaand New Zealand Banking Group Limited ("ANZ"), National Australia Bank Limited ("NAB"), Westpac BankingCorporation ("WBC"), Commonwealth Bank of Australia ("CBA"), Citibank N.A ("Citibank") and Societe Generale("SG"). Contracts are settled on a quarterly basis by the physical delivery of gold per the banks instructions. Thecontracts are accounted for as sale contracts with revenue recognised once the gold has been delivered toMacquarie, ANZ, NAB, WBC, CBA, Citibank, SG or one of their agents. The physical gold delivery contracts areconsidered a contract to sell a non-financial item and is therefore out of the scope of AASB 139 FinancialInstruments: Recognition and Measurement. As a result, no derivatives are required to be recognised. TheCompany has no other gold sale commitments with respect to its current operations.
15 Fair value measurement of assets and liabilities
(a) Fair value hierarchy
AASB 13 Fair Value Measurement requires disclosure of fair value measurements by level of the following fairvalue measurement hierarchy (consistent with the hierarchy applied to financial assets and financial liabilities):
(a) quoted prices (unadjusted) in active markets for identical assets or liabilities (level 1)(b) inputs other than quoted prices included within level 1 that are observable for the asset or liability, either
directly or indirectly (level 2), and(c) inputs for the asset or liability that are not based on observable market data (unobservable inputs) (level
3).
29
For
per
sona
l use
onl
y
Evolution Mining LimitedHalf-Year Financial ReportNotes to the Consolidated Financial Statements
15 Fair value measurement of assets and liabilities (continued)
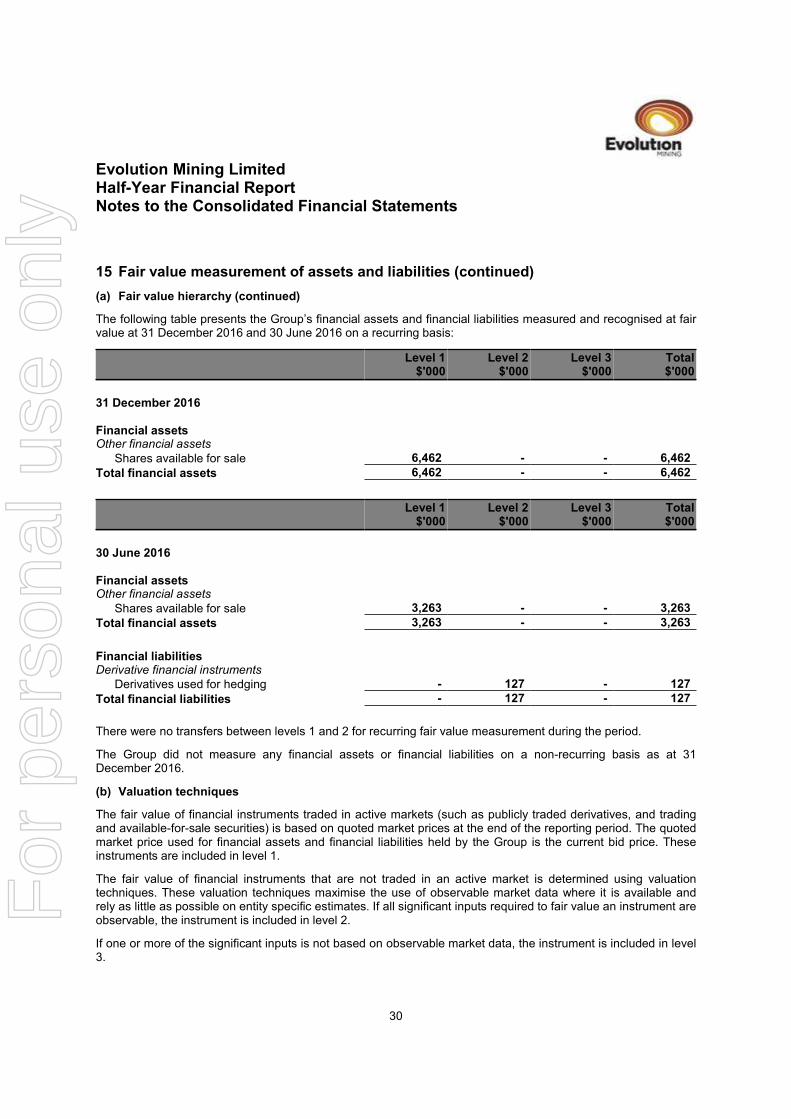
(a) Fair value hierarchy (continued)
The following table presents the Group’s financial assets and financial liabilities measured and recognised at fairvalue at 31 December 2016 and 30 June 2016 on a recurring basis:
Level 1$'000
Level 2$'000
Level 3$'000
Total$'000
31 December 2016SPACEFinancial assetsOther financial assets
Shares available for sale 6,462 - - 6,462
Total financial assets 6,462 - - 6,462
Level 1$'000
Level 2$'000
Level 3$'000
Total$'000
30 June 2016SPACEFinancial assetsOther financial assets
Shares available for sale 3,263 - - 3,263
Total financial assets 3,263 - - 3,263
Financial liabilitiesDerivative financial instruments
Derivatives used for hedging - 127 - 127
Total financial liabilities - 127 - 127
There were no transfers between levels 1 and 2 for recurring fair value measurement during the period.
The Group did not measure any financial assets or financial liabilities on a non-recurring basis as at 31December 2016.
(b) Valuation techniques
The fair value of financial instruments traded in active markets (such as publicly traded derivatives, and tradingand available-for-sale securities) is based on quoted market prices at the end of the reporting period. The quotedmarket price used for financial assets and financial liabilities held by the Group is the current bid price. Theseinstruments are included in level 1.
The fair value of financial instruments that are not traded in an active market is determined using valuationtechniques. These valuation techniques maximise the use of observable market data where it is available andrely as little as possible on entity specific estimates. If all significant inputs required to fair value an instrument areobservable, the instrument is included in level 2.
If one or more of the significant inputs is not based on observable market data, the instrument is included in level3.
30
For
per
sona
l use
onl
y
Evolution Mining LimitedHalf-Year Financial ReportNotes to the Consolidated Financial Statements
15 Fair value measurement of assets and liabilities (continued)
(b) Valuation techniques (continued)
Specific valuation techniques used to value financial assets and financial liabilities include:
• The use of quoted market prices or dealer quotes for similar instruments.• The fair value of interest rate and diesel swaps is calculated as the present value of the estimated future
cash flows based on observable yield curves.
All of the resulting fair value estimates are included in either level 1 or 2. There are no financial instrumentsincluded in level 3 for the half-year ended 31 December 2016.
16 Events occurring after the reporting period
No matter or circumstance has occurred subsequent to period end that has significantly affected, or maysignificantly affect, the operations of the Group, the results of those operations or the state of affairs of the Groupor economic entity in subsequent financial periods, except for the following:
No matter or circumstance has occurred subsequent to period end that has significantly affected, or maysignificantly affect, the operations of the Group, the results of those operations or the state of affairs of the Groupor economic entity in subsequent financial periods, except for the following:
(a) On 20 January 2017, Evolution obtained an Australian Taxation Office (ATO) Private Ruling ruling whichallows the Group to amortise the $880 million upfront payment along with the monthly production costsas parcels of metal are delivered each month. A similar methodology has been adopted for tax andaccounting purposes.
(b) On 9 February, Evolution was granted regulatory approval from the NSW Department of Planning andEnvironment to extend the Cowal operations mine life to 2032.
(c) On 15 February, the Board approved the commencement of the E42 Stage H cutback and Dual LeachProject at the Cowal operation.
31
For
per
sona
l use
onl
y
Evolution Mining LimitedHalf-Year Financial ReportNotes to the Consolidated Financial Statements
17 Basis of preparation of half-year report
This consolidated Half-Year Financial Report for the half-year ended 31 December 2016 has been prepared inaccordance with Accounting Standard AASB 134 Interim Financial Reporting and the Corporations Act 2001.
This consolidated Half-Year Financial Report does not include all the notes of the type normally included in anAnnual Financial Report. Accordingly, this report is to be read in conjunction with the Annual Financial Report forthe year ended 30 June 2016 and any public announcements made by Evolution Mining Limited during thehalf-year ended 31 December 2016 in accordance with the continuous disclosure requirements of theCorporations Act 2001 and Australian Securities Exchange.
The accounting policies adopted are consistent with those of the previous Annual Financial Report andcorresponding Half-Year Financial Report in the prior period, except as set out below:
(a) New and amended standards adopted by the Group
A number of new or amended standards became applicable for the current reporting period. However, the groupdid not have to change its accounting policies or make retrospective adjustments as a result of adopting thesestandards.
(b) Impact of standards issued but not yet applied by the Group
(i) AASB 9 Financial instruments
AASB 9 Financial Instruments addresses the classification, measurement and derecognition of financial assetsand financial liabilities, introduces new rules for hedge accounting and a new impairment model for financialassets. The standard does not need to be applied until 1 January 2018 but is available for early adoption. Thegroup has decided not to adopt AASB 9 until it becomes mandatory on 1 January 2018.
The group does not expect the new guidance to have a significant impact on the classification and measurementof its financial assets for the following reason:
• The instruments that are currently classified as available-for-sale (AFS) financial assets appear to satisfythe conditions for classification as at fair value through other comprehensive income (FVOCI) and hencethere will be no change to the accounting for these assets.
There will be no impact on the group’s accounting for financial liabilities, as the new requirements only affect theaccounting for financial liabilities that are designated at fair value through profit or loss and the group does nothave any such liabilities. The derecognition rules have been transferred from AASB 139 Financial Instruments:Recognition and Measurement and have not been changed.
The new hedge accounting rules will align the accounting for hedging instruments more closely with the group’srisk management practices. As a general rule, more hedge relationships might be eligible for hedge accounting,as the standard introduces a more principles-based approach. However, at this stage the group does not expectto identify any new hedge relationships. As a consequence, the group does not expect a significant impact on theaccounting for its hedging relationships.
The new impairment model requires the recognition of impairment provisions based on expected credit losses(ECL) rather than only incurred credit losses as is the case under AASB 139. It applies to financial assetsclassified at amortised cost, instruments measured at FVOCI, contract assets under AASB 15 Revenue fromContracts with Customers, lease receivables, loan commitments and certain financial guarantee contracts. If thegroup were to adopt the new rules from 1 January 2017, it estimates that it would not be significantly impacted.
32
For
per
sona
l use
onl
y
Evolution Mining LimitedHalf-Year Financial ReportNotes to the Consolidated Financial Statements
17 Basis of preparation of half-year report (continued)
(b) Impact of standards issued but not yet applied by the Group (continued)
(i) AASB 9 Financial instruments (continued)
The new standard also introduces expanded disclosure requirements and changes in presentation. These areexpected to change the nature and extent of the group’s disclosures about its financial instruments particularly inthe year of the adoption of the new standard.
(ii) AASB 15 Revenue from contracts with customers
The AASB has issued a new standard for the recognition of revenue. This will replace AASB 118 which coversrevenue arising from the sale of goods and the rendering of services and AASB 111 which covers constructioncontracts.
The new standard is based on the principle that revenue is recognised when control of a good or servicetransfers to a customer.
The standard permits either a full retrospective or a modified retrospective approach for the adoption. It iseffective for the first interim period within annual reporting periods beginning on or after 1 January 2018. Thegroup will adopt the new standard from 1 January 2018.
Management has identified the following area that is likely to be affected:
• Metal and concentrate sales where recognition of revenue will depend on the passing of control ratherthan the passing of risks and rewards.
• At this stage the Group is not able to estimate the impact of the rules on the Group's financial statement.The Group will make more detailed assessments of the impact over the next twelve months.
(iii) AASB 16 Leases
AASB 16 was issued in February 2016. It will result in almost all leases being recognised on the balance sheet,as the distinction between operating and finance leases is removed. Under the new standard, an asset (the rightto use the leased item) and a financial liability to pay rentals are recognised. The only exceptions are short-termand low-value leases.
The standard will affect primarily the accounting for the group’s operating leases. As at the reporting date, thegroup has non-cancellable operating lease commitments of $38,651,000. However, the group has not yetdetermined to what extent these commitments will result in the recognition of an asset and a liability for futurepayments and how this will affect the group’s profit and classification of cash flows.
Some of the commitments may be covered by the exception for short-term and low-value leases and somecommitments may relate to arrangements that will not qualify as leases under AASB 16.
The standard is mandatory for first interim periods within annual reporting periods beginning on or after 1 January2019. At this stage, the group does not intend to adopt the standard before its effective date.
33
For
per
sona
l use
onl
y
Evolution Mining LimitedHalf-Year Financial ReportDirectors' Declaration31 December 2016
In the Directors' opinion:
(a) the financial statements and notes set out on pages 12 to 33 are in accordance with the Corporations Act2001, including:(i) complying with Accounting Standard AASB 134 Interim Financial Reporting and the Corporations
Regulations 2001, and(ii) giving a true and fair view of the consolidated entity's financial position as at 31 December 2016
and of its performance for the half-year ended on that date, and(b) there are reasonable grounds to believe that the Company will be able to pay its debts as and when they
become due and payable.
This declaration is made in accordance with a resolution of Directors.
Jacob (Jake) KleinExecutive Chairman
Graham FreestoneChairman of the Audit Committee
Sydney
34
For
per
sona
l use
onl
y
For
per
sona
l use
onl
y
For
per
sona
l use
onl
y