Embed Size (px)
Citation preview

AUSTRALIAN COTTON COMPARATIVE ANALYSIS
2019 CROP
Knowledge. Insight. Experience.

© Cotton Research and Development Corporation June 2014
ISBN 978-0-9923758-7-4
This work is copyright. Apart from any use permitted under the Copyright Act, 1968, no part may be reproduced
by any process without the written permission of Cotton Research and Development Corporation.
Cotton Research and Development Corporation
2 Lloyd St (PO Box 282)
Narrabri NSW 2390
ABN 71 054 238 316
Executive Director: Ian Taylor
R & D Investment: Allan Williams
Business & Finance: Graeme Tolson
Telephone: 02 6792 4088
Facsimile: 02 6792 4400
Email: [email protected]
Website: www.crdc.com.au
Boyce Chartered Accountants
Moree Phil Alchin 02 6751 2000 [email protected]
Jono Hart 02 6751 2000 [email protected]
Cooma Jonathan Forrest 02 6452 3344 [email protected]
Dubbo Scott Christian 02 6884 6499 [email protected]
Caroline Wilcher 02 6884 6499 [email protected]
Mike Nangle 02 6884 6499 [email protected]
Ben Calder 02 6884 6499 [email protected]
Goulburn Kate Garrett 02 4821 1466 [email protected]
Wagga Wagga Simon Sellars 02 6971 0600 [email protected]
Linda Mackellar 02 6971 0600 [email protected]
Hamish Cullenward 02 6971 0600 [email protected]
Images courtesy of Cotton Australia

Hamish Cullenward Director
Boyce Chartered Accountants Wagga Wagga
Ian Taylor Executive Director
CRDC Narrabri
Dear Grower,
We are pleased to present the 2019 Australian Cotton Comparative Analysis.
The cotton industry continues to reinvest in Best Management Practices, sustainability programs and in the
communities in which it operates. An example of this is the 2019 Australian Cotton Comparative Analysis.
The Comparative Analysis is a joint initiative between the Cotton Research & Development Corporation
(CRDC) and Boyce Chartered Accountants to produce the industry benchmark for the economics of cotton
growing in Australia.
The sample of participants this year again captures a representation from the different cotton-growing valleys. It
is always our aim to increase the sample size of the analysis. If you are a grower and find this report instructive but
do not currently participate in the analysis, we would welcome your involvement. Participation is free, and while
we know that involvement does take some effort, we believe that this effort leads to a greater understanding of
the numbers that drive your business with respect to other growers and trends within the industry.
As the industry continues to evolve, and as other studies on industry practices are finalised, we will continue
to compare the results from those studies and these figures with a view to providing better information
for the industry.
The 2019 Australian Cotton Comparative Analysis has been posted on the websites of Boyce Chartered
Accountants (www.boyceca.com) and CRDC (www.crdc.com.au). We welcome the use of the figures contained
in this report; however, it should be noted that the report or any part of it may not be published or reproduced
without authorisation.
We look forward to discussing the report with you.

INTRODUCTION 11.1 OUR SAMPLE 31.2 THE NEED TO BENCHMARK 3
REPORT ON THE 2019 CROP 42.1 THE 2019 CROP – ANALYTICAL REVIEW 52.1.1 Introduction2.1.2 Key performance indicators2.1.3 Five year averages to 20192.1.4 Other observations2.1.5 Water availability/viability 2.1.6 Features of the top performers2.2 RETURN ON ASSETS 132.2.1 What return on assets am I getting?2.2.2 Why measure ROA?2.3 CONCLUSION 17
COMPARATIVE STATISTICS 193.1 SUMMARY 203.1.1 Comparison of average income and expense items for the 2019 year3.2 AVERAGE FARMERS RESULTS PER HECTARE 223.2.1 Graphs 3.2.1.1 Comparison of average income and expense items 3.2.1.2 Yield and trendline 3.2.1.3 Value per bale and trendline3.2.2 Comparison of average income and expense items for the past 10 years3.2.3 Comparison of average results between the 2019 and 2018 year3.2.4 Comparison of the averages of the different valleys3.3 TOP 20% FARMERS RESULTS PER HECTARE 303.3.1 Graph 3.3.1.1 Comparison of average income and expense items3.3.2 Comparison of average income and expense items for the past 10 years3.4 TOP 20% FARMERS VERSUS AVERAGE FARMERS RESULTS PER HECTARE 333.4.1 Graphs 3.4.1.1 Comparison of yield 3.4.1.2 Comparison of value per bale 3.4.1.3 Comparison of operating profit 3.4.1.4 Comparison of net farm profit/(loss)3.4.2 Comparison of Top 20% Farmers and Average Farmers for the past five years3.5 PER BALE FIGURES 383.5.1 Graph 3.5.1.1 Comparison of average income and expense items3.5.2 Comparison of average income and expense items for the past 10 years3.6 LOW COST FARMERS 413.6.1 Comparison of average income and expense items for the past 10 years3.7 LOW COST FARMERS VERSUS AVERAGE FARMERS 433.7.1 Graph 3.7.1.1 Comparison of yield
APPENDICES 44Appendix A – Definition of termsAppendix B – Guide to income and expense allocationsAppendix C – Table on assessability of cotton proceedsAppendix D – Common sharefarming and leasing arrangements
1
3
4
2019 AUSTRALIAN COTTON COMPARATIVE ANALYSIS CONTENTS
2

Introduction1

The 2019 Australian Cotton Comparative Analysis (ACCA) is the fifteenth report produced by Boyce Chartered Accountants in conjunction with the Cotton Research & Development Corporation (CRDC). From 1986 to 2004 the report was compiled independently by Boyce. Having over 30 years of data in the same format for any industry is a valuable resource.
In this report, we present an analytical review of the 2019 results, a comparison with prior years, and comments on emerging trends.
The primary purpose of the ACCA is to show the income and expenses associated with growing fully irrigated
cotton on a per hectare and per bale basis. To get the most out of this report, the reader should be fully aware
of the methodology and in particular, understand the following:
• The analysis does not necessarily show the health of the cotton industry. Where a cotton grower grew skip-
row cotton or solid cotton that did not receive full water or grew no fully irrigated cotton at all, those resulting
figures are excluded from the analysis. In most, if not all cases, these alternate crops would have returned
a reduced profit per hectare in comparison to growing fully irrigated cotton. Therefore, although the grower
may have made a healthy per hectare profit on the hectares of fully irrigated solid cotton grown, the net
profit of the total farm would have been significantly less than if fully irrigated cotton was grown across the
full area, allowing for usual rotation practice.
• The figures show the average results of participants in the sample. For example, assume there were only
two participants in the sample who grew the same area of irrigated cotton. If one uses contractors for
picking and the other owns their pickers, the figure for contract picking will be approximately 50% of
the market rate. Similarly, the figures on a per line basis for expenses such as depreciation, repairs &
maintenance, wages etc. will all be less than market rates. With this knowledge, users of this information
can get additional information from this analysis.
• If there is a significant change in per line figures, this may not necessarily be due to a price increase. Line
items can be made up of price, the frequency of operation and the volume of input per operation. So where
there has been an increase in, for example, seed this could be due to price, the number of seeds per metre
planted (volume) or the number of plantings, or a combination of all three.
• Where a crop has not been picked due to flooding or some other disaster other than hail, the expenses
relating to the affected area have been excluded from the sample.
So care should be taken when using the results from this analysis. Understanding the basis on which the
analysis is constructed is the key to getting the most out of this study.
INTRODUCTION
BOYCE AND CRDC AUSTRALIAN COTTON COMPARATIVE ANALYSIS 2019 | 2

OUR SAMPLE
The analysis includes the results for farmers who were able to plant, grow and pick their crop using close to
standard irrigation practices. This year the total number of hectares in the sample decreased due to less cotton
grown throughout many of the cotton-growing areas of Australia, leading to fewer participants.
The average hectares planted per participant decreased from 1,141 hectares in 2018 to 618 hectares in 2019
due to the adverse growing conditions experienced by irrigators with the limiting factor being the lack of available
water. The total number of hectares in the sample was 15,441.
The total number of bales in the sample was 165,012 (down from 687,707 in 2018), which represented
approximately 8% of total Australian cotton production (down from 15% of total Australian cotton production
in 2018). Australia’s total number of bales produced decreased by 55% from 4,658,740 in 2018 to an
estimated 2,134,845 in 2019 (Cotton Australia statistics). Total area planted between 2018 and 2019 only
declined 35% showing the relative increase in dryland/semi-irrigated cotton compared to fully irrigated cotton
across the two years.
Marketing is an important part of management and can make a significant contribution to the profitability of a
cotton farm. For this reason, participants’ overall results in the ‘Comparison of average income and expense
items’ are not normalised with respect to income. While recognising marketing as an important part of
management, our study does not include or exclude growers from the Top 20% Farmers based on marketing
decisions with respect to currency, lint and basis. Our view is that growers should be classified into (or out of)
this group based on yield and cost only, as many growers review their operation against the Top 20% Farmers
to look for areas of improvement. We have therefore selected the top 20% substituting $596 (the average 2019
net price for all participants) for the average net price that the individual grower actually received.
It should be noted that although the average price of $596 was used to select the participants in the Top 20%
Farmers, the growers’ actual sales figures are reported in this analysis.
THE NEED TO BENCHMARK
Financial analysis using comparative statistics helps farmers identify relative strengths and weaknesses;
accompanying budgets and long term business plans will then focus on ways to overcome weaknesses and
build on strengths. In other words, this Comparative Analysis is a management tool to implement change and
to identify where effort should be directed on a day to day basis.
This analysis does not provide all the answers - it is a benchmark or a standard to strive for. It is up to management
to develop and implement specific action plans based on improved knowledge to set and achieve new goals.
The reliable, independent figures in the Comparative Analysis provide the starting point for farmers to develop
"best practice".
This analysis has been running since 1986 so if growers or other interested parties require more long term data
and analysis, please contact us to discuss the results and to clarify any queries so that we all develop a deeper
understanding of the industry.
1.1
1.2
BOYCE AND CRDC AUSTRALIAN COTTON COMPARATIVE ANALYSIS 2019 | 3

Report on the 2019 Crop
2

THE 2019 CROP – ANALYTICAL REVIEW
INTRODUCTION
Highlight numbers for the Average Farmers and Top 20% Farmers are as follows:
Average Farmers;
• Yield (10.69 bales per hectare) decreased by 1.13 bales from 11.82 bales per hectare in 2018. This is 1.04
bales per hectare less than the five year average of 11.73.
• Price per bale was $596, which is $55 higher than last year and $60 above the five year average of $536.
• Operating costs were higher than last year and were higher than the five-year average. 2019 costs per
hectare were $6,268 compared to $3,896 for 2018 and $4,549 for the five-year average. Based on these
figures, a yield of 11.04 bales per hectare was required to cover total expenses, a number which is well
above the five year average of 9.02 bales.
• Water costs were, without doubt, the major variant driving this increase in operating costs. Fuel, wages,
fertiliser, repairs and maintenance, depreciation and general overheads were key cost items to increase
while chemicals and application were notably down in 2019 relative to the 5-year average.
• Total income was $6,369 per hectare for 2019. This was down $40 per hectare from 2018; however, it is
still up $80 per hectare on the five-year average of $6,289.
The income per hectare was down while income per bale was up highlighting the impact yield has on the
bottom line and potentially growers chasing production with such a high lint price when otherwise they may not
have due to yield concerns.
Unlike the previous four years, 2019 was a poor season, with a net loss per hectare of $156. In comparison, last
year was $2,234 profit per hectare and the five-year average is $1,448 profit per hectare.
Top 20% Farmers;
• Yield (12.74 bales per hectare), was a decrease of 0.59 bales per hectare from the previous year (2018 was
13.33 bales per hectare) and slightly below the five year average of 13.08 bales per hectare.
• Price per bale was $597, which is $47 up from 2018 and $47 above the five-year average.
• Operating costs for this group increased, from 2018 to 2019, by $730 to $4,108, which is $325 above
the five-year average. The main contributors to the 2019 result being $325 above the five-year average
were R&M, overheads and administration, which is understandable in years where lower hectares
have been planted.
• This group grew more cotton (2.05 bales per hectare) than the Average Farmers and did it significantly
cheaper (by $2,160 per hectare).
• The main contributors to the $2,160 variance (savings made by the Top 20% Farmers) in operating
expenses per hectare were: Water charges and purchases ($1,084), Other farm overheads ($251), Wages
($180), Fuel and Oil ($177), Contract farming ($135), R & M ($121), and Fertiliser ($98).
The Top 20% Farmers experienced a $306 fall in profit per hectare from the previous year ($3,515 v $3,821).
However, the 2019 result was still higher than the five-year average of $3,295 per hectare.
Historically, being in the Top 20% Farmers is predominately driven by yield, so growers should always be
considering how to improve yield as cheaply as possible (i.e. less than $300/bale). Yield again set The Top 20%
Farmers apart from the average being able to pick 2 bales more per hectare.
2.1
2.1.1
BOYCE AND CRDC AUSTRALIAN COTTON COMPARATIVE ANALYSIS 2019 | 5

That said, the adverse conditions of 2019 went well beyond yield and highlighted the profits of those who could
not only lock in a great lint price but also successfully limit their production risk, with respect to other limiting
resources such as water and land. This is both securing water at a reasonable cost to meet crop demands but
also managing overheads/wages in a year of reduced hectares being planted.
In our view, the main focus for growers has to be the low-cost options that have the biggest impact on the
bottom line. While this may be self-evident, it deserves some serious structured and documented thought
by the industry.
The industry continues to be an early adopter of technology. At the industry level, this is a tremendous positive
as it shows the innovation that has driven the industry. However, from a profit perspective, individual growers
need to know where their profit comes from, as the early adoption of technology at the micro-level is not
always conducive with maximising profit. We believe each technology adoption needs to be framed initially
around ongoing cost minimisation or yield maximisation, and secondly from the point of view of the initial capital
cost and other benefits. This equation needs to be kept in perspective, but the answer could be different
for each grower.
An example of the adoption of one aspect of technology is around Bollgard and Roundup ready. The cost
of all chemicals (and their application) was $553 per hectare on average for 2016 and 2017 compared to an
average of $454 for 2018 and 2019. The compensation, to a small degree, was the increase in Licence fees
(Bollgard and Roundup ready) by $18 per hectare on the 2017 result and $19 per hectare above the five-year
average. At face value, this would indicate that there has been a decrease in expenses through the adoption of
this technology.
While growers continue to effectively ‘outsource’ or ‘buy’ products and expertise from various providers, growers
must continue to monitor the profit motive. From a classic economical point of view, a farming operation with
everything outsourced would technically make no profit!
To analyse the industry over 30 years in the same format provides valuable information with which to consider
where the future will take the industry. We recommend that growers spend some time thinking about where the
industry is headed in an attempt to be ahead of the game in the two main areas that impact profit – maximising
yields and ensuring costs are at a minimum.
The ability to take advantage of a solid lint price continues to be a big issue for the industry. The lack of stored
water and the way that impacts on the ability of a grower to achieve a good price has been addressed in
previous analyses. As discussed at the grower meetings we attend, the ability to lock in a price for lint when
water is available has been an important factor in underpinning the profit of the industry. If the price per bale
continues to fluctuate but not grow over time in real terms, then it follows that the ability to participate when
prices are high will become more important.
This year we have again included trend lines in some of the graphs presented. Some interesting trends from
1997 to 2019 continue to emerge, including:
• The value per bale continues to increase slightly, although we have seen no real growth over the long term.
• Despite no real long term growth in price, outliers in price exist ($427 in 2013 compared to $596 in 2019).
• The long term trendline is that costs per hectare continue to rise. With a considerable increase in the
costs per hectare experienced in the 2019 year, with the 2019 costs ($6,268) more then $1,700 more
per hectare then the previous high in 2016 of $4,500. This is certainly an outlier with respect to historic
records with the price of water going to unseen levels in the southern valleys due to increasing demand
from permanent plantings.
BOYCE AND CRDC AUSTRALIAN COTTON COMPARATIVE ANALYSIS 2019 | 6

?
• Yield per hectare continues to trend upward but are not at the same levels seen in the 2015 and 2016
seasons. The term ‘statistical yield’ indicates a fixed ceiling beyond which yield cannot exceed. Without
further plant development, this would be a worrying prospect, especially in light of cost increases. Continuing
development means that statistical yield is a moving target, but it's important to note that we are tending
towards a maximum yield, whereas there do not seem to be similar cost constraints.
• 2019 saw operating profit fall from unprecedented profit highs in 2018 to the lowest operating profit since
the millennium drought. While there is still a positive profit trend across the historical data the 2019 result
has highlighted the need for the industry to be realistic that profits will vary based on seasonal conditions.
The two statistics that are relatively static are price per bale and increasing costs per unit of inputs. The increased
profits for the industry are coming from efficiency (less quantity of inputs) and increased yield.
Five Year Average (2015 to 2019)
We believe the message of the average for a number of years is important. In this report, we have used the
average of this season and the past four seasons – five years in total.
What we are attempting to show by the five year average is the income and expenses on a per hectare basis
in a “normal” year.
KEY PERFORMANCE INDICATORS
YIELD (BALES / HA)
AVERAGE TOP 20% DIFF
2019 10.69 12.74 2.05
2018 11.82 13.33 1.51
2017 10.59 11.35 0.76
2016 12.95 13.69 0.74
2015 12.59 14.31 1.72
* Five year average 11.73 13.08 1.36
What is your water use efficiency in terms of bales per megalitre?Do your employees know your yield expectations?Have you reviewed your strategies depending on the availability of water?What was your maximum yield in a field and do you know why the other fields or areas did not perform as well?
VALUE ($ / BALE)
AVERAGE TOP 20% DIFF
2019 $596 $597 $1
2018 $542 $550 $8
2017 $527 $549 $23
2016 $507 $518 $11
2015 $517 $538 $21
* Five year average $538 $550 $12
• The cash price was generally above $600/bale from July 18 through to planting. From October it dropped
to around $560/bale by February 2019 whereby it began to rise back up to $600/bale in April 2019. Prices
dropped away in May and were down to approximately $550/bale by June 2019.
2.1.2
2.1.2.2
2.1.2.1
BOYCE AND CRDC AUSTRALIAN COTTON COMPARATIVE ANALYSIS 2019 | 7
?
?
• The average cash price for the growing period was just on $550 per bale. (Data provided by Independent
Commodity Management)
What strategies do you have in place to combat adverse currency and futures?How much cotton have you sold for the 2018 and 2019 crops?How do you forward market when there is some water security?Do you understand all the strategies that are available?Has the worry and risk of your marketing strategy been worth the benefit you have gained?Have we seen a change in the way cotton is marketed?
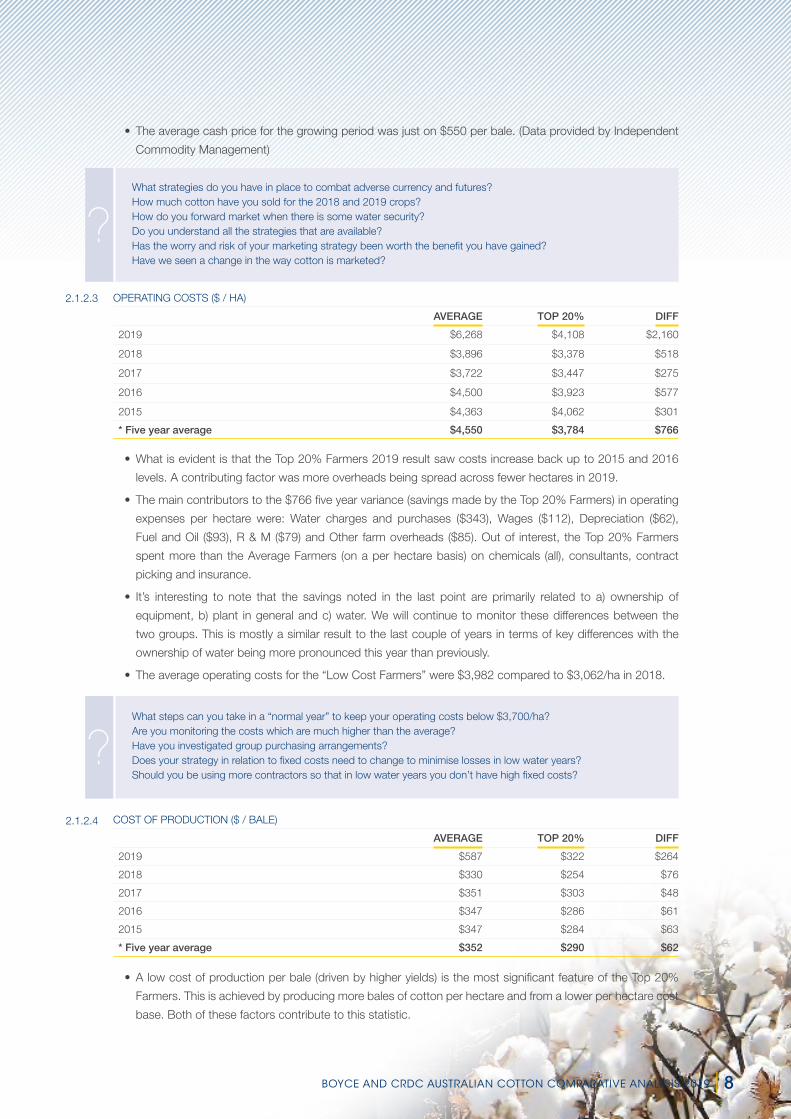
OPERATING COSTS ($ / HA)
AVERAGE TOP 20% DIFF
2019 $6,268 $4,108 $2,160
2018 $3,896 $3,378 $518
2017 $3,722 $3,447 $275
2016 $4,500 $3,923 $577
2015 $4,363 $4,062 $301
* Five year average $4,550 $3,784 $766
• What is evident is that the Top 20% Farmers 2019 result saw costs increase back up to 2015 and 2016
levels. A contributing factor was more overheads being spread across fewer hectares in 2019.
• The main contributors to the $766 five year variance (savings made by the Top 20% Farmers) in operating
expenses per hectare were: Water charges and purchases ($343), Wages ($112), Depreciation ($62),
Fuel and Oil ($93), R & M ($79) and Other farm overheads ($85). Out of interest, the Top 20% Farmers
spent more than the Average Farmers (on a per hectare basis) on chemicals (all), consultants, contract
picking and insurance.
• It’s interesting to note that the savings noted in the last point are primarily related to a) ownership of
equipment, b) plant in general and c) water. We will continue to monitor these differences between the
two groups. This is mostly a similar result to the last couple of years in terms of key differences with the
ownership of water being more pronounced this year than previously.
• The average operating costs for the “Low Cost Farmers” were $3,982 compared to $3,062/ha in 2018.
What steps can you take in a “normal year” to keep your operating costs below $3,700/ha?Are you monitoring the costs which are much higher than the average?Have you investigated group purchasing arrangements?Does your strategy in relation to fixed costs need to change to minimise losses in low water years?Should you be using more contractors so that in low water years you don’t have high fixed costs?
COST OF PRODUCTION ($ / BALE)
AVERAGE TOP 20% DIFF
2019 $587 $322 $264
2018 $330 $254 $76
2017 $351 $303 $48
2016 $347 $286 $61
2015 $347 $284 $63
* Five year average $352 $290 $62
• A low cost of production per bale (driven by higher yields) is the most significant feature of the Top 20%
Farmers. This is achieved by producing more bales of cotton per hectare and from a lower per hectare cost
base. Both of these factors contribute to this statistic.
2.1.2.3
2.1.2.4
BOYCE AND CRDC AUSTRALIAN COTTON COMPARATIVE ANALYSIS 2019 | 8

?
• Long-term average figures for the top producers prove that it is possible to achieve a benchmark cost of
production in the $280 to $320/ bale range in a “normal” year.
Are you continually focusing on your cost of production per bale?What are the Top 20% Farmers doing differently?
COMPARISON OF VALLEYS
Gwydir Barwon/McIntyre Macquarie Namoi Murrumbidgee
Gross income ($/ha) $7,502 $6,774 $6,803 $5,774 $6,042
Operating costs ($/ha) $5,601 $4,988 $5,827 $6,818 $6,931
Operating profit ($/ha) $1,901 $1,786 $976 ($1,044) ($889)
Operating profit ($/bale) $150 $154 $86 ($104) ($89)
Yield / ha 12.63 11.57 11.41 10.03 10.01
• The sample size this year for other valleys was not large enough to be included separately in this
years’ analysis.
FIVE YEAR AVERAGES
As noted in the introduction, we believe the message of the average is important, so we have compared five-
year average figures for the Average Farmers and the Top 20% Farmers using 2015, 2016, 2017, 2018 and
current year’s data.
What makes the Top 20% Farmers so much better than Average Farmers?
In the five selected years, the Top 20% Farmers made 127% more profit (after interest) than the Average
Farmers ($3,295/ha compared to $1,448/ha).
The difference is attributed to the following factors:
Land productivity (yield/ha) 40% or $738
Price 9% or $166
Direct cost savings – excluding Wages – Proprietors (fine tuning) 41% or $764
Interest savings (less debt) 10% or $179
100% $1,847
The message from these figures is that better land productivity (measured by higher yield) is overwhelmingly
the major feature of the top performers. Farmers should concentrate on growing higher yield within a realistic
cost framework rather than searching for dramatic cost cutting measures if they wish to improve their
performance significantly.
OTHER OBSERVATIONS
Over the years, many “rules of thumb” have been developed and quoted by farmers, financiers and accountants:
• Cotton farmers are in principle debt free if, at year-end, their equity in cotton pools and any unsold cotton
covers their total borrowings.
• The contingent tax liability associated with crop proceeds tipped forward (on hand and in pools) should
always be calculated and brought to account at year-end when measuring your wealth.
• The impact of inconsistent water availability on taxation. In a big profit year, with the ability to pool (defer)
proceeds, a tax loss results. Then heading into a lower production year, taxable income results. Growers
need to understand this relationship with a view to managing it and the cashflow implications it creates.
2.1.3
2.1.4
2.1.2.5
BOYCE AND CRDC AUSTRALIAN COTTON COMPARATIVE ANALYSIS 2019 | 9

• Debt in the industry is an issue. Even with interest rates at historically low levels, interest cost per hectare
(5 year average is $324 per hectare and represents 7% of operating expenses) are significant. To overlay
current debt with rates of 7% or 9% would have a significant impact on the industry.
• High wage costs and machinery horsepower per hectare are a quick indicator of overall high
costs of operations.
• Don’t underestimate the value of knowledge, both within your industry and worldwide. It can be difficult to
keep up to date with the latest practices, but falling behind will cost you money.
• Because of the high fixed and semi-fixed costs in this industry, it is becoming increasingly important to be
able to grow enough area every year to at least cover these costs. The value of secured water is obvious
when supply is short. With land and water being the finite resource available, these assets should be
matched to secure consistent production.
WATER AVAILABILITY/VIABILITY
In the 2019 analysis Water charges and purchases, at $1,275 per hectare, were $916 per hectare higher
than 2018 and $769 per hectare more than the five-year average. As might be expected the 2019 result was
heavily influenced by the Murrumbidgee which spent an average of $1,955 per hectare on Water charges and
purchases (which is nearly triple what was recorded in 2018 for that valley).
At the time of writing the implications for the industry now and in the future, due to the lack of availability and
subsequent cost of water, is a big challenge.
With this in mind, at what water price does the average grower break even?
If we assume water required for fully irrigated cotton is 10ML/Ha then, using $1,275, the Average Farmers water
charge per ML is $128. Note in the Southern Valleys this is $196/ML.
The Average net farm profit was $1,119 before water charges. This profit margin is entirely eroded once the
average price per ML exceeds $112. This is at a historically high average value per bale of $596.01 (Lint and
seed less ginning and levies).
For the Southern Valleys specifically, the farm net profit after interest but before water charges was $828/Ha.
Again assuming a water requirement of 10ML per Ha, this profit margin is entirely eroded once the average price
per ML exceeds $83/ML. This is at an average value per bale of $604.91 (Lint and seed less ginning and levies).
Please note;
1. This is purely water scheme and purchase costs and does not take into account the fuel used for pumping
2. Every grower is different, having different water requirements for their crop as well as different cost structures
for their business. If you would like us to help you analyse this with specific reference to your circumstances,
please get in touch.
3. Many factors go into growing cotton despite water costs approaching this level such as keeping staff,
meeting sales contracts etc. and as such growers may like to average water costs and returns over an
extended period for relativity (i.e. making a loss one year allows you to participate in bigger upside when
water is cheaper).
4. As water costs start to exceed $100-$150/ML growers are taking on production risk with a reduced profit
margin. In this case, it is worth looking into different scenarios such as:
a. Only growing enough hectares as you have secured water at a viable cost.
b. Selling water into the market (no risk and high prices).
2.1.5
BOYCE AND CRDC AUSTRALIAN COTTON COMPARATIVE ANALYSIS 2019 | 10

FEATURES OF THE TOP PERFORMERS
Over the past fifteen years, many cotton farmers have been able to achieve top-class results, even in years
when seasonal or financial circumstances were less than favourable.
Outlined below are some of the distinguishing characteristics and features of successful cotton growers:
• Controlled operating costs
Operating costs (before interest) for farmers have averaged $4,550/ha for the past five years. With fine-
tuning, the best farmers have been able to keep their operating costs under control without sacrificing yield
and still adequately maintaining all assets.
The performance of the “Low Cost” Farmers operating at their optimum scale over the past five years
proves that a target for operating costs of $3,250 to $3,750 /ha is achievable in a normal year. These figures
translate to operating costs of $280 to $320 /bale.
• Consistent marketing strategies
There are a large number of marketing alternatives available to cotton farmers. The strategies adopted by
individual farmers depend on:
• Individual outlook on risk • World-wide economic outlook • Taxation implications • Cash flow implications • Water availability • Level of knowledge on how to use the complex alternatives
To date, the perfect marketing strategy has proved to be elusive. Farmers need to make marketing decisions
with the aim of maximising their crop income, whilst keeping production risk in mind.
In our opinion, the application of consistent marketing strategies on a year in year out basis is the key to
maximising per bale prices in the longer term.
The top farmers know their cost of production per bale and resource limitations (land, water, staff, plant
etc.). They then base marketing decisions on that known cost and most limiting resource factor.
• Productive labour
Top-class results cannot be produced without having a top-class team of employees who are efficient,
focused, motivated and stable.
The best farms ensure that employees are kept informed, are trained to do their job properly, given
responsibility and an opportunity to participate in on-farm decision making. It is also essential that employees
are properly remunerated and take their holidays every year.
• Reliable machinery
All good farmers appreciate the importance of timing and so ensure that they own or have access to
sufficient reliable machinery to carry out all operations efficiently and on time.
• Sustainable farming techniques (rotation)
Many of the benefits of a stringent rotation program are not quantifiable in the short term, and the benefits
that are quantifiable are often disguised by other variables that can affect yield in any season. Growers,
however, are rotating to address the issues of disease and to allow for the re-levelling of fields.
2.1.6
BOYCE AND CRDC AUSTRALIAN COTTON COMPARATIVE ANALYSIS 2019 | 11

If farmers are going to maintain a sustainable cotton production system, maintain high yields and achieve
high levels of profitability in the long term, the issue of rotation needs to be included in the equation.
The top performers are continually looking at varied crops for rotation. These decisions are being made for
agronomic and financial reasons. Industry awareness is required to learn from these operators.
• Water use efficiency
The timing of when water is applied is critical in the production of high yielding crops.
As water becomes even more limited, the science behind the timing of watering and understanding each
variety’s reaction to the timing of water will become even more crucial. Growers are now paying closer
attention to measuring water use efficiency.
• Conservative levels of debt
Many farmers are carrying large amounts of debt. By adopting sound, sustainable practices, the best
farmers have been able to generate a significant cash surplus to repay borrowings. The best farmers are in
an enviable position of being able to survive in tough times, and in some circumstances expand the scale
of their operations.
It must be noted that debt can only be repaid out of a cash surplus after allowing for taxation, drawings and
capital purchases, or from the sale of other assets. It is interesting to note that the North have experienced
stagnated water and land values over the last seven years while the South has experienced large increases
in the value of water and land.
Our current low interest rate environment should encourage growers to look at protecting their borrowings
through interest rate management. Financiers are offering many varied products that provide this protection.
Farmers are considered to be in a very solid financial position (category A) if their debt, net of equity in
cotton pools and unsold crop, is less than 20% of assets at 30 June.
• Efficient financial management
Good farmers keep their financial affairs up to date and under control by utilising computerised office tools.
Annual budgets are prepared by the top performers on a conservative basis with realistic yet challenging
targets. Performance is then monitored monthly, comparing actual results with the previously prepared
budget. With up-to-date management reports, top performers can analyse performance and fine tune
operations regularly. They also keep their financiers well informed at all times.
• Timing
The best farms carry out all operations on time. Fields are ready to plant as soon as the season permits,
machinery is always ready to carry out the next task and team members always know what they have to do
a week or a month ahead. Waterings are never late.
Being on time is a result of good planning and good communication and leads to increased yields.
• Planning and long term vision
At the heart of every good operation is a person with vision; a vision of where the business is going on a
day-to-day basis, on an annual basis, and on a long-term basis (ten years plus). The best farmers always
seem to have time on their hands because they have clearly defined goals. They have communicated those
goals to their team members, and then take on the role of a coach who guides and encourages their team
to carry out the day-to-day activities.
BOYCE AND CRDC AUSTRALIAN COTTON COMPARATIVE ANALYSIS 2019 | 12

• High yields
High yields are the reward for getting all aspects of a farming operation right. No single farming technique,
method of operation or management decision is going to have a significant impact. Top performers do all
the little things thoroughly and on time and as a consequence “reap the rewards”.
The best farmers consistently achieve yields in excess of 11 bales/ha year after year (assuming adequate
water availability and no disasters such as hail or floods). Total farm averages of greater than 11.0 bales/ha
have been achieved and are now a realistic goal.
RETURN ON ASSETS
WHAT RETURN ON ASSETS AM I GETTING?
With costs continuing to rise, average cotton prices not growing in real terms, some growers where capital
growth in the industry will come from, growers must continue to look at the return on assets of a cotton farm.
Although a long term view is essential, growers must continually look at alternative investments (allowing for risk)
to assess what the return of a cotton farm really is.
As a general statement, the ten year average figures should not be used when analyzing the return on assets of
the industry as a whole. This is similar to our comments in the Introduction that this analysis does not necessarily
show the health of the cotton industry. Figures resulting from rotation crops, dryland cotton or semi irrigated
cotton, are, by definition, excluded from this analysis. To get more realistic ten year figures, more work would
have to be done to ascertain an average, probably based on historical water availability.
Trend lines indicate that the operating profit for the Top 20% Farmers and the Average Farmers is on the rise
with exceptionally strong results for the last three years having an impact.
How do I calculate my simple return on assets (ROA)?
The simple ROA is calculated by dividing your operating profit per hectare (before interest) by the value per
hectare (which is calculated as the total value of your land, licences and machinery divided by the number of
hectares grown during the year).
We have included a worksheet to calculate your ROA. The process is easy to follow and is outlined below:-
• From the farm operating profit/(loss) per ha spreadsheet find your yield and price per bale. Match these up
to calculate your operating profit (before interest) based on costs of $3,500/ha.
• Find the profit closest to your farm along the base of the return on assets based on various profits and land
variations spreadsheets.
• Select a value per hectare (this is calculated as the total value of your land, licences and machinery divided
by the number of hectares grown during the year), then:
a. You should add a value per hectare to allow for the country not planted. If you plant 2/3 of your country,
increase the value of your investment by 50%.
b. You also should add a value per hectare based on your machinery investment relating to the cotton
operation, e.g. $1,500,000 machinery divided by 1,500 hectares increases your investment by $1,000/ha).
• Match the two up and calculate your simple return on assets.
2.2
2.2.1
BOYCE AND CRDC AUSTRALIAN COTTON COMPARATIVE ANALYSIS 2019 | 13

WHY MEASURE ROA?
In isolation ROA provides you with a measure to better assess alternative investments. One year’s ROA result
should not serve as the yardstick to base decisions such as entry or exit of the industry.
This ROA does not include any increase in the value of your assets. If in a year you achieve 7% ROA and the
value of your assets increased by 5% then your total return is 12%.
Linked directly to this is the fact that you now have a higher asset value, and next year if you achieve the same
profit, your ROA will be lower.
Use the calculator to predict what your future returns may be.
For example:
• Assume a profit of $800/ha against today’s valuation of $10,000 ha – 8% return
• Now use the same profit against an increased market rate of $15,000/ha – 5.3% return
• To achieve an 8% return against a $15,000/ha valuation you need to reach a profit of $1,200/ha.
The cotton yield remains the greatest variable when looking forward or doing current comparisons between
growers. As discussed in this and prior reports, land productivity (yield) contributes to the majority of the
difference between the Top 20% and Average Farmers. What difference does yield make on ROA?
For example:
• Five year average profit to 2019 (before interest) for the Average Farmers of $1,739/ha against
$15,000/ha – 11.6% return.
• Five year average profit to 2019 (before interest) for the Top 20% Farmers of $3,408/ha against
$15,000/ha – 22.7% return.
(Yield differential of 1.36 bales/ha).
ROA needs to be balanced against such factors as risk, sustainability and reinvestment. If a grower’s main aim
is to just increase the ROA, this may have a negative impact on sustainability, as they may not reinvest through
redevelopment and take other sustainable actions.
There is a direct link between ROA and yield. The industry continues to strive for increased yield with the
challenge of balancing long term sustainability.
2.2.2
BOYCE AND CRDC AUSTRALIAN COTTON COMPARATIVE ANALYSIS 2019 | 14

$ / BALE
650
1,21
31,
375
1,53
81,
700
1,86
32,
025
2,18
82,
350
2,51
32,
675
2,83
83,
000
3,16
33,
325
3,48
83,
650
3,81
33,
975
4,13
84,
300
4,46
34,
625
640
1,14
01,
300
1,46
01,
620
1,78
01,
940
2,10
02,
260
2,42
02,
580
2,74
02,
900
3,06
03,
220
3,38
03,
540
3,70
03,
860
4,02
04,
180
4,34
04,
500
630
1,06
81,
225
1,38
31,
540
1,69
81,
855
2,01
32,
170
2,32
82,
485
2,64
32,
800
2,95
83,
115
3,27
33,
430
3,58
83,
745
3,90
34,
060
4,21
84,
375
620
995
1,15
01,
305
1,46
01,
615
1,77
01,
925
2,08
02,
235
2,39
02,
545
2,70
02,
855
3,01
03,
165
3,32
03,
475
3,63
03,
785
3,94
04,
095
4,25
0
610
923
1,07
51,
228
1,38
01,
533
1,68
51,
838
1,99
02,
143
2,29
52,
448
2,60
02,
753
2,90
53,
058
3,21
03,
363
3,51
53,
668
3,82
03,
973
4,12
5
600
850
1,00
01,
150
1,30
01,
450
1,60
01,
750
1,90
02,
050
2,20
02,
350
2,50
02,
650
2,80
02,
950
3,10
03,
250
3,40
03,
550
3,70
03,
850
4,00
0
590
778
925
1,07
31,
220
1,36
81,
515
1,66
31,
810
1,95
82,
105
2,25
32,
400
2,54
82,
695
2,84
32,
990
3,13
83,
285
3,43
33,
580
3,72
83,
875
580
705
850
995
1,14
01,
285
1,43
01,
575
1,72
01,
865
2,01
02,
155
2,30
02,
445
2,59
02,
735
2,88
03,
025
3,17
03,
315
3,46
03,
605
3,75
0
570
633
775
918
1,06
01,
203
1,34
51,
488
1,63
01,
773
1,91
52,
058
2,20
02,
343
2,48
52,
628
2,77
02,
913
3,05
53,
198
3,34
03,
483
3,62
5
560
560
700
840
980
1,12
01,
260
1,40
01,
540
1,68
01,
820
1,96
02,
100
2,24
02,
380
2,52
02,
660
2,80
02,
940
3,08
03,
220
3,36
03,
500
550
488
625
763
900
1,03
81,
175
1,31
31,
450
1,58
81,
725
1,86
32,
000
2,13
82,
275
2,41
32,
550
2,68
82,
825
2,96
33,
100
3,23
83,
375
540
415
550
685
820
955
1,09
01,
225
1,36
01,
495
1,63
01,
765
1,90
02,
035
2,17
02,
305
2,44
02,
575
2,71
02,
845
2,98
03,
115
3,25
0
530
343
475
608
740
873
1,00
51,
138
1,27
01,
403
1,53
51,
668
1,80
01,
933
2,06
52,
198
2,33
02,
463
2,59
52,
728
2,86
02,
993
3,12
5
520
270
400
530
660
790
920
1,05
01,
180
1,31
01,
440
1,57
01,
700
1,83
01,
960
2,09
02,
220
2,35
02,
480
2,61
02,
740
2,87
03,
000
510
198
325
453
580
708
835
963
1,09
01,
218
1,34
51,
473
1,60
01,
728
1,85
51,
983
2,11
02,
238
2,36
52,
493
2,62
02,
748
2,87
5
500
125
250
375
500
625
750
875
1,00
01,
125
1,25
01,
375
1,50
01,
625
1,75
01,
875
2,00
02,
125
2,25
02,
375
2,50
02,
625
2,75
0
490
5317
529
842
054
366
578
891
01,
033
1,15
51,
278
1,40
01,
523
1,64
51,
768
1,89
02,
013
2,13
52,
258
2,38
02,
503
2,62
5
480
(20)
100
220
340
460
580
700
820
940
1,06
01,
180
1,30
01,
420
1,54
01,
660
1,78
01,
900
2,02
02,
140
2,26
02,
380
2,50
0
470
(93)
2514
326
037
849
561
373
084
896
51,
083
1,20
01,
318
1,43
51,
553
1,67
01,
788
1,90
52,
023
2,14
02,
258
2,37
5
460
(165
)(5
0)65
180
295
410
525
640
755
870
985
1,10
01,
215
1,33
01,
445
1,56
01,
675
1,79
01,
905
2,02
02,
135
2,25
0
450
(238
)(1
25)
(13)
100
213
325
438
550
663
775
888
1,00
01,
113
1,22
51,
338
1,45
01,
563
1,67
51,
788
1,90
02,
013
2,12
5
440
(310
)(2
00)
(90)
2013
024
035
046
057
068
079
090
01,
010
1,12
01,
230
1,34
01,
450
1,56
01,
670
1,78
01,
890
2,00
0
430
(383
)(2
75)
(168
)(6
0)48
155
263
370
478
585
693
800
908
1,01
51,
123
1,23
01,
338
1,44
51,
553
1,66
01,
768
1,87
5
7.25
7.50
7.75
8.00
8.25
8.50
8.75
9.00
9.25
9.50
9.75
10.0
010
.25
10.5
010
.75
11.0
011
.25
11.5
011
.75
12.0
012
.25
12.5
0
AV
ER
AG
E Y
IELD
PE
R H
EC
TAR
E
RETURN ON ASSETS CALCULATOR 2019
FARM OPERATING PROFIT/(LOSS) PER HECTARE BASED ON ALTERNATIVE YIELDS AND PRICES – BEFORE INTEREST
Steps1. Pick your price per bale and yield/ha.2. Match them up and get your profit per hectare based on growing costs of $3,500. 3. Find your closest profit range on the bottom of the next graph.
(CO
ST
PE
R H
A U
SE
D :
$3,5
00)
BOYCE AND CRDC AUSTRALIAN COTTON COMPARATIVE ANALYSIS 2019 | 15

Steps 1. Select a value of your land, licences and machinery that are applicable to the cotton operation.2. Divide the value in 1. by the number of hectares grown in the year.3. Use your closest profit and the value per hectare to work out the return on your investment.
VALUE /HA
$35,
000
0.3%
0.9%
1.4%
1.7%
2.0%
2.3%
2.6%
2.9%
3.1%
3.4%
3.7%
4.0%
4.3%
4.9%
5.4%
5.7%
6.3%
6.9%
7.4%
8.0%
8.6%
9.1%
$34,
000
0.3%
0.9%
1.5%
1.8%
2.1%
2.4%
2.6%
2.9%
3.2%
3.5%
3.8%
4.1%
4.4%
5.0%
5.6%
5.9%
6.5%
7.1%
7.6%
8.2%
8.8%
9.4%
$33,
000
0.3%
0.9%
1.5%
1.8%
2.1%
2.4%
2.7%
3.0%
3.3%
3.6%
3.9%
4.2%
4.5%
5.2%
5.8%
6.1%
6.7%
7.3%
7.9%
8.5%
9.1%
9.7%
$32,
000
0.3%
0.9%
1.6%
1.9%
2.2%
2.5%
2.8%
3.1%
3.4%
3.8%
4.1%
4.4%
4.7%
5.3%
5.9%
6.3%
6.9%
7.5%
8.1%
8.8%
9.4%
10.0
%
$31,
000
0.3%
1.0%
1.6%
1.9%
2.3%
2.6%
2.9%
3.2%
3.5%
3.9%
4.2%
4.5%
4.8%
5.5%
6.1%
6.5%
7.1%
7.7%
8.4%
9.0%
9.7%
10.3
%
$30,
000
0.3%
1.0%
1.7%
2.0%
2.3%
2.7%
3.0%
3.3%
3.7%
4.0%
4.3%
4.7%
5.0%
5.7%
6.3%
6.7%
7.3%
8.0%
8.7%
9.3%
10.0
%10
.7%
$29,
000
0.3%
1.0%
1.7%
2.1%
2.4%
2.8%
3.1%
3.4%
3.8%
4.1%
4.5%
4.8%
5.2%
5.9%
6.6%
6.9%
7.6%
8.3%
9.0%
9.7%
10.3
%11
.0%
$28,
000
0.4%
1.1%
1.8%
2.1%
2.5%
2.9%
3.2%
3.6%
3.9%
4.3%
4.6%
5.0%
5.4%
6.1%
6.8%
7.1%
7.9%
8.6%
9.3%
10.0
%10
.7%
11.4
%
$27,
000
0.4%
1.1%
1.9%
2.2%
2.6%
3.0%
3.3%
3.7%
4.1%
4.4%
4.8%
5.2%
5.6%
6.3%
7.0%
7.4%
8.1%
8.9%
9.6%
10.4
%11
.1%
11.9
%
$26,
000
0.4%
1.2%
1.9%
2.3%
2.7%
3.1%
3.5%
3.8%
4.2%
4.6%
5.0%
5.4%
5.8%
6.5%
7.3%
7.7%
8.5%
9.2%
10.0
%10
.8%
11.5
%12
.3%
$25,
000
0.4%
1.2%
2.0%
2.4%
2.8%
3.2%
3.6%
4.0%
4.4%
4.8%
5.2%
5.6%
6.0%
6.8%
7.6%
8.0%
8.8%
9.6%
10.4
%11
.2%
12.0
%12
.8%
$24,
000
0.4%
1.3%
2.1%
2.5%
2.9%
3.3%
3.8%
4.2%
4.6%
5.0%
5.4%
5.8%
6.3%
7.1%
7.9%
8.3%
9.2%
10.0
%10
.8%
11.7
%12
.5%
13.3
%
$23,
000
0.4%
1.3%
2.2%
2.6%
3.0%
3.5%
3.9%
4.3%
4.8%
5.2%
5.7%
6.1%
6.5%
7.4%
8.3%
8.7%
9.6%
10.4
%11
.3%
12.2
%13
.0%
13.9
%
$22,
000
0.5%
1.4%
2.3%
2.7%
3.2%
3.6%
4.1%
4.5%
5.0%
5.5%
5.9%
6.4%
6.8%
7.7%
8.6%
9.1%
10.0
%10
.9%
11.8
%12
.7%
13.6
%14
.5%
$21,
000
0.5%
1.4%
2.4%
2.9%
3.3%
3.8%
4.3%
4.8%
5.2%
5.7%
6.2%
6.7%
7.1%
8.1%
9.0%
9.5%
10.5
%11
.4%
12.4
%13
.3%
14.3
%15
.2%
$20,
000
0.5%
1.5%
2.5%
3.0%
3.5%
4.0%
4.5%
5.0%
5.5%
6.0%
6.5%
7.0%
7.5%
8.5%
9.5%
10.0
%11
.0%
12.0
%13
.0%
14.0
%15
.0%
16.0
%
$19,
000
0.5%
1.6%
2.6%
3.2%
3.7%
4.2%
4.7%
5.3%
5.8%
6.3%
6.8%
7.4%
7.9%
8.9%
10.0
%10
.5%
11.6
%12
.6%
13.7
%14
.7%
15.8
%16
.8%
$18,
000
0.6%
1.7%
2.8%
3.3%
3.9%
4.4%
5.0%
5.6%
6.1%
6.7%
7.2%
7.8%
8.3%
9.4%
10.6
%11
.1%
12.2
%13
.3%
14.4
%15
.6%
16.7
%17
.8%
$17,
000
0.6%
1.8%
2.9%
3.5%
4.1%
4.7%
5.3%
5.9%
6.5%
7.1%
7.6%
8.2%
8.8%
10.0
%11
.2%
11.8
%12
.9%
14.1
%15
.3%
16.5
%17
.6%
18.8
%
$16,
000
0.6%
1.9%
3.1%
3.8%
4.4%
5.0%
5.6%
6.3%
6.9%
7.5%
8.1%
8.8%
9.4%
10.6
%11
.9%
12.5
%13
.8%
15.0
%16
.3%
17.5
%18
.8%
20.0
%
$15,
000
0.7%
2.0%
3.3%
4.0%
4.7%
5.3%
6.0%
6.7%
7.3%
8.0%
8.7%
9.3%
10.0
%11
.3%
12.7
%13
.3%
14.7
%16
.0%
17.3
%18
.7%
20.0
%21
.3%
100
300
500
600
700
800
900
1,00
01,
100
1,20
01,
300
1,40
01,
500
1,70
01,
900
2,00
02,
200
2,40
02,
600
2,80
03,
000
3,20
0
PR
OF
IT P
ER
HE
CTA
RE
FR
OM
PR
EV
IOU
S W
OR
KS
HE
ET
RETURN ON ASSETS CALCULATOR 2019
RETURN ON ASSETS BASED ON VARIOUS PROFITS AND LAND VALUATIONS
BOYCE AND CRDC AUSTRALIAN COTTON COMPARATIVE ANALYSIS 2019 | 16

CONCLUSION
2019 has been a year where the lack of water availability and reduced yields has meant that the result
declined significantly on the back of very profitable years in 2015 through to 2018.
With five good years back to back, growers would have the choice of debt reduction, farm improvements
or new acquisitions. However, for some, a poor 2019 result may put pressure on cash flow as this
extended dry period will result in even less production in 2020 and the need for funds to capitalise once the
drought breaks.
For some, tax will also be an issue – particularly going into a dry period with fewer inputs to offset the
income from the 2019 crop received in the 2020 financial year.
The outlook for the 2020 season is a crop that is well down on 2019 due to the on-going dry conditions
and lack of water. The predicted crop, for 2020, of 604,500 bales is less than a third of what Australia
produced in 2019 and just 13% of the 4.65m bales produced in 2018.
The lack of water and water variability has been an issue for the more established valleys since 2000. While
much effort continues to be invested in trying to argue the impacts of climate change, our view remains that
growers should spend their efforts on ensuring they can survive and profit during extreme weather events.
If this is achieved, profit will be maximised regardless of the outcome of the climate change debate. Water
availability and water security continue to drive the industry in the southern valleys. Interestingly, in some
situations, water security and reliability in the south has seen land use progress from grazing directly to
permanent plantings.
Saving labour continues to be a strong focus in the industry. Farmers developing for the first time and
others who are looking to re-laser are considering a bankless channel farm layout. While the upfront cost is
relatively easy to ascertain, the financial impacts (costs, impact on yield etc.) are more difficult to consider.
The industry continues to learn and adapt, and this process is, in our view, being assisted by the practices
in the emerging cotton-growing areas.
The agricultural sector in general and the cotton industry, in particular, are known for their early adoption of
technology. The technology available today, whether it is genetic, machinery-based or relating to systems
and process, is leading to increased yield and reduced labour. The question is, at what cost? If the
maximisation of profit is the goal, we think growers should establish the impact of technology on profitability
before it is adopted.
There is a divergence in the industry between the newer cotton-growing areas and the more established
valleys. It’s exciting to see the different regions learning from each other. The newer valleys are developing
land for the first time. In contrast, a lot of growers in the older valleys are looking to redevelop their farms
with better layouts and irrigation methods.
In our view, it is healthy for the industry to have these different stages in different cotton-growing areas. It
will be interesting to prepare and review the 2020 results. However, we expect that the profit per hectare of
irrigated cotton will again be down due to a) the lack of water and b) overheads covering fewer hectares.
This is what happened in the millennium drought.
In other industry publications we have discussed Terms of Trade, its impact on the industry and the
importance of growers understanding it.
Terms of Trade refers to the relationship between the price of outputs and the price of inputs for an Industry.
With the price of inputs continuing to rise and the price of outputs fluctuating but remaining flat, Terms of
Trade for the Industry continues to slide.
2.3
BOYCE AND CRDC AUSTRALIAN COTTON COMPARATIVE ANALYSIS 2019 | 17

If you take the price of Inputs out of the equation (for the purpose of this exercise accepting this as a given
and out of a growers control) then what is left in the decision making process is a) more yield, b) reducing
volume of inputs, and c) reducing the number of times those inputs are applied. With continuing adoption
of technology and farms becoming more ‘connected’ with the communication technology, we think growers
are better placed than ever before to reduce the volume of inputs and the number of times the inputs are
applied. One specific example of this would be variable rate application technology.
This continues the theme of growers taking time out to consider more than the day to day operations,
thinking about where the industry is heading and implementing changes to their business accordingly.
The 2019 Australian Cotton Comparative Analysis maintains our goal to measure and analyse the
components that provide farmers with a stronger financial bottom line.
Hamish Cullenward
Director | Boyce Chartered Accountants
Wagga Wagga NSW
BOYCE AND CRDC AUSTRALIAN COTTON COMPARATIVE ANALYSIS 2019 | 18

ComparativeStatistics
3

SUMMARY
COMPARISON OF AVERAGE INCOME AND EXPENSE ITEMS FOR THE 2019 YEAR
3.1
3.1.1
ALL FARMS
TOP 20%
BOTTOM 20%
LOW COST
GROWERS ( > 2,000 HA )
DIFFERENCE AVG v TOP 20%
INCOME
Cotton proceeds - Lint 5,897 6,936 5,412 6,748 5,735 1,039
Cotton proceeds - Seed 1,151 1,468 1,201 1,475 1,117 317
Ginning (639) (748) (493) (727) (610) (109)
Levies (40) (49) (32) (47) (38) (9)
Cotton proceeds - Hail claims 0 0 0 0 0 0
6,369 7,607 6,088 7,449 6,204 1,238
EXPENSES
Cartage 86 79 114 84 96 (7)
Chemical application 149 136 172 128 147 (13)
Chemicals - Defoliants 62 105 42 101 53 43
Chemicals - Herbicides 131 108 98 116 116 (23)
Chemicals - Insecticides 108 95 68 98 114 (13)
Chemicals - Others 12 3 16 3 13 (9)
Chipping 2 3 0 3 3 1
Consultants 61 89 57 86 37 28
Contract picking 182 155 212 124 231 (27)
Contract farming and ripping 167 32 69 27 210 (135)
Cotton picking wrap and sundries 104 148 136 137 100 44
Depreciation 397 321 465 301 353 (76)
Electricity 80 107 157 110 50 27
Fertiliser 664 566 667 576 685 (98)
Fuel and oil 475 298 501 268 528 (177)
Hire of plant 60 4 77 4 85 (56)
Insurance 81 56 62 50 62 (25)
Licence fee - Bollgard 311 330 321 324 313 19
Licence fee - Roundup ready 76 75 78 71 76 (1)
Motor vehicle expenses 33 55 26 50 27 22
R & M - Farming plant 434 230 616 207 403 (204)
R & M - Pumps and earthworks 190 273 185 287 82 83
Seed 129 107 125 113 131 (22)
Water charges and purchases 1,275 191 2,646 226 1,569 (1,084)
Wages - Employees 515 289 597 272 526 (226)
Wages - Proprietors 56 102 87 77 11 46
Administration 76 50 58 56 50 (26)
Other farm overheads 352 101 111 83 488 (251)
6,268 4,108 7,763 3,982 6,559 (2,160)
OPERATING PROFIT/(LOSS) 101 3,499 (1,675) 3,467 (355) 3,398
ADD:
Wages - Proprietors 56 102 87 77 11 46
FARM OPERATING PROFIT/(LOSS) 157 3,601 (1,588) 3,544 (344) 3,444
BOYCE AND CRDC AUSTRALIAN COTTON COMPARATIVE ANALYSIS 2019 | 20

ALL FARMS
TOP 20%
BOTTOM 20%
LOW COST
GROWERS(>2,000 HA)
DIFFERENCE AVG v TOP 20%
DEDUCT:
Interest and bank charges 313 86 420 112 285 (227)
Interest - Crop terms 0 0 0 0 0 0
313 86 420 112 285 (227)
FARM NET PROFIT/(LOSS) (156) 3,515 (2,008) (3,432) (629) 3,671
CROP RESULTS
Hectares of cotton grown 618 311 709.24 295.40 1,781.06 (306)
Total yield 6,600 3,969 6,860.51 3,664.32 18,287.62 (2,632)
Yield per hectare 10.69 12.74 9.67 12.40 10.27 2
Value per bale 596 597 629.44 600.45 604.16 1
Cost of production per bale 587 322 802.64 320.95 639.00 (264)
Operating profit/(loss) per bale 9 275 (173.20) 279.50 (34.84) 265
Number of bales per hectare required to cover operating expenses 11 7 12.33 6.63 10.86 (4)
Number of bales per hectare required to cover total expenses 11 7 13.00 6.82 11.33 (4)
COMPARISON OF AVERAGE INCOME AND EXPENSE ITEMS FOR THE 2019 YEAR (continued)
3.1.1
BOYCE AND CRDC AUSTRALIAN COTTON COMPARATIVE ANALYSIS 2019 | 21

YIELD AND TRENDLINE3.2.1.2
AVERAGE FARMERS RESULTS PER HECTARE
GRAPHS
3.2
3.2.1
COMPARISON OF AVERAGE INCOME AND EXPENSE ITEMS3.2.1.1
0
500
1000
1500
2000
2500
3000
3500
4000
4500
5000
5500
6000
6500
7000
1997 1998 1999 2000 2001 2002 2003 2004 2005 2006 2007 2008 2009 2010 2011 20172012 2013 2014 2015 2016
$ P
ER
HE
CT
AR
E
YEAR
INCOME
OPERATING EXPENSES
LINEAR (OPERATING EXPENSES)
LINEAR (OPERATING PROFIT BEFORE INTEREST)
OPERATING PROFIT (BEFORE INTEREST)
2018 2019
0
1
2
3
4
5
6
7
8
9
10
11
12
13
14
1999 2015 2016 2017
AVERAGE YIELD
TRENDLINE
2018 2019
YIE
LD P
ER
HE
CT
AR
E
1997 1998 2000 2001 2002 2003 2004 2005 2006 2007 2008 2009 2010 2011 2012 2013 2014
YEAR
BOYCE AND CRDC AUSTRALIAN COTTON COMPARATIVE ANALYSIS 2019 | 22

VALUE PER BALE AND TRENDLINE3.2.1.3
0
100
200
300
400
500
600
700
1997 1998 1999 2000 2001 2002 2003 2004 2005 2006 2007 2008 2009 2010 2011 2012 2013 2015 2016 2017 2018 20192014
VA
LUE
PE
R B
ALE
AVERAGE VALUE PER BALE
TRENDLINE
YEAR
BOYCE AND CRDC AUSTRALIAN COTTON COMPARATIVE ANALYSIS 2019 | 23
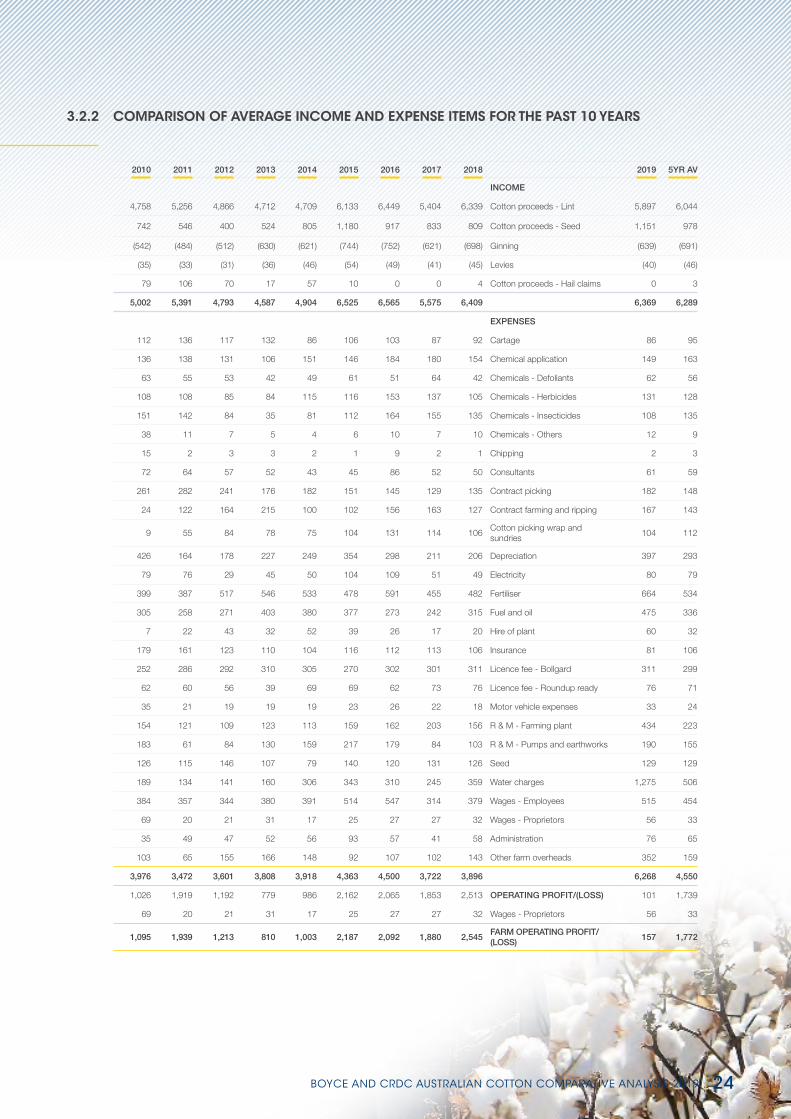
2010 2011 2012 2013 2014 2015 2016 2017 2018 2019 5YR AV
INCOME
4,758 5,256 4,866 4,712 4,709 6,133 6,449 5,404 6,339 Cotton proceeds - Lint 5,897 6,044
742 546 400 524 805 1,180 917 833 809 Cotton proceeds - Seed 1,151 978
(542) (484) (512) (630) (621) (744) (752) (621) (698) Ginning (639) (691)
(35) (33) (31) (36) (46) (54) (49) (41) (45) Levies (40) (46)
79 106 70 17 57 10 0 0 4 Cotton proceeds - Hail claims 0 3
5,002 5,391 4,793 4,587 4,904 6,525 6,565 5,575 6,409 6,369 6,289
EXPENSES
112 136 117 132 86 106 103 87 92 Cartage 86 95
136 138 131 106 151 146 184 180 154 Chemical application 149 163
63 55 53 42 49 61 51 64 42 Chemicals - Defoliants 62 56
108 108 85 84 115 116 153 137 105 Chemicals - Herbicides 131 128
151 142 84 35 81 112 164 155 135 Chemicals - Insecticides 108 135
38 11 7 5 4 6 10 7 10 Chemicals - Others 12 9
15 2 3 3 2 1 9 2 1 Chipping 2 3
72 64 57 52 43 45 86 52 50 Consultants 61 59
261 282 241 176 182 151 145 129 135 Contract picking 182 148
24 122 164 215 100 102 156 163 127 Contract farming and ripping 167 143
9 55 84 78 75 104 131 114 106 Cotton picking wrap and sundries
104 112
426 164 178 227 249 354 298 211 206 Depreciation 397 293
79 76 29 45 50 104 109 51 49 Electricity 80 79
399 387 517 546 533 478 591 455 482 Fertiliser 664 534
305 258 271 403 380 377 273 242 315 Fuel and oil 475 336
7 22 43 32 52 39 26 17 20 Hire of plant 60 32
179 161 123 110 104 116 112 113 106 Insurance 81 106
252 286 292 310 305 270 302 301 311 Licence fee - Bollgard 311 299
62 60 56 39 69 69 62 73 76 Licence fee - Roundup ready 76 71
35 21 19 19 19 23 26 22 18 Motor vehicle expenses 33 24
154 121 109 123 113 159 162 203 156 R & M - Farming plant 434 223
183 61 84 130 159 217 179 84 103 R & M - Pumps and earthworks 190 155
126 115 146 107 79 140 120 131 126 Seed 129 129
189 134 141 160 306 343 310 245 359 Water charges 1,275 506
384 357 344 380 391 514 547 314 379 Wages - Employees 515 454
69 20 21 31 17 25 27 27 32 Wages - Proprietors 56 33
35 49 47 52 56 93 57 41 58 Administration 76 65
103 65 155 166 148 92 107 102 143 Other farm overheads 352 159
3,976 3,472 3,601 3,808 3,918 4,363 4,500 3,722 3,896 6,268 4,550
1,026 1,919 1,192 779 986 2,162 2,065 1,853 2,513 OPERATING PROFIT/(LOSS) 101 1,739
69 20 21 31 17 25 27 27 32 Wages - Proprietors 56 33
1,095 1,939 1,213 810 1,003 2,187 2,092 1,880 2,545 FARM OPERATING PROFIT/(LOSS)
157 1,772
COMPARISON OF AVERAGE INCOME AND EXPENSE ITEMS FOR THE PAST 10 YEARS3.2.2
BOYCE AND CRDC AUSTRALIAN COTTON COMPARATIVE ANALYSIS 2019 | 24

2010 2011 2012 2013 2014 2015 2016 2017 2018 2019 5YR AV
DEDUCT:
1,009 380 409 389 292 288 385 322 311 Interest and bank charges 313 324
0 0 0 11 0 0 1 1 0 Interest - Crop terms 0 0
1,009 380 409 400 292 288 386 323 311 313 324
86 1,559 804 410 711 1,899 1,706 1,557 2,234 FARM NET PROFIT/(LOSS) (156) 1,448
CROP RESULTS
621.17 1,426.48 1,675.67 1,517.64 1,593.12 926.11 878.11 1,206.53 1,140.69 Hectares of cotton grown 617.64 953.82
6,363.40 14,325.75 16,272.11 16,223.03 16,320.98 11,660.33 11,368.18 12,773.17 13,484.45 Total yield (bales) 6,600.48 11,177.32
10.24 10.04 9.71 10.69 10.24 12.59 12.95 10.59 11.82 Yield per hectare (bales) 10.69 11.73
480.56 526.23 486.42 427.44 473.05 517.48 507.15 526.66 541.77 Value per bale 596.01 537.81
388.37 345.82 370.77 356.27 382.31 346.53 347.51 351.48 329.73 Cost of production per bale 586.58 392.37
99.94 190.92 122.89 72.75 96.31 171.72 159.68 175.23 212.36 Operating profit per bale 9.43 145.68
8.28 6.60 7.40 8.91 8.28 8.43 8.87 7.07 7.19 Number of bales per hectare required to cover operating expenses
10.52 8.42
10.38 7.32 8.24 9.85 8.90 8.99 9.63 7.68 7.77 Number of bales per hectare required to cover total expenses
11.04 9.02
COMPARISON OF AVERAGE INCOME AND EXPENSE ITEMS FOR THE PAST 10 YEARS (continued)
3.2.2
BOYCE AND CRDC AUSTRALIAN COTTON COMPARATIVE ANALYSIS 2019 | 25
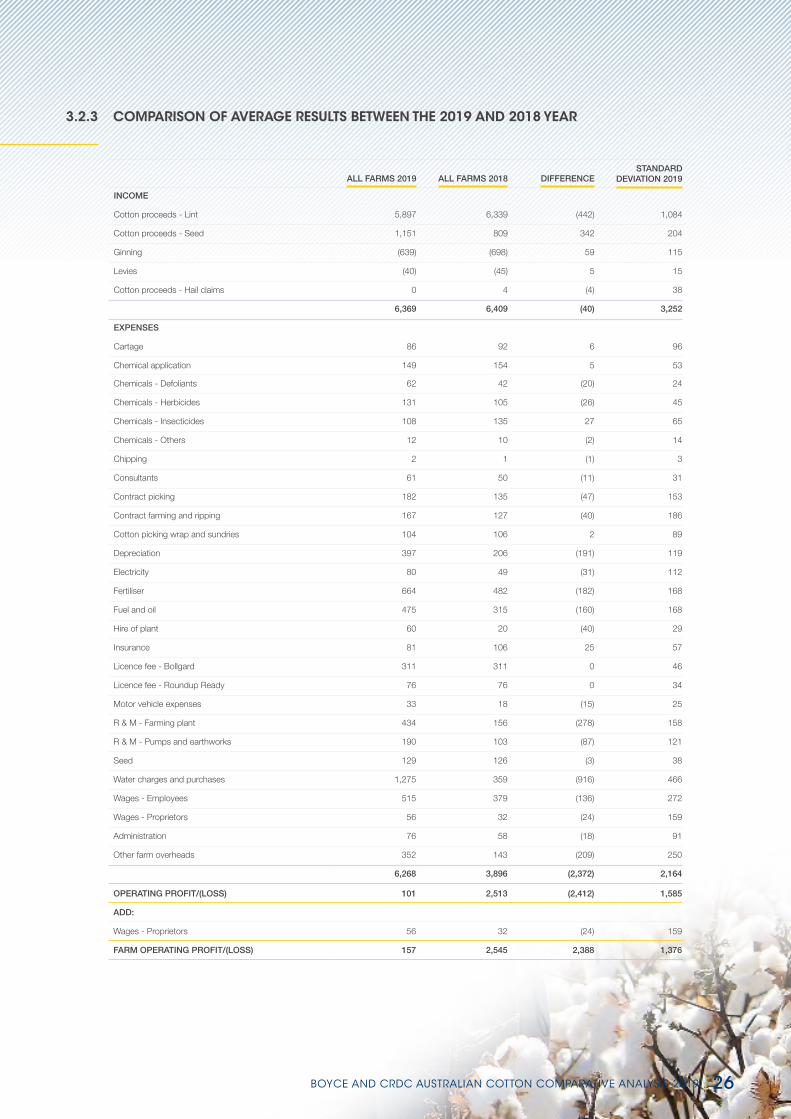
ALL FARMS 2019 ALL FARMS 2018 DIFFERENCESTANDARD
DEVIATION 2019
INCOME
Cotton proceeds - Lint 5,897 6,339 (442) 1,084
Cotton proceeds - Seed 1,151 809 342 204
Ginning (639) (698) 59 115
Levies (40) (45) 5 15
Cotton proceeds - Hail claims 0 4 (4) 38
6,369 6,409 (40) 3,252
EXPENSES
Cartage 86 92 6 96
Chemical application 149 154 5 53
Chemicals - Defoliants 62 42 (20) 24
Chemicals - Herbicides 131 105 (26) 45
Chemicals - Insecticides 108 135 27 65
Chemicals - Others 12 10 (2) 14
Chipping 2 1 (1) 3
Consultants 61 50 (11) 31
Contract picking 182 135 (47) 153
Contract farming and ripping 167 127 (40) 186
Cotton picking wrap and sundries 104 106 2 89
Depreciation 397 206 (191) 119
Electricity 80 49 (31) 112
Fertiliser 664 482 (182) 168
Fuel and oil 475 315 (160) 168
Hire of plant 60 20 (40) 29
Insurance 81 106 25 57
Licence fee - Bollgard 311 311 0 46
Licence fee - Roundup Ready 76 76 0 34
Motor vehicle expenses 33 18 (15) 25
R & M - Farming plant 434 156 (278) 158
R & M - Pumps and earthworks 190 103 (87) 121
Seed 129 126 (3) 38
Water charges and purchases 1,275 359 (916) 466
Wages - Employees 515 379 (136) 272
Wages - Proprietors 56 32 (24) 159
Administration 76 58 (18) 91
Other farm overheads 352 143 (209) 250
6,268 3,896 (2,372) 2,164
OPERATING PROFIT/(LOSS) 101 2,513 (2,412) 1,585
ADD:
Wages - Proprietors 56 32 (24) 159
FARM OPERATING PROFIT/(LOSS) 157 2,545 2,388 1,376
COMPARISON OF AVERAGE RESULTS BETWEEN THE 2019 AND 2018 YEAR3.2.3
BOYCE AND CRDC AUSTRALIAN COTTON COMPARATIVE ANALYSIS 2019 | 26

ALL FARMS 2019 ALL FARMS 2018 DIFFERENCESTANDARD
DEVIATION 2019
DEDUCT:
Interest and bank charges 313 311 (2) 432
Interest - Crop terms 0 0 0 0
313 311 (2) 408
FARM NET PROFIT/(LOSS) (156) 2,234 (2,390) 1,561
CROP RESULTS
Hectares of cotton grown 617.64 1,140.69 (523.05) 1,153.05
Total yield (bales) 6,600.48 13,484.45 (6,883.97) 13,554.86
Yield per hectare (bales) 10.69 11.82 (1.13) 1.73
Value per bale 596.01 541.77 54.24 36.37
Cost of production per bale 586.58 329.73 (256.85) 98.47
Operating profit per bale 9.43 212.36 (202.93) 104.79
Number of bales per hectare required to cover operating expenses
10.52 7.19 (3.32) 1.69
Number of bales per hectare required to cover total expenses
11.04 7.77 (3.27) 2.05
COMPARISON OF AVERAGE RESULTS BETWEEN THE 2019 AND 2018 YEAR (continued)
3.2.3
BOYCE AND CRDC AUSTRALIAN COTTON COMPARATIVE ANALYSIS 2019 | 27

ALL VALLEYS AVE FIGURES
GWYDIR AVE FIGURES
McINTYRE/BARWON
AVE FIGURESMACQUARIE
AVE FIGURESNAMOI
AVE FIGURESMURRUMBIDGEE
AVE FIGURES
INCOME
Cotton proceeds - Lint 5,897 7,016 6,417 6,288 5,394 5,528
Cotton proceeds - Seed 1,151 1,303 1,161 1,218 994 1,133
Ginning (639) (769) (753) (662) (576) (584)
Levies (40) (48) (51) (41) (38) (35)
Cotton proceeds - Hail claims 0 0 0 0 0 0
6,369 7,502 6,774 6,803 5,774 6,042
EXPENSES
Cartage 86 124 28 60 32 118
Chemical application 149 176 110 114 158 170
Chemicals - Defoliants 62 50 91 65 43 54
Chemicals - Herbicides 131 185 167 175 97 102
Chemicals - Insecticides 108 162 149 136 83 82
Chemicals - Other 12 6 18 6 2 16
Chipping 2 5 8 0 0 0
Consultants 61 72 111 40 57 47
Contract picking 182 133 169 34 71 273
Contract farming and ripping 167 141 10 52 60 304
Cotton picking wrap and sundries 104 133 50 145 126 101
Depreciation 397 356 540 425 664 268
Electricity 80 216 26 23 306 60
Fertiliser 664 462 766 556 470 729
Fuel and oil 475 488 408 309 437 574
Hire of plant 60 11 2 10 54 110
Insurance 81 87 122 75 66 66
Licence fee - Bollgard 311 278 310 306 294 319
Licence fee - Roundup ready 76 61 77 76 76 77
Motor vehicle expenses 33 67 58 38 52 15
R & M - Farming plant 434 192 310 709 1,162 252
R & M - Pumps and earthworks 190 548 334 88 308 101
Seed 129 117 152 98 123 133
Water charges and purchases 1,275 398 94 1,320 837 1,955
Wages - Employees 515 369 577 720 923 355
Wages - Proprietors 56 265 45 19 74 39
Administration 76 105 147 68 74 45
Other farm overheads 352 394 109 160 169 566
6,268 5,601 4,988 5,827 6,818 6,931
OPERATING PROFIT/(LOSS) 101 1,901 1,786 976 (1,044) (889)
ADD:
Wages - Proprietors 56 265 45 19 74 39
FARM OPERATING PROFIT/(LOSS) 157 2,166 1,831 995 (970) (850)
COMPARISON OF THE AVERAGES OF THE DIFFERENT VALLEYS3.2.4
BOYCE AND CRDC AUSTRALIAN COTTON COMPARATIVE ANALYSIS 2019 | 28

ALL VALLEYS AVE FIGURES
GWYDIR AVE FIGURES
McINTYRE/ BARWON
AVE FIGURESMACQUARIE
AVE FIGURESNAMOI
AVE FIGURESMURRUMBIDGEE
AVE FIGURES
DEDUCT:
Interest and bank charges 313 518 645 15 245 277
Interest - Crop terms 0 0 0 0 0 0
3113 518 645 15 245 277
FARM NET PROFIT/(LOSS) (156) 1,648 1,186 980 (1,215) (1,127)
CROP RESULTS
Hectares of cotton grown 617.64 309.00 918.33 673.85 310.40 897.10
Total yield 6600.48 3901.62 10626.86 7689.63 3112.51 8976.43
Yield per hectare 10.69 12.63 11.57 11.41 10.03 10.01
Value per bale 596.01 594.15 585.40 596.13 575.90 604.65
Cost of production per bale 586.58 443.69 431.05 510.43 679.90 692.92
Operating profit/(loss) per bale 9.43 150.46 154.35 85.71 (104.00) (89.08)
Number of bales per hectare required to cover operating expenses
10.52 9.43 8.52 9.77 11.84 11.47
Number of bales per hectare required to cover total expenses
11.04 10.30 9.62 9.80 12.26 11.92
COMPARISON OF THE AVERAGES OF THE DIFFERENT VALLEYS (continued)
3.2.4
BOYCE AND CRDC AUSTRALIAN COTTON COMPARATIVE ANALYSIS 2019 | 29

TOP 20% FARMERS RESULTS PER HECTARE
GRAPH
3.3
3.3.1
COMPARISON OF AVERAGE INCOME AND EXPENSE ITEMS3.3.1.1
0
500
1000
1500
2000
2500
3000
3500
4000
4500
5000
5500
6000
7000
7500
8000
6500
1997 1998 1999 2000 2001 2002 2003 2004 2005 2006 2007 2008 2009 2010 2011 2012 2014 2015 2016 2017 2018 20192013
INCOME
OPERATING EXPENSES
OPERATING PROFIT (BEFORE INTEREST)
Linear (INCOME)
Linear (OPERATING EXPENSES)
Linear (OPERATING PROFIT (BEFORE INTEREST))
$ P
ER
HE
CT
AR
E
YEAR
BOYCE AND CRDC AUSTRALIAN COTTON COMPARATIVE ANALYSIS 2019 | 30

2010 2011 2012 2013 2014 2015 2016 2017 2018 2019 5YR AV
INCOME
5,067 5,659 5,509 5,502 5,270 7,071 6,743 5,988 7,334 Cotton proceeds - Lint 6,936 6,814
753 584 484 629 1,046 1,467 1,174 933 782 Cotton proceeds - Seed 1,468 1,165
(581) (560) (478) (740) (677) (789) (773) (638) (742) Ginning (748) (738)
(37) (36) (40) (49) (41) (54) (50) (45) (48) Levies (49) (49)
0 404 112 33 9 0 0 0 0 Cotton proceeds - Hail claims 0 0
5,202 6,051 5,587 5,375 5,607 7,695 7,094 6,238 7,326 7,607 7,192
EXPENSES
123 148 114 166 113 74 96 115 127 Cartage 79 98
152 149 125 96 142 148 184 215 181 Chemical application 136 173
45 50 54 51 57 58 69 71 48 Chemicals - Defoliants 105 70
108 112 61 66 152 140 112 156 123 Chemicals - Herbicides 108 128
175 146 89 58 126 174 117 241 185 Chemicals - Insecticides 95 162
61 12 10 8 4 10 25 9 9 Chemicals - Others 3 11
14 0 6 4 2 1 3 7 5 Chipping 3 4
81 60 71 51 61 70 63 81 77 Consultants 89 76
192 253 292 237 153 144 270 78 148 Contract picking 155 159
17 97 114 208 154 152 106 190 103 Contract farming and ripping 32 117
8 51 64 98 90 98 159 137 124 Cotton picking wrap and sundries
148 133
423 112 183 158 226 411 145 164 113 Depreciation 321 231
124 115 20 93 13 31 166 42 29 Electricity 107 75
299 353 544 453 580 485 609 432 511 Fertiliser 566 521
298 213 233 244 418 349 141 189 238 Fuel and oil 298 243
0 35 6 16 42 1 6 5 2 Hire of plant 4 4
204 174 125 94 90 159 107 141 153 Insurance 56 123
221 298 287 305 300 192 305 301 308 Licence fee - Bollgard 330 287
60 43 51 42 69 63 74 73 76 Licence fee - Roundup ready 75 72
36 17 25 14 12 14 25 15 10 Motor vehicle expenses 55 24
145 87 66 103 118 146 115 184 59 R & M - Farming plant 230 147
221 54 122 119 174 334 95 33 24 R & M - Pumps and earth-works
273 152
108 102 136 103 87 154 123 121 119 Seed 107 125
30 61 126 150 238 184 90 147 204 Water charges 191 163
428 274 300 269 277 338 628 193 272 Wages - Employees 289 344
76 20 27 27 8 12 25 11 8 Wages - Proprietors 102 32
24 50 39 70 29 33 27 29 44 Administration 50 37
118 51 234 68 31 87 38 67 78 Other farm overheads 101 74
3,791 3,137 3,524 3,371 3,766 4,062 3,923 3,447 3,378 4,108 3,784
1,411 2,914 2,063 2,004 1,841 3,633 3,171 2,791 3,948 OPERATING PROFIT/(LOSS) 3,499 3,408
ADD:
76 20 27 27 8 12 25 11 8 Wages - Proprietors 102 32
1,487 2,934 2,090 2,031 1,849 3,645 3,196 2,802 3,956 FARM OPERATING PROFIT/(LOSS)
3,601 3,440
COMPARISON OF AVERAGE INCOME AND EXPENSE ITEMS FOR THE PAST 10 YEARS3.3.2
BOYCE AND CRDC AUSTRALIAN COTTON COMPARATIVE ANALYSIS 2019 | 31

2010 2011 2012 2013 2014 2015 2016 2017 2018 2019 5YR AV
DEDUCT:
797 185 353 496 306 257 37 210 135 Interest and bank charges 86 145
0 0 0 0 0 0 0 0 0 Interest - Crop terms 0 0
797 185 353 496 306 257 37 210 135 86 145
690 2,749 1,737 1,535 1,543 3,388 3,159 2,592 3,821 FARM NET PROFIT/(LOSS) 3,515 3,295
CROP RESULTS
789.00 1,124.75 1,186.93 833.94 2,365.17 997.79 838.00 1,211.00 1,076.93 Hectares of cotton grown 311.40 887
8,480.00 12,506.75 13,596.12 9,999.47 27,308.14 14,283.13 11,473.66 13,749.49 14,351.33 Total yield (bales) 3,968.52 11,565
10.75 11.12 11.45 11.99 11.55 14.31 13.69 11.35 13.33 Yield per hectare (bales) 12.74 13
484.00 507.94 477.90 445.47 484.87 537.62 518.14 549.34 549.73 Value per bale 596.88 550
352.51 282.04 307.69 281.13 326.34 283.59 286.43 303.47 253.50 Cost of production per bale 322.20 290
131.48 262.27 180.02 167.08 159.32 254.03 231.70 245.87 296.23 Operating profit per bale 274.68 261
7.83 6.17 7.37 7.57 7.77 7.55 7.57 6.27 6.15 No. of bales per hectare required to cover operating expenses
6.88 7
9.47 6.54 8.12 8.68 8.40 8.03 7.64 6.65 6.39 No. of bales per hectare re-quired to cover total expenses
7.02 7
COMPARISON OF AVERAGE INCOME AND EXPENSE ITEMS FOR THE PAST 10 YEARS (continued)
3.3.2
BOYCE AND CRDC AUSTRALIAN COTTON COMPARATIVE ANALYSIS 2019 | 32

TOP 20% FARMERS VERSUS AVERAGE FARMERS RESULTS PER HECTARE
GRAPHS
3.4
3.4.1
COMPARISON OF YIELD3.4.1.1
0
1
2
3
4
5
6
7
8
9
10
11
12
13
14
15
1997 1998 1999 2000 2001 2002 2003 2004 2005 2006 2007 2008 2009 2010 2011 2012 2013 2014 2015 2016 2017 2018 2019
AVERAGE YIELD
TOP 20% YIELD
LINEAR (AVERAGE YIELD)
LINEAR (TOP 20% YIELD)
YIE
LD P
ER
HE
CT
AR
E
YEAR
BOYCE AND CRDC AUSTRALIAN COTTON COMPARATIVE ANALYSIS 2019 | 33

COMPARISON OF VALUE PER BALE3.4.1.2
COMPARISON OF OPERATING PROFIT3.4.1.3
1997 1998 1999 2000 2001 2002 2003 2004 2005 2006 2007 2008 2009 2010 2011 2012 2014 201520130
100
200
300
400
500
600
700
2016 2017 2018 2019
AVERAGE VALUE PER BALE
TOP 20% VALUE PER BALE
LINEAR (AVERAGE VALUE PER BALE)
LINEAR (TOP 20% VALUE PER BALE)
VA
LUE
PE
R B
ALE
YEAR
0
500
1000
1500
2000
2500
3000
3500
4000
1997 1998 1999 2000 2001 2002 2003 2004 2005 2006 2007 2008 2009 2010 2011 2012 2014 2015 2016 2017 2018 20192013
OP
ER
AT
ING
PR
OF
IT
AVERAGE OPERATING PROFIT
TOP 20% OPERATING PROFIT
LINEAR (AVERAGE OPERATING PROFIT)
LINEAR (TOP 20% OPERATING PROFIT)
YEAR
BOYCE AND CRDC AUSTRALIAN COTTON COMPARATIVE ANALYSIS 2019 | 34

COMPARISON OF NET FARM PROFIT/(LOSS)3.4.1.4
-1500
-1000
-500
0
500
1000
1500
2000
2500
3500
3000
4000
-20001997 1998 1999 2000 2001 2002 2003 2004 2005 2006 2007 2008 2009 2010 2011 2012 2013 2014 2015 2016 2017 2018 2019
NE
T F
AR
M P
RO
FIT
/ (L
OS
S)
AVERAGE OPERATING PROFIT
TOP 20% OPERATING PROFIT
Linear (AVERAGE OPERATING PROFIT)
Linear (TOP 20% OPERATING PROFIT)
YEAR
BOYCE AND CRDC AUSTRALIAN COTTON COMPARATIVE ANALYSIS 2019 | 35

ALL FARMS AVERAGE
TOP 20% AVERAGE DIFFERENCE
INCOME
Cotton proceeds - Lint 6,044 6,814 770
Cotton proceeds - Seed 978 1,165 187
Ginning (691) (738) (47)
Levies (46) (49) (3)
Cotton proceeds - Hail claims 3 0 (3)
6,289 7,192 903
EXPENSES
Cartage 95 98 (3)
Chemical application 163 173 (10)
Chemicals - Defoliants 56 70 (14)
Chemicals - Herbicides 128 128 1
Chemicals - Insecticides 135 162 (28)
Chemicals - Others 9 11 (2)
Chipping 3 4 (1)
Consultants 59 76 (17)
Contract picking 148 159 (11)
Contract farming and ripping 143 117 26
Cotton picking wrap and sundries 112 133 (21)
Depreciation 293 231 62
Electricity 79 75 4
Fertiliser 534 521 13
Fuel and oil 336 243 93
Hire of plant 32 4 29
Insurance 106 123 (18)
Licence fee - Bollgard 299 287 12
Licence fee - Roundup ready 71 72 (1)
Motor vehicle expenses 24 24 1
R & M - Farming plant 223 147 76
R & M - Pumps and earthworks 155 152 3
Seed 129 125 4
Water charges 506 163 343
Wages - Employees 454 344 110
Wages - Proprietors 33 32 2
Administration 65 37 28
Other farm overheads 159 74 85
4,550 3,784 766
OPERATING PROFIT/(LOSS) 1,739 3,408 1,670
ADD:
Wages - Proprietors 33 32 (2)
FARM OPERATING PROFIT/(LOSS) 1,772 3,440 1,668
COMPARISON OF TOP 20% FARMERS AND AVERAGE FARMERS FOR THE PAST FIVE YEARS (2015, 2016, 2017,2018, 2019)
3.4.2
BOYCE AND CRDC AUSTRALIAN COTTON COMPARATIVE ANALYSIS 2019 | 36

ALL FARMS AVERAGE
TOP 20% AVERAGE DIFFERENCE
DEDUCT:
Interest and bank charges 324 145 179
Interest - Crop terms 0 0 0
324 145 179
FARM NET PROFIT/(LOSS) 1,448 3,295 1,847
CROP RESULTS
Hectares of cotton grown 617.64 887.02 269.38
Total yield (bales) 6,600.48 11,565.22 4,964.74
Yield per hectare (bales) 10.69 13.08 2.39
Value per bale 596.01 550.34 (45.67)
Cost of production per bale 586.58 289.84 296.74
Operating profit per bale 9.43 260.50 251.07
Number of bales per hectare required to cover operating expenses 10.52 6.88 3.63
Number of bales per hectare required to cover total expenses 11.04 7.15 3.90
COMPARISON OF TOP 20% FARMERS AND AVERAGE FARMERS FOR THE PAST FIVE YEARS (2015, 2016, 2017,2018, 2019) (continued)
3.4.2
BOYCE AND CRDC AUSTRALIAN COTTON COMPARATIVE ANALYSIS 2019 | 37

PER BALE FIGURES
GRAPH3.5.1
3.5
COMPARISON OF AVERAGE INCOME AND EXPENSE ITEMS3.5.1.1
1997 1998 1999 2000 2001 2002 2003 2004 2005 2006 2007 2008 2009 2010 2011 2012 2013 2014 2015 2016 2017
$ P
ER
BA
LE
2018 20190
100
200
300
400
500
600
700
800
INCOME
OPERATING EXPENSES
LINEAR (INCOME)
LINEAR (OPERATING EXPENSES)
LINEAR (OPERATING PROFIT BEFORE INTEREST)
OPERATING PROFIT (BEFORE INTEREST)
YEAR
BOYCE AND CRDC AUSTRALIAN COTTON COMPARATIVE ANALYSIS 2019 | 38

2010 2011 2012 2013 2014 2015 2016 2017 2018 2019 5YR AV
INCOME
464 523 501 441 460 487 495 511 544 Cotton proceeds - Lint 545 517
72 54 41 49 79 94 79 79 71 Cotton proceeds - Seed 110 87
(53) (48) (53) (59) (61) (59) (60) (60) (60) Ginning (61) (60)
(3) (3) (3) (3) (4) (4) (4) (4) (4) Levies (4) (4)
8 11 7 2 6 1 0 0 1 Cotton proceeds - Hail claims 0 0
488 537 494 429 479 518 511 526 552 591 540
EXPENSES
11 14 12 12 8 8 9 10 11 Cartage 9 10
13 14 13 10 15 12 13 17 12 Chemical application 15 14
6 5 5 4 5 5 4 6 4 Chemicals - Defoliants 6 5
11 11 9 8 11 9 13 13 9 Chemicals - Herbicides 12 11
15 14 9 3 8 9 12 15 11 Chemicals - Insecticides 9 11
4 1 1 0 0 0 1 1 1 Chemicals - Others 1 1
1 0 0 0 0 0 1 0 0 Chipping 0 0
7 6 6 5 4 4 5 6 5 Consultants 8 6
25 28 25 16 18 12 13 15 14 Contract picking 19 14
2 12 17 20 10 8 10 15 13 Contract farming and ripping 14 12
1 5 9 7 7 8 10 10 8 Cotton picking wrap and sundries 9 9
42 16 18 21 24 28 25 23 20 Depreciation 38 27
8 8 3 4 5 8 7 7 5 Electricity 6 7
39 39 53 51 52 38 42 40 39 Fertiliser 58 44
30 26 28 38 37 30 26 26 28 Fuel and oil 40 30
1 2 4 3 5 3 2 1 1 Hire of plant 3 2
17 16 13 10 10 9 10 13 10 Insurance 10 10
25 28 30 29 30 21 23 28 27 Licence fee - Bollgard 29 26
6 6 6 4 7 5 5 7 7 Licence fee - Roundup ready 7 6
3 2 2 2 2 2 2 3 2 Motor vehicle expenses 4 3
15 12 11 12 11 13 14 19 16 R & M - Farming plant 32 19
18 6 9 12 16 17 14 11 10 R & M - Pumps and earthworks 26 16
12 11 15 10 8 11 9 13 11 Seed 13 12
18 13 15 15 30 27 25 26 41 Water charges 111 46
37 36 35 36 38 41 39 26 28 Wages - Employees 36 34
7 2 2 3 2 2 4 11 9 Wages - Proprietors 14 8
3 5 5 5 5 7 5 6 8 Administration 11 8
10 6 16 16 14 7 9 12 16 Other farm overheads 19 13
388 346 371 356 382 347 355 381 366 560 402
100 191 123 73 96 172 156 145 186 OPERATING PROFIT/(LOSS) 31 138
ADD:
7 2 2 3 2 2 4 11 9 Wages - Proprietors 14 8
107 193 125 76 98 174 160 156 196 FARM OPERATING PROFIT/(LOSS)
45 146
COMPARISON OF AVERAGE INCOME AND EXPENSE ITEMS FOR THE PAST 10 YEARS3.5.2
BOYCE AND CRDC AUSTRALIAN COTTON COMPARATIVE ANALYSIS 2019 | 39
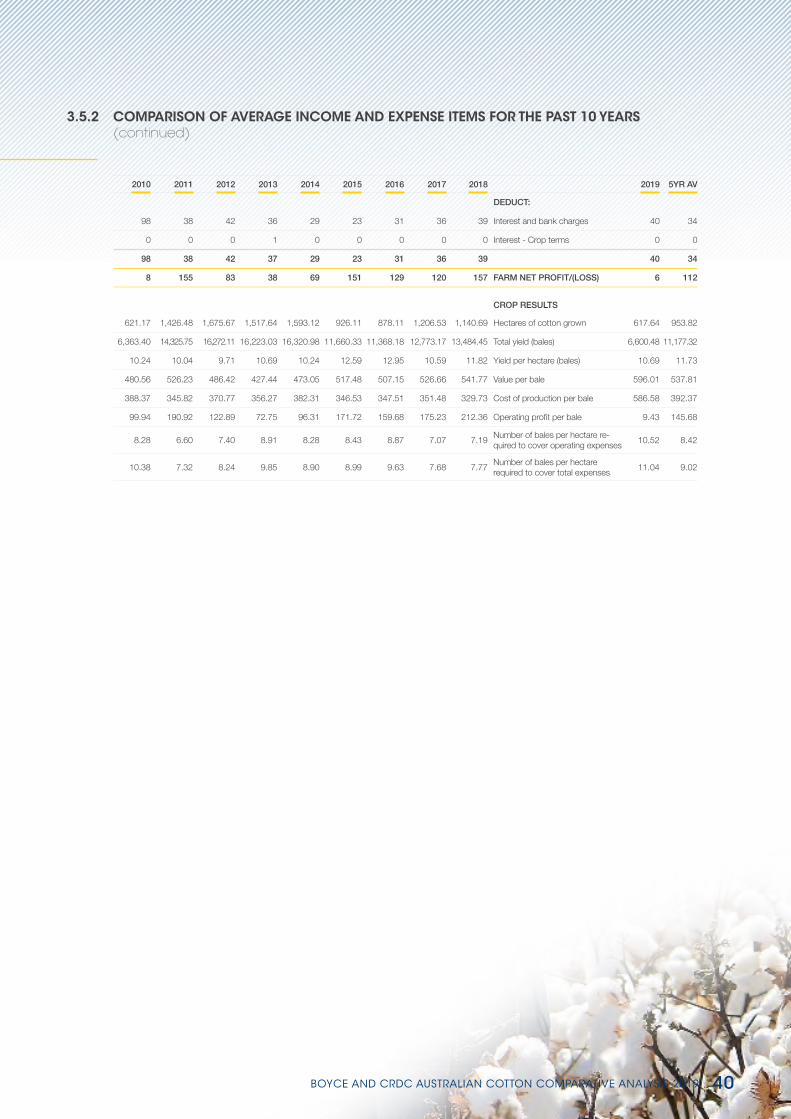
2010 2011 2012 2013 2014 2015 2016 2017 2018 2019 5YR AV
DEDUCT:
98 38 42 36 29 23 31 36 39 Interest and bank charges 40 34
0 0 0 1 0 0 0 0 0 Interest - Crop terms 0 0
98 38 42 37 29 23 31 36 39 40 34
8 155 83 38 69 151 129 120 157 FARM NET PROFIT/(LOSS) 6 112
CROP RESULTS
621.17 1,426.48 1,675.67 1,517.64 1,593.12 926.11 878.11 1,206.53 1,140.69 Hectares of cotton grown 617.64 953.82
6,363.40 14,325.75 16,272.11 16,223.03 16,320.98 11,660.33 11,368.18 12,773.17 13,484.45 Total yield (bales) 6,600.48 11,177.32
10.24 10.04 9.71 10.69 10.24 12.59 12.95 10.59 11.82 Yield per hectare (bales) 10.69 11.73
480.56 526.23 486.42 427.44 473.05 517.48 507.15 526.66 541.77 Value per bale 596.01 537.81
388.37 345.82 370.77 356.27 382.31 346.53 347.51 351.48 329.73 Cost of production per bale 586.58 392.37
99.94 190.92 122.89 72.75 96.31 171.72 159.68 175.23 212.36 Operating profit per bale 9.43 145.68
8.28 6.60 7.40 8.91 8.28 8.43 8.87 7.07 7.19 Number of bales per hectare re-quired to cover operating expenses
10.52 8.42
10.38 7.32 8.24 9.85 8.90 8.99 9.63 7.68 7.77 Number of bales per hectare required to cover total expenses
11.04 9.02
COMPARISON OF AVERAGE INCOME AND EXPENSE ITEMS FOR THE PAST 10 YEARS (continued)
3.5.2
BOYCE AND CRDC AUSTRALIAN COTTON COMPARATIVE ANALYSIS 2019 | 40

2010 2011 2012 2013 2014 2015 2016 2017 2018 2019 5YR AV
INCOME
4,268 4,508 4,749 4,313 4,444 5,699 5,637 4,978 6,410 Cotton proceeds - Lint 6,748 5,894
718 440 382 302 746 1,156 941 736 719 Cotton proceeds - Seed 1,475 1,005
(498) (445) (561) (523) (604) (710) (659) (582) (682) Ginning (727) (672)
(30) (29) (31) (28) (51) (56) (47) (36) (43) Levies (47) (46)
0 350 9 27 4 7 1 0 0 Cotton proceeds - Hail claims 0 2
4,458 4,824 4,548 4,091 4,539 6,096 5,873 5,096 6,404 7,449 6,183
EXPENSES
91 122 88 121 100 109 127 59 69 Cartage 84 90
123 129 116 80 132 140 170 156 166 Chemical application 128 152
79 69 58 49 48 58 52 64 44 Chemicals - Defoliants 101 64
89 108 69 66 99 101 97 127 101 Chemicals - Herbicides 116 108
140 80 61 47 74 109 88 106 151 Chemicals - Insecticides 98 110
5 11 10 5 3 5 17 9 7 Chemicals - Others 3 8
14 0 2 0 1 1 0 2 3 Chipping 3 2
62 57 38 35 44 16 68 48 55 Consultants 86 55
361 258 295 90 246 169 257 107 113 Contract picking 124 154
29 64 130 380 102 33 309 191 110 Contract farming and ripping 27 134
3 43 61 72 61 90 99 94 110 Cotton picking wrap and sundries 137 106
332 141 179 207 189 269 122 216 153 Depreciation 301 212
7 66 33 29 21 37 89 16 18 Electricity 110 54
518 296 448 410 505 444 493 397 440 Fertiliser 576 470
347 201 202 299 337 284 197 224 218 Fuel and oil 268 238
3 11 52 67 70 21 17 8 2 Hire of plant 4 10
148 141 119 45 104 87 78 111 118 Insurance 50 89
308 315 281 175 317 277 294 299 272 Licence fee - Bollgard 324 293
53 55 53 29 67 66 73 72 77 Licence fee - Roundup ready 71 72
33 18 15 28 15 18 13 16 9 Motor vehicle expenses 50 21
147 77 80 60 115 84 119 155 95 R & M - Farming plant 207 132
88 58 49 51 79 124 53 81 41 R & M - Pumps and earthworks 287 117
160 101 165 104 75 133 105 111 106 Seed 113 114
13 144 181 192 308 303 271 165 160 Water charges 226 225
286 285 287 193 319 525 411 275 306 Wages - Employees 272 358
49 7 22 33 13 8 18 17 18 Wages - Proprietors 77 28
43 38 48 42 56 55 17 47 42 Administration 56 43
43 65 38 97 62 77 39 90 58 Other farm overheads 83 69
3,574 2,960 3,180 3,006 3,562 3,643 3,693 3,263 3,062 3,982 3,528
884 1,864 1,368 1,085 977 2,453 2,180 1,833 3,342 OPERATING PROFIT/(LOSS) 3,467 2,655
ADD:
49 7 22 33 13 8 18 17 18 Wages - Proprietors 77 28
933 1,871 1,390 1,118 990 2,461 2,198 1,850 3,360 FARM OPERATING PROFIT/(LOSS)
3,544 2,683
LOW COST FARMERS
COMPARISON OF AVERAGE INCOME AND EXPENSE ITEMS FOR THE PAST 10 YEARS
3.6
3.6.1
BOYCE AND CRDC AUSTRALIAN COTTON COMPARATIVE ANALYSIS 2019 | 41

2010 2011 2012 2013 2014 2015 2016 2017 2018 2019 5YR AV
DEDUCT:
1,418 333 345 543 357 194 201 329 177 Interest and bank charges 112 203
0 0 0 65 0 0 0 2 0 Interest - Crop terms 0 0
1,418 333 345 608 357 194 201 331 177 112 203
(485) 1,538 1,045 510 633 2,267 1,997 1,519 3,183 FARM NET PROFIT/(LOSS) 3,432 2,480
CROP RESULTS
713 1,276 1,532 1,014 1,934 1,242 1,406 2,190 1,924 Hectares of cotton grown 295 1,411
6,535.00 11,428.00 14,857.26 9,539.47 18,683.35 14,707.30 15,717.14 22,058.47 22,778.59 Total yield (bales) 3,664.32 15,785
9.17 8.95 9.70 9.41 9.66 11.84 11.18 10.07 11.84 Yield per hectare (bales) 12.40 11
486.02 499.65 468.02 431.96 469.31 514.36 525.31 505.76 540.84 Value per bale 600.45 537
389.29 330.42 327.83 319.61 368.46 307.83 330.34 324.06 258.58 Cost of production per bale 320.95 308
96.73 208.27 141.11 115.23 101.28 207.08 195.11 181.70 282.26 Operating profit per bale 279.50 229
7.35 5.92 6.79 6.96 7.58 7.09 7.03 6.45 5.66 Number of bales per hectare required to cover operating expenses
6.63 7
10.26 6.59 7.53 8.37 8.35 7.46 7.41 7.11 5.99 Number of bales per hectare required to cover total expenses
6.82 7
COMPARISON OF AVERAGE INCOME AND EXPENSE ITEMS FOR THE PAST 10 YEARS (continued)
3.6.1
BOYCE AND CRDC AUSTRALIAN COTTON COMPARATIVE ANALYSIS 2019 | 42

LOW COST FARMERS VERSUS AVERAGE FARMERS
GRAPH
3.7
3.7.1
COMPARISON OF YIELD3.7.1.1
1997 1998 1999 2000 2001 2002 2003 2004 2005 2006 2007 2008 2009 2010 2011 2012 2013 2015 2016 201720140
2
4
6
8
10
12
13
14
1
3
5
7
9
11
2018 2019
YIELD - LOW COST
YIELD - AVERAGE
LINEAR (YIELD - LOW COST)
LINEAR (YIELD - AVERAGE)
$ P
ER
HE
CT
AR
E
YEAR
BOYCE AND CRDC AUSTRALIAN COTTON COMPARATIVE ANALYSIS 2019 | 43

Appendices4

APPENDIX A
DEFINITION OF TERMS
TOP 20% AND BOTTOM 20% (AVERAGE)These figures represent the average results of those farmers who achieved the highest and lowest farm operating
profit (after using an average cotton price for all growers).
BEST "LOW COST" FARMERSThese figures represent the average results of those farmers who had the lowest farm operating expenses
(before interest).
LARGE GROWERSThese figures represent the average results of those farmers who grew more than 2,000 hectares.
COMBINED AVERAGE OF FIVE YEARS TO 2018These figures represent the average of the annual results of farmers in each category of the comparative
analysis, over a five year period. We have also analysed the combined average of the Top 20% Farmers for
comparative purposes.
LABOURThese figures include all permanent employees or equivalent casuals (two casuals employed for three months
each would represent half of a permanent employee). Proprietors have been excluded.
AVAILABLE TRACTOR HORSE POWER (ENGINE)Includes all field tractors used for ripping, listing, spraying and cultivating, but excludes tractors used to operate
module builders.
AVAILABLE PICKING CAPACITYOnly includes pickers owned by the farmer.
ROTATIONThe portion of the current year's crop grown on fields fallowed in the previous year, or developed over the past
four years, expressed as a percentage.
WATER USAGEIncludes the total megalitres of irrigation water used to grow the crop as well as the impact of beneficial rain.
Rainfall figures during the growing season have been converted to megalitres after excluding light falls and a
portion of falls over 100 mm per month.
BOYCE AND CRDC AUSTRALIAN COTTON COMPARATIVE ANALYSIS 2019 | 45

APPENDIX B
GUIDE TO INCOME AND EXPENSE ALLOCATIONS
COTTON PROCEEDS
Cotton Proceeds – Lint is net of premiums and discounts.
For farmers who received hail insurance claims, the amount received has been shown separately in the analysis.
Where possible the hail claim has been grossed up to reflect the bales lost due to hail and the costs saved or
additional costs incurred have been added or subtracted to reflect comparable figures.
EXPENSES
Cartage cartage (cotton module cartage, general cartage)
Chemical application application by aircraft, application by ground rig
Chemicals – Defoliants all defoliants and conditioners
Chemicals – Herbicides herbicides used in field and on ditches, channels etc.
Chemicals – Insecticides all insecticides
Chemicals – Other growth regulants (pix) and all other chemicals
Chipping chipping (chipping contractors, chipping wages), row weeders
Consultants consultants (external and internal agronomist, bug checkers,
marketing consultants)
Contract picking contract picking (net of contract picking income on a swap basis,
ie. hectare for hectare)
Contract farming and ripping contract farming, contract ripping, contract stalk pulling, stick picking
Cotton wrap and cotton wrap and sundries (tarps and ropes, repairs to tarps)
picking sundries
Depreciation depreciation
Electricity electricity (electricity for bores, general electricity)
Fertiliser fertiliser, gypsum
Fuel and oil fuel and oil (net of diesel fuel rebate)
Hire of plant hire of plant
Insurance crop insurance, general insurance
Licence fee – Bollgard licence fees paid to Monsanto for the Bollgard licence
Licence fee – Roundup Ready licence fees paid to Monsanto for the Roundup Ready licence
Motor vehicle expenses motor vehicle expenses (registration, motor vehicle insurance,
R & M motor vehicle)
BOYCE AND CRDC AUSTRALIAN COTTON COMPARATIVE ANALYSIS 2019 | 46

R & M – Farming plant R & M pickers, R & M plant, R & M tractors, R & M small tools
and hardware, R & M motor bikes
R & M – Pumps and earthworks R & M irrigation earthworks, R & M irrigation pumps and motors
Seed seed
Water charges and purchases water charges (charges from a state body, charges from a local water
scheme) and water purchases
Wages – Employees external wages (excluding chipping), payroll tax, secretarial fees,
superannuation, workers compensation insurance, FBT
Wages – Proprietors wages paid to a proprietor. If no wage is paid a notional amount, based
on their involvement in the operation, has been included for each working
proprietor. If the farm has more than one enterprise, the proprietors wage
is split in accordance with normal allocation criteria
Administration accountancy (all general work), administration, advertising, computer costs,
computer processing, entertainment, filing fees, licences permits and fees,
medical supplies, newspapers and periodicals, printing stationery and
postage, protective clothing, seminars and conferences, staff amenities, staff
training, subscriptions and donations, telephone, travel and accommodation
Other farm overheads special accountancy work, audit, legal, rates, rent, R & M homestead,
R & M employees’ houses, R & M farm buildings, R & M fences, shade and
shelter trees
Interest and bank charges bank charges, borrowing expenses, bank interest, leasing, and hire
purchase interest charges
Interest – Crop terms interest on crop term finance (chemical suppliers and cotton merchants etc)
BOYCE AND CRDC AUSTRALIAN COTTON COMPARATIVE ANALYSIS 2019 | 47

APPENDIX C
CHART OF ASSESSABILITY OF COTTON PROCEEDS
Is cotton still on the bush at 30 June?
Full proceeds are assessable for the year just ended regardless
of when received.
Cost of producing the cotton is assessable
for the year just ended.
Not assessable for the year just ended.
Has cotton been classed at 30 June?
Has ownership of the cotton been transferred
at 30 June?
Is cotton to be marketed through a pool?
YES
YES
YES YES
NO
NO NO
NO
Notes:
• The guaranteed minimum price of a GMP pool is assessable as cash. The balance is treated as a pool.
• ‘Cost of producing’ is the cost of severing the cotton from the land plus any other costs spent directly
on the lint or seed prior to 30 June of that year.
The marketing of cotton is a complex issue. The taxation treatment relies on the wording of a particular contract.
This schedule is designed to provide general advice only. If you need specific advice, please contact us.
On this basis, we accept no liability for any errors or omissions.
BOYCE AND CRDC AUSTRALIAN COTTON COMPARATIVE ANALYSIS 2019 | 48

APPENDIX D
COMMON SHAREFARMING AND LEASING ARRANGEMENTSBelow are some details of common practices.
• Sharefarming (80% – 20% deal)
80% of income to the sharefarmer.
20% of income to the landholder.
• Sharefarmer pays all operating costs. • Landholder pays landholder's costs (rates) and costs to deliver water to the head ditch (pumping,
water charges, and main channel maintenance).
• Sharefarming (82% – 18% deal)
82% of income to the sharefarmer.
18% of income to the landholder.
• Sharefarmer pays all costs except rates.
• Leasing
• A starting point is generally 4% – 6% of the value of the full watered developed area.
BOYCE AND CRDC AUSTRALIAN COTTON COMPARATIVE ANALYSIS 2019 | 49

www.boyceca.com
Boyce Chartered Accountants - Wagga Wagga
44 Fitzmaurice St Tel: (02) 6971 0600
Wagga Wagga Email: [email protected]
NSW 2650
Cotton Research and Development Corporation
2 Lloyd St Tel: (02) 6792 4088
(PO Box 282) Fax: (02) 6792 4400
Narrabri NSW 2390 Email: [email protected]
www.crdc.com.au
Liability limited by a scheme approved under Professional Standards Legislation.