Embed Size (px)
Citation preview

Australian Gas Resource Assessment
2012


Department of Resources, Energy and TourismGeoscience AustraliaBureau of Resources and Energy Economics
Department of Resources, Energy and Tourism GPO Box 9839
Canberra ACT 2601 www.ret.gov.au
Geoscience Australia GPO Box 378
Canberra ACT 2601 www.ga.gov.au
Bureau of Resources and Energy Economics PO Box 1564
Canberra ACT 2601 www.bree.gov.au
Australian Gas Resource Assessment
2012
Department of Resources, Energy and Tourism Minister for Resources and Energy: The Hon. Martin Ferguson, AM MP Secretary: Mr Drew Clarke
Geoscience Australia Chief Executive Officer: Dr Chris Pigram
Bureau of Resources and Energy Economics (BREE) Executive Director/Chief Economist: Professor Quentin Grafton
© Commonwealth of Australia, 2012
This work is copyright. Apart from any fair dealings for the purpose of study, research, criticism, or review, as permitted under the Copyright Act 1968, no part may be reproduced by any process without written permission. Copyright is the joint responsibility of the Chief Executive Officer, Geoscience Australia and the Executive Director/Chief Economist, BREE. Requests and enquiries should be directed to the Chief Executive Officer, Geoscience Australia, GPO Box 378, Canberra ACT 2601 and the Executive Director/Chief Economist, BREE, GPO Box 1563, Canberra ACT 2601.
Geoscience Australia and BREE have tried to make the information in this product as accurate as possible. However, it does not guarantee that the information is totally accurate or complete. Therefore, you should not solely rely on this information when making a commercial decision.
ISBN 978-1-92210327-7 (web)
GeoCat # 74032
Bibliographic reference: Geoscience Australia and BREE, 2012, Australian Gas Resource Assessment 2012, Canberra

Australian Gas Resource Assessment 2012
iiiPreface
AcknowledgmentsThis assessment and report commissioned by the Australian Government Department of Resources, Energy and Tourism (RET) was jointly undertaken by Geoscience Australia (GA) and the Bureau of Resources and Energy Economics (BREE).
Authors
Geoscience Australia: Marita Bradshaw, Lisa Hall.
BREE: Alan Copeland, Nina Hitchins.
Other contributors
A number of colleagues at Geoscience Australia, BREE and the Department of Resources, Energy and Tourism (RET) have contributed to the preparation of this report.
Geoscience Australia: Andrew Barrett, Takehiko (Riko) Hashimoto, Stephen Lepoidevin, Andrew Stacey, Ron Zhu.
BREE: Allison Ball, Adam Bialowas, Quentin Grafton, Tom Shael.
Design and production
Adrian Yee (Geoscience Australia).
Graphics
Silvio Mezzomo, Chris Evenden (Geoscience Australia).
Other acknowledgements
A number of individuals and organisations have kindly provided invaluable information and advice on this update. This is very much appreciated and thanks are extended particularly to:
The Energy White Paper Team; Australian Petroleum Production and Exploration Association; Geological Survey of Queensland, Department for Manufacturing, Innovation, Trade, Resources and Energy (DMITRE), South Australia, Geoscience Victoria.
Individuals: Dr Tony Bint (Origin Energy), Dr Peter McCabe (CSIRO Petroleum Resources).
Cover image
North Rankin A platform, North West Shelf Project, Western Australia.
Supplied by: Woodside Energy Ltd.

Australian Gas Resource Assessment 2012
v
Preface
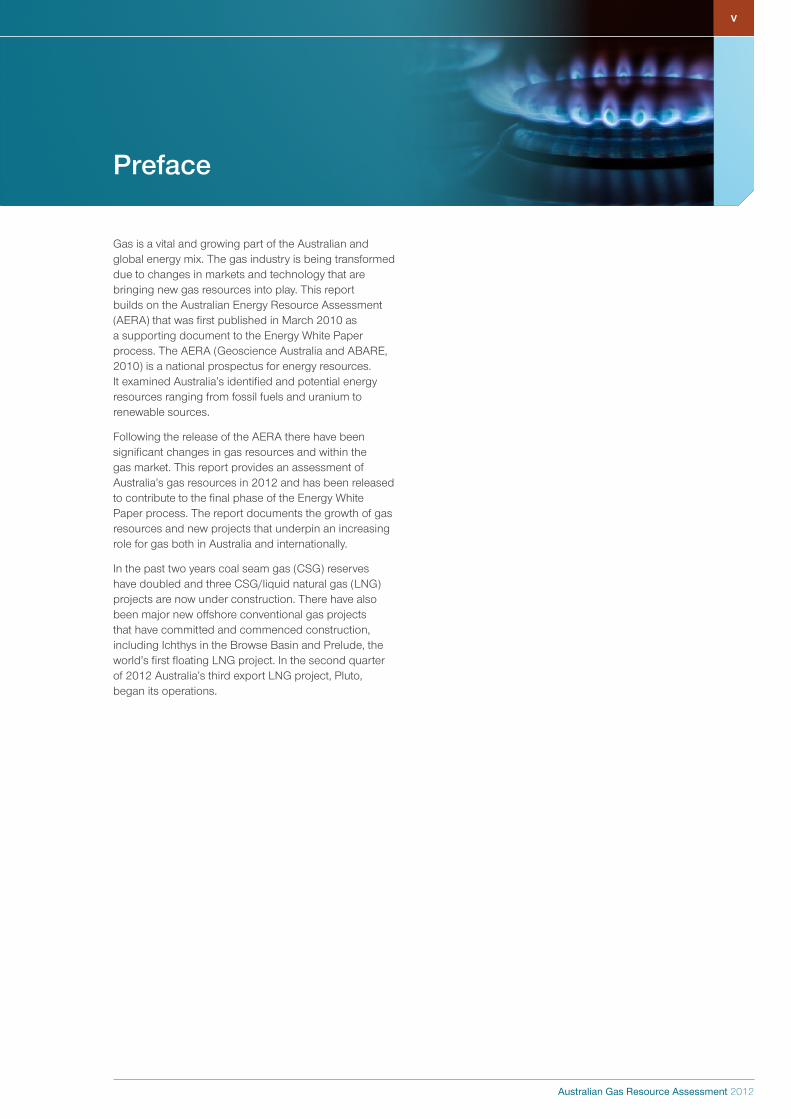
Gas is a vital and growing part of the Australian and global energy mix. The gas industry is being transformed due to changes in markets and technology that are bringing new gas resources into play. This report builds on the Australian Energy Resource Assessment (AERA) that was first published in March 2010 as a supporting document to the Energy White Paper process. The AERA (Geoscience Australia and ABARE, 2010) is a national prospectus for energy resources. It examined Australia’s identified and potential energy resources ranging from fossil fuels and uranium to renewable sources.
Following the release of the AERA there have been significant changes in gas resources and within the gas market. This report provides an assessment of Australia’s gas resources in 2012 and has been released to contribute to the final phase of the Energy White Paper process. The report documents the growth of gas resources and new projects that underpin an increasing role for gas both in Australia and internationally.
In the past two years coal seam gas (CSG) reserves have doubled and three CSG/liquid natural gas (LNG) projects are now under construction. There have also been major new offshore conventional gas projects that have committed and commenced construction, including Ichthys in the Browse Basin and Prelude, the world’s first floating LNG project. In the second quarter of 2012 Australia’s third export LNG project, Pluto, began its operations.


Australian Gas Resource Assessment 2012
vii
Contents
Acknowledgments iii
Preface v
Australian Gas Resources 2012 1
1 Summary 1
1.1 World gas resources and market 1
1.2 Australia’s gas resources 1
1.3 Key factors in utilising Australia’s gas resources 3
1.4 Australia’s gas market 3
1.5 Outlook to 2035 for the Australian gas market 3
2 Background information and world market 5
2.1 Definitions 5
2.2 Gas supply chain 5
2.3 World gas market 8
3 Australia’s gas resources and market 13
3.1 Conventional gas resources 13
3.2 Coal seam gas (CSG) resources 17
3.3 Tight gas, shale gas and gas hydrates resources 18
3.4 Total gas resources 19
3.5 Gas market 19
4 Outlook to 2035 for Australia’s resources and market 24
4.1 Key factors influencing the outlook 24
4.2 Conventional gas resource outlook 34
4.3 Unconventional gas resource outlook 36
4.4 Total gas resource outlook 37
4.5 Outlook for the gas market 38
5 References 45
Appendices 47
Appendix A: Abbreviations and Acronyms 47
Units 47
Appendix B: Glossary 48
Appendix C: Resource Classification 50
McKelvey Classification Scheme 50
Petroleum Resources Management System 51
Appendix D: Energy Measurement and Conversion Factors 53
Decimal numbering system 53
Energy measurement 53
Energy content conversion factors 54
Appendix E: Geological Time Scale and Formation of Australia’s Major Energy Resources 56

Australian Gas Resource Assessment 2012
Chapter title
1
Australian Gas Resource Assessment 2012
1
1 Summary
K E Y M E S S A G E S
• Australia has substantial gas resources; gas is Australia’s third largest energy resource after coal and uranium.
• Most of the conventional gas resources are located off the north-west coast of Australia and are being progressively developed for domestic use and LNG export.
• Significant coal seam gas (CSG) resources exist in the major coal basins of eastern Australia and are being developed for domestic use and LNG export.
• It is likely that Australia possesses significant shale gas and tight gas resources, although as yet these are poorly quantified as exploration for these commodities within Australia has only recently commenced.
• Australia’s gas resources have grown recently as a result of successful exploration programs and are large enough to support projected domestic and export market growth to 2035 and beyond.
• Gas is a relatively flexible and clean fuel and is projected to be the fastest growing non-renewable energy source over the period to 2035.
• Gas is expected to significantly increase its share of Australia’s energy production and exports over the next few decades and make a greater contribution to electricity generation.
1.1 World gas resources and market
• Proved global gas reserves at the end of 2010 were estimated to be around 7.3 million PJ (6608 tcf). This is equal to around 59 years’ supply at current production rates.
• The International Energy Agency (IEA) estimates that globally there are over 15.5 million PJ (14 124 tcf) of remaining recoverable resources of conventional gas. This is equivalent to around 120 years of production at current rates. While uncertain, unconventional recoverable resources are estimated to be a similar size, bringing total gas reserves to around 250 years of production (IEA 2011a).
• Gas is the third largest global energy source, currently accounting for around 21 per cent of global primary energy consumption. Global gas consumption has increased at an average annual rate of 2.8 per cent since 2000, to reach 128 166 PJ (117 tcf) in 2010.
• Global LNG trade has expanded rapidly – by 7.8 per cent per year since 2000 – to reach 115 14 PJ (219 Mt 10.5 tcf) in 2010. LNG trade accounts for around 9 per cent of global gas consumption.
• Australia accounted for around 2 per cent of world gas reserves and 2.1 per cent of world production in 2010. However, Australia is the world’s fourth largest
LNG exporter and accounted for 9 per cent of world LNG trade in 2010.
� Global gas demand is projected by the IEA, in its New Policies Scenario, to increase by 1.7 per cent per year to reach 184 275 PJ (168 tcf) in 2035 (IEA 2011a).
• This expansion in global demand will increasingly be met by international trading, including LNG from countries such as Australia. LNG trade is projected to increase by around 9263 PJ (176 Mt, 8.4 tcf) between 2009 and 2035 (IEA 2011a) to around 18 632 PJ (354 Mt, 17 tcf) .
• The recent rapid growth in unconventional gas production in the United States and the abundance of resources worldwide could have implications for future LNG trade flows.
1.2 Australia’s gas resources
• Gas is Australia’s third largest energy resource after coal and uranium. This is unlikely to change in the period leading up to 2035.
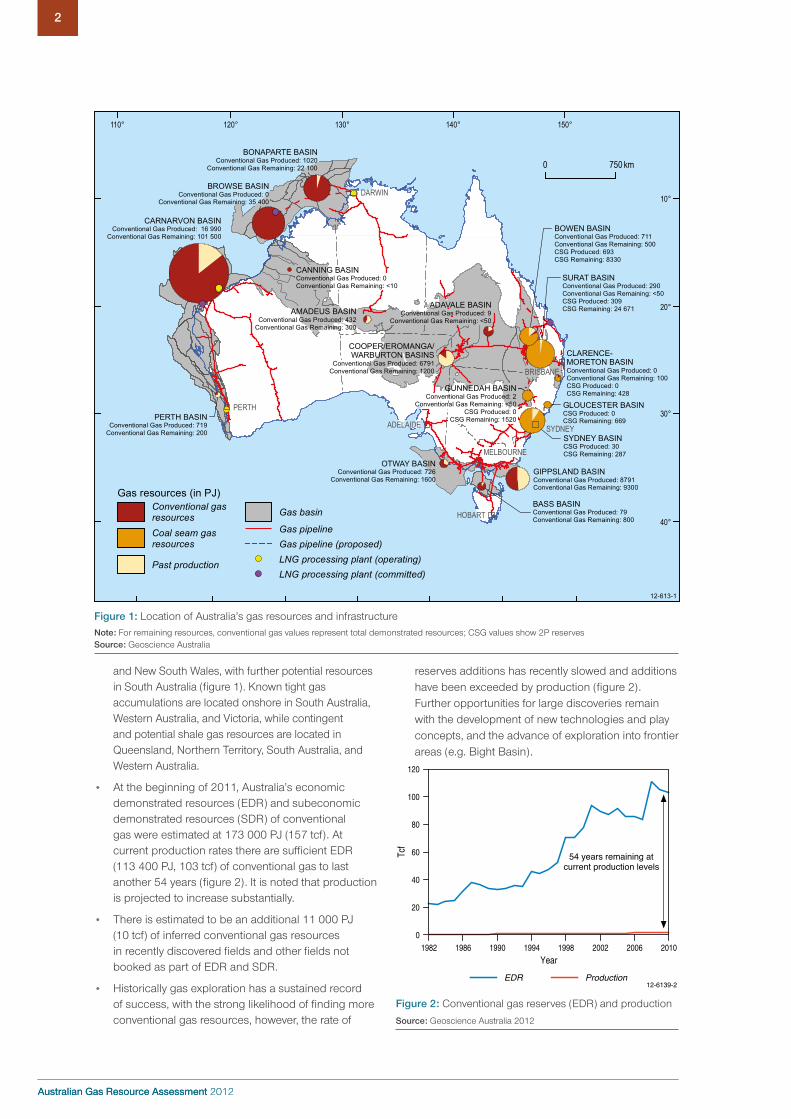
� Most (around 92 per cent) of Australia’s conventional gas resources are located in the Carnarvon, Browse and Bonaparte basins off the north-west coast (figure 1). There are also resources in south-west, south-east and central Australia. Large coal seam gas (CSG) resources exist in the coal basins of Queensland
Australian Gas Resources 2012
Australian Gas Resource Assessment 2012
2
Australian Gas Resource Assessment 2012
2
and New South Wales, with further potential resources in South Australia (figure 1). Known tight gas accumulations are located onshore in South Australia, Western Australia, and Victoria, while contingent and potential shale gas resources are located in Queensland, Northern Territory, South Australia, and Western Australia.
• At the beginning of 2011, Australia’s economic demonstrated resources (EDR) and subeconomic demonstrated resources (SDR) of conventional gas were estimated at 173 000 PJ (157 tcf). At current production rates there are sufficient EDR (113 400 PJ, 103 tcf) of conventional gas to last another 54 years (figure 2). It is noted that production is projected to increase substantially.
• There is estimated to be an additional 11 000 PJ (10 tcf) of inferred conventional gas resources in recently discovered fields and other fields not booked as part of EDR and SDR.
• Historically gas exploration has a sustained record of success, with the strong likelihood of finding more conventional gas resources, however, the rate of
reserves additions has recently slowed and additions have been exceeded by production (figure 2). Further opportunities for large discoveries remain with the development of new technologies and play concepts, and the advance of exploration into frontier areas (e.g. Bight Basin).
0
20
40
60
80
100
120
Tcf
1982 20101986 1990 1994 1998 2002 2006
Year
54 years remaining atcurrent production levels
EDR Production12-6139-2
Figure 2: Conventional gas reserves (EDR) and production
Source: Geoscience Australia 2012
BONAPARTE BASINConventional Gas Produced: 1020
Conventional Gas Remaining: 22 100
BOWEN BASINConventional Gas Produced: 711Conventional Gas Remaining: 500CSG Produced: 693CSG Remaining: 8330
GIPPSLAND BASINConventional Gas Produced: 8791Conventional Gas Remaining: 9300
COOPER/EROMANGA/WARBURTON BASINS
Conventional Gas Produced: 6791Conventional Gas Remaining: 1200
AMADEUS BASINConventional Gas Produced: 432
Conventional Gas Remaining: 300
PERTH BASINConventional Gas Produced: 719
Conventional Gas Remaining: 200
CARNARVON BASINConventional Gas Produced: 16 990
Conventional Gas Remaining: 101 500
OTWAY BASINConventional Gas Produced: 726
Conventional Gas Remaining: 1600
SURAT BASINConventional Gas Produced: 290Conventional Gas Remaining: <50CSG Produced: 309CSG Remaining: 24 671
CLARENCE-MORETON BASINConventional Gas Produced: 0Conventional Gas Remaining: 100CSG Produced: 0CSG Remaining: 428
GLOUCESTER BASINCSG Produced: 0CSG Remaining: 669
SYDNEY BASINCSG Produced: 30CSG Remaining: 287
GUNNEDAH BASINConventional Gas Produced: 2
Conventional Gas Remaining: <50CSG Produced: 0
CSG Remaining: 1520
ADAVALE BASINConventional Gas Produced: 9
Conventional Gas Remaining: <50
BROWSE BASINConventional Gas Produced: 0
Conventional Gas Remaining: 35 400
BASS BASINConventional Gas Produced: 79Conventional Gas Remaining: 800
CANNING BASINConventional Gas Produced: 0Conventional Gas Remaining: <10
PERTH
SYDNEY
DARWIN
HOBART
ADELAIDE
BRISBANE
MELBOURNE
12-613-1
0 750 km
Gas pipelineGas pipeline (proposed)
Gas basin
LNG processing plant (committed)LNG processing plant (operating)
Gas resources (in PJ)
Coal seam gasresources
Conventional gasresources
Past production
150°140°130°120°110°
10°
20°
30°
40°
Figure 1: Location of Australia’s gas resources and infrastructureNote: For remaining resources, conventional gas values represent total demonstrated resources; CSG values show 2P reserves Source: Geoscience Australia

Australian Gas Resource Assessment 2012
3Australian Gas Resources 2012
Australian Gas Resource Assessment 2012
3
� Australia also has significant unconventional gas resources – CSG, tight gas and shale gas. Coal seam gas economic demonstrated resources (EDR) have doubled in the last three years and at the end of 2011 were 35 905 (32.6 tcf). This is equivalent to about a third of the recoverable reserves from Australia’s conventional gas fields. Total identified resources of CSG are estimated to be around 223 454 PJ (203 tcf), including sub-economic resources (SDR) estimated at 65 529 PJ (60 tcf) and inferred of 122 020 PJ (111 tcf).
• Total identified tight gas resources are currently estimated at around 22 052 PJ (20 tcf). Significant on-going exploration activity suggests these values are likely to grow especially in basin-centred gas provinces with established infrastructure (e.g. Cooper and Perth basins).
• Australia may have significant shale gas resources but such resources are, as yet, poorly understood and quantified. A recent estimate suggests total technically recoverable resources may be as high as 435 600 PJ (396 tcf; EIA, 2011). In 2011, the first contingent shale gas resources were reported in the Cooper Basin (2200 PJ, 2 tcf); and the amount of exploration activity has significantly increased in the last few years, suggesting future growth in this area.
� Total identified gas resources are sufficient to enable expansion in Australia’s domestic and export production capacity. Australia’s combined identified gas resources are of the order of 431 706 PJ (392 tcf). This is equal to around 184 years of gas at current production rates, of which EDR accounts for 64 years.
• The distribution of gas resources in 2035 is expected to shift as finds of conventional gas resources offshore level off, CSG exploration and production continues to increase and new tight and shale gas resources are identified and developed.
1.3 Key factors in utilising Australia’s gas resources
� Most of Australia’s conventional gas resources are located offshore far from domestic gas markets, which adds to the cost of bringing the resource to market.
� Development of secure long-term markets is necessary to underpin the major capital investment required for development of gas resources in Australia.
• Potential environmental issues raised by gas development may include the disposal of water produced from onshore coal seam gas operations, potential below ground water impacts, carbon dioxide contained in some large offshore gas fields, the siting of onshore LNG liquefaction plants in environmentally sensitive areas and increased shipping movements through the Port of Gladstone and the Great Barrier Reef. All of these issues can be mitigated by the existence and enforcement of conditions precedent to project approvals.
• New gas pipelines will be required, particularly in eastern Australia, to provide sufficient supply for new gas-fired electricity generation in response to demand for cleaner energy.
1.4 Australia’s gas market
� Australian gas consumption has grown by 4 per cent per year over the past decade. Gas accounted for 23 per cent of Australia’s primary energy consumption in 2009–10 and 15 per cent of electricity generation.
• The main gas users in Australia are the manufacturing (32 per cent), electricity generation (29 per cent), mining (23 per cent) and residential (10 per cent) sectors.
• Gas production was 2005 PJ (1.8 tcf) in 2009–10. Unconventional gas production, in the form of coal seam gas, accounted for 10 per cent of this production. No tight or shale gas is currently produced in Australia.
• Around 48 per cent (18 Mt, 972 PJ, 0.9 tcf,) of Australian gas production was exported as LNG in 2009–10. Higher export volumes and international oil prices increased the value of exports in 2010–11 to $10.4 billion.
1.5 Outlook to 2035 for the Australian gas market
• Growth in gas consumption is expected to be driven by investment in new gas-fired power generation and by policy initiatives supporting gas uptake as a relatively clean energy source.
• The introduction of carbon pricing is expected to encourage the use of cleaner fuels such as gas. Gas-fired electricity generation has lower carbon emissions than coal-fired electricity without carbon capture and storage, and can also be linked with intermittent renewable energy resources such as wind to provide a flexible and reliable power source.
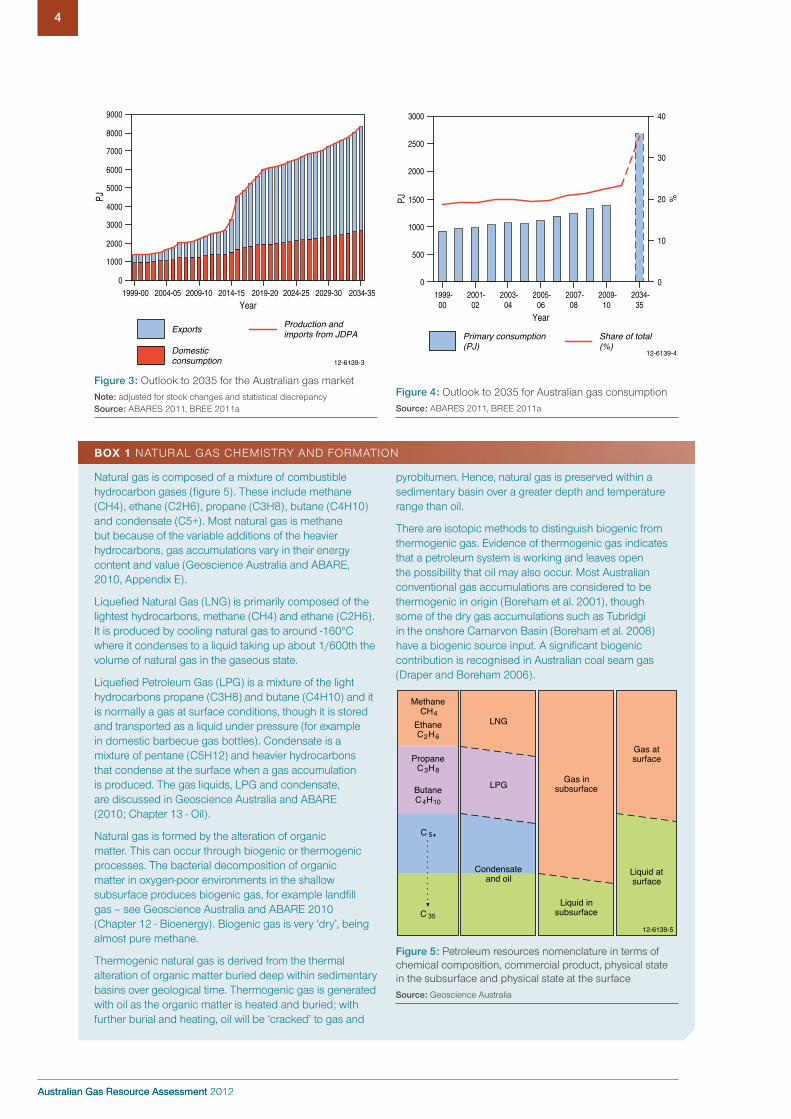
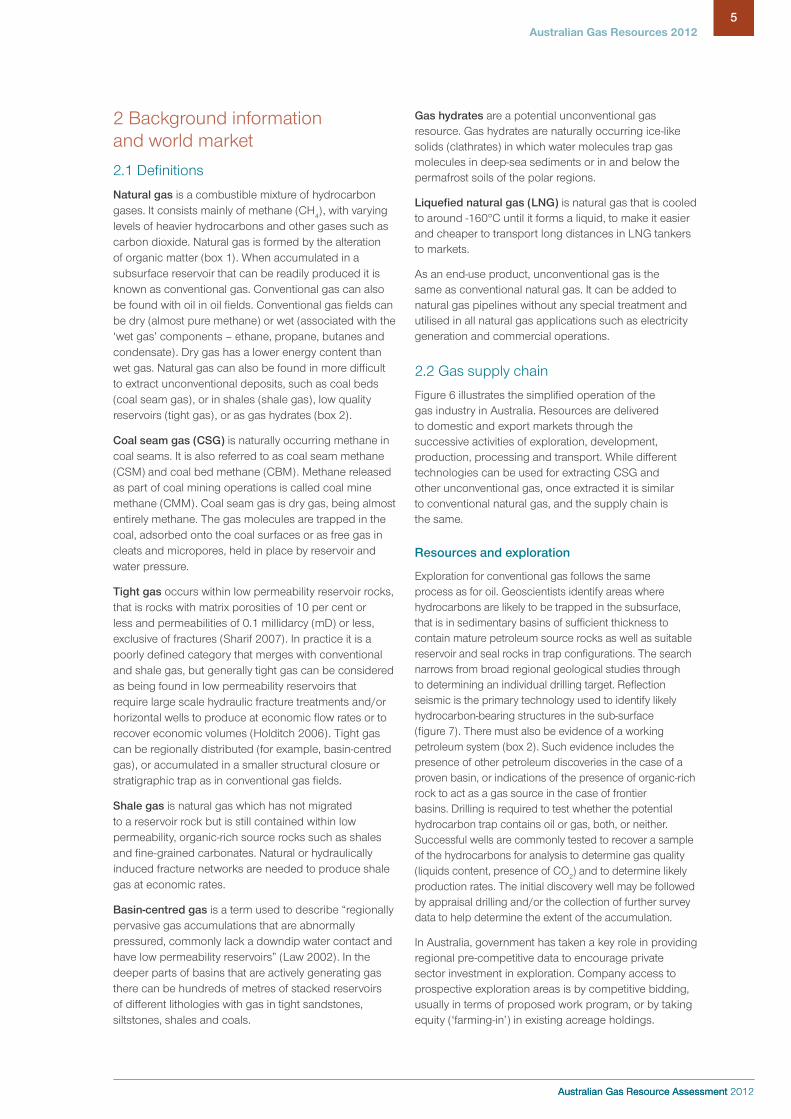
• In BREE’s latest long-term projections, gas consumption in Australia is projected to increase by 2.9 per cent per year to reach 2611 PJ (2.4 tcf) in 2034–35. Its share of primary energy consumption is projected to rise to 35 per cent in 2034–35 (figures 3 and 4).
• Australian gas production is projected to reach 8274 PJ (7.5 tcf) in 2034–35, with production from both conventional gas and CSG expected to rise.
� LNG exports are expected to account for around 68 per cent of Australian gas production in 2034–35, with exports projected to increase to 5663 PJ (107 Mt, 5.2 tcf) in 2034–35. As well as the major announced and potential LNG developments in north-west Australia, there will be exports of coal seam gas in the form of LNG from Queensland from the middle of this decade.
Australian Gas Resource Assessment 2012
4
Australian Gas Resource Assessment 2012
4
0
1000
2000
3000
4000
5000
6000
7000
8000
9000
PJ
2034-351999-00 2004-05 2009-10 2014-15 2019-20 2024-25 2029-30
Exports
Domesticconsumption
Year
12-6139-3
Production andimports from JDPA
Figure 3: Outlook to 2035 for the Australian gas marketNote: adjusted for stock changes and statistical discrepancy Source: ABARES 2011, BREE 2011a
0
500
1000
1500
2000
2500
3000
PJ
0
10
20
30
40
%
1999-00
2034-35
2001-02
2003-04
2005-06
2007-08
2009-10
Year
Share of total(%)
Primary consumption(PJ)
12-6139-4
Figure 4: Outlook to 2035 for Australian gas consumptionSource: ABARES 2011, BREE 2011a
BOX 1 NATURAL GAS CHEMISTRY AND FORMATION
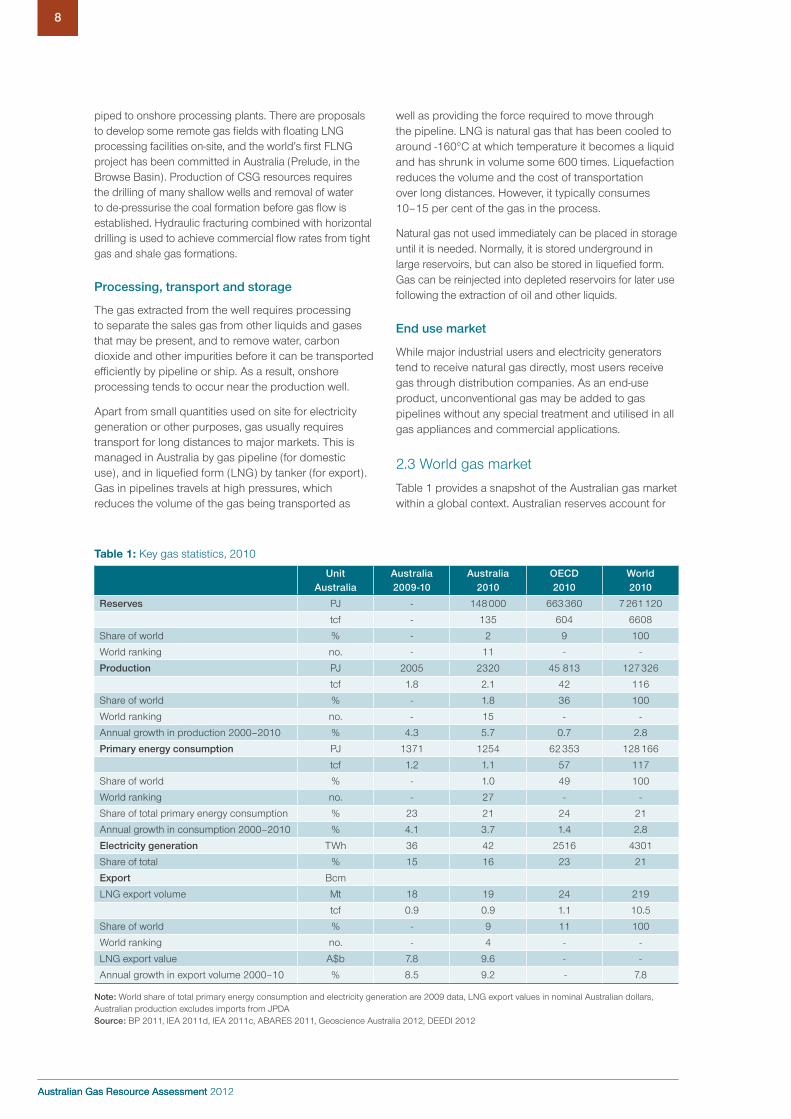
Natural gas is composed of a mixture of combustible hydrocarbon gases (figure 5). These include methane (CH4), ethane (C2H6), propane (C3H8), butane (C4H10) and condensate (C5+). Most natural gas is methane but because of the variable additions of the heavier hydrocarbons, gas accumulations vary in their energy content and value (Geoscience Australia and ABARE, 2010, Appendix E).
Liquefied Natural Gas (LNG) is primarily composed of the lightest hydrocarbons, methane (CH4) and ethane (C2H6). It is produced by cooling natural gas to around -160°C where it condenses to a liquid taking up about 1/600th the volume of natural gas in the gaseous state.
Liquefied Petroleum Gas (LPG) is a mixture of the light hydrocarbons propane (C3H8) and butane (C4H10) and it is normally a gas at surface conditions, though it is stored and transported as a liquid under pressure (for example in domestic barbecue gas bottles). Condensate is a mixture of pentane (C5H12) and heavier hydrocarbons that condense at the surface when a gas accumulation is produced. The gas liquids, LPG and condensate, are discussed in Geoscience Australia and ABARE (2010; Chapter 13 - Oil).
Natural gas is formed by the alteration of organic matter. This can occur through biogenic or thermogenic processes. The bacterial decomposition of organic matter in oxygen-poor environments in the shallow subsurface produces biogenic gas, for example landfill gas – see Geoscience Australia and ABARE 2010 (Chapter 12 - Bioenergy). Biogenic gas is very ‘dry’, being almost pure methane.
Thermogenic natural gas is derived from the thermal alteration of organic matter buried deep within sedimentary basins over geological time. Thermogenic gas is generated with oil as the organic matter is heated and buried; with further burial and heating, oil will be ‘cracked’ to gas and
pyrobitumen. Hence, natural gas is preserved within a sedimentary basin over a greater depth and temperature range than oil.
There are isotopic methods to distinguish biogenic from thermogenic gas. Evidence of thermogenic gas indicates that a petroleum system is working and leaves open the possibility that oil may also occur. Most Australian conventional gas accumulations are considered to be thermogenic in origin (Boreham et al. 2001), though some of the dry gas accumulations such as Tubridgi in the onshore Carnarvon Basin (Boreham et al. 2008) have a biogenic source input. A significant biogenic contribution is recognised in Australian coal seam gas (Draper and Boreham 2006).
LNG
LPG
C
C
MethaneCH
Gas atsurface
Liquid atsurface
EthaneC H
Butane
Propane
C H
C H
Condensateand oil
Gas insubsurface
Liquid insubsurface
4
62
3 8
4 10
35
5+
12-6139-5
Figure 5: Petroleum resources nomenclature in terms of chemical composition, commercial product, physical state in the subsurface and physical state at the surfaceSource: Geoscience Australia
Australian Gas Resource Assessment 2012
5Australian Gas Resources 2012
Australian Gas Resource Assessment 2012
5
Gas hydrates are a potential unconventional gas resource. Gas hydrates are naturally occurring ice-like solids (clathrates) in which water molecules trap gas molecules in deep-sea sediments or in and below the permafrost soils of the polar regions.
Liquefied natural gas (LNG) is natural gas that is cooled to around -160°C until it forms a liquid, to make it easier and cheaper to transport long distances in LNG tankers to markets.
As an end-use product, unconventional gas is the same as conventional natural gas. It can be added to natural gas pipelines without any special treatment and utilised in all natural gas applications such as electricity generation and commercial operations.
2.2 Gas supply chain
Figure 6 illustrates the simplified operation of the gas industry in Australia. Resources are delivered to domestic and export markets through the successive activities of exploration, development, production, processing and transport. While different technologies can be used for extracting CSG and other unconventional gas, once extracted it is similar to conventional natural gas, and the supply chain is the same.
Resources and exploration
Exploration for conventional gas follows the same process as for oil. Geoscientists identify areas where hydrocarbons are likely to be trapped in the subsurface, that is in sedimentary basins of sufficient thickness to contain mature petroleum source rocks as well as suitable reservoir and seal rocks in trap configurations. The search narrows from broad regional geological studies through to determining an individual drilling target. Reflection seismic is the primary technology used to identify likely hydrocarbon-bearing structures in the sub-surface (figure 7). There must also be evidence of a working petroleum system (box 2). Such evidence includes the presence of other petroleum discoveries in the case of a proven basin, or indications of the presence of organic-rich rock to act as a gas source in the case of frontier basins. Drilling is required to test whether the potential hydrocarbon trap contains oil or gas, both, or neither. Successful wells are commonly tested to recover a sample of the hydrocarbons for analysis to determine gas quality (liquids content, presence of CO
2) and to determine likely production rates. The initial discovery well may be followed by appraisal drilling and/or the collection of further survey data to help determine the extent of the accumulation.
In Australia, government has taken a key role in providing regional pre-competitive data to encourage private sector investment in exploration. Company access to prospective exploration areas is by competitive bidding, usually in terms of proposed work program, or by taking equity (‘farming-in’) in existing acreage holdings.
2 Background information and world market
2.1 Definitions
Natural gas is a combustible mixture of hydrocarbon gases. It consists mainly of methane (CH4), with varying levels of heavier hydrocarbons and other gases such as carbon dioxide. Natural gas is formed by the alteration of organic matter (box 1). When accumulated in a subsurface reservoir that can be readily produced it is known as conventional gas. Conventional gas can also be found with oil in oil fields. Conventional gas fields can be dry (almost pure methane) or wet (associated with the ‘wet gas’ components – ethane, propane, butanes and condensate). Dry gas has a lower energy content than wet gas. Natural gas can also be found in more difficult to extract unconventional deposits, such as coal beds (coal seam gas), or in shales (shale gas), low quality reservoirs (tight gas), or as gas hydrates (box 2).
Coal seam gas (CSG) is naturally occurring methane in coal seams. It is also referred to as coal seam methane (CSM) and coal bed methane (CBM). Methane released as part of coal mining operations is called coal mine methane (CMM). Coal seam gas is dry gas, being almost entirely methane. The gas molecules are trapped in the coal, adsorbed onto the coal surfaces or as free gas in cleats and micropores, held in place by reservoir and water pressure.
Tight gas occurs within low permeability reservoir rocks, that is rocks with matrix porosities of 10 per cent or less and permeabilities of 0.1 millidarcy (mD) or less, exclusive of fractures (Sharif 2007). In practice it is a poorly defined category that merges with conventional and shale gas, but generally tight gas can be considered as being found in low permeability reservoirs that require large scale hydraulic fracture treatments and/or horizontal wells to produce at economic flow rates or to recover economic volumes (Holditch 2006). Tight gas can be regionally distributed (for example, basin-centred gas), or accumulated in a smaller structural closure or stratigraphic trap as in conventional gas fields.
Shale gas is natural gas which has not migrated to a reservoir rock but is still contained within low permeability, organic-rich source rocks such as shales and fine-grained carbonates. Natural or hydraulically induced fracture networks are needed to produce shale gas at economic rates.
Basin-centred gas is a term used to describe “regionally pervasive gas accumulations that are abnormally pressured, commonly lack a downdip water contact and have low permeability reservoirs” (Law 2002). In the deeper parts of basins that are actively generating gas there can be hundreds of metres of stacked reservoirs of different lithologies with gas in tight sandstones, siltstones, shales and coals.

Australian Gas Resource Assessment 2012
6
Australian Gas Resource Assessment 2012
6
Most of Australia’s conventional gas exploration occurs in the offshore basins, sometimes in water depths beyond 1000 m and with target depths from about 2000 to over 4000 m below the sea floor. The search for CSG, tight gas and shale gas is restricted to onshore basins and target depths range from a few hundred metres to about 1200 m for CSG and down to depths of 4000 m or greater for tight and shale gas. The costs of the different exploration components – especially seismic and drilling – vary markedly depending on the scope and location of the project, logistics, and other factors. Many shallow CSG wells can be drilled for the cost of one deep well in deep water.
For example, an offshore well drilled to 3000–4000 m in water depths of 100–200 m typically costs $30–50 million (roughly $1 million per day of drilling), depending on location, water depth and other considerations. Shallow wells drilled to 200–1000 m in CSG exploration and development typically cost around $300 000 to $1 million (around $1000 per metre) with an average cost of around $500 000 per well (company reports and Geoscience Australia estimates).
Development and production
Once a decision to proceed has been made and financial and regulatory requirements addressed, infrastructure and production facilities are developed. For offshore conventional gas accumulations this involves the construction of offshore production facilities with the gas
Exploration for unconventional gas differs somewhat from the search for conventional hydrocarbons, especially when the target is a broadly distributed stratigraphic formation such as a coal bed or shale. Seismic surveys and drilling still constitute the major exploration technologies. However, the distribution of the prospective formation is usually well known at the regional scale, and exploration success depends on identifying parts of the formation where the gas resource and reservoir quality are sufficient to sustain a flow of gas on a commercial scale.
2
3Two-
way
tim
e (s
)
4
0 3 km
Seismic expression ofpossible gas reservoir
12-6139-7
Figure 7: Seismic section across a prospective gas accumulation on the Exmouth Plateau, Carnarvon BasinSource: Williamson and Kroh 2007
End Use MarketResource and Exploration
Industry
Commercial
Residential
ElectricityGeneration
Pipeline
Export market
Domestic market
ProcessingPlant
LNG Plant WorldMarket
LNGTanker
Project
Pipeline
12-6139-6
Development andProduction
Processing, Transport,Storage
Explorationdecision
Developmentdecision
IdentifiedresourcesUndiscovered
resources
Figure 6: Australia’s gas supply chainSource: BREE and Geoscience Australia

Australian Gas Resource Assessment 2012
7Australian Gas Resources 2012
Australian Gas Resource Assessment 2012
7
A A’TrapTrapTrap
Geographic extent of petroleum systemPresent day
Overburden
Seal
Reservoir
Source
Underlying sequence Top of gas window
Basement
Stratigraphic extentof petroleum system
Gas accumulation
Shale gas potential
12-6139-8
Figure 8: Petroleum system elements Source: Modified after Magoon and Dow 1994
BOX 2 PETROLEUM SYSTEMS AND RESOURCE PYRAMIDS
Conventional accumulations of oil and gas are the products of a ‘petroleum system’ (Magoon and Dow 1994). The critical elements of a petroleum system (figure 8) are:
• source – an organic-rich rock, such as an organic-rich mudstone;
• reservoir – porous and permeable rock, such as sandstone;
• seal – an impermeable rock such as a shale;
• trap – a sub-surface structure that contains the accumulation, such as a fault block or anticline;
• overburden – sediments overlying the source rock required for its thermal maturation; and
• migration pathways to link the mature source to the trap.
In addition to these static elements, the actual processes involved – trap formation, hydrocarbon generation, expulsion, migration, accumulation and preservation – must occur, and in the correct order, for the petroleum system to operate successfully and gas and oil accumulations to be formed and preserved.
Unconventional gas accumulations reflect the failure or under-performance of the petroleum system. Shale gas and coal seam gas arise where the natural gas is still within the source rock, not having migrated to a porous and permeable reservoir. Tight gas accumulations are within a poor quality reservoir. The petroleum resource pyramid (McCabe 1998) illustrates how a smaller volume of easy to extract conventional gas and oil is underpinned by larger volumes of more difficult and more costly to
extract unconventional gas and oil (figure 9). For the unconventional hydrocarbon resources additional technology, energy and capital has to be applied to extract the gas or oil, replacing the action of the geological processes of the petroleum system. Technological developments and rises in price can make the lower parts of the resource pyramid accessible and commercial to produce. The recent development of oil sands in Canada and of shale gas in the United States are examples where rising energy prices and technological development has facilitated the exploitation of unconventional hydrocarbon resources lower in the pyramid.
Shale oil Gas hydrates
Conv.oil
Conv.gas
Increased breakevenprice required
Increased technologyrequirements
Heavy oil
Tar sands
Smaller volumes,easy to develop
Larger volumes,difficult todevelop
12-6139-9
Coal-seamgas
Tight gasand shale gas
Figure 9: Petroleum resource pyramid Source: Geoscience Australia, adapted from McCabe 1998 and Branan 2008
Australian Gas Resource Assessment 2012
8
Australian Gas Resource Assessment 2012
8
well as providing the force required to move through the pipeline. LNG is natural gas that has been cooled to around -160°C at which temperature it becomes a liquid and has shrunk in volume some 600 times. Liquefaction reduces the volume and the cost of transportation over long distances. However, it typically consumes 10–15 per cent of the gas in the process.
Natural gas not used immediately can be placed in storage until it is needed. Normally, it is stored underground in large reservoirs, but can also be stored in liquefied form. Gas can be reinjected into depleted reservoirs for later use following the extraction of oil and other liquids.
End use market
While major industrial users and electricity generators tend to receive natural gas directly, most users receive gas through distribution companies. As an end-use product, unconventional gas may be added to gas pipelines without any special treatment and utilised in all gas appliances and commercial applications.
2.3 World gas market
Table 1 provides a snapshot of the Australian gas market within a global context. Australian reserves account for
piped to onshore processing plants. There are proposals to develop some remote gas fields with floating LNG processing facilities on-site, and the world’s first FLNG project has been committed in Australia (Prelude, in the Browse Basin). Production of CSG resources requires the drilling of many shallow wells and removal of water to de-pressurise the coal formation before gas flow is established. Hydraulic fracturing combined with horizontal drilling is used to achieve commercial flow rates from tight gas and shale gas formations.
Processing, transport and storage
The gas extracted from the well requires processing to separate the sales gas from other liquids and gases that may be present, and to remove water, carbon dioxide and other impurities before it can be transported efficiently by pipeline or ship. As a result, onshore processing tends to occur near the production well.
Apart from small quantities used on site for electricity generation or other purposes, gas usually requires transport for long distances to major markets. This is managed in Australia by gas pipeline (for domestic use), and in liquefied form (LNG) by tanker (for export). Gas in pipelines travels at high pressures, which reduces the volume of the gas being transported as
Table 1: Key gas statistics, 2010
UnitAustralia
Australia2009-10
Australia2010
OECD2010
World2010
Reserves PJ - 148 000 663 360 7 261 120
tcf - 135 604 6608
Share of world % - 2 9 100
World ranking no. - 11 - -
Production PJ 2005 2320 45 813 127 326
tcf 1.8 2.1 42 116
Share of world % - 1.8 36 100
World ranking no. - 15 - -
Annual growth in production 2000–2010 % 4.3 5.7 0.7 2.8
Primary energy consumption PJ 1371 1254 62 353 128 166
tcf 1.2 1.1 57 117
Share of world % - 1.0 49 100
World ranking no. - 27 - -
Share of total primary energy consumption % 23 21 24 21
Annual growth in consumption 2000–2010 % 4.1 3.7 1.4 2.8
Electricity generation TWh 36 42 2516 4301
Share of total % 15 16 23 21
Export Bcm
LNG export volume Mt 18 19 24 219
tcf 0.9 0.9 1.1 10.5
Share of world % - 9 11 100
World ranking no. - 4 - -
LNG export value A$b 7.8 9.6 - -
Annual growth in export volume 2000–10 % 8.5 9.2 - 7.8
Note: World share of total primary energy consumption and electricity generation are 2009 data, LNG export values in nominal Australian dollars, Australian production excludes imports from JPDA Source: BP 2011, IEA 2011d, IEA 2011c, ABARES 2011, Geoscience Australia 2012, DEEDI 2012

Australian Gas Resource Assessment 2012
9Australian Gas Resources 2012
Australian Gas Resource Assessment 2012
9
The IEA estimates that there are over 15.5 million PJ (14 124 tcf) of remaining recoverable resources of conventional gas (IEA 2011c). This is equivalent to around 120 years of production at current rates. Unconventional recoverable resources are estimated to be a similar size, bringing total gas reserves to around 250 years of production (IEA 2011a).
World gas production in 2010 was estimated at 127 326 PJ (116 tcf). The largest gas producers are the Russian Federation and the United States. Australia is the world’s fifteenth largest gas producer, accounting for around 1.8 per cent of world gas production (figure 10; IEA 2011d).
Consumption
Natural gas currently accounts for around 21 per cent of world primary energy consumption (IEA 2011c). World gas consumption has grown steadily over the past few decades, by around 2.9 per cent per year between 1971 and 2010 (IEA 2011d). Contributing factors include increased emphasis on environmental issues, which favours the clean combustion properties of gas relative to other fossil fuels, the uptake of technologies such as integrated gas combined cycle power plants, and the commercialisation of abundant gas reserves. Energy security and fuel diversification policies have helped encourage gas demand as a means of reducing dependence on imported oil.
Natural gas is used all around the world (figure 11). The largest gas consumers are the United States and the Russian Federation, followed by Iran, China and Japan. The Asia-Pacific region accounted for around 15 per cent of world natural gas consumption in 2010, with Australia accounting for around 1 per cent (IEA, 2011d).
In 2009, 40 per cent of world gas consumption was used for power generation, with the industry and residential sectors accounting for a further 17 per cent and 16 per cent respectively (IEA 2011c). The share of gas in total world electricity generation was 21 per cent in 2010, although this varies widely between countries (figure 11). In Australia, the share of gas in total electricity generation was around 15 per cent in 2009–10 (BREE 2012a).
Trade
With gas reserves located some distance from key gas consuming countries, world gas trade has increased as a proportion of total consumption. In 2010, 30 per cent of world gas consumption was supplied through international trade. Trade as a proportion of gas consumption is higher in the Asia Pacific region, where countries such as Japan and the Republic of Korea are totally reliant on imports for their gas needs.
LNG imports accounted for just under one third of world gas trade in 2010, equal to 9 per cent of world gas consumption; the remainder was transported
only a small share of global reserves, and Australia is a relatively small producer and consumer. However, natural gas reserves represent a substantial energy resource at the national level, and natural gas plays an important role in the Australian energy mix. Australia has also emerged as a significant player in world LNG trade.
Reserves and production
Proved world gas reserves – those quantities that geological and engineering information indicates with reasonable certainty can be recovered in the future from known reservoirs under existing economic and operating conditions – were estimated to be more than 7.3 million PJ (6608 tcf) at the end of 2010. At current rates of world production, this is sufficient for around 59 years (BP 2011). The Russian Federation, Iran and Qatar together hold more than half of the world’s proved gas reserves (figure10). Australia accounts for around 2 per cent of global reserves (table 1).
Saudi Arabia
Australia
United States
Russian Federation
Iran
Qatar
Turkmenistan
United Arab Emirates
0
Tcf300 600 900 1200 1500 2000
Tcf0 5 10 15 20 25
Australia
Russian Federation
United States
Canada
Iran
b) Gas production 2010
12-6139-10
a) Proven gas reserves to end 2010
Venezuela
Nigeria
Algeria
China
Norway
Indonesia
Qatar
Netherlands
Saudi Arabia
Uzbekistan
Malaysia
Egypt
Algeria
Figure 10: World natural gas reserves and production, major countries, 2010 (a Gas reserves, end 2010 b Gas production, 2010)Source a: BP 2011, Geoscience Australia Source b: IEA 2011d, Geoscience Australia

Australian Gas Resource Assessment 2012
10
Australian Gas Resource Assessment 2012
10
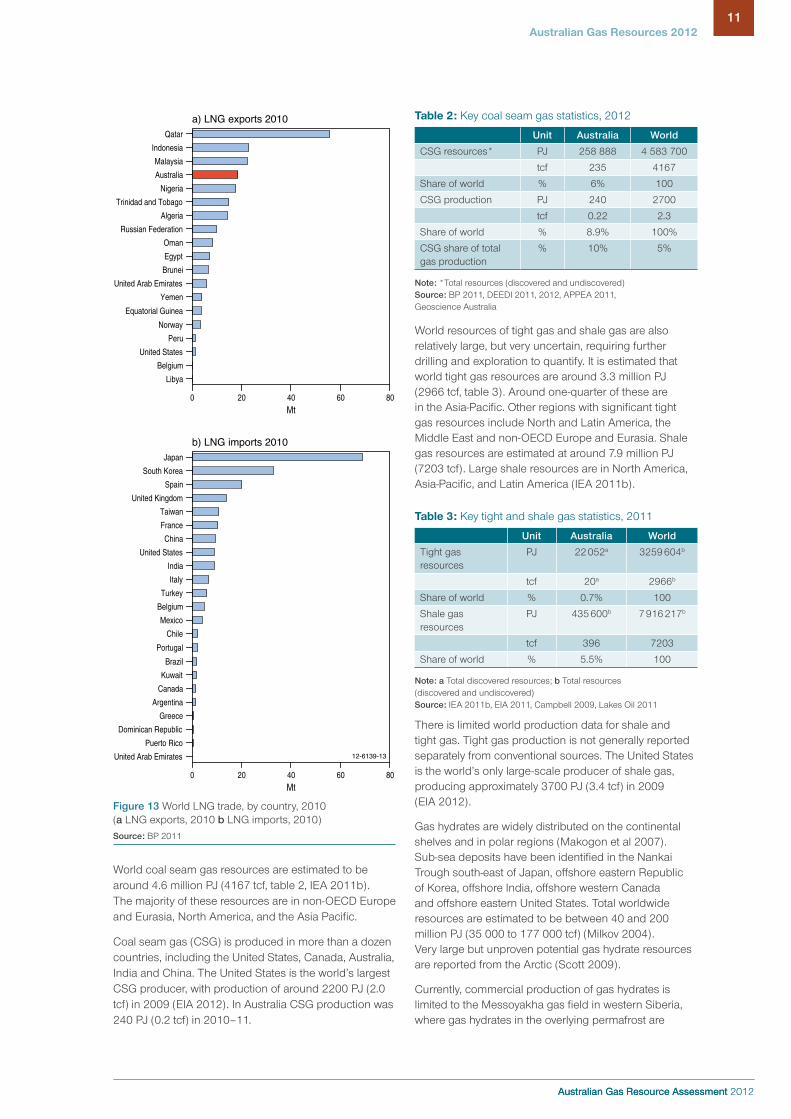
suppliers and buyers. In 2010 there were 23 countries importing LNG and 19 countries exporting LNG. Qatar is the world’s largest LNG exporter, accounting for a quarter of world trade in 2010 (figure 13; BP 2011). Malaysia and Indonesia are the second and third largest exporters accounting for a further 11 and 10 per cent of world trade in 2010, respectively. Japan is the world’s largest LNG importer, accounting for 31 per cent of the market (BP 2011). Australia is the world’s fourth largest LNG exporter, accounting for 9 per cent of world LNG trade in 2010, and 14 per cent of the Asian LNG imports (BP 2011).
The role of unconventional gas
Information about global unconventional gas resources is much less complete than for conventional resources, and is less reliable. Although the resources worldwide are thought to be very large, they are currently poorly quantified and mapped. Exploration and delineation of resources is still at an early stage.
According to the IEA, unconventional gas (including coal seam gas, shale gas and tight gas) now amounts to around half of recoverable gas resources, or around 16 million PJ (14 336 tcf; IEA 2011b). Around 20 per cent of these resources are in the Asia Pacific (including China, and Australia, 29 per cent in North America, and 23 per cent in non-OECD Europe and Eurasia (IEA 2011b).
Unconventional gas production accounted for 13 per cent of global gas production in 2010 (IEA 2011a). Growth in unconventional gas production has been especially strong in North America, particularly the United States. North American unconventional gas production totaled around 13 600 PJ (12.4 tcf) in 2010, which accounted for around 80 per cent of global unconventional production. In 2010, unconventional gas production represented more than half of total US gas production.
by pipeline. With fewer international pipelines in the Asia Pacific region, the share of gas trade met by LNG imports is much higher, at 84 per cent (around 31 per cent of consumption; IEA 2011d).
World LNG trade in 2010 was 11 514 PJ (219 Mt, 10.5 tcf) (figure 12; BP 2011). World LNG trade is characterised by a small but increasing number of
50
150
200
Mt
020102008200620042002200019981996
Year
World Australia12-6139-12
100
250
Figure 12: World LNG tradeSource: IEA 2011d, BP 2011
0
20
40
60
80
100
120
Tcf
1975 1980 1985 1990 1995 2000 2005
Non-OECDAsia Pacific
Middle East
Africa
Latin America
OECD AsiaPacific
OECD Europe
Year
a) Gas consumption by region
World
Non-OECD total
OECD total
China
Canada
France
India
Germany
Indonesia
Republic of Korea
United States
New Zealand
Japan
Spain
United Kingdom
Russian Federation
Mexico
Italy
Thailand
Singapore
0 20 40 60%
b) Gas share in electricity generation,selected countries 2010
Australia
80
12-6139-11
2010
Non-OECD Europeand Eurasia OECD Americas
Figure 11: World gas consumption and the role of gas in electricity generation (a Gas consumption by region b Gas share in electricity generation, selected countries, 2010)Note: shares in 11b for non-OECD and world data are 2009 data Source a: IEA 2011d Source b: IEA 2011d, BREE 2012b
Australian Gas Resource Assessment 2012
11Australian Gas Resources 2012
Australian Gas Resource Assessment 2012
11
World resources of tight gas and shale gas are also relatively large, but very uncertain, requiring further drilling and exploration to quantify. It is estimated that world tight gas resources are around 3.3 million PJ (2966 tcf, table 3). Around one-quarter of these are in the Asia-Pacific. Other regions with significant tight gas resources include North and Latin America, the Middle East and non-OECD Europe and Eurasia. Shale gas resources are estimated at around 7.9 million PJ (7203 tcf). Large shale resources are in North America, Asia-Pacific, and Latin America (IEA 2011b).
Table 3: Key tight and shale gas statistics, 2011
Unit Australia World
Tight gas resources
PJ 22 052a 3259 604b
tcf 20a 2966b
Share of world % 0.7% 100
Shale gas resources
PJ 435 600b 7 916 217b
tcf 396 7203
Share of world % 5.5% 100
Note: a Total discovered resources; b Total resources (discovered and undiscovered) Source: IEA 2011b, EIA 2011, Campbell 2009, Lakes Oil 2011
There is limited world production data for shale and tight gas. Tight gas production is not generally reported separately from conventional sources. The United States is the world’s only large-scale producer of shale gas, producing approximately 3700 PJ (3.4 tcf) in 2009 (EIA 2012).
Gas hydrates are widely distributed on the continental shelves and in polar regions (Makogon et al 2007). Sub-sea deposits have been identified in the Nankai Trough south-east of Japan, offshore eastern Republic of Korea, offshore India, offshore western Canada and offshore eastern United States. Total worldwide resources are estimated to be between 40 and 200 million PJ (35 000 to 177 000 tcf) (Milkov 2004). Very large but unproven potential gas hydrate resources are reported from the Arctic (Scott 2009).
Currently, commercial production of gas hydrates is limited to the Messoyakha gas field in western Siberia, where gas hydrates in the overlying permafrost are
World coal seam gas resources are estimated to be around 4.6 million PJ (4167 tcf, table 2, IEA 2011b). The majority of these resources are in non-OECD Europe and Eurasia, North America, and the Asia Pacific.
Coal seam gas (CSG) is produced in more than a dozen countries, including the United States, Canada, Australia, India and China. The United States is the world’s largest CSG producer, with production of around 2200 PJ (2.0 tcf) in 2009 (EIA 2012). In Australia CSG production was 240 PJ (0.2 tcf) in 2010–11.
Qatar
Malaysia
Indonesia
Algeria
Nigeria
Egypt
Oman
Equatorial Guinea
Norway
United States
0 20 40 80
Mt
Australia
Trinidad and Tobago
Yemen
a) LNG exports 2010
Russian Federation
Peru
Belgium
60
United States
0 20 40 80
Mt
Belgium
Italy
United Kingdom
Spain
60
Japan
b) LNG imports 2010
France
China
India
Turkey
Mexico
Chile
Kuwait
Brazil
Canada
Greece
Portugal
Argentina
Dominican Republic
12-6139-13
Brunei
United Arab Emirates
Libya
South Korea
Taiwan
United Arab Emirates
Puerto Rico
Figure 13 World LNG trade, by country, 2010 (a LNG exports, 2010 b LNG imports, 2010)Source: BP 2011
Table 2: Key coal seam gas statistics, 2012
Unit Australia World
CSG resources* PJ 258 888 4 583 700
tcf 235 4167
Share of world % 6% 100
CSG production PJ 240 2700
tcf 0.22 2.3
Share of world % 8.9% 100%
CSG share of total gas production
% 10% 5%
Note: *Total resources (discovered and undiscovered) Source: BP 2011, DEEDI 2011, 2012, APPEA 2011, Geoscience Australia
Australian Gas Resource Assessment 2012
12
Australian Gas Resource Assessment 2012
12
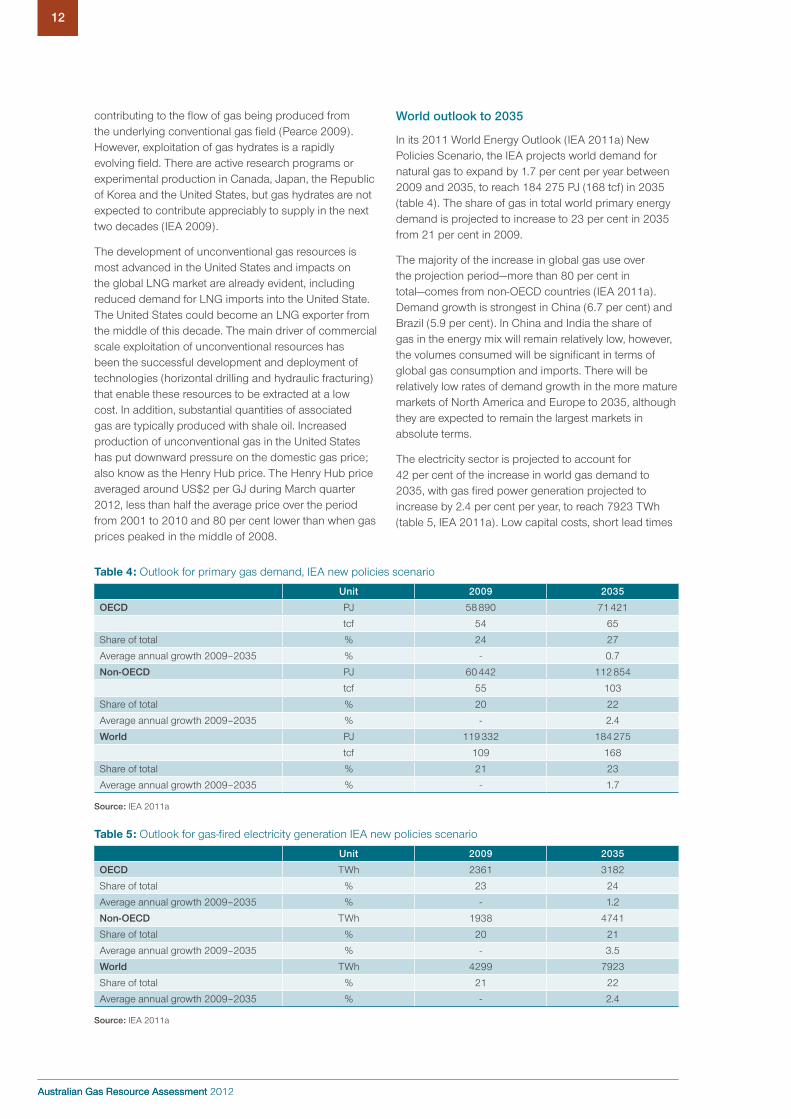
World outlook to 2035
In its 2011 World Energy Outlook (IEA 2011a) New Policies Scenario, the IEA projects world demand for natural gas to expand by 1.7 per cent per year between 2009 and 2035, to reach 184 275 PJ (168 tcf) in 2035 (table 4). The share of gas in total world primary energy demand is projected to increase to 23 per cent in 2035 from 21 per cent in 2009.
The majority of the increase in global gas use over the projection period—more than 80 per cent in total—comes from non-OECD countries (IEA 2011a). Demand growth is strongest in China (6.7 per cent) and Brazil (5.9 per cent). In China and India the share of gas in the energy mix will remain relatively low, however, the volumes consumed will be significant in terms of global gas consumption and imports. There will be relatively low rates of demand growth in the more mature markets of North America and Europe to 2035, although they are expected to remain the largest markets in absolute terms.
The electricity sector is projected to account for 42 per cent of the increase in world gas demand to 2035, with gas fired power generation projected to increase by 2.4 per cent per year, to reach 7923 TWh (table 5, IEA 2011a). Low capital costs, short lead times
contributing to the flow of gas being produced from the underlying conventional gas field (Pearce 2009). However, exploitation of gas hydrates is a rapidly evolving field. There are active research programs or experimental production in Canada, Japan, the Republic of Korea and the United States, but gas hydrates are not expected to contribute appreciably to supply in the next two decades (IEA 2009).
The development of unconventional gas resources is most advanced in the United States and impacts on the global LNG market are already evident, including reduced demand for LNG imports into the United State.The United States could become an LNG exporter from the middle of this decade. The main driver of commercial scale exploitation of unconventional resources has been the successful development and deployment of technologies (horizontal drilling and hydraulic fracturing) that enable these resources to be extracted at a low cost. In addition, substantial quantities of associated gas are typically produced with shale oil. Increased production of unconventional gas in the United States has put downward pressure on the domestic gas price; also know as the Henry Hub price. The Henry Hub price averaged around US$2 per GJ during March quarter 2012, less than half the average price over the period from 2001 to 2010 and 80 per cent lower than when gas prices peaked in the middle of 2008.
Table 4: Outlook for primary gas demand, IEA new policies scenario
Unit 2009 2035
OECD PJ 58 890 71 421
tcf 54 65
Share of total % 24 27
Average annual growth 2009–2035 % - 0.7
Non-OECD PJ 60 442 112 854
tcf 55 103
Share of total % 20 22
Average annual growth 2009–2035 % - 2.4
World PJ 119 332 184 275
tcf 109 168
Share of total % 21 23
Average annual growth 2009–2035 % - 1.7
Source: IEA 2011a
Table 5: Outlook for gas-fired electricity generation IEA new policies scenario
Unit 2009 2035
OECD TWh 2361 3182
Share of total % 23 24
Average annual growth 2009–2035 % - 1.2
Non-OECD TWh 1938 4741
Share of total % 20 21
Average annual growth 2009–2035 % - 3.5
World TWh 4299 7923
Share of total % 21 22
Average annual growth 2009–2035 % - 2.4
Source: IEA 2011a

Australian Gas Resource Assessment 2012
13Australian Gas Resources 2012
Australian Gas Resource Assessment 2012
13
underpinned by growth in China, India, Japan and the European Union, while increased exports will originate from Australia, Canada, the United States and, potentially, East Africa, the Eastern Mediterranean and Russian Federation.
Globally, around 85 Mt of additional LNG capacity is either committed or under construction (figure 14). Australia accounts for around two thirds of this new capacity.
3 Australia’s gas resources and market
3.1 Conventional gas resources
Australia’s identified conventional natural gas is a major energy resource with significant potential for further discoveries.
Australia’s conventional gas resources at the beginning of 2011 are presented in Table 6 under the McKelvey classification of economic and sub-economic demonstrated resources (Geoscience Australia 2012). Australia has around 173 000 PJ (157 tcf) of demonstrated gas resources, most of which are considered as EDR. These resources are located across fifteen basins, but the bulk of this resource (92 per cent) lies in the offshore basins along the north-west margin of Australia (figure 15), a geological region known as the North West Shelf (Purcell and Purcell, 1988) – the Bonaparte, Browse and Carnarvon basins (table 7). Similarly, the bulk of this amount is in ten super-giant fields, although more than 490 fields are included in the EDR and SDR compilation.
Table 6: Australian conventional gas resources, as of January 2011
Conventional Gas Resources PJ tcf
Economic Demonstrated Resources 113 400 103
Sub-economic Demonstrated Resources
59 600 54
Inferred Resources ~11 000 ~10
Total 184 000 167
Source: Geoscience Australia 2012
In addition to these demonstrated Australian conventional gas resources (EDR and SDR), another 11 000 PJ (10 tcf) are estimated to be in the inferred category, arising from recent discoveries and previous finds that require further appraisal.
Geologically Australian world class gas resources are related to the major delta systems that were deposited along the north-west margin during the Triassic and Jurassic periods as a prelude to Australia’s separation from Gondwana. The gas is contained in Mesozoic sandstone reservoirs and largely sourced from Triassic and Jurassic coaly sediments. Marine Cretaceous shales provide the regional seal for fault block and other traps.
and a relatively low environmental impact make gas-fired power generation an attractive option, particularly where uncertainties exist on longer term low emission technology requirements.
Global gas resources are sufficient to meet the projected increase in global demand, provided that the necessary investment in gas production and transport infrastructure is made. Production is expected to become more concentrated in the regions with large reserves, with more than one-fifth of the projected growth to come from the Middle East. Non-OECD economies are projected to account for over 90 per cent of increases in world production between 2009 and 2035.
The share of gas produced from unconventional gas sources is projected to rise from around 13 per cent in 2009 to nearly 22 per cent in 2035 (IEA 2011a). A significant proportion of this increase is expected to come from the United States where unconventional gas production has increased substantially in recent years. Output of unconventional production is also expected to increase in China, India, Australia and Europe, although the share of unconventional relative to conventional gas production in these regions remains small. The expected rise in unconventional gas sources has implications for prices and energy security, as well as energy trade.
Between 2009 and 2035, world (inter regional) gas trade is projected to increase by around 22 158 PJ (20.2 tcf) from around 15 522 PJ (14.1 tcf) in 2009 (IEA 2011a). Around 58 per cent of this increase is projected to come from pipeline imports with the remaining 42 per cent coming from LNG. Pipeline trade is expected to be supported by developments in central Asia (around the Caspian Sea) and Russian Federation that will transport gas to Europe and China.
LNG trade is projected to increase by around 9263 PJ (176 Mt, 8.4 tcf) between 2009 and 2035 to around 18 632 PJ (354 Mt, 17 tcf) (IEA 2011a). LNG imports over the outlook period are expected to be
300
250
200
150
100
50
0
Mtp
a
Existing
World Australia12-6139-14
Committed/under construction
Figure 14: World LNG export capacity, existing and committed Source: BREE 2012c, IEA 2011d, IEA 2011e
Australian Gas Resource Assessment 2012
14
Australian Gas Resource Assessment 2012
14
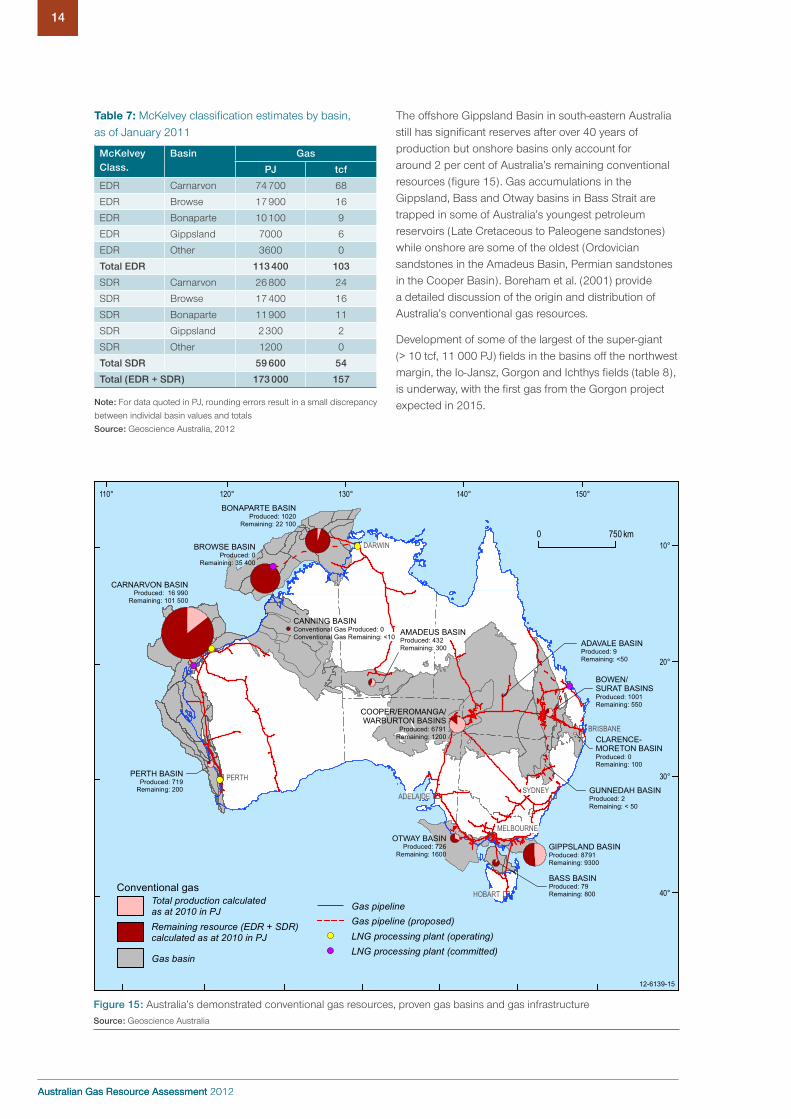
The offshore Gippsland Basin in south-eastern Australia still has significant reserves after over 40 years of production but onshore basins only account for around 2 per cent of Australia’s remaining conventional resources (figure 15). Gas accumulations in the Gippsland, Bass and Otway basins in Bass Strait are trapped in some of Australia’s youngest petroleum reservoirs (Late Cretaceous to Paleogene sandstones) while onshore are some of the oldest (Ordovician sandstones in the Amadeus Basin, Permian sandstones in the Cooper Basin). Boreham et al. (2001) provide a detailed discussion of the origin and distribution of Australia’s conventional gas resources.
Development of some of the largest of the super-giant (> 10 tcf, 11 000 PJ) fields in the basins off the northwest margin, the Io-Jansz, Gorgon and Ichthys fields (table 8), is underway, with the first gas from the Gorgon project expected in 2015.
Table 7: McKelvey classification estimates by basin, as of January 2011
McKelveyClass.
Basin Gas
PJ tcf
EDR Carnarvon 74 700 68
EDR Browse 17 900 16
EDR Bonaparte 10 100 9
EDR Gippsland 7000 6
EDR Other 3600 0
Total EDR 113 400 103
SDR Carnarvon 26 800 24
SDR Browse 17 400 16
SDR Bonaparte 11 900 11
SDR Gippsland 2 300 2
SDR Other 1200 0
Total SDR 59 600 54
Total (EDR + SDR) 173 000 157
Note: For data quoted in PJ, rounding errors result in a small discrepancy
between individal basin values and totals
Source: Geoscience Australia, 2012
BASS BASINProduced: 79Remaining: 800
BROWSE BASINProduced: 0
Remaining: 35 400
BONAPARTE BASINProduced: 1020
Remaining: 22 100
BOWEN/SURAT BASINSProduced: 1001Remaining: 550
GIPPSLAND BASINProduced: 8791Remaining: 9300
COOPER/EROMANGA/WARBURTON BASINS
Produced: 6791Remaining: 1200
AMADEUS BASINProduced: 432Remaining: 300
CARNARVON BASINProduced: 16 990
Remaining: 101 500
ADAVALE BASINProduced: 9Remaining: <50
GUNNEDAH BASINProduced: 2Remaining: < 50
OTWAY BASINProduced: 726
Remaining: 1600
PERTH BASINProduced: 719
Remaining: 200
CLARENCE-MORETON BASINProduced: 0Remaining: 100
CANNING BASINConventional Gas Produced: 0Conventional Gas Remaining: <10
PERTHSYDNEY
DARWIN
HOBART
ADELAIDE
BRISBANE
MELBOURNE
150°140°130°120°110°
10°
20°
30°
40°
12-6139-15
0 750 km
Conventional gas
Remaining resource (EDR + SDR)calculated as at 2010 in PJ
Total production calculatedas at 2010 in PJ
Gas basin
Gas pipeline (proposed)Gas pipeline
LNG processing plant (committed)LNG processing plant (operating)
Figure 15: Australia’s demonstrated conventional gas resources, proven gas basins and gas infrastructureSource: Geoscience Australia
Australian Gas Resource Assessment 2012
15Australian Gas Resources 2012
Australian Gas Resource Assessment 2012
15
Additions to Demonstrated Resources
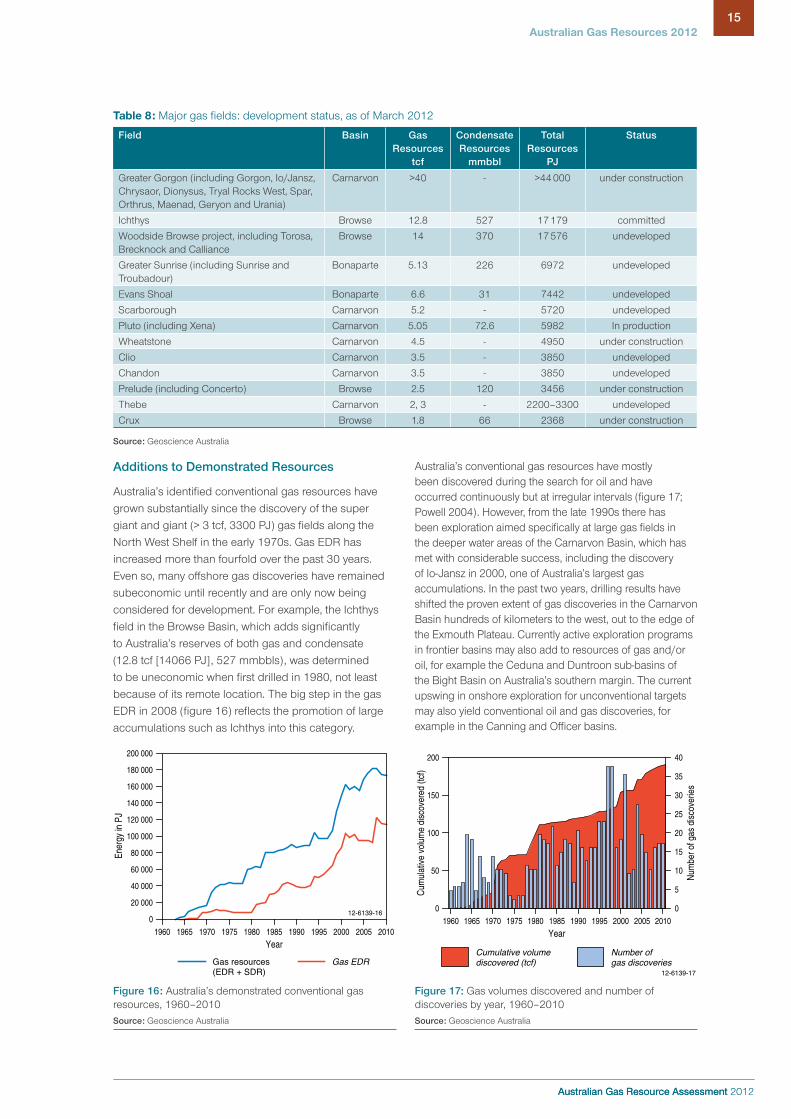
Australia’s identified conventional gas resources have grown substantially since the discovery of the super giant and giant (> 3 tcf, 3300 PJ) gas fields along the North West Shelf in the early 1970s. Gas EDR has increased more than fourfold over the past 30 years. Even so, many offshore gas discoveries have remained subeconomic until recently and are only now being considered for development. For example, the Ichthys field in the Browse Basin, which adds significantly to Australia’s reserves of both gas and condensate (12.8 tcf [14066 PJ], 527 mmbbls), was determined to be uneconomic when first drilled in 1980, not least because of its remote location. The big step in the gas EDR in 2008 (figure 16) reflects the promotion of large accumulations such as Ichthys into this category.
Table 8: Major gas fields: development status, as of March 2012
Field Basin Gas Resources
tcf
Condensate Resources
mmbbl
Total Resources
PJ
Status
Greater Gorgon (including Gorgon, Io/Jansz, Chrysaor, Dionysus, Tryal Rocks West, Spar, Orthrus, Maenad, Geryon and Urania)
Carnarvon >40 - >44 000 under construction
Ichthys Browse 12.8 527 17 179 committed
Woodside Browse project, including Torosa, Brecknock and Calliance
Browse 14 370 17 576 undeveloped
Greater Sunrise (including Sunrise and Troubadour)
Bonaparte 5.13 226 6972 undeveloped
Evans Shoal Bonaparte 6.6 31 7442 undeveloped
Scarborough Carnarvon 5.2 - 5720 undeveloped
Pluto (including Xena) Carnarvon 5.05 72.6 5982 In production
Wheatstone Carnarvon 4.5 - 4950 under construction
Clio Carnarvon 3.5 - 3850 undeveloped
Chandon Carnarvon 3.5 - 3850 undeveloped
Prelude (including Concerto) Browse 2.5 120 3456 under construction
Thebe Carnarvon 2, 3 - 2200–3300 undeveloped
Crux Browse 1.8 66 2368 under construction
Source: Geoscience Australia
0
Ener
gy in
PJ
20 000
40 000
60 000
80 000
200 000
180 000
160 000
140 000
120 000
100 000
20101960 1965 1970 1975 1980 1985 1990 1995 2000 2005
Year
Gas EDRGas resources(EDR + SDR)
12-6139-16
Figure 16: Australia’s demonstrated conventional gas resources, 1960–2010Source: Geoscience Australia
0
50
100
150
200
Cum
ulat
ive
volu
me
disc
over
ed (t
cf)
35
30
25
20
15
10
5
40
0
Num
ber o
f gas
dis
cove
ries
1960 1965 1970 1975 1980 1985 1990 1995 2000 2005 2010
Year
12-6139-17
Cumulative volumediscovered (tcf)
Number ofgas discoveries
Figure 17: Gas volumes discovered and number of discoveries by year, 1960–2010Source: Geoscience Australia
Australia’s conventional gas resources have mostly been discovered during the search for oil and have occurred continuously but at irregular intervals (figure 17; Powell 2004). However, from the late 1990s there has been exploration aimed specifically at large gas fields in the deeper water areas of the Carnarvon Basin, which has met with considerable success, including the discovery of Io-Jansz in 2000, one of Australia’s largest gas accumulations. In the past two years, drilling results have shifted the proven extent of gas discoveries in the Carnarvon Basin hundreds of kilometers to the west, out to the edge of the Exmouth Plateau. Currently active exploration programs in frontier basins may also add to resources of gas and/or oil, for example the Ceduna and Duntroon sub-basins of the Bight Basin on Australia’s southern margin. The current upswing in onshore exploration for unconventional targets may also yield conventional oil and gas discoveries, for example in the Canning and Officer basins.

Australian Gas Resource Assessment 2012
16
Australian Gas Resource Assessment 2012
16
0
20
40
60
80
100
Year
s re
mai
ning
1975 20101980 1985 1990 1995 2000 2005
12-6139-18
Year
Figure 18: Conventional gas EDR to production in years of remaining production, 1975–2010Source: Geoscience Australia
Table 9: CSG resources, as of January 2011
CSG Resources PJ tcf
Economic Demonstrated Resources
35 905 33
Sub-economic Demonstrated Resources
65 529 60
Inferred Resources 122 020 111
Total 223 454 203
Source: DEEDI (2011, 2012), AEMO (2011), Geoscience Australia
Resource life
The gas reserves to production ratio (R/P ratio) is a measure of the remaining years of production from current economic demonstrated resources (EDR) at current production levels. Since production was established and stabilised in the mid-1970s, the EDR to production ratio for conventional gas has fluctuated between 20 and 80 years. Major discoveries in the 1980s and in the late 1990s and early 2000s (figure 17) have been sufficient to maintain an inventory of more than 40 years of production since the mid-1980s (figure 18) despite the export LNG industry being established and expanded over this time frame.
At the end of 2010, at current levels of production, Australia had 54 years of conventional gas remaining; this R/P ratio is set to decline as production approximately doubles with the commissioning of 5 new LNG projects along the north-west margin over the next few years.
Overall the plot of gas discoveries by year against cumulative volume discovered shows a strong record of discovery and addition of new resources, with the cumulative volume of resources found climbing steadily over the last five years (figure 17).
BOWEN BASINCoal seam gas 8330
SURAT BASINCoal seam gas 24 671
CLARENCE-MORETON BASINCoal seam gas 428
GUNNEDAH BASINCoal seam gas 1520
GLOUCESTER BASINCoal seam gas 669
SYDNEY BASINCoal seam gas 287
PERTHSYDNEY
DARWIN
HOBART
ADELAIDE
BRISBANE
MELBOURNE
12-6139-19
0 750 km
Coal seam gasCoal seam gas EDRas at 2010 in PJ
Coal seam gas basin
Gas pipelineGas pipeline (proposed)CSG-LNG processing plant(under construction)
150°140°130°120°
10°
20°
30°
40°
Figure 19: Location of Australia’s coal seam 2P gas reserves and gas infrastructureSource: DEEDI 2012, Geoscience Australia

Australian Gas Resource Assessment 2012
17Australian Gas Resources 2012
Australian Gas Resource Assessment 2012
17
3.2 Coal seam gas (CSG) resources
Australia’s identified CSG reserves have grown substantially in recent years. As at January 2012, the economic demonstrated resources of CSG in Australia were 35 905 PJ (33 tcf; table 9). In 2011, CSG accounted for about 24 per cent of the total gas EDR in Australia. Reserve life is around 150 years at current rates of production, however noting that production is projected to substantially increase with the establishment of the CSG LNG industry. In addition to EDR, Australia has substantial subeconomic demonstrated resources (65 529 PJ; 60 tcf: AEMO, 2011; table 9) and very large inferred CSG resources. There are even larger estimates of in-ground potential CSG resources, potentially in excess of 258 888 PJ (235 tcf; table 10).
Queensland has 33 001 PJ (or 92 per cent) of the reserves (DEEDI 2012), with the remaining 2904 PJ in New South Wales. Nearly all current reserves are contained in the Surat (69 per cent) and Bowen (23 per cent) basins with small amounts in the Clarence-Moreton (1 per cent), Gunnedah (4 per cent), Gloucester and Sydney basins (figures 19 and 20). The CSG productive coal measures are of Permian (Bowen, Gunnedah, Sydney and Gloucester basins) and Jurassic (Walloon Coal Measures of the Surat and Clarence-Moreton basins) age, although the Permian coals are of higher rank, more laterally continuous and have greater gas contents (Draper and Boreham 2006).
Over the past five to ten years, CSG exploration has increased substantially in Queensland and New South Wales as a result of the successful development of CSG production in Queensland. The search has expanded beyond the high rank Permian coals encouraged by the success in producing CSG from low rank coals in the United States. These successes have also stimulated exploration for CSG in South Australia, Tasmania, Victoria and Western Australia. Nonetheless, CSG exploration in Australia as a whole is still relatively immature. The current high levels of exploration have significantly increased known resources: in mid-2011 2P reserves are now over three times higher than in mid-2008 (figures 21 and 22).
PJ
35 000
30 000
25
0
5000
1996 2010
10
15
20
1996 1996 1996 1996 1996 1996
12-6139-21
CSG reserves
Year
000
000
000
000
Figure 21: CSG 2P reserves since 1996Source: DEEDI 2012, AEMO 2011, Geoscience Australia
Table 10: Total Australia gas resources
Resource Category
Conventional Gas Coal Seam Gas Tight Gas Shale Gas Total Gas
PJ tcf PJ tcf PJ tcf PJ tcf PJ tcf
EDR 113 400 103 35 905 33 - - - - 149 305 136
SDR 59 600 54 65 529 60 - - 2200 2 127 329 116
Inferred ~11 000 ~10 122 020 111 22 052 20 - - 155 072 141
All identified resources
184 000 167 223 454 203 22 052 20 2200 2 431 706 392
Potential in ground resource
unknown unknown 258 888 235 unknown unknown 435 600 396 694 488 631
Resources – identified, potential and undiscovered
184 000 167 258 888 235 22 052 20 435 600 396 900 540 819
Note: Conventional gas demonstrated resources as of January 2011; CSG demonstrated resources as of January 2012. Note CSG 2P reserves and 2C resources are used as proxies for EDR and SDR respectively Source: Geoscience Australia
Gloucester Basin 2%
12-6139-20
Sydney Basin 1%
Gunnedah Basin 4%
Clarence-Moreton Basin 1%
Bowen Basin23%
Surat Basin69%
Figure 20: CSG 2P Reserves by basinSource: DEEDI 2012, Geoscience Australia

Australian Gas Resource Assessment 2012
18
Australian Gas Resource Assessment 2012
18
Galilee Basin have 2P reserves. Other prospective basins include the Cooper Pedirka, Murray, Perth, Ipswich, Maryborough and Otway basins (figure 38).
3.3 Tight gas, shale gas and gas hydrates resources
Currently Australia has no reserves of tight gas, but identified in-place resources of tight gas are estimated at around 22 052 PJ (20 tcf; table 10). The largest known resources of tight gas are in low permeability sandstone reservoirs in the Perth, Cooper and Gippsland basins (figure 23). The Perth Basin is estimated to contain about 11 400 PJ (10 tcf) of tight gas, the Cooper Basin to contain about 8800 PJ (8 tcf) (Campbell 2009) and the Gippsland Basin is considered to contain approximately 1853 PJ (1.7 tcf) of tight gas (Lakes Oil 2011).
Tight gas resources in these established conventional gas-producing basins are located relatively close to infrastructure and are currently being considered for commercial production. Other occurrences of tight gas have been identified in more remote onshore basins and offshore. In general, Australian tight gas reservoirs are sandstones from a wide range of geological ages with low permeability due to primary lithology or later cementation.
During 2010-2011, CSG activity in Queensland continued at record levels with about 600 CSG production and exploration wells drilled (DEEDI 2012). Exploration in Queensland continues to concentrate in the Bowen, Galilee and Surat basins while in New South Wales exploration continues in the Sydney, Gunnedah, Gloucester and Clarence-Moreton basins. All except the
PJ
0
80
60
40
20
0
100
120
140
1998 2000 2002 2004 2006 2010
Res
ourc
e lif
e (y
ears
)
Year2008
160
Production (PJ) Resource life (years)
12-6139-22
50
100
150
200
250
Figure 22: CSG reserve life and production since 1996Source: DEEDI 2012, APPEA 2011, AEMO 2011, Geoscience Australia
Encounter
McARTHURBASIN
GEORGINABASIN
PERTH
SYDNEY
DARWIN
HOBART
ADELAIDE
BRISBANE
MELBOURNE
Warro
WombatGangellTrifon/North Seaspray
Gingin
Moomba
Holdfast
Big Lake
Whicher Range
150°140°130°120°
10°
20°
30°
40°
12-6139-23
0 750 km
Tight and Shale Gas
Gas pipeline (proposed)Gas pipeline
Gas basin Reported discoveries*
LNG processing plant (operating)LNG processing plant (committed)
Figure 23: Basins with tight gas and shale gas resource potential and gas infrastructureNote: * Shows the locations of all shale and tight gas discoveries with reported contingent resources. Source: Geoscience Australia
Australian Gas Resource Assessment 2012
19Australian Gas Resources 2012
Australian Gas Resource Assessment 2012
19
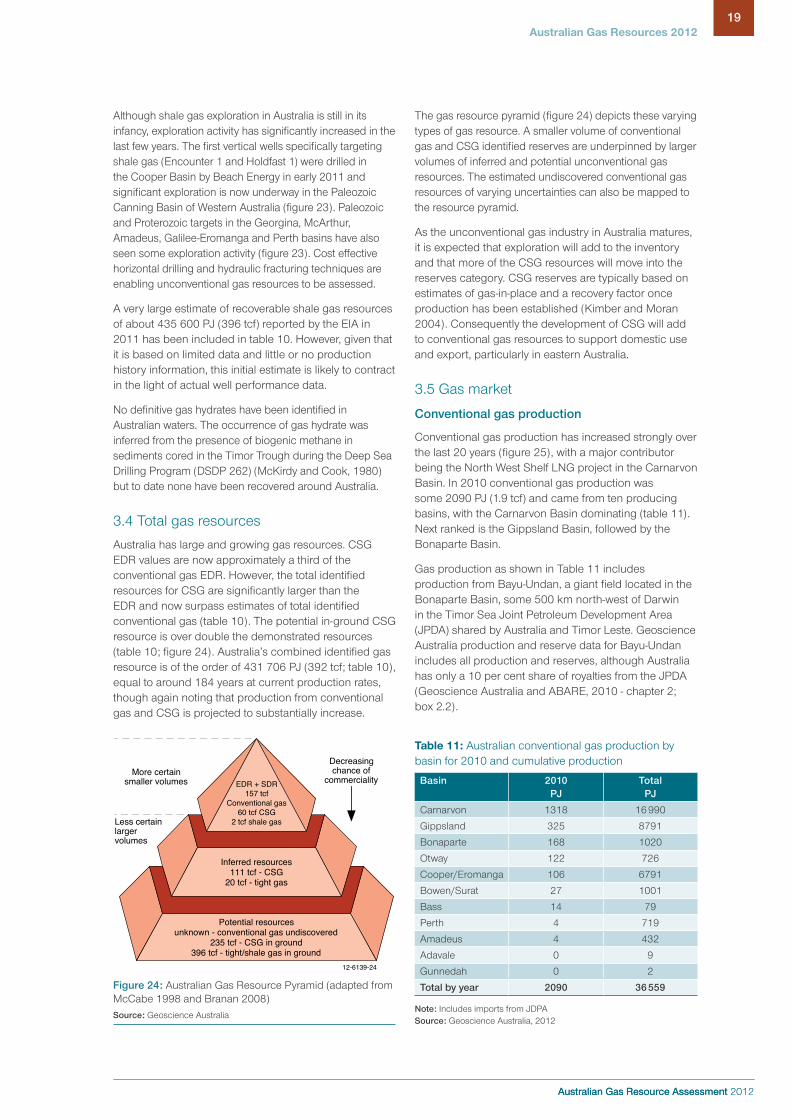
The gas resource pyramid (figure 24) depicts these varying types of gas resource. A smaller volume of conventional gas and CSG identified reserves are underpinned by larger volumes of inferred and potential unconventional gas resources. The estimated undiscovered conventional gas resources of varying uncertainties can also be mapped to the resource pyramid.
As the unconventional gas industry in Australia matures, it is expected that exploration will add to the inventory and that more of the CSG resources will move into the reserves category. CSG reserves are typically based on estimates of gas-in-place and a recovery factor once production has been established (Kimber and Moran 2004). Consequently the development of CSG will add to conventional gas resources to support domestic use and export, particularly in eastern Australia.
3.5 Gas market
Conventional gas production
Conventional gas production has increased strongly over the last 20 years (figure 25), with a major contributor being the North West Shelf LNG project in the Carnarvon Basin. In 2010 conventional gas production was some 2090 PJ (1.9 tcf) and came from ten producing basins, with the Carnarvon Basin dominating (table 11). Next ranked is the Gippsland Basin, followed by the Bonaparte Basin.
Gas production as shown in Table 11 includes production from Bayu-Undan, a giant field located in the Bonaparte Basin, some 500 km north-west of Darwin in the Timor Sea Joint Petroleum Development Area (JPDA) shared by Australia and Timor Leste. Geoscience Australia production and reserve data for Bayu-Undan includes all production and reserves, although Australia has only a 10 per cent share of royalties from the JPDA (Geoscience Australia and ABARE, 2010 - chapter 2; box 2.2).
Although shale gas exploration in Australia is still in its infancy, exploration activity has significantly increased in the last few years. The first vertical wells specifically targeting shale gas (Encounter 1 and Holdfast 1) were drilled in the Cooper Basin by Beach Energy in early 2011 and significant exploration is now underway in the Paleozoic Canning Basin of Western Australia (figure 23). Paleozoic and Proterozoic targets in the Georgina, McArthur, Amadeus, Galilee-Eromanga and Perth basins have also seen some exploration activity (figure 23). Cost effective horizontal drilling and hydraulic fracturing techniques are enabling unconventional gas resources to be assessed.
A very large estimate of recoverable shale gas resources of about 435 600 PJ (396 tcf) reported by the EIA in 2011 has been included in table 10. However, given that it is based on limited data and little or no production history information, this initial estimate is likely to contract in the light of actual well performance data.
No definitive gas hydrates have been identified in Australian waters. The occurrence of gas hydrate was inferred from the presence of biogenic methane in sediments cored in the Timor Trough during the Deep Sea Drilling Program (DSDP 262) (McKirdy and Cook, 1980) but to date none have been recovered around Australia.
3.4 Total gas resources
Australia has large and growing gas resources. CSG EDR values are now approximately a third of the conventional gas EDR. However, the total identified resources for CSG are significantly larger than the EDR and now surpass estimates of total identified conventional gas (table 10). The potential in-ground CSG resource is over double the demonstrated resources (table 10; figure 24). Australia’s combined identified gas resource is of the order of 431 706 PJ (392 tcf; table 10), equal to around 184 years at current production rates, though again noting that production from conventional gas and CSG is projected to substantially increase.
12-6139-24
Inferred resources111 tcf - CSG
20 tcf - tight gas
Potential resourcesunknown - conventional gas undiscovered
235 tcf - CSG in ground396 tcf - tight/shale gas in ground
EDR + SDR157 tcf
Conventional gas60 tcf CSG
2 tcf shale gas
More certainsmaller volumes
Less certainlargervolumes
Decreasingchance of
commerciality
Figure 24: Australian Gas Resource Pyramid (adapted from McCabe 1998 and Branan 2008) Source: Geoscience Australia
Table 11: Australian conventional gas production by basin for 2010 and cumulative production
Basin 2010 PJ
Total PJ
Carnarvon 1318 16 990
Gippsland 325 8791
Bonaparte 168 1020
Otway 122 726
Cooper/Eromanga 106 6791
Bowen/Surat 27 1001
Bass 14 79
Perth 4 719
Amadeus 4 432
Adavale 0 9
Gunnedah 0 2
Total by year 2090 36 559
Note: Includes imports from JDPA Source: Geoscience Australia, 2012

Australian Gas Resource Assessment 2012
20
Australian Gas Resource Assessment 2012
20
Unconventional gas production
Separate commercial production of CSG is relatively new, beginning in the United States in the 1970s. Exploration for CSG in Australia began in 1976. In February 1996 the first commercial coal mine methane (CMM) drainage operation commenced at the Moura mine (then owned by BHP Mitsui Coal Pty Ltd) in Queensland. In the same year, at the Appin and Tower underground mines (then owned by BHP Ltd) in New South Wales, a CMM operation was used to fuel on-site generator sets (gas-fired power stations). The first stand-alone commercial production of CSG in Australia commenced in December 1996 at the Dawson Valley project (then owned by Conoco), adjoining the Moura mine.
Australia’s annual CSG production has increased from 1 PJ in 1996 to 240 PJ (0.2 tcf) in 2010-11, around 10 per cent of Australia’s total gas production (figure 26). In the five years from mid-2006 to mid-2011 production has more than tripled. Of the 2010–11 production of CSG, Queensland produced 234 PJ (0.2 tcf) (or 97 per cent) from the Bowen (121 PJ, 0.1 tcf) and
Australia’s past conventional gas production has been overwhelmingly from the Carnarvon, Cooper and Gippsland basins with smaller contributions from the Perth, Bonaparte, Bowen, Amadeus, Otway, Surat and Adavale basins (table 11). Now that conventional gas production from the Cooper Basin is in decline, 87 per cent of production is from the three main offshore basins (Carnarvon, Gippsland and Bonaparte basins). Most (63 per cent) is from the Carnarvon Basin which contains the giant Goodwyn, North Rankin and Perseus accumulations that form part of the North West Shelf Venture Project. There is also production from the Perth, Bowen, Surat and Otway basins, as well as the Amadeus Basin which has supplied Darwin with gas. Gas production from a single field in the Adavale Basin, Gilmore, ceased in 2002. Conventional gas production in all basins, other than the Carnarvon and Bonaparte basins, is directed solely to domestic consumption.
Over the past six years, new fields have been developed in the Carnarvon, Otway, Bass and Gippsland basins. These fields have a production capacity per year of 664 PJ (0.6 tcf, table 12) and account for a substantial share of Australia’s conventional natural gas production (figure 26).
2500
2000
1500
1000
500
0
PJ
1980 1985 1990
Year1995 2000 2005 2010
12-6139-25
Figure 25: Conventional gas production, 1978–2010Source: Geoscience Australia
0
225
PJ
25
200
%
0
16
50
75
14
12
10
8
6
4
2
100
125
150
175
Year
CSG production (PJ)
Share of total gas consumption (%)
12-6139-26
1995-96
1997-98
1999-00
2001-02
2003-04
2005-06
2007-08
2009-10
Figure 26: Australian CSG production and share of total gas consumptionSource: ABARES 2011, BREE 2012b
BOX 3 STATISTICAL REPORTING ISSUES
Historical gas production data presented in this Australian energy resource assessment are from two sources. Figures that illustrate the historical balance of production, consumption and trade are derived from the 2011 Australian Energy Statistics (AES) (ABARES 2011a). Production in these figures refers to sales gas, which has been processed to remove impurities to a required standard for consumer use. Alternatively, figures that illustrate changes in historical production and reserves are derived from Geoscience Australia sources. GA production data generally refers to total produced gas.
The treatment of gas resources and production in the Joint Petroleum Development Area (JDPA) also differs between sources. The AES accounts for gas production in the JDPA as an import. LNG produced in Darwin from this gas is then exported. BREE’s energy projections (2011a) includes these imports from the JDPA in Australian gas production figures. Geoscience Australia also include JPDA in the resources and production totals.

Australian Gas Resource Assessment 2012
21Australian Gas Resources 2012
Australian Gas Resource Assessment 2012
21
Surat (113 PJ, 0.1 tcf) basins (DEEDI 2012). In New South Wales 6 PJ was produced from the Sydney Basin (APPEA 2011).
Gas is not currently produced from any specifically described tight gas field in Australia. However, some of the gas production from the Cooper and the Amadeus basin are from low porosity reservoirs. There are also several planned projects for commercial production of tight gas fields, notably in the Perth Basin in Western Australia. There is also no current production of shale gas or from gas hydrates.
Total gas consumption
Gas is the third largest contributor to Australia’s primary energy consumption after coal and oil. In 2009–10, gas accounted for 23 per cent of Australia’s primary energy consumption. Australia’s primary gas consumption increased from 74 PJ (0.1 tcf) in 1970–71 to 1371 PJ (1.2 tcf) in 2009–10 – an average rate of growth of 7.8 per cent per year (figure 27). The robust growth in gas consumption over this period mainly reflects sustained population growth and strong
1200
PJ
1000
200
400
600
800
0
5
10
15
25%
20
01970-71
Year
Share of total energy consumption (%)
12-6139-27
2009-101980-81 1990-91 2000-01
Gas consumption (PJ)
1400
Figure 27: Australian gas consumption and share of total primary energy consumptionSource: ABARES 2011
Table 12: Conventional gas projects recently completed, as at April 2012
Project Company Basin Start up Capacity (PJ pa)
John Brookes Santos Carnarvon 2005 88
Minerva BHP Billiton Otway 2005 55
Bassgas Origin Bass 2006 20
Casino Santos Otway 2006 33
Otway Woodside Otway 2007 60
Angel Woodside Carnarvon 2008 310
Blacktip ENI Australia Bonaparte 2009 44
Henry Santos/AWE/Mitsui Otway 2010 11
Longtom Nexus Energy Gippsland 2010 25
Halyard Apache Energy/Santos Carnarvon 2011 18
Reindeer gas field/Devil Creek gas processing plant (phase 1)
Apache Energy/Santos Carnarvon 2011 78
Source: BREE
Table 13: CSG projects recently completed, as at April 2012
Project Company Location Start up Capacity (PJ pa)
Capital Expenditure
Berwyndale South CSM Queensland Gas Company
Roma, Qld 2006 na $52 m
Argyle Queensland Gas Company
Roma, Qld 2007 7.4 $100 m
Spring Gully CSM project (phase 4)
Origin Energy Roma, Qld 2007 15 $114 m
Tipton West CSM project
Arrow Energy/Beach Petroleum/Australian Pipeline Trust
Dalby, Qld 2007 10 $119 m
Darling Downs development
APLNG (Origin/ConocoPhillips)
North of Roma, Qld
2009 44 (includes wells from Tallinga)
$500 m
Talinga Stage 2 APLNG (Origin/ConocoPhillips)
160 km E of Roma 2010 33 $260m
Source: BREE

Australian Gas Resource Assessment 2012
22
Australian Gas Resource Assessment 2012
22
Gas trade
Up until 1989–90, Australia consumed all of the natural gas that was produced domestically. Following the development of the North West Shelf Venture, gas, in the form of LNG, was exported to overseas markets. Around half of Australia’s gas production (currently sourced from offshore basins on the north-western margin) is now exported. In 2010–11, the volume of LNG exports was 1053 PJ (20 Mt, 1.0 tcf), valued at $10.4 billion. (BREE 2012a).
Japan is Australia’s major export market for LNG, followed by China and the Republic of Korea (figure 28). In 2010, Japan accounted for around 70 per cent of Australia’s LNG exports, followed by China (21 per cent) and South Korea 5 per cent (BP 2011). In contrast, Australia accounts for 19 per cent of Japan’s LNG total imports and 41 per cent of China’s LNG imports (BP 2011).
LNG projects are under construction in Queensland, and the first of these is expected to start exporting CSG LNG from 2014–15. Increased international LNG prices together with rapidly expanding CSG reserves in Queensland have recently improved the economics of developing LNG export facilities in eastern Australia. As of April 2012, there are three CSG sourced projects currently under construction which will have a combined capacity of 21 Mt a year (1095 PJ 1.0 tcf).
Gas supply-demand balance
The supply-demand balance presented in figure 29 incorporates production, domestic consumption and trade (exports). It highlights steady growth in domestic consumption, the increase in production associated with LNG exports and the emerging impact of CSG.
economic growth, as well as its competitiveness and government policies to support its uptake.
The manufacturing, electricity generation, mining and residential sectors are the major consumers of gas. The manufacturing sector is the largest consumer of gas and is comprised of a few large consumers, including metal product industries (mainly smelting and refining activities), the chemical industry (fertilisers and plastics), and the cement industry.
The share of gas-fired electricity has increased in recent years. Gas accounted for an estimated 15 per cent of electricity generation in 2009–10 (BREE 2012b). The mining sector is also a large consumer of gas in the process of creating LNG. The residential sector is characterised by a large number of small scale consumers. The major residential uses of gas include water heating, space heating and cooking.
Year
8
6
4
2
00
5
15
20
25
Mt
2011
-12
A$ b
illion
1989-90 1995-96 1998-99 2001-02 2004-05 2007-08 2010-11
a) Export volume and value
Volume (Mt) Value (A$ billion)
10
10
12
1992-93
12-6139-28
b) LNG exports by destination
Japan 69.7%
China 20.6%
Republic ofKorea 5.2%
Chinese Taipei 4.2% Other 0.4%
Figure 28: Australian LNG exports (a LNG exports, volume and value b LNG exports, by destination, 2010)Source a: BREE Source b: BP 2011
500
1000
1500
2000
PJ
0
3000
2500
2009-10
1970-71
Year
Exports
Consumption12-6139-29
1975-76
1980-81
1985-86
1990-91
1995-96
2000-01
2005-06
Production andimports from JDPA
Figure 29: Australia’s gas supply-demand balanceNote: adjusted for stock changes and statistical discrepancy Source: ABARES 2011
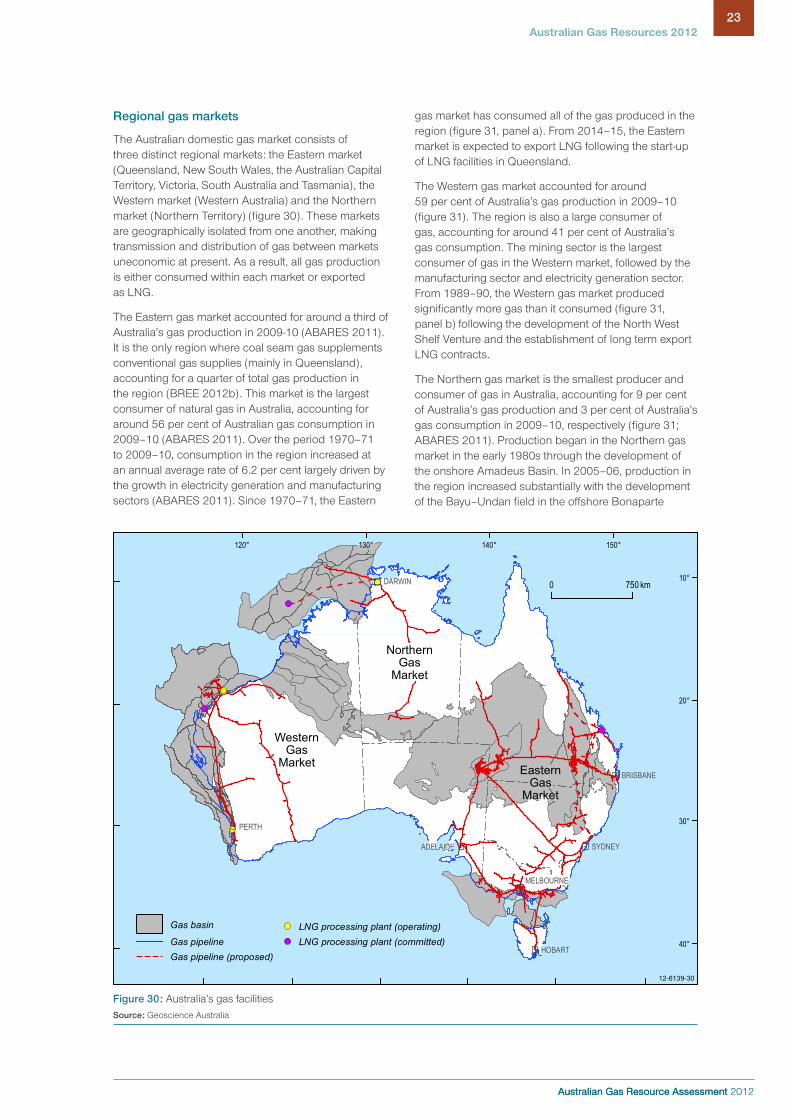
Australian Gas Resource Assessment 2012
23Australian Gas Resources 2012
Australian Gas Resource Assessment 2012
23
gas market has consumed all of the gas produced in the region (figure 31, panel a). From 2014–15, the Eastern market is expected to export LNG following the start-up of LNG facilities in Queensland.
The Western gas market accounted for around 59 per cent of Australia’s gas production in 2009–10 (figure 31). The region is also a large consumer of gas, accounting for around 41 per cent of Australia’s gas consumption. The mining sector is the largest consumer of gas in the Western market, followed by the manufacturing sector and electricity generation sector. From 1989–90, the Western gas market produced significantly more gas than it consumed (figure 31, panel b) following the development of the North West Shelf Venture and the establishment of long term export LNG contracts.
The Northern gas market is the smallest producer and consumer of gas in Australia, accounting for 9 per cent of Australia’s gas production and 3 per cent of Australia’s gas consumption in 2009–10, respectively (figure 31; ABARES 2011). Production began in the Northern gas market in the early 1980s through the development of the onshore Amadeus Basin. In 2005–06, production in the region increased substantially with the development of the Bayu–Undan field in the offshore Bonaparte
NorthernGas
Market
EasternGas
Market
WesternGas
Market
PERTH
SYDNEY
DARWIN
HOBART
ADELAIDE
BRISBANE
MELBOURNE
12-6139-30
0 750 km
Gas basin
Gas pipelineGas pipeline (proposed)
LNG processing plant (committed)LNG processing plant (operating)
150°140°130°120°
10°
20°
30°
40°
Figure 30: Australia’s gas facilitiesSource: Geoscience Australia
Regional gas markets
The Australian domestic gas market consists of three distinct regional markets: the Eastern market (Queensland, New South Wales, the Australian Capital Territory, Victoria, South Australia and Tasmania), the Western market (Western Australia) and the Northern market (Northern Territory) (figure 30). These markets are geographically isolated from one another, making transmission and distribution of gas between markets uneconomic at present. As a result, all gas production is either consumed within each market or exported as LNG.
The Eastern gas market accounted for around a third of Australia’s gas production in 2009-10 (ABARES 2011). It is the only region where coal seam gas supplements conventional gas supplies (mainly in Queensland), accounting for a quarter of total gas production in the region (BREE 2012b). This market is the largest consumer of natural gas in Australia, accounting for around 56 per cent of Australian gas consumption in 2009–10 (ABARES 2011). Over the period 1970–71 to 2009–10, consumption in the region increased at an annual average rate of 6.2 per cent largely driven by the growth in electricity generation and manufacturing sectors (ABARES 2011). Since 1970–71, the Eastern

Australian Gas Resource Assessment 2012
24
Australian Gas Resource Assessment 2012
24
4 Outlook to 2035 for Australia’s resources and marketThe outlook to 2035 is expected to see the continued growth in the use of gas in the Australian economy, as well as increased LNG exports. In the latest BREE long-term energy projections, gas is expected to increase its share of primary energy consumption to around 35 per cent (2611 PJ) in 2034–35, and account for 36 per cent of Australia’s electricity generation (figure 41; BREE 2011a). LNG exports are also projected to rise strongly to 5663 PJ (107Mt, 5.2 tcf) in 2034–35 (figure 3). Australia’s existing reserves are sufficient to meet these projected increases in domestic and export demand over the period to 2035. There is also scope for Australia’s reserves to expand further, with major new discoveries of conventional gas in offshore basins, the re-evaluation of the large CSG potential resources may lead to their reclassification into the economically demonstrated reserves category and the appraisal and development of tight and shale gas resources.
4.1 Key factors influencing the outlook
Broader economic, social and environmental considerations aside, the main factors impacting on the outlook for gas are prices, the geological characteristics of the resource (such as location, depth, quality), developments in technology, infrastructure issues and local environmental considerations.
Gas prices
The future price of gas is one of the main factors affecting both exploration and development of the resource. Australian gas producers have typically faced different prices for domestic and export gas. Domestic prices have historically been much lower than internationally traded LNG prices, although domestic gas prices have been rising in recent years.
For the domestic market, Australia has had some of the lowest cost gas in the world. These low gas prices are generally the result of mature long term contracts for output from the Cooper and Gippsland basins and the North West Shelf fields.
Australian gas prices have historically been relatively stable (table 14) because of provisions in long term contracts that include a defined base price that is periodically adjusted to reflect changes in an index such as the CPI. In addition, prices have been capped by the price of coal (a major competitor for use in electricity generation).
Domestic gas prices have increased over the past few years in response to a number of factors including:
• the expiration of mature long term contracts;
• increasing domestic consumption and export demand through the development of additional LNG facilities;
Basin. Mining and electricity generation account for the
vast majority of gas use in the Northern gas market.
Until 2005–06, all of the gas produced in the region
was consumed locally. Following the development of
the Darwin LNG plant, gas has also been exported
as LNG (figure 31, panel c). In September 2009, the
offshore Blacktip gas field in the Petrel Sub-basin of the
Bonaparte Basin, came on stream. Gas from this field is
piped onshore to a processing plant at Wadeye and then
to the Amadeus Basin-Darwin pipeline.
800
700
600
500
400
300
200
100
01970-71 1978-79 1986-87 1994-95 2002-03 2009-10
PJ
Year
1600
800
400
0
PJ
250
200
150
100
50
0
PJ
b) Western gas market
c) Northern gas market
a) Eastern gas market
12-6139-31
Consumption
ExportsTotal productionConventional production
1200
1970-71 1978-79 1986-87
Year1994-95 2002-03 2009-10
1970-71 1978-79 1986-87
Year1994-95 2002-03 2009-10
Figure 31: Regional gas market supply-demand balancesNote: production includes imports from JDPA. Adjusted for stock changes and statistical discrepancy Source: ABARES 2011

Australian Gas Resource Assessment 2012
25Australian Gas Resources 2012
Australian Gas Resource Assessment 2012
25
and Brisbane. While these gas markets allow supply or demand balances to be traded, the majority of gas is still negotiated through contractual arrangements.
LNG export contracts typically have a price component linked to world energy prices (such as crude oil prices) and also include the cost of processing and transport. LNG transport costs are both distance and time sensitive and, as such, can account for a significant proportion of overall LNG costs.
There have been three reasonably distinct global gas markets for LNG, each with its own pricing structure. In the United States, pipeline natural gas prices have been used as the basis for determining the competitiveness of LNG imports. Gas prices are generally traded against the Henry Hub price. In Europe, LNG prices are set against different sources of gas supply (indigenous production and pipeline imports from Russian Federation) and against other fuels such as low-sulphur residual fuel oil and coal. In the Asia Pacific region, Japanese crude oil prices have historically been used as the basis for setting the price of LNG under long term contracts. Asian prices are generally higher than prices elsewhere in the world.
Over the longer term, LNG prices in the Asia Pacific region are expected to remain linked to oil prices. Many of the sales and purchase agreements that have been recently signed for LNG exports from Australia are
• sustained pressure on exploration and development costs, that have increased the cost of development;
• the development of higher cost sources of gas (for example coal seam gas and deep offshore fields);
• the expected introduction of the Carbon Pricing Mechanism that will make gas a more valuable commodity relative to coal;
• high oil prices that have flowed through to Australian LNG contracts and accentuated the gap between domestic and international (netback) prices; and
• increasing network charges to reflect rising capital and operating expenditures of transmission and distribution.
Wholesale gas trading occurs through private negotiations between buyers and sellers. The terms, quantities and prices are confidential and can vary significantly across contracts. Typically these contracts contain take-or-pay components where shippers agree to pay for a specified quantity of gas, regardless of whether they are able to on-sell it.
Given the commercial nature of the contract negotiations between suppliers and consumers, there is very little publicly available contract price data. However, gas spot markets are a recent and valuable addition to Australia’s gas market framework, especially in terms of the price information that they provide. Spot markets exist in the Victorian Wholesale Gas Market (VWGM) and Short Term Trading Market (STTM) hubs in Adelaide, Sydney
Table 14: Australian gas prices (2010–11 dollars)
2001–02
2002–03
2003–04
2004–05
2005–06
2006–07
2007–08
2008–09
2009–10
2010–11
Natural Gas $A/GJ $2.16 $2.34 $2.50 $2.59 $2.71 $3.34 $3.72 $3.32 $2.09 $2.42
LNGb $A/t $444.03 $418.71 $336.82 $360.58 $426.06 $410.80 $464.90 $690.46 $448.62 $521.85
LNGb $A/GJ $8.16 $7.69 $6.19 $6.63 $7.84 $7.55 $8.55 $12.69 $8.25 $9.59
Note: Natural gas price is a financial year average of daily spot prices in the Victorian gas market, LNG price is an export unit value Source: BREE
BOX 4 THE EFFECTS OF CARBON PRICING ON AUSTRALIAN GAS CONSUMPTION
BREE’s energy projections (BREE 2011a) incorporate the introduction of a carbon pricing mechanism. The projections in this report point towards a major change in the Australian energy landscape. BREE modelling indicates a shift to low emission technologies, driven by policies that promote a less emission intensive economy. The Renewable Energy Target and the introduction of carbon pricing will drive the uptake of renewable technologies, which are projected to account for 9 per cent of primary energy consumption in 2034–35, up from 5 per cent in 2008–09.
There is projected to be a strong increase in the use of gas, particularly in electricity generation and LNG production. Carbon pricing increases the attractiveness of gas-fired electricity generation because it is characterised by lower carbon emissions relative to other
fossil fuels. However, other favorable characteristics of gas-fired electricity generation include lower capital expenditures, short construction times, greater flexibility in meeting peak demand, and higher thermal efficiencies relative to other comparable fossil fuels. Gas-fired electricity can also complement renewable energy sources, to help overcome intermittency problems associated with solar or wind. As a result, gas is expected to play a transitional role in the Australian energy mix until lower emission technologies become more cost competitive.
The assumptions around carbon emission reduction policies are based on the Australian Treasury’s Strong growth, low pollution: modelling a carbon price (Treasury 2011).

Australian Gas Resource Assessment 2012
26
Australian Gas Resource Assessment 2012
26
The geological factors which influence CSG resource quality include tectonic and structural setting, depositional environment, coal rank and gas generation, gas content, permeability and hydrogeology. Draper and Boreham (2006) concluded that, for Queensland CSG, neither rank nor gas content was critical, but rather
due to expire beyond 2030 and were negotiated on the basis of oil linked prices. Unless these contracts can be renegotiated, oil prices will remain a price setter for gas in the Asia Pacific region. However, the emergence of LNG exports from the US to Asia may result in some LNG imports being set by alternative mechanisms, such as the Henry Hub price in the US plus processing and delivery costs.
Exports of Australian LNG from the Eastern Market are scheduled to start in 2014 and are projected to reach 25 Mt (1332 PJ, 1.2 tcf) by the end of the decade. Once operational, CSG LNG projects will connect Australia’s Eastern market to the Asia-Pacific market. Over time it is expected that domestic prices will converge to the netback price of LNG—the market price received for LNG less the transport, marketing and liquefaction costs.
Resource characteristics
The decision to develop a gas field also depends on its characteristics. These include its size, location and distance from markets and infrastructure; its depth sub-surface and its water depth, in the case of offshore fields; and the quality of the gas, such as CO2 content and presence of natural gas liquids. Table 15 lists these characteristics for a number of Australian conventional gas fields.
Resource characteristics influencing the development of unconventional gas resources partly diverge from those relevant to conventional gas fields. Location and size of accumulation remain important but reservoir performance is crucial and can only be definitively determined by production testing. There are no associated hydrocarbon liquids with CSG, though gas liquids associated with shale gas can enhance the value of these resources. As all current identified unconventional resources in Australia are onshore, distance to market and infrastructure are key location factors.
Tabe 15: Resource characteristics of selected Australia conventinal gas fields
Basin/discovery date
Field Initial recoverable volumes CO2% Water Depth
m
km to Landfall
Status
Gas tcf Liquids mmbbl
Total PJ
Carnarvon
1971 North Rankin 12.28 203 ~ 14 700 < 5% 122 130 export LNG 1989
1980 Gorgon 17.2 121 ~ 19 630 > 10% 259 120 construction, LNG 2015
1980 Scarborough 5.2 0 ~ 5720 < 5% 923 310 undeveloped
2006 Pluto 4.6 0 ~ 5060 < 5% 900 190 production, LNG April 2012
1993 East Spar 0.25 14 ~ 360 < 5% 98 100 domestic production 1996
Browse
1980 Ichthys 12.8 527 ~ 17 180 > 5% 256 220 FID Jan 2012, LNG 2016
1971 Torosa 11.4 121 ~ 13 250 > 5% 50 280 FEED, LNG 2017
Source: Geoscience Australia
BOX 5 GEOLOGY OF AUSTRALIA’S MAJOR CONVENTIONAL GAS FIELDS
Australia’s identified and potential gas resources occur within a large number of sedimentary basins (Boreham et al. 2001) that stretch across the continent and its vast marine jurisdiction. Identified conventional gas resources are predominantly located in offshore basins along the north-west margin. Much of the undeveloped resource and the undiscovered potential is in deep water (figures 32 and 33; see discussion below). The gas habitat includes:
• large fault block traps, Triassic to Jurassic sandstone reservoirs sealed by Cretaceous shales and sourced from Triassic coaly sediments (e.g. North Rankin, Gorgon);
• drape anticlines and structural/stratigraphic traps related to Late Jurassic and Early Cretaceous sand bodies (e.g. Io-Jansz, Scarborough; figure 32); and
• low relief anticlines with Permian sandstone reservoirs (e.g. Petrel; figure 33).
In the Bass Strait basins (Otway, Bass and Gippsland) along the south-east margin, conventional gas accumulations are contained in Late Cretaceous to Paleogene sandstone reservoirs in anticlinal, fault block and structural/stratigraphic traps. In addition there are known gas resources in a number of onshore basins usually in Paleozoic sandstone reservoirs in structural traps.
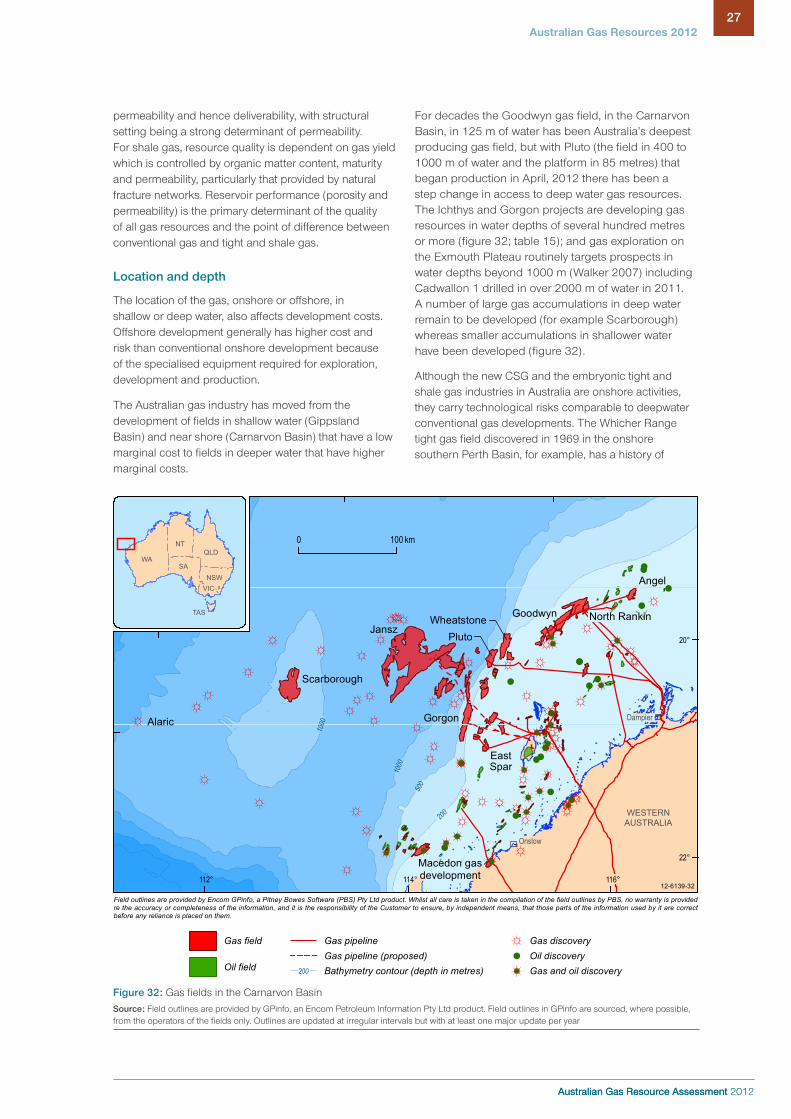
Australian Gas Resource Assessment 2012
27Australian Gas Resources 2012
Australian Gas Resource Assessment 2012
27
For decades the Goodwyn gas field, in the Carnarvon Basin, in 125 m of water has been Australia’s deepest producing gas field, but with Pluto (the field in 400 to 1000 m of water and the platform in 85 metres) that began production in April, 2012 there has been a step change in access to deep water gas resources. The Ichthys and Gorgon projects are developing gas resources in water depths of several hundred metres or more (figure 32; table 15); and gas exploration on the Exmouth Plateau routinely targets prospects in water depths beyond 1000 m (Walker 2007) including Cadwallon 1 drilled in over 2000 m of water in 2011. A number of large gas accumulations in deep water remain to be developed (for example Scarborough) whereas smaller accumulations in shallower water have been developed (figure 32).
Although the new CSG and the embryonic tight and shale gas industries in Australia are onshore activities, they carry technological risks comparable to deepwater conventional gas developments. The Whicher Range tight gas field discovered in 1969 in the onshore southern Perth Basin, for example, has a history of
permeability and hence deliverability, with structural setting being a strong determinant of permeability. For shale gas, resource quality is dependent on gas yield which is controlled by organic matter content, maturity and permeability, particularly that provided by natural fracture networks. Reservoir performance (porosity and permeability) is the primary determinant of the quality of all gas resources and the point of difference between conventional gas and tight and shale gas.
Location and depth
The location of the gas, onshore or offshore, in shallow or deep water, also affects development costs. Offshore development generally has higher cost and risk than conventional onshore development because of the specialised equipment required for exploration, development and production.
The Australian gas industry has moved from the development of fields in shallow water (Gippsland Basin) and near shore (Carnarvon Basin) that have a low marginal cost to fields in deeper water that have higher marginal costs.
WESTERNAUSTRALIA
200
500
1000
1000
Scarborough
Jansz
Gorgon
EastSpar
PlutoWheatstone Goodwyn
Angel
North Rankin
2000
3000
4000
Alaric
Macedon gasdevelopment
Onslow
Dampier
0 100 km
Field outlines are provided by Encom GPinfo, a Pitney Bowes Software (PBS) Pty Ltd product. Whilst all care is taken in the compilation of the field outlines by PBS, no warranty is providedre the accuracy or completeness of the information, and it is the responsibility of the Customer to ensure, by independent means, that those parts of the information used by it are correctbefore any reliance is placed on them.
WA
NT
SA
QLD
NSW
TAS
VIC
Gas field
Oil field
Gas discoveryOil discoveryGas and oil discovery
Gas pipeline (proposed)Gas pipeline
Bathymetry contour (depth in metres)200
12-6139-32
20°
22°
116°114°112°
Figure 32: Gas fields in the Carnarvon Basin Source: Field outlines are provided by GPinfo, an Encom Petroleum Information Pty Ltd product. Field outlines in GPinfo are sourced, where possible, from the operators of the fields only. Outlines are updated at irregular intervals but with at least one major update per year
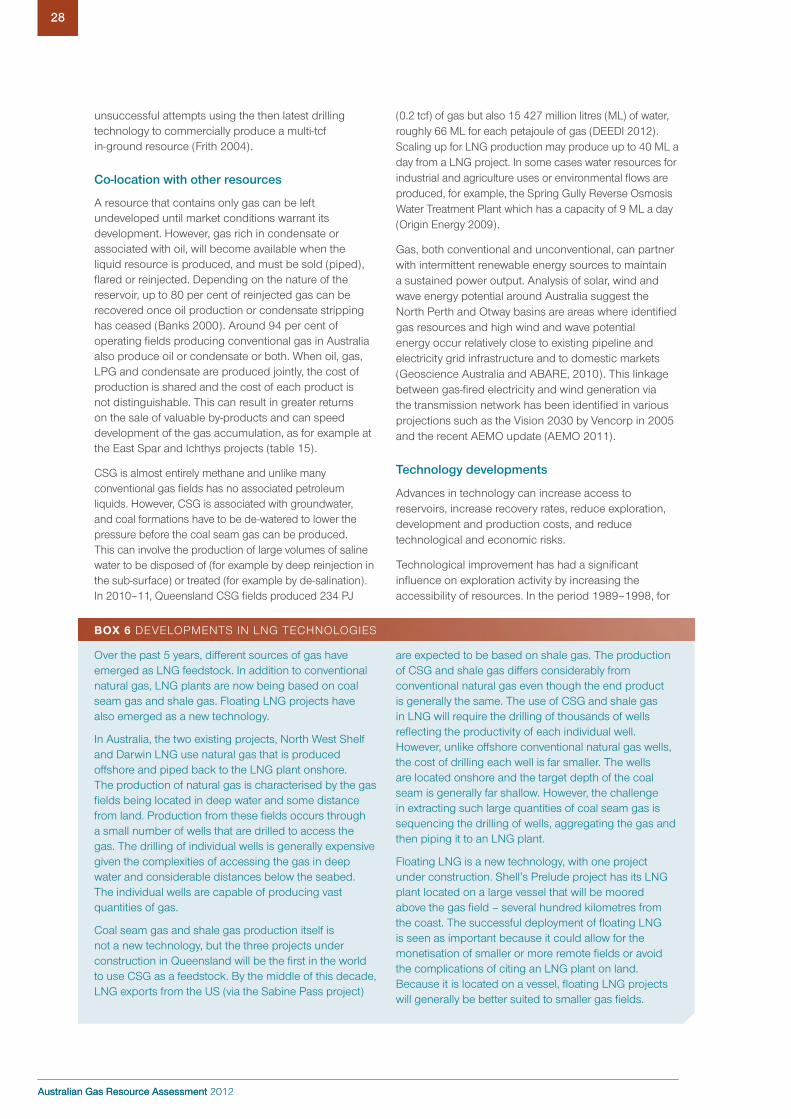
Australian Gas Resource Assessment 2012
28
Australian Gas Resource Assessment 2012
28
(0.2 tcf) of gas but also 15 427 million litres (ML) of water, roughly 66 ML for each petajoule of gas (DEEDI 2012). Scaling up for LNG production may produce up to 40 ML a day from a LNG project. In some cases water resources for industrial and agriculture uses or environmental flows are produced, for example, the Spring Gully Reverse Osmosis Water Treatment Plant which has a capacity of 9 ML a day (Origin Energy 2009).
Gas, both conventional and unconventional, can partner with intermittent renewable energy sources to maintain a sustained power output. Analysis of solar, wind and wave energy potential around Australia suggest the North Perth and Otway basins are areas where identified gas resources and high wind and wave potential energy occur relatively close to existing pipeline and electricity grid infrastructure and to domestic markets (Geoscience Australia and ABARE, 2010). This linkage between gas-fired electricity and wind generation via the transmission network has been identified in various projections such as the Vision 2030 by Vencorp in 2005 and the recent AEMO update (AEMO 2011).
Technology developments
Advances in technology can increase access to reservoirs, increase recovery rates, reduce exploration, development and production costs, and reduce technological and economic risks.
Technological improvement has had a significant influence on exploration activity by increasing the accessibility of resources. In the period 1989–1998, for
unsuccessful attempts using the then latest drilling technology to commercially produce a multi-tcf in-ground resource (Frith 2004).
Co-location with other resources
A resource that contains only gas can be left undeveloped until market conditions warrant its development. However, gas rich in condensate or associated with oil, will become available when the liquid resource is produced, and must be sold (piped), flared or reinjected. Depending on the nature of the reservoir, up to 80 per cent of reinjected gas can be recovered once oil production or condensate stripping has ceased (Banks 2000). Around 94 per cent of operating fields producing conventional gas in Australia also produce oil or condensate or both. When oil, gas, LPG and condensate are produced jointly, the cost of production is shared and the cost of each product is not distinguishable. This can result in greater returns on the sale of valuable by-products and can speed development of the gas accumulation, as for example at the East Spar and Ichthys projects (table 15).
CSG is almost entirely methane and unlike many conventional gas fields has no associated petroleum liquids. However, CSG is associated with groundwater, and coal formations have to be de-watered to lower the pressure before the coal seam gas can be produced. This can involve the production of large volumes of saline water to be disposed of (for example by deep reinjection in the sub-surface) or treated (for example by de-salination). In 2010–11, Queensland CSG fields produced 234 PJ
BOX 6 DEVELOPMENTS IN LNG TECHNOLOGIES
Over the past 5 years, different sources of gas have emerged as LNG feedstock. In addition to conventional natural gas, LNG plants are now being based on coal seam gas and shale gas. Floating LNG projects have also emerged as a new technology.
In Australia, the two existing projects, North West Shelf and Darwin LNG use natural gas that is produced offshore and piped back to the LNG plant onshore. The production of natural gas is characterised by the gas fields being located in deep water and some distance from land. Production from these fields occurs through a small number of wells that are drilled to access the gas. The drilling of individual wells is generally expensive given the complexities of accessing the gas in deep water and considerable distances below the seabed. The individual wells are capable of producing vast quantities of gas.
Coal seam gas and shale gas production itself is not a new technology, but the three projects under construction in Queensland will be the first in the world to use CSG as a feedstock. By the middle of this decade, LNG exports from the US (via the Sabine Pass project)
are expected to be based on shale gas. The production of CSG and shale gas differs considerably from conventional natural gas even though the end product is generally the same. The use of CSG and shale gas in LNG will require the drilling of thousands of wells reflecting the productivity of each individual well. However, unlike offshore conventional natural gas wells, the cost of drilling each well is far smaller. The wells are located onshore and the target depth of the coal seam is generally far shallow. However, the challenge in extracting such large quantities of coal seam gas is sequencing the drilling of wells, aggregating the gas and then piping it to an LNG plant.
Floating LNG is a new technology, with one project under construction. Shell’s Prelude project has its LNG plant located on a large vessel that will be moored above the gas field – several hundred kilometres from the coast. The successful deployment of floating LNG is seen as important because it could allow for the monetisation of smaller or more remote fields or avoid the complications of citing an LNG plant on land. Because it is located on a vessel, floating LNG projects will generally be better suited to smaller gas fields.
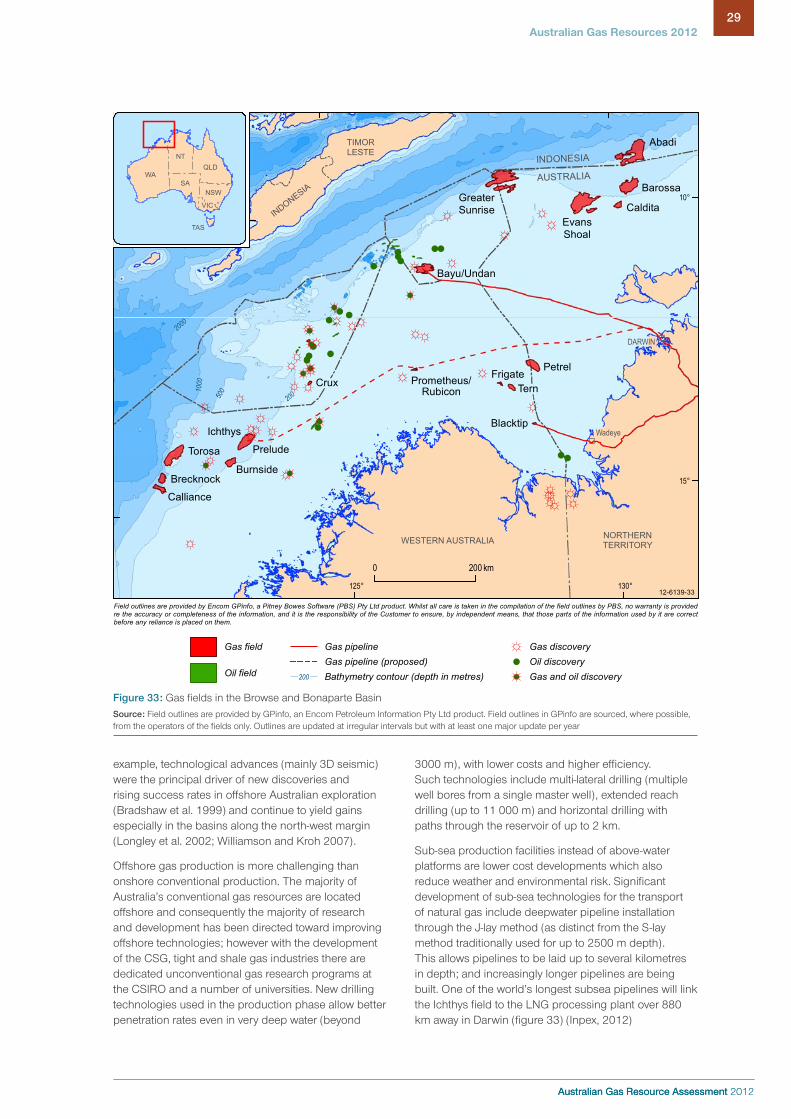
Australian Gas Resource Assessment 2012
29Australian Gas Resources 2012
Australian Gas Resource Assessment 2012
29
3000 m), with lower costs and higher efficiency. Such technologies include multi-lateral drilling (multiple well bores from a single master well), extended reach drilling (up to 11 000 m) and horizontal drilling with paths through the reservoir of up to 2 km.
Sub-sea production facilities instead of above-water platforms are lower cost developments which also reduce weather and environmental risk. Significant development of sub-sea technologies for the transport of natural gas include deepwater pipeline installation through the J-lay method (as distinct from the S-lay method traditionally used for up to 2500 m depth). This allows pipelines to be laid up to several kilometres in depth; and increasingly longer pipelines are being built. One of the world’s longest subsea pipelines will link the Ichthys field to the LNG processing plant over 880 km away in Darwin (figure 33) (Inpex, 2012)
example, technological advances (mainly 3D seismic) were the principal driver of new discoveries and rising success rates in offshore Australian exploration (Bradshaw et al. 1999) and continue to yield gains especially in the basins along the north-west margin (Longley et al. 2002; Williamson and Kroh 2007).
Offshore gas production is more challenging than onshore conventional production. The majority of Australia’s conventional gas resources are located offshore and consequently the majority of research and development has been directed toward improving offshore technologies; however with the development of the CSG, tight and shale gas industries there are dedicated unconventional gas research programs at the CSIRO and a number of universities. New drilling technologies used in the production phase allow better penetration rates even in very deep water (beyond
NORTHERNTERRITORY
TIMORLESTE
INDONESIA
WESTERN AUSTRALIA
Calliance
Brecknock
Torosa
IchthysBlacktip
Petrel
Bayu/Undan
GreaterSunrise
EvansShoal
Caldita
Barossa
Abadi
Burnside
Tern
INDONESIA
AUSTRALIA
20050010
00
2000
Prelude
Crux Prometheus/Rubicon
Frigate
DARWIN
Wadeye
12-6139-33
0 200 km
Field outlines are provided by Encom GPinfo, a Pitney Bowes Software (PBS) Pty Ltd product. Whilst all care is taken in the compilation of the field outlines by PBS, no warranty is providedre the accuracy or completeness of the information, and it is the responsibility of the Customer to ensure, by independent means, that those parts of the information used by it are correctbefore any reliance is placed on them.
WA
NT
SA
QLD
NSW
TAS
VIC
Gas field
Oil field
Gas discoveryOil discoveryGas and oil discovery
Gas pipeline (proposed)Gas pipeline
Bathymetry contour (depth in metres)200
10°
15°
130°125°
Figure 33: Gas fields in the Browse and Bonaparte BasinSource: Field outlines are provided by GPinfo, an Encom Petroleum Information Pty Ltd product. Field outlines in GPinfo are sourced, where possible, from the operators of the fields only. Outlines are updated at irregular intervals but with at least one major update per year
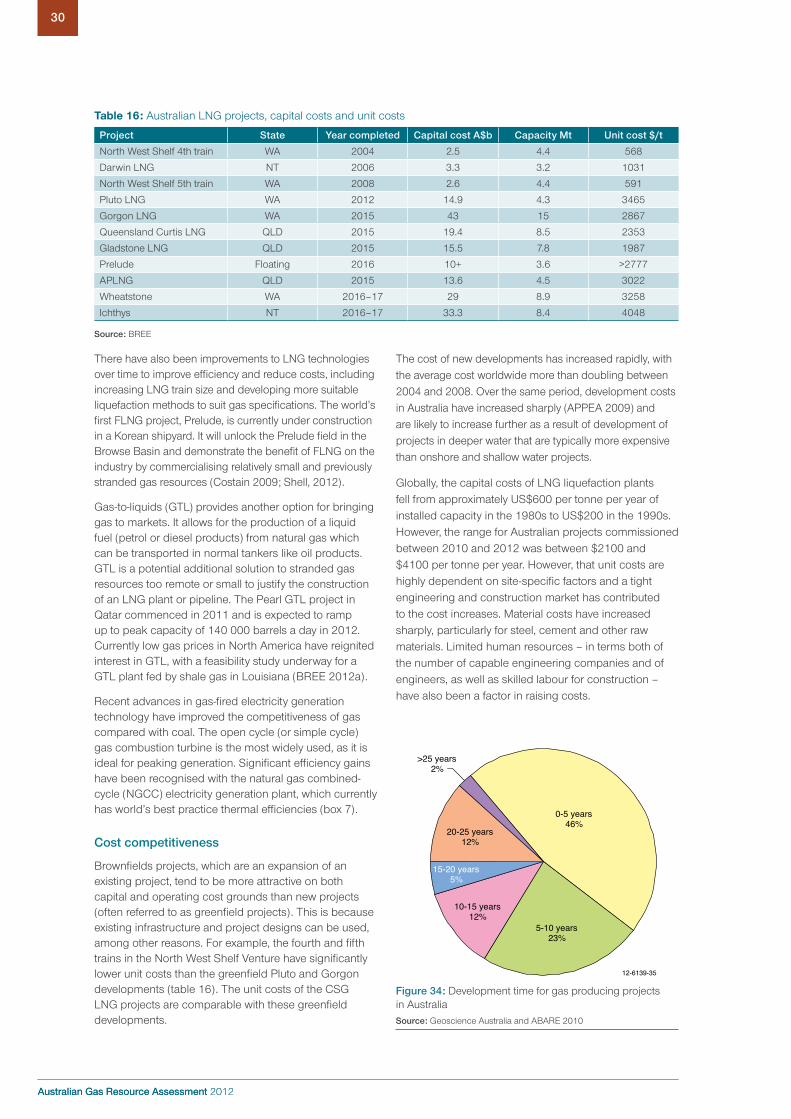
Australian Gas Resource Assessment 2012
30
Australian Gas Resource Assessment 2012
30
The cost of new developments has increased rapidly, with the average cost worldwide more than doubling between 2004 and 2008. Over the same period, development costs in Australia have increased sharply (APPEA 2009) and are likely to increase further as a result of development of projects in deeper water that are typically more expensive than onshore and shallow water projects.
Globally, the capital costs of LNG liquefaction plants fell from approximately US$600 per tonne per year of installed capacity in the 1980s to US$200 in the 1990s. However, the range for Australian projects commissioned between 2010 and 2012 was between $2100 and $4100 per tonne per year. However, that unit costs are highly dependent on site-specific factors and a tight engineering and construction market has contributed to the cost increases. Material costs have increased sharply, particularly for steel, cement and other raw materials. Limited human resources – in terms both of the number of capable engineering companies and of engineers, as well as skilled labour for construction – have also been a factor in raising costs.
There have also been improvements to LNG technologies over time to improve efficiency and reduce costs, including increasing LNG train size and developing more suitable liquefaction methods to suit gas specifications. The world’s first FLNG project, Prelude, is currently under construction in a Korean shipyard. It will unlock the Prelude field in the Browse Basin and demonstrate the benefit of FLNG on the industry by commercialising relatively small and previously stranded gas resources (Costain 2009; Shell, 2012).
Gas-to-liquids (GTL) provides another option for bringing gas to markets. It allows for the production of a liquid fuel (petrol or diesel products) from natural gas which can be transported in normal tankers like oil products. GTL is a potential additional solution to stranded gas resources too remote or small to justify the construction of an LNG plant or pipeline. The Pearl GTL project in Qatar commenced in 2011 and is expected to ramp up to peak capacity of 140 000 barrels a day in 2012. Currently low gas prices in North America have reignited interest in GTL, with a feasibility study underway for a GTL plant fed by shale gas in Louisiana (BREE 2012a).
Recent advances in gas-fired electricity generation technology have improved the competitiveness of gas compared with coal. The open cycle (or simple cycle) gas combustion turbine is the most widely used, as it is ideal for peaking generation. Significant efficiency gains have been recognised with the natural gas combined-cycle (NGCC) electricity generation plant, which currently has world’s best practice thermal efficiencies (box 7).
Cost competitiveness
Brownfields projects, which are an expansion of an existing project, tend to be more attractive on both capital and operating cost grounds than new projects (often referred to as greenfield projects). This is because existing infrastructure and project designs can be used, among other reasons. For example, the fourth and fifth trains in the North West Shelf Venture have significantly lower unit costs than the greenfield Pluto and Gorgon developments (table 16). The unit costs of the CSG LNG projects are comparable with these greenfield developments.
Table 16: Australian LNG projects, capital costs and unit costs
Project State Year completed Capital cost A$b Capacity Mt Unit cost $/t
North West Shelf 4th train WA 2004 2.5 4.4 568
Darwin LNG NT 2006 3.3 3.2 1031
North West Shelf 5th train WA 2008 2.6 4.4 591
Pluto LNG WA 2012 14.9 4.3 3465
Gorgon LNG WA 2015 43 15 2867
Queensland Curtis LNG QLD 2015 19.4 8.5 2353
Gladstone LNG QLD 2015 15.5 7.8 1987
Prelude Floating 2016 10+ 3.6 >2777
APLNG QLD 2015 13.6 4.5 3022
Wheatstone WA 2016–17 29 8.9 3258
Ichthys NT 2016–17 33.3 8.4 4048
Source: BREE
0-5 years46%
>25 years2%
20-25 years12%
15-20 years5%
10-15 years12%
5-10 years23%
12-6139-35
Figure 34: Development time for gas producing projects in Australia Source: Geoscience Australia and ABARE 2010

Australian Gas Resource Assessment 2012
31Australian Gas Resources 2012
Australian Gas Resource Assessment 2012
31
time that it takes to come online. Geoscience Australia and ABARE (2010) reported that almost 70 per cent of all projects then producing gas in Australia were completed within ten years of initial discovery and that on average, gas projects took around eight and a half years to bring into production (figure 34).
On the other hand, LNG projects in Australia and worldwide often have a significant lag between first announcement, final investment decision, and development, as proponents undertake various studies to determine project feasibility, its design and its market prospects (seeking to secure long term markets) before construction commences. Construction alone can take at least three years, and often longer. The Darwin LNG project, for example, took 32 months from notice of construction in June 2003 to the first delivery of LNG in February 2006. The larger Pluto project has taken seven years and is the fastest LNG project (from discovery to production) to be developed in Australia and one of the world’s fastest.
Transmission and distribution infrastructure
The last two decades have seen large investments in transmission pipelines and distribution networks to meet the steady growth in domestic gas demand. Before the 1990s Australia’s transmission pipelines were a series of individual pipelines, each supplying a demand centre from a specific gas field. The majority were government owned and there was little interconnection. Since the early 1990s the
Generally, CSG can be produced using similar technologies to those used for the development of conventional gas. Compared with the conventional gas, CSG projects can generally be developed at a lower capital cost because the reserves are typically located at a shallow depth and hence require smaller drilling rigs. The production of CSG can also be increased incrementally given the shallow production wells. Although hundreds of wells are needed to produce a field as opposed to a few dozen at most in a giant conventional gas field, they are hundreds of metres rather than kilometres deep, and take a few days as opposed to weeks to drill (Geoscience Australia and ABARE 2010). Nonetheless, they have their own particular engineering requirements.
In some cases coal seam geology makes it difficult to extract gas, and advanced techniques are required to enhance well productivity. Moreover, the water contained in the coal seam needs to be removed before gas can be extracted. In the Australian context, wide diameter holes with pre-slotted casing and under-reamed coal intervals have been found to improve CSG well performance.
Development timeframe
The time taken to bring a resource to market affects the economics of a project. Typically, developing gas fields for the domestic market takes less time than LNG export projects. The size of a project is also likely to affect the
BOX 7 GAS COMBINED CYCLE POWER PLANTS
This technology is based on generating electricity by combining gas fired turbines and steam turbine technologies. It uses two thermodynamic cycles — the Brayton and Rankine cycles. Electricity is first generated in open cycle gas turbines (Brayton Cycle) by burning the gas and the exhaust heat is then used to make steam to generate additional electricity using a steam turbine (Rankine Cycle). This is shown schematically in figure 35.
GCC technology provides plant efficiencies of up to 50 per cent. Other advantages of GCC plants are reduced emissions, high operating availability factors, relatively short installation times, lower water consumption, and flexibility in despatch. The size of combined cycle turbines has increased as the technology has matured; units up to 1000 MW capacity are now available.
As of 2009–10, there were 20 gas-fired combined cycle power plants operating in Australia, with a combined capacity of around 4 GW (ESAA 2011). Since then, the Mortlake Stage 1 project was been completed by Origin Energy, and two additional units became operational within the Channel Island Power Station, increasing total capacity to around 4.7 GW. Of the 4.7 GW of GCC capacity, around 1.5 GW of capacity is fueled by coal seam gas.
Gas turbine
Steam turbine
Boiler/heat exchanger
Electricalgenerator
Electricalgenerator
Pump
12-6139-34
Condenser
Figure 35: Schematic picture of combined cycle gas turbine Source: Wikipedia (http://en.wikipedia.org/wiki/Combined_cycle_ gas_turbine)

Australian Gas Resource Assessment 2012
32
Australian Gas Resource Assessment 2012
32
Environmental and other considerations
The Australian state/territory governments require petroleum companies to conduct their activities in a manner that meets a high standard of environmental protection. This applies to the exploration, development, production, transport and use of Australia’s gas and other hydrocarbon resources. Onshore and within three nautical miles of the coastline the relevant state/territory government is the principal environmental management authority although the Australian Government has some responsibilities regarding environmental protection, especially under the Environment Protection and Biodiversity Conservation (EPBC) Act 1999.
An issue of increasing significance in gas exploration and development onshore, particularly for CSG, is gas water management which includes not only the handling of the co-produced water, but also the hydrogeological impacts on subsurface aquifers. The potential impacts on groundwater resource(s) in the Surat Basin as a result of CSG developments were considered in detail in a water management study (DNRME 2004). Under the Queensland CSG Water Management Policy/(DNRME 2010) the use of evaporation ponds as a primary means of disposal of coal seam gas water is to be discontinued and CSG producers will be responsible for treating and disposing of coal seam gas water. Coal seam gas water will be required to be treated to a standard defined by the Department of Environment and Resource Management (DERM) before disposal or supply to other water users. There are a number of options for the disposal and treatment of the large volumes of water produced from CSG wells, such as deep injection into the subsurface, local use in coal washing and some rural purposes, and treatment to produce fresh water.
As of 2012, the Australian Government plans to spend $150 million over five years to support the work of a new Independent Expert Scientific Committee that will provide scientific advice to governments about relevant coal seam gas and large coal mining approvals where they have significant impacts on water. The Committee will commission bioregional assessments and research into the impacts of coal seam gas and coal mine developments on water resources and methods for minimising those impacts (IIESC, 2012).
In the offshore areas beyond coastal waters the Australian Government has jurisdiction for the regulation of petroleum activities. The objective-based Offshore Petroleum and Greenhouse Gas Storage (Environmental) Regulations (2009) provide companies with the flexibility in meeting environmental protection requirements. Petroleum exploration and development is prohibited in some marine protected areas offshore (such as the Great Barrier Reef Marine Park) and tightly controlled in others where multiple marine uses have been sanctioned (figure 36).
In response to the Montara oil spill in 2009 (Report of the Montara Commission of Inquiry, 2010) and the report
eastern states have become interconnected, with Adelaide, Canberra, Melbourne and Sydney each now being supplied by two separate pipelines. Since 2000 several billion dollars has been invested in new pipelines and the expansion of pipeline capacity. Major investments include the Eastern Gas Pipeline, the SEA Gas Pipeline and expansion of the Dampier to Bunbury Pipeline (AER 2011).
The level of investment in gas pipelines is expected to continue in the short term. A further $2.7 billion of investment, in various stages of commitment has been announced for the next 5 years with major projects including the Queensland to Hunter Gas Pipeline and expansion of the Southwest Queensland Pipeline (BREE 2012c).
The National Gas Law (NGL) and National Gas Rules (NGR) provide a regime to give third parties access to transmission pipelines and distribution networks. Pipelines and networks that have undue market power are regulated under the NGL and NGR, which requires them to publish tariffs that must be approved by the Australian Energy Regulator (AER) which can be enforced by the AER in the event of a dispute. Eleven of Australia’s 32 major transmission pipelines are regulated and, with a few exceptions, all distribution networks are regulated (AER 2011).
Most domestic gas is traded through bilateral contracts between producers and users (retailers and large customers) and, with the exception of the Victorian Gas Market, there is little price transparency. Currently, the capacity on some transmission pipelines is fully contracted, which can make it difficult for new players to enter some gas markets. The Council of Australian Governments, through the Standing Council on Energy and Resources (SCER), has introduced reforms to Australia’s gas markets to promote their ongoing development and address some of these issues. These reforms include:
• the National Gas Market Bulletin Board (Gas BB): the Gas BB website publishes daily supply and demand data for transmission pipelines in the eastern states with the aim of facilitating trade in gas and pipeline capacity; and
• the Gas Statement of Opportunities (GSOO): this annual publication provides 20 year forecasts of gas reserves, demand, production and transmission capacity for Australia’s eastern and south eastern gas markets. The GSOO aims to assist existing industry participants and potential new investors in making commercial decisions about entering into contracts and investing in infrastructure; and
• the Short Term Trading Market (STTM) is intended to bring price transparency to these markets by setting a daily price for gas. The STTM commenced initially in Adelaide and Sydney in September 2010 and was followed by Brisbane in December 2011. Ultimately, the SCER intends to expand the STTM into other jurisdictions.

Australian Gas Resource Assessment 2012
33Australian Gas Resources 2012
Australian Gas Resource Assessment 2012
33
characterises the environmental conditions for the proposed development. In the offshore area typical data sets that are required for marine EIA in EPBC Act referrals and can be synthesised and made available by the Australian Government include: bathymetry, substrate type, seabed stability, ocean currents and processes, benthic habitats and biodiversity patterns.
The content of CO2 in natural gas is an environmental consideration in some fields. The CO2 content in gas fields varies widely and the liquids-rich gas accumulations of the Browse and Bonaparte basins tend to have relatively high CO2 contents. Accessing this gas may require disposal of significant volumes (several tcf) of CO2. Geological storage is a possible option and is facilitated by carbon capture and storage (CCS) acreage release (Department of Resources, Energy and Tourism 2009). The Gorgon Project includes a major CO2 injection component.
There are also jurisdictional considerations. An offshore gas field which supplies an onshore gas plant requires federal, state or territory and local government co-ordination in resource management and development
of the Productivity Commission (2009), steps have been taken to ensure national regulation for offshore Commonwealth waters, particularly with respect to safety and environmental management. On 1 January 2012, NOPSEMA, the National Offshore Petroleum Safety and Environmental Management Authority, was established as Australia’s first national regulator for health and safety, well integrity and environmental management for offshore oil and gas operations. The amalgamation of management responsibilities for these issues into a single regulator is expected to reduce the regulatory burden on industry and standardise Australia’s offshore petroleum regulation to a quality, best practice model (NOPSEMA, 2012).
Environmental Impact Assessments (EIA) that are required as pre-conditions to infrastructure development applications—especially of larger projects—may require environmental monitoring over a period of time as a condition to the approval before the development can commence. In some cases regional-scale pre-competitive base line environmental information is available from government in the form of regional syntheses containing contextual information that already
Great
Reef Marine
Park
Barrier
PERTH
SYDNEY
DARWIN
HOBART
ADELAIDE
BRISBANE
MELBOURNE
12-6139-36
0 750 km
Marine park/reserve
Australian Exclusive Economic Zone
150°140°130°120°
10°
20°
30°
40°
Figure 36: Current marine protected areas of AustraliaSource: SEWPAC

Australian Gas Resource Assessment 2012
34
Australian Gas Resource Assessment 2012
34
Identified resources not yet included in EDR or SDR
In addition to more than 490 conventional gas fields in 16 basins aggregated in the EDR and SDR categories (Geoscience Australia 2011), there are a number of other known gas accumulations. They include recent discoveries (Lavin 2011) not yet appraised (for example the Equus development in the Carnarvon Basin, Frigate Deep in the Bonaparte Basin and Poseidon in the Browse Basin). Although located in deep water these accumulations could add significantly to gas resources when they are appraised. The potential and timing of development of these discoveries will vary depending on location, resource size, quality (CO2 and liquids content) and commercial factors (table 15).
In addition to very recent discoveries in established gas producing basins, there are a number of conventional gas accumulations in undeveloped basins both onshore and offshore (table 17) that are not aggregated in EDR or SDR. Examples include the Phoenix gas accumulation in the Bedout Sub-basin of the Roebuck Basin (offshore Canning) and gas flows from wells in the onshore Canning, Georgina and Ngalia basins. Remote location, size of the resource and resource quality (for example poor reservoir) are factors limiting their development but some of these accumulations may move into EDR and SDR in the years to 2035. For example, there may be local niche markets for conventional gas in power generation related to mineral processing or co-location with renewable but intermittent energy sources. Technological advances in producing gas from poor reservoirs may also lead to additional resources and some of these accumulations may eventually be produced as tight gas fields.
Discovery of new fields in established hydrocarbon basins
A major potential contributor to Australia’s conventional gas resources to 2035 is the discovery of new fields in the established hydrocarbon producing basins. Unlike the identified resources discussed above, discovery risk applies, so that the resource found by 2035 is dependent on the number of exploration wells drilled, the size of the prospects tested and the success rate. Active exploration programs are underway in the Carnarvon, Browse and Bonaparte basins, with a trend towards deeper water exploration. However success rates over the last two years have not been as high as expected. Upton (2012) notes that in 2010 and 2011, of the seven wells drilled in over 1500 m of water in the outer Carnarvon Basin, there was only one gas discovery (Alaric-1; figure 32).
Geoscience Australia and ABARE (2010) provide a discussion of undiscovered conventional gas resources. Most of the potential was considered to be in the offshore basins with a total of 125 400 PJ (114 tcf) for the yet-to-find recoverable gas in Carnarvon, Bonaparte, Browse and Gippsland basins at the mean expectation. The recent USGS assessment of these four basins
approvals processes (Productivity Commission 2009). One of the responses to the Productivity Commission (2009) Review of Regulatory Burden on the Upstream Petroleum (Oil & Gas) Sector was the establishment on 1 January 2012, of NOPTA , the National Offshore Petroleum Titles Administrator, as a branch of the Resources Division in the Department of Resources, Energy and Tourism (RET), headquartered in Perth with a regional office in Melbourne (NOPTA, 2012).
Geological provinces containing gas resources that are contiguous across international boundaries, such as the JPDA in the Timor Sea, require international coordination.
4.2 Conventional gas resource outlook
Proven world natural gas reserves have grown at an annual rate of 3.4 per cent since 1980 – outstripping oil reserve growth – as a result of significant discoveries and better assessments of existing fields (World Energy Council 2007). In Australia, future growth in conventional gas, CSG and other unconventional gas resources is expected to add to an expanded total gas inventory by 2035, even with an increase in gas production.
For conventional gas resources, additions will come from several potential sources:
• field growth – extensions to identified commercial fields (growth in reserves) and to currently sub-economic fields;
• identified resources not yet booked – very recent discoveries, accumulations in non producing basins not in current EDR or SDR categories (inferred resources);
• discovery of new commercial fields in established hydrocarbon basins; and
• discovery of new fields in frontier basins that become commercial by 2035.
Field reserves growth
Growth in reserves in existing fields can add significantly to total reserves. Geoscience Australia and ABARE (2010) estimated that the additional conventional gas resource contributed by field growth by 2030 was between 35 200 and 46 200 PJ (32 and 42 tcf). This projection is consistent with actual historical data where reserves in fields discovered before 2002 have increased by 5.6 per cent in the period 2002 to 2007 or at an annual increase at the lower end of the projected range.
Powell (2004) provided qualitative assessments of the potential for future growth of gas reserves and noted that, as a large proportion of Australia’s gas fields are undeveloped, there should be considerable potential for reserve growth. However, the advent of 3D and 4D seismic imaging should provide greater geological certainty and reduce the extent to which initial estimates of reserves are understated in the future.

Australian Gas Resource Assessment 2012
35Australian Gas Resources 2012
Australian Gas Resource Assessment 2012
35
opportunities identified in deeper water. However,
Australia’s frontier basins are poorly explored and
the large structures remain untested. Significant new
exploration efforts are underway ‘in the offshore Bight
and Roebuck (offshore Canning) basins and onshore in
the Canning and Officer basins.
In comparison to Australia’s producing basins, there
is a higher degree of uncertainty in estimating the
undiscovered resources in the poorly explored frontier
and non-producing basins. A number of estimates
of undiscovered hydrocarbon potential are available
for individual frontier basins and for Australia as a
whole. The publicly available assessments have not
integrated the results from the current rounds of pre-
competitive data acquisition and focus on oil rather than
gas resources.
(Pollastro et al 2012) has considerably upgraded this estimate to 249 700 PJ (227 tcf) with a range between 117 700 PJ (107 tcf) and 431 200 PJ (392 tcf).
Discovery of new fields in non-producing and frontier basins
In addition to the 16 basins that have identified commercial conventional gas resources, many other Australian basins have gas occurrences (figure 37). Apart from the gas accumulations already recognised in these basins there is also the potential for the discovery of new fields.
As gas exploration matures in the established basins, the size of drilling targets and correspondingly the size of discovered fields is likely to decline, unless reversed by new opportunities created by new play concepts and technologies and, in the case of offshore basins,
Table 17: Status of gas exploration and discovery in Australia by basin
Basin First Gas Indication or Discovery Gas Production Status
Adavale 1964 – Gilmore 1 gas flow Past producer: 1995–2002 Gilmore gas piped to Blackall
Amadeus 1963 – Ooraminna 1 gas flow Producer: 1983 – Palm Valley gas piped to Alice Springs
Bass 1967 – Bass 3 gas recovery Producer: 2006 – BassGas project (Yolla)
Bonaparte 1964 – Bonaparte 1 gas show Producer: 2006 – Darwin LNG production (Bayu/Undan)
Bowen 1961 – Cabawin 1 gas flow Producer: 1990 – Denison Trough gas piped to Brisbane
Browse 1971 – Scott Reef 1 gas flow Potential producer: 2009 – Ichthys project FID 2012
Canning – onshore 1966 – Saint George Range 1 gas flow Potential producer: 2007 – Drilling campaign in western Canning
Canning – offshore 1980 – Phoenix 1 gas show Indications
Carnarvon – onshore 1966 – Onslow 1 gas flow Producer: 1991 – Tubridgi gas production
Carnarvon – offshore 1971 – North Rankin 1 gas flow Producer: 1984 – NWSJV gas piped to Perth
Carnarvon – Exmouth Plt. 1979 – Zeewulf 1 gas recovery Potential producer: Gorgon project under construction
Cooper 1959 – Innamincka 1 gas show Producer: 1969 – Moomba area gas piped to Adelaide
Duntroon 1993 – Greenly 1 gas show Indications
Eromanga 1976 – Namur 1 gas flow Producer: 1979 - Namur gas production
Galilee 1964 – Marchmont 1 CSG show Potential producer: CSG potential
Georgina 1963 – Ammaroo 2 gas flow Indications
Gippsland 1962 – North Seaspray 1 gas flow Producer: 1969 – Barracouta gas piped to Melbourne
Gunnedah 1985 – Wilga Park 1 gas flow Producer: 2004 – Coonarah production to Wilga Park power station
Maryborough 1966 – Gregory River 1 gas flow Potential producer: CSG potential
McArthur 1979 – Mineral hole GRNT-79-9 gas flare Indications; shale gas potential (Beetaloo Sub-basin)
Ngalia 1981 – Davis 1 gas flow Indications
Officier 2004 – Vines 1 gas indiciations Indications
Otway – onshore 1959 – Port Campbell 1 gas flow Producer: 1986 – North Paaratte gas piped to Warrnambool
Otway – offshore 1967 – Pecten 1A gas flow Producer: 2005 – Minerva gas production
Pedirka 2008 – Blamore 1 CSG show Potential producer: CSG potential
Perth – onshore 1961 – Eneabba 1 gas show Producer: 1971 – Dongara gas piped to Perth
Perth – offshore 1978 – Houtman 1 gas show Indications
Surat 1901 – Hospital Hill 2 gas flow Producer: 1969 – Roma area gas piped to Brisbane
Sydney 1937 – Mulgoa 1 gas flow Producer: 2006 – Camden CSG production
Tasmania 1920s – Gas shows, Bruny Island wells Indications
Warburton 1990 – Lycosa 1 gas flow Potential producer
Source: Geoscience Australia

Australian Gas Resource Assessment 2012
36
Australian Gas Resource Assessment 2012
36
Estimates of aggregate CSG potential in Australia are substantial (Baker and Slater 2009). At the end of 2011, the Queensland, Department of Employment, Economic Development and Innovation estimated total identified and prospective resources of 154 634 PJ (141 tcf) for Queensland and 64.8 tcf (71 254 PJ) for New South Wales (DEEDI 2011). Other Australia wide industry estimates range from 250 tcf (275 000 PJ) according to Santos (2009) to more than 300 tcf (330 000 PJ) of gas in place (Arrow Energy 2009). In addition to the new CSG resources identified by current active exploration, it is expected that part of the large inferred resource will move into the EDR and SDR categories by 2035. There appears to be potential for around 7 times more CSG than the current EDR.
Understanding of the future potential tight gas and shale gas resource in Australia is very limited. Likely shale gas candidate formations have been identified in many basins including the Cooper, Perth, Amadeus, Canning, Georgina and McArthur basins. Tight gas resources are under investigation in the Cooper,
4.3 Unconventional gas resource outlook
For unconventional gas the understanding of additions to the inventory of reserves from field growth and new discoveries is less well established than for conventional gas. In the outlook to 2035, CSG is expected to remain the most important sector of the unconventional gas industry and is already a significant source of gas in eastern Australia. Currently, production of CSG is mainly from the Bowen and Surat basins in Queensland, with some production from the Sydney Basin in New South Wales (figure 38). Production is from Permian and Jurassic coals.
Over the past five years the focus of CSG exploration has expanded into other coal basins and into other parts of the stratigraphy, to coal deposits of widely differing geological age. Triassic and Cretaceous strata are now also an exploration target as well as the Permian coals of the Gondwana basins. CSG exploration is active in the Clarence-Moreton and Galilee basins and potential is recognised in many of Australia’s black and brown coal basins (Figure 38).
PERTH
SYDNEY
DARWIN
HOBART
ADELAIDE
BRISBANE
MELBOURNE
12-6139-37
0 750 km
Hydrocarbon Status
Producing (gas)
Flows in well tests
Shows in wells
No show in wells
Undrilled
150°140°130°120°110°
10°
20°
30°
40°
Figure 37: Australian gas occurrences, showing basins with conventional gas production, gas flows and gas shows, drilled basins with no shows and undrilled basinsSource: Geoscience Australia

Australian Gas Resource Assessment 2012
37Australian Gas Resources 2012
Australian Gas Resource Assessment 2012
37
of production at the estimated 2035 production rates. Over the outlook period it is expected that some of the currently sub-economic demonstrated resources (SDR) and large inferred (mostly CSG) gas resource will be converted to EDR and enter production. Australia’s gas resource base is therefore adequate to support projected increases in production beyond the outlook period.
The true size of Australia’s potential gas resources is unknown and could be significantly larger than the identified resources. There is no current publicly available resource assessment of Australia’s undiscovered conventional gas resources that adequately reflects the knowledge gained in recent years during the active programs of government pre-competitive data acquisition and increased company exploration during the resources boom. In addition, the current knowledge base for unconventional gas, especially tight gas and shale gas, is inadequate for assessment. The potential size of Australia’s CSG resources is as yet ill-defined; companies have reported very substantial in-place CSG resources. Better assessment of Australia’s potential gas resources would be aided by both more pre-competitive geoscientific information and further exploration drilling and production data.
Perth and Gippsland basins. As exploration and development of Australia’s gas resources proceeds, several basins – notably the Cooper Basin – are likely to emerge as having large conventional, CSG, tight and shale gas resources. A significant advantage of exploring in the Cooper Basin is that substantial gas infrastructure, including a gas pipeline servicing South Australia, Queensland and New South Wales markets, already exists.
4.4 Total gas resource outlook
Australia’s EDR of gas, both conventional and unconventional, at 149 305 PJ (136 tcf; table 10) is equivalent to a reserves to production ratio of around 64 years at current rates. However, Australian gas production is projected to increase substantially over the period to 2034–35 but demonstrated gas resources (276 634 PJ, 251 tcf) are still expected to exceed the estimated cumulative gas production from 2010–11 to 2034–35 (145 106 PJ, 132 tcf). Total identified gas resources (431 706 PJ, 392 tcf; table 10) are nearly three times the EDR and substantially larger than the estimated cumulative gas production from 2010–11 to 2034–35. Current identified gas resources remaining in 2035 are estimated to be equivalent to around 34 years
PERTH BASIN
Fitzroy Trough(CANNING BASIN)
PEDIRKABASIN
ARCKARINGA BASIN
LAURA BASIN
COOPERBASIN
MURRAYBASIN
TASMANIA BASIN
GIPPSLAND BASINOTWAYBASIN
OAKLANDS BASIN
SYDNEY BASIN
GALILEEBASIN
STYX BASIN
BOWENBASIN
MARYBOROUGHBASIN
GUNNEDAHBASIN
POLDA BASIN
WESTEUCLABASIN
CLARENCE-MORETON
BASIN
GLOUCESTERBASIN
(CSG exploration)
SURATBASIN
PERTH
SYDNEY
DARWIN
HOBART
ADELAIDE
BRISBANE
MELBOURNE
150°140°130°120°
10°
20°
30°
40°
12-6139-38
0 750 km
Coal-Seam Gas Potential
Brown coal basin
Black coal basin
Coal-seam gasproduction area
Gas pipelineGas pipeline (proposed)
Major coal-seam gasexploration area
Figure 38: Basins with coal seam gas potentialSource: Geoscience Australia
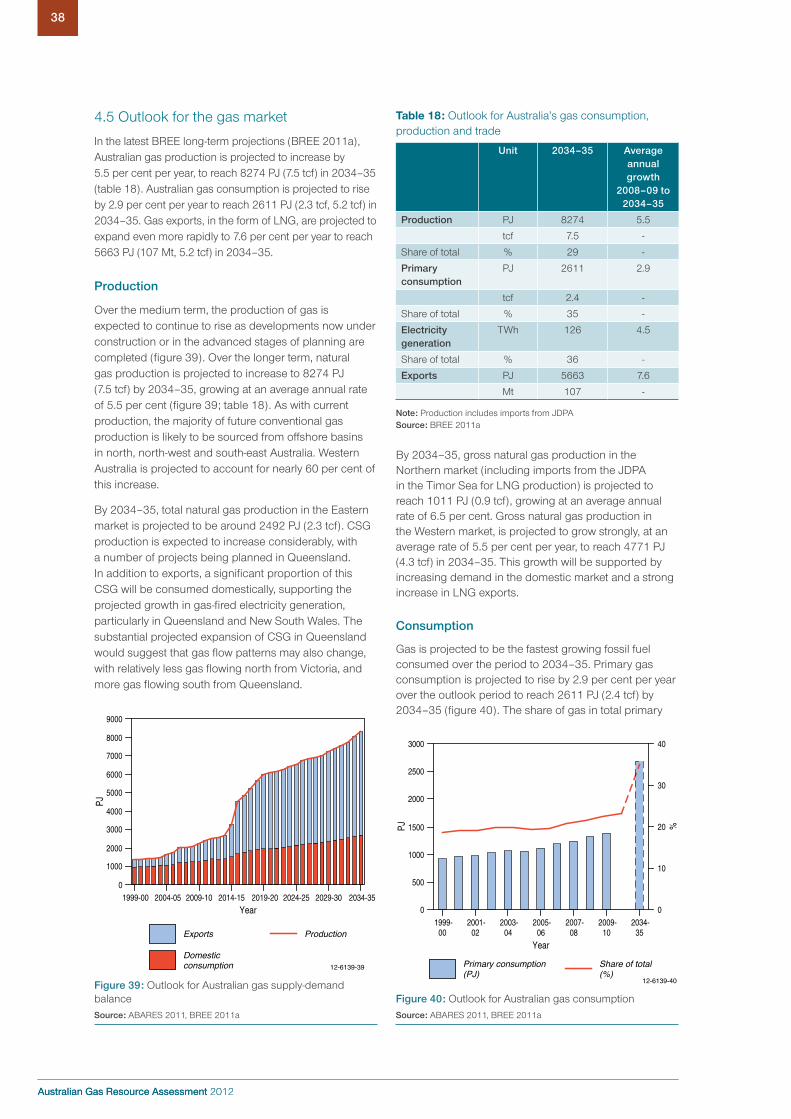
Australian Gas Resource Assessment 2012
38
Australian Gas Resource Assessment 2012
38
By 2034–35, gross natural gas production in the Northern market (including imports from the JDPA in the Timor Sea for LNG production) is projected to reach 1011 PJ (0.9 tcf), growing at an average annual rate of 6.5 per cent. Gross natural gas production in the Western market, is projected to grow strongly, at an average rate of 5.5 per cent per year, to reach 4771 PJ (4.3 tcf) in 2034–35. This growth will be supported by increasing demand in the domestic market and a strong increase in LNG exports.
Consumption
Gas is projected to be the fastest growing fossil fuel consumed over the period to 2034–35. Primary gas consumption is projected to rise by 2.9 per cent per year over the outlook period to reach 2611 PJ (2.4 tcf) by 2034–35 (figure 40). The share of gas in total primary
4.5 Outlook for the gas market
In the latest BREE long-term projections (BREE 2011a), Australian gas production is projected to increase by 5.5 per cent per year, to reach 8274 PJ (7.5 tcf) in 2034–35 (table 18). Australian gas consumption is projected to rise by 2.9 per cent per year to reach 2611 PJ (2.3 tcf, 5.2 tcf) in 2034–35. Gas exports, in the form of LNG, are projected to expand even more rapidly to 7.6 per cent per year to reach 5663 PJ (107 Mt, 5.2 tcf) in 2034–35.
Production
Over the medium term, the production of gas is expected to continue to rise as developments now under construction or in the advanced stages of planning are completed (figure 39). Over the longer term, natural gas production is projected to increase to 8274 PJ (7.5 tcf) by 2034–35, growing at an average annual rate of 5.5 per cent (figure 39; table 18). As with current production, the majority of future conventional gas production is likely to be sourced from offshore basins in north, north-west and south-east Australia. Western Australia is projected to account for nearly 60 per cent of this increase.
By 2034–35, total natural gas production in the Eastern market is projected to be around 2492 PJ (2.3 tcf). CSG production is expected to increase considerably, with a number of projects being planned in Queensland. In addition to exports, a significant proportion of this CSG will be consumed domestically, supporting the projected growth in gas-fired electricity generation, particularly in Queensland and New South Wales. The substantial projected expansion of CSG in Queensland would suggest that gas flow patterns may also change, with relatively less gas flowing north from Victoria, and more gas flowing south from Queensland.
Table 18: Outlook for Australia’s gas consumption, production and trade
Unit 2034–35 Average annual growth
2008–09 to 2034–35
Production PJ 8274 5.5
tcf 7.5 -
Share of total % 29 -
Primary consumption
PJ 2611 2.9
tcf 2.4 -
Share of total % 35 -
Electricity generation
TWh 126 4.5
Share of total % 36 -
Exports PJ 5663 7.6
Mt 107 -
Note: Production includes imports from JDPA Source: BREE 2011a
0
1000
2000
3000
4000
5000
6000
7000
8000
9000
PJ
2034-351999-00 2004-05 2009-10 2014-15 2019-20 2024-25 2029-30
Exports Production
Domesticconsumption
Year
12-6139-39
Figure 39: Outlook for Australian gas supply-demand balance Source: ABARES 2011, BREE 2011a
0
500
1000
1500
2000
2500
3000
PJ
0
10
20
30
40
%
1999-00
2034-35
2001-02
2003-04
2005-06
2007-08
2009-10
Year
Share of total(%)
Primary consumption(PJ)
12-6139-40
Figure 40: Outlook for Australian gas consumptionSource: ABARES 2011, BREE 2011a

Australian Gas Resource Assessment 2012
39Australian Gas Resources 2012
Australian Gas Resource Assessment 2012
39
Wheatstone LNG project (8.9 Mt), the Ichthys project (8.4 Mt) and the Prelude floating LNG project (3.6 Mt). These projects are scheduled to be completed between 2014 and 2017. The Pluto LNG project (annual capacity of 4.3 Mt) started production in April 2012 and is scheduled to deliver its first cargo of LNG in the June quarter of 2012. There are a number of other LNG plants at a less advanced stage (undergoing FEED studies), that are awaiting development.
By 2034–35, LNG exports are projected to reach 5663 PJ (107, 5.2 tcf) Mt. This would represent an average annual growth rate over the outlook period of 7.6 per cent. Production of LNG is projected to increase its share of total Australian gas production to from 40 per cent in 2008–09 to 68 per cent by 2034–35.
Proposed project developments
Upstream
At the end of April 2012, there were seven conventional upstream gas projects under construction or committed across Australia (table 19). Of these projects, four were located in the Carnarvon Basin and others in the Bass and the Gippsland basins. The projects have a combined gas production capacity of 1167 PJ (1.1 tcf) per year. This capacity includes a combination of replacement for declining production at mature fields and increases to Australia’s production capacity. Table 20 identifies one project the Kipper gas project (stage 2) that was at a less advanced stage of development (as at April 2012).
There were also seven upstream coal seam gas projects at planning stage at the end of April 2012 (table 21). Five of these projects are located in New South Wales, while there are two in Queensland. It should be noted that none of the seven projects in table 21 are associated with the three CSG-LNG projects that are under construction in Queensland.
energy consumption is projected to rise to 35 per cent in 2034–35. This consumption growth in demand is projected to be driven primarily by the electricity generation sector and the mining sector, and to be supported by the shift to less carbon intensive fuels in a carbon constrained environment.
Gas-fired electricity generation and its share in total electricity generation are projected to increase considerably over the medium to long term. Electricity generation from natural gas is projected to grow at an average rate of 4.5 per cent per year to 126 TWh in 2034–35. The share of gas in total electricity generation is projected to grow to 36 per cent in 2034–35 (figure 41).
The projected increase in gas-fired electricity generation is supported by the substantial rise of currently committed electricity generation capacity (see section on proposed project developments). Gas-fired electricity generation is based on mature technologies with more competitive cost structures relative to some renewable energy technologies. As such, it has the potential to play a major role in the transition period in the short to medium term until lower-emission technologies become more viable.
LNG exports
Upstream development is expected to substantially expand LNG exports over the next two decades. This is a result of Australia’s abundant gas reserves and their proximity to growing Asia-Pacific markets, but also Australia’s attractiveness as a reliable and stable destination for investment. CSG LNG will provide an important contribution to the growth of the export sector.
At the end of April 2012, there were seven LNG plants that were committed or under construction (table 16), the Queensland Curtis LNG project (8.5Mt), the Gorgon LNG project (15.0 Mt), the Australia Pacific LNG project (4.5 Mt), the Gladstone LNG project (7.8Mt), the
0
100
120
140
0
42
%
2034-35
2001-02
2003-04
2005-06
2007-08
2009-10
Year
Electricity generation(TWh) Share of total (%)
12-6139-41
80
60
40
20
35
28
14
7
21TWh
Figure 41: Outlook for Australian gas-fired electricitySource: ABARES 2011, BREE 2011a
30
20
10
0Committed/
under construction
40
50
70
60
CSG12-6139-42
Total gas
Mtp
a
Existing
Figure 42: Australian LNG export capacitySource: BREE

Australian Gas Resource Assessment 2012
40
Australian Gas Resource Assessment 2012
40
LNG
Australia’s LNG industry is under going a transformation that will see capacity increase four fold to 80 Mt (4200 PJ, 4 tcf) during the second half of the decade. In addition to the 24 Mt (1267 PJ, 1.2 tcf) of current export capacity, including the Pluto project which is scheduled to deliver first LNG exports in the June quarter 2012, there is 57 Mt (3009 PJ, 2.7 tcf) of capacity at various stages of construction. Three of these projects are based on conventional natural gas and located off the coast of Western Australia (table 25). An additional gas field, Ichthys, is located off the coast of Western Australia, however, gas will be piped to Darwin for processing. Final investment decision was taken on the project in January 2012. In Queensland, there are three LNG project under construction, all using coal seam gas as a feedstock (table 26).
Beyond the seven projects under construction there is further scope to increase Australia’s LNG export capacity well beyond 100 Mt. There are a number of greenfield projects under consideration (Browse and Arrow LNG), while projects such as Gorgon, Wheatstone, Pluto and the CSG projects under construction in Queensland have the land footprint to add additional capacity. The decision to proceed with further projects in Australia will depend on a number of factors including access to sufficient gas reserves, gas prices, project costs and the ability to secure supply contracts for LNG exports.
Pipeline
Accompanying the expansion of Australia’s gas production capacity is an expansion to the transmission pipeline network.The second and third stage expansion of the South West Queensland Pipeline (table 22) was completed in December 2011 and will substantially increase capacity along the pipeline that connects southern Queensland to the Moomba gas hub in north eastern South Australia. Several smaller pipeline expansions are committed or being constructed in New South Wales, Victoria, South Australia and Queensland.
Electricity generation
At the end of April 2012 there were seven advanced gas-fired electricity generation projects with a combined capacity of 975 MW that are all scheduled to be in operation by the end of 2012 (table 23). Three of the projects are located in the Northern Territory while there is one each in New South Wales, Victoria, Queensland and Western Australia. In addition, there are a further 42 gas- and CSG-fired generation projects at a less advanced stage with a combined capacity of around 18 000 MW (table 24).
Table 19: Conventional gas projects at an advanced stage of development, as of April 2012
Project Company Basin Status Start up Capacity Capital Expenditure
BassGas (Yolla Mid Life Enhancement)
Origin/AWE/Calenergy Gas
Bass Strait under construction
2012 field life extension
$460 m
Kipper gas project (stage 1)
Esso/BHP Billito /Santos
Gippsland under construction
2012 30 PJ pa gas US$1.8 b (A$1.7 b)
Macedon BHP Billito / Apache Energy
Carnarvon under construction
2013 75 PJ pa gas US$1.5 b (A$1.45 b)
NWS North Rankin B
NWS JV Carnarvon under construction
2013 967 PJ pa gas US$5.1 b (A$5 b)
Spar Apache Energy /Santos
Carnarvon committed 2013 18 PJ pa US$120 m (A$117 m)
Turrum ExxonMobil/BHP Billiton
Gippsland under construction
2013 77 PJ pa gas US$2.7 b (A$2.6 b)
Greater Western Flank
NWS JV Carnarvon under construction
2016 nil (maintain throughput at NWS)
US$2.4 b (A$2.3 b)
Source: BREE 2012c
Table 20: Conventional gas projects at a less advanced stage of development, as of April 2012
Project Company Location Status Start up Capacity Capital Expenditure
Kipper gas project (stage 2)
Esso/BHP Billiton/Santos
Gippsland Basin
Feasibility study under way
2015 27 PJ pa na
Source: BREE 2012c

Australian Gas Resource Assessment 2012
41Australian Gas Resources 2012
Australian Gas Resource Assessment 2012
41
Table 21: CSG projects at various stages of development, as of April 2012
Project Company Location Status Start up Capacity Capital Expenditure
Blackwater/Norwich Park CSG project
Bow Energy Bowen Basin EIS under way 2015 na na
Camden Gas Project (stage 2)
AGL Camden on hold na 12 PJ pa $35 m
Camden Gas Project (stage 3)
AGL Camden on hold na na $100 m
Casino project Metgasco Casino on hold na 18 PJ pa na
Gloucester Coal Seam gas project
AGL Hunter Valley on hold na 15–25 PJ pa $200 m
Narrabri coal seam gas project
Eastern Star Gas/Santos
Narrabri on hold na 20 PJ pa (initally) (150 PJ pa ultimately)
$1.3 b
Surat Gas Project Arrow Energy Surat Basin EIS under way 2016–18 180–360 PJ pa
na
Source: BREE 2012c
Table 22: Gas pipelines at various stages of development, as of April 2012
Project Company Location Status Start up Capacity Capital Expenditure
Roma to Brisbane pipeline
Australian Pipeline Group
Roma to Brisbane (450 km)
under construction
2012 10 PJ pa $50 m
Goldfields pipeline expansion
Australian Pipeline Group
Pilbara under construction
2014 16 PJ pa $150 m
Dampier–Bunbury gas pipeline (DBNGP) expansion (stage 5C)
DBP Dampier to Bunbury
feasibility study under way
na 100 PJ pa (total)
$800 m
Gloucester Coal Seam Gas pipeline
AGL Gloucester to Hexham (98 km)
EIS under way na 15–22 PJ pa $50–80 m
Great Northern Pipeline Buru Energy Broome to Port Hedland (550 km)
pre FEED studies under way
na up to 90 PJ pa
$500 m
Lions Way pipeline Metgasco Casino to Ipswich (145 km)
EIS under way na 27 PJ pa $120 m
Newstead to Bulla Park pipeline
Australian Pipeline Group
Newstead (Qld) to Bulla park (NSW)
feasibility study under way
na na $500 m
Queensland–Hunter gas pipeline
Hunter Gas Pipeline
Wallumbilla (Qld) to Newcastle (NSW) (830 km)
govt approval received
2013 85 PJ pa $900 m
Wellington Power Station Pipeline
ERM Power Young to Wellington
govt approval received
2014 na $200 m
Source: BREE 2012c

Australian Gas Resource Assessment 2012
42
Australian Gas Resource Assessment 2012
42
Table 23: Gas-fired power stations at an advanced stage of development, as of October 2011
Project Company Location Status Start up Capacity Capital Expenditure
Blackwater Power Project
Bow Energy Qld Under construction 2012 30 MW $35 m
Channel Island Power Station
Power and Water Corporation
NT Under construction late 2011 90 MW $120 m
Kwinana Power Station rebuild
Verve Energy WA Under construction 2012 200 MW $263 m
Mortlake Stage 1 Origin Energy Vic Under construction late 2011 550 MW $735 m
Owen Springs Power and Water Corporation
NT Under construction 2012 33 MW $126 m
Weddell stage 3 Power and Water Corporation
NT Under construction 2012 43 MW $50 m
Wilga Park B (Two Stages)
Eastern Star Gas/Santos
NSW Committed 2012 (initially 6 MW)
29 MW $42 m
Source: BREE 2011b
Table 24: Gas-fired power stations at a less advanced stage of development, as of October 2011
Project Company Location Status Expected Startup
New Capacity Capital Expenditure
Aldoga Power Station TRUenergy Qld Government approval under way
na 500 MW initially (1500 MW ultimately)
$1.8 b
Bamarang stage 1 Infratil NSW Government approval received
na 250–300 MW na
Bamarang stage 2 Infratil NSW Government approval received
na 100–150 MW $130 m
Blackstone Power Station
TRUenergy Qld Government approval under way
na 500 MW initially (1500 MW ultimately)
$1.8 b
Braemar 3 ERM Power Qld Government approval received
2014 550 MW $550 m
Braemar 4 ERM Power Qld Feasibility study under way
na 550 MW na
Centauri 1 Eneabba Gas WA Government approval received
2013 168 MW $150 m
Dalton Power Station AGL Energy NSW Government approval under way
post 2014 500 MW (1500 MW ultimately)
$250–800 m (up to $1.5 b ultimately)
Darling Downs Power Station 2
Origin Energy Qld Government approval under way
2012 500 MW na
Diamintina power station (Two Stages)
APA Group/AGL Energy
Qld Project financing underway
2013 242 MW $500 m
Hanging Rock stage 1 Loran Energy Products
NSW Government approval under way
na 300 MW $360 m
Hanging Rock stage 2 Loran Energy Products
NSW Government approval under way
na 300 MW $240 m
Kerrawary Power Station Project
Origin Energy NSW Feasibility study under way
na 1000 MW na
Leafs Gully AGL Energy NSW Government approval received
post 2014 360 MW $250 m
Marulan Gas Turbine Facility
TRUenergy NSW Government approval received
na 350 MW $280 m
Marulan Gas Turbine Facility stage 1
TRUenergy NSW Government approval received
2013–14 250–350 MW $280 m
Marulan Gas Turbine Facility stage 2
TRUenergy NSW Government approval received
2013–14 100–150 MW $235 m

Australian Gas Resource Assessment 2012
43Australian Gas Resources 2012
Australian Gas Resource Assessment 2012
43
Project Company Location Status Expected Startup
New Capacity Capital Expenditure
Mortlake stage 2 Origin Energy Vic Environmental approval received
na 450 MW na
Munmorah rehabilitation Delta Electricity
NSW Government approval received
na 100 MW $795 m
Narrabri 1 East Coast Power
NSW Planning approval under way
2013 30 MW $150m (incl. stages 1 and 2)
Narrabri 2 East Coast Power
NSW Planning approval under way
2014 180 MW $150m (incl. stages 1 and 2)
Neerabup 2 ERM Power WA Feasibility study under way
na 330 MW na
NQ Peaker AGL Energy Qld Prefeasibility study under way
post 2015 360 MW $250–320 m
Port Hedland Power Station Conversion Project
Alinta Energy WA Environmental approval under way
2014 100 MW na
Port Kembla Steelworks Co-generation plant
Bluescope Steel
NSW Environmental approval under way
na 220 MW $750 m
Richmond Valley Power Station and Casino Gas project
Metgasco NSW Government approval received
na 30 MW $40 m
SEQ1 AGL Energy Qld Prefeasibility study under way
post 2015 360 MW $252–324 m
SEQ2 AGL Energy Qld Prefeasibility study under way
post 2014 1150 MW $805–1035m
Shaw River stage 1 Santos Vic Environmental approval received
2012 500 MW $880m (incl. 105 km pipeline from Pt Campbell)
Shaw River stages 2 & 3 Santos Vic Environmental approval under way
na 1000 MW na
South Hedland Power Station
Horizon Power WA Pending approval, Environmental approval under way
2016 120 MW $420 m
Spring Gully stage 1 Origin Energy Qld Government approval under way
na 500 MW na
Spring Gully stage 2 Origin Energy Qld Government approval under way
na 500 MW na
Swanbank F Stanwell Corporation
Qld Feasibility study under way
na 400 MW na
Tallawara stage 2 TRUenergy NSW Planning approval received
2015 500 MW $500 m
Tarrone AGL Energy Vic Government approval under way
post 2014 550 MW initially (900 MW ultimately)
$350–600 m
Three Springs ERM Power WA Environmental approval received
na 330 MW na
Torrens Island Power Station (TIPS)
AGL Energy SA Government approval received
post 2015 700 MW $800 m
Valley Power Station Augmentation project
Snowy Hydro Vic Government approval received, on hold
na 50–100MW $80–100m
Wellington ERM Power NSW Government approval received
2015 550–660 MW $700 m
Westlink Power Project Westlink Qld Government approval under way
2012 (Stage 1)
200–300 MW $200 m
Yallourn Power Station TRUenergy Vic Government approval under way
2015 1000 MW na
Source: BREE 2011b
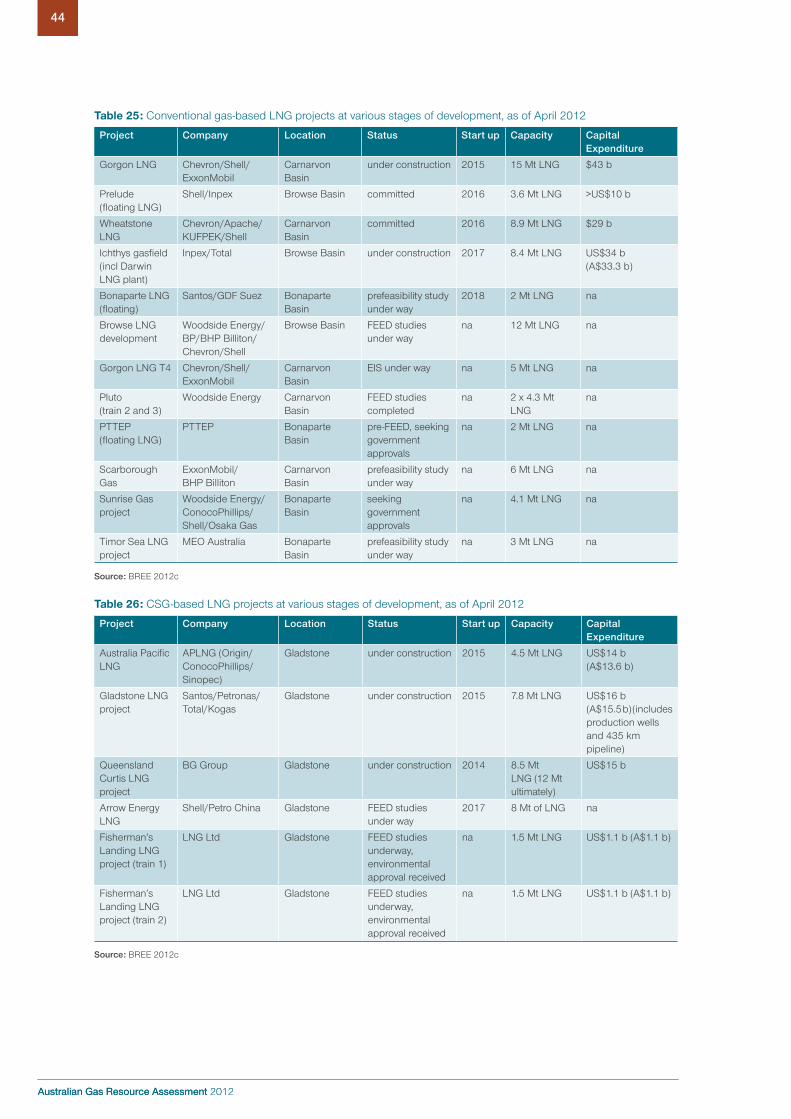
Australian Gas Resource Assessment 2012
44
Australian Gas Resource Assessment 2012
44
Table 25: Conventional gas-based LNG projects at various stages of development, as of April 2012
Project Company Location Status Start up Capacity Capital Expenditure
Gorgon LNG Chevron/Shell/ExxonMobil
Carnarvon Basin
under construction 2015 15 Mt LNG $43 b
Prelude (floating LNG)
Shell/Inpex Browse Basin committed 2016 3.6 Mt LNG >US$10 b
Wheatstone LNG
Chevron/Apache/KUFPEK/Shell
Carnarvon Basin
committed 2016 8.9 Mt LNG $29 b
Ichthys gasfield (incl Darwin LNG plant)
Inpex/Total Browse Basin under construction 2017 8.4 Mt LNG US$34 b (A$33.3 b)
Bonaparte LNG (floating)
Santos/GDF Suez Bonaparte Basin
prefeasibility study under way
2018 2 Mt LNG na
Browse LNG development
Woodside Energy/BP/BHP Billiton/ Chevron/Shell
Browse Basin FEED studies under way
na 12 Mt LNG na
Gorgon LNG T4 Chevron/Shell/ExxonMobil
Carnarvon Basin
EIS under way na 5 Mt LNG na
Pluto (train 2 and 3)
Woodside Energy Carnarvon Basin
FEED studies completed
na 2 x 4.3 Mt LNG
na
PTTEP (floating LNG)
PTTEP Bonaparte Basin
pre-FEED, seeking government approvals
na 2 Mt LNG na
Scarborough Gas
ExxonMobil/BHP Billiton
Carnarvon Basin
prefeasibility study under way
na 6 Mt LNG na
Sunrise Gas project
Woodside Energy/ConocoPhillips/Shell/Osaka Gas
Bonaparte Basin
seeking government approvals
na 4.1 Mt LNG na
Timor Sea LNG project
MEO Australia Bonaparte Basin
prefeasibility study under way
na 3 Mt LNG na
Source: BREE 2012c
Table 26: CSG-based LNG projects at various stages of development, as of April 2012
Project Company Location Status Start up Capacity Capital Expenditure
Australia Pacific LNG
APLNG (Origin/ConocoPhillips/ Sinopec)
Gladstone under construction 2015 4.5 Mt LNG US$14 b (A$13.6 b)
Gladstone LNG project
Santos/Petronas/Total/Kogas
Gladstone under construction 2015 7.8 Mt LNG US$16 b (A$15.5 b) (includes production wells and 435 km pipeline)
Queensland Curtis LNG project
BG Group Gladstone under construction 2014 8.5 Mt LNG (12 Mt ultimately)
US$15 b
Arrow Energy LNG
Shell/Petro China Gladstone FEED studies under way
2017 8 Mt of LNG na
Fisherman’s Landing LNG project (train 1)
LNG Ltd Gladstone FEED studies underway, environmental approval received
na 1.5 Mt LNG US$1.1 b (A$1.1 b)
Fisherman’s Landing LNG project (train 2)
LNG Ltd Gladstone FEED studies underway, environmental approval received
na 1.5 Mt LNG US$1.1 b (A$1.1 b)
Source: BREE 2012c

Australian Gas Resource Assessment 2012
45Australian Gas Resources 2012
Australian Gas Resource Assessment 2012
45
5 ReferencesABARES (Australian Bureau of Agricultural and Resource Economics and Sciences), 2011, Australian Energy Statistics, Canberra, June
AEMO (Australian Energy Market Operator), 2011. Gas statement of opportunities for Eastern and South Eastern Australia
AER (Australian Energy Regulator), 2011, State of the energy market 2011, Australian Competition and Consumer Commission, Melbourne
APPEA (Australian Petroleum Production and Exploration Association), 2011, Annual production statistics. http://www.appea.com.au/images/stories/Statistics/Annual_Production_Statistics.xls
APPEA, 2009, State of the Industry 2009, Canberra
Arrow Energy Ltd, 2009, Queensland Energy Conference, Brisbane, February
Australian Treasury, 2011, Strong growth, low pollution: modelling a carbon price, Canberra.
Baker GL and Slater SM, 2009, Coal seam gas – an increasingly significant source of natural gas in eastern Australia. The APPEA Journal 46 (1) 79–100
Banks FE, 2000, Energy Economics: a Modern Introduction, Kluwer Academic Publishers, Boston, Dordrecht and London
BP, 2011, BP Statistical Review of World Energy, London, June
Boreham CJ, Hope JM and Hartung-Kagi B, 2001, Understanding source, distribution and preservation of Australian natural gas: a geochemical perspective. The APPEA Journal 41 (1) 523–547
Boreham CJ, Edwards DS, Hope JM, Chen J and Hong Z, 2008, Carbon and hydrogen isotopes of neo-pentane for biodegraded natural gas correlation. Organic Geochemistry 39, 1483–1486
Bradshaw MT, Foster CB, Fellows ME and Rowland DC, 1999, The Australian search for petroleum-patterns of discovery. The APPEA Journal, 39 (1), 1–18
BREE (Bureau of Resource Energy Economics), 2011a, Australian Energy Projections to 2034–35, Canberra
BREE, 2011b, Electricity generation: Major development projects – October 2011 listing, Canberra
BREE, 2012a, Resources and Energy Quarterly, vol. 1, no. 3, March quarter, Canberra
BREE, 2012b, Energy in Australia 2012, Canberra
BREE, 2012c, Minerals and energy: Major development projects –May 2012 listing, Canberra (currently in preparation)
Branan N, 2008, Exploration and innovation: Geoscientists push the frontiers of unconventional oil and gas, http://www.jsg.utexas.edu/news/feats/2008/exploration_innovation.html
Campbell I, 2009, An Overview of Tight Gas Resources in Australia, PESA News, June/July issue
Chevron Australia, 2009, Gorgon – its time is now, Perth, http://www.chevronaustralia.com/ourbusinesses/gorgon.aspx
Costain, 2009, The case for floating LNG production, http://costain-floating-lng.com/floating-lng.php
DEEDI (Department of Employment, Economic Development and Innovation), 2011. Gas market review Queensland. Queensland Government. http://www.deedi.qld.gov.au/energy/gas-market-rev.htm
DEEDI 2012, Queensland’s coal seam gas overview, Queensland Government. http://mines.industry.qld.gov.au/assets/coal-pdf/new_csg_cc.pdf
DNRME (Department of Natural Resources, Mines and Energy), 2010, Coal Seam Gas Water Management Policy, June 2010 http://www.derm.qld.gov.au/environmental_management/coal-seam-gas/pdf/water-management-policy.pdf
Draper JJ, and Boreham CJ, 2006, Geological controls on exploitable coal seam gas distribution in Queensland. The APPEA Journal 46 (1) 343-366.
EIA (Energy Information Administration), 2011, World Shale Gas Resources: An initial assessment of 14 regions outside the United States. Energy Information Administration, Washington
EIA, 2012, Natural gas gross withdrawals and production, Washington
ESAA (Energy Supply Association of Australia), 2011, Electricity and gas Australia, Melbourne
Frith D, 2004, Amity Oil remains optimistic. Prospect Magazine, December 2003-February 2004, Western Australia Department of Industry and Resources, page 6, http://www.dsd.wa.gov.au/documents/ProspectDec03-Feb04(1).pdf
Geoscience Australia and ABARE, 2010, Australian Energy Resource Assessment, Canberra
Geoscience Australia, 2012, Oil and Gas Resources of Australia 2010 Report http://www.ga.gov.au/oceans/pgga_OGRA.jsp
Holditch, S.A., 2006, Tight Gas Sands, JPT, June 20006 84-90, paper SPE 103356
IEA (International Energy Agency), 2009, World Energy Outlook, OECD, Paris
IEA , 2011a, World energy outlook, 2011 edition, OECD, Paris
IEA, 2011b, World energy outlook: Golden age of gas, OECD, Paris
IEA, 2011c, World Energy Balances, 2011 edition, OECD, Paris
IEA, 2011d, Natural gas information, 2011 edition, OECD, Paris
IEA, 2011e, Medium-term oil and gas markets 2011, OECD, Paris
IIESC, 2012, Interim Independent Expert Scientific Committee on Coal Seam Gas and Coal Mining, http://www.environment.gov.au/coal-seam-gas-mining/index.html
Inpex, 2012, Ichthys Project http://www.inpex.com.au/projects/ichthys-project/project-overview.aspx;
Kimber M and Moran A, 2004, More than Davy Lamps and Canaries – Coal Seam Gas in the 21st Century, Energy Issues paper No. 34, Institute of Public Affairs, Melbourne
Lakes Oil, 2011, Tight Gas: A Lonely Journey, Lakes Oil, June
Lavin, 2011, PESA Industry Review – Exploration, The APPEA Journal, 2011, 147-166
Law, B.R., 2002, Basin-centered gas systems AAPG Bulletin, V. 86, No. 11 (November 2002) 1891-1919
Longley IM, Buessenschuett C, Clydsdale L, Cubitt CJ, Davis RC, Johnson MK, Marshall NM, Murray AP, Somerville R, Spry TB and Thompson NB, 2002, The North West Shelf of Australia – a Woodside perspective. In: Keep M and Moss SJ (editors), The Sedimentary Basins of Western Australia 3: Proceedings of the Petroleum Exploration Society of Australia Symposium, Perth, 27–88
Australian Gas Resource Assessment 2012
46
Australian Gas Resource Assessment 2012
46
Magoon LB and Dow WG, 1994, The petroleum system. In Magoon LB and Dow WG (eds) The petroleum system – from source to trap. AAPG Memoir 60, AAPG, Tulsa, USA, 3-24
Makogon YF, Holditch SA and Makogon TY, 2007, Natural gas-hydrates – a potential energy source for the 21st Century. Journal of Petroleum Science and Engineering 56 (2007) 14–31
McCabe PJ, 1998, Energy resources – Cornucopia or empty barrel? American Association of Petroleum Geologists Bulletin, V 82, no. 11, 2110–2134
McKirdy DM and Cook PJ, 1980, Organic Geochemistry of Pliocene-Pleistocene Calcareous Sediments, DSDP Site 262, Timor Trough. American Association of Petroleum Geologists Bulletin, Volume 64, 2118–2138
McMillan, D. 2009. SPE-PRMS and reserves reporting in Australia. PESA News December/January 2009/2010
Milkov AV, 2004, Global Estimates of Hydrate-bound Gas in Marine Sediments: How Much is Really Out There, Earth-Science Reviews, Vol. 66, 183–197
Nippon GTL, 2009, Japan-GTL demonstration test project, http://www.nippon-gtl.or.jp/en/index.html
NOPSEMA, 2012, The National Offshore Petroleum Safety and Environmental Management Authority http://www.nopsema.gov.au/
NOPTA, 2012, National Offshore Petroleum Titles Administrator, www.nopta.gov.au/index.html
Origin Energy, 2009, Waste and emissions – water from coal seam operations, http://www.originenergy.com.au/1748/Waste-and-emissions
Pearce F, 2009, Ice on Fire. New Scientist 27 June, 30–33
Pollastro, R.M., Brownfield, M.E., Charpentier, R.R., Cook, T.A., Klett, T.R., Kirschbaum, M.A., Pitman, J.K., and Schenk, C.J., 2012, Assessment of undiscovered conventional oil and gas resources of Bonaparte Basin, Browse Basin, Northwest Shelf, and Gippsland Basin Provinces, Australia, 2011: U.S. Geological Survey Fact Sheet 2012–3025, 2 p.
Powell TG, 2004, Australia’s hydrocarbon resources – where will future production come from? The APPEA Journal, 44 (1), 729–740
Productivity Commission, 2009, Review of Regulatory Burden on the Upstream Petroleum (Oil and Gas) Sector, http://www.pc.gov.au/projects/study/upstreampetroleum
Purcell PG and Purcell RR, 1988, The North West Shelf, Australia – An Introduction. In PG & RR Purcell (editors) Proceedings PESA North West Shelf Symposium, Perth 1988
Report of the Montara Commission of Inquiry, 2010. http://www.ret.gov.au/Department/Documents/MIR/Montara-Report.pdf
RET 2011 http://www.ret.gov.au/resources/carbon_dioxide_capture_and_geological_storage/carbon_capture_and_storage_acreage_release/Pages/default.aspx
Santos, 2009, 2009 Energy White Paper Public Submission, May, http://www.ret.gov.au/energy/Documents/ewp/pdf/EWP%200046%20DP%20Submission%20-%20Santos.pdf
Scott DJ, 2009, Gas hydrates: threat or opportunity? Groningen Gas 50 http://www.groningengas50.nl/nl/site/conferentie/lezingen-17-juni
Sharif A, 2007, Tight gas resources in Western Australia. In Petroleum in Western Australia September 2007, 28-31. Department of Mines and Petroleum, http://www.dmp.wa.gov.au/138_1491.aspx
Shell, 2012, Prelude http://www.shell.com.au/home/content/aus/aboutshell/who_we_are/shell_au/operations/upstream/prelude/
Society of Petroleum Engineers (SPE), American Association of Petroleum Geologists (AAPG), World Petroleum Council (WPC) and Society of Petroleum Evaluation Engineers (SPEE), 2007, Petroleum Resources Management System. http://www.spe.org/spe-app/spe/industry/reserves/index.htm
Upton,D. 2012, Deep water heartbreak, Energynewspremium.net, 5 April 2012
Vencorp 2005, Vision 2030: 25 year vision for Victoria’s Energy Transmission Networks October 2005
Walker TR, 2007, Deepwater and frontier exploration in Australia – historical perspectives, present environment and likely future trends. The APPEA Journal, 47 (1), 1–15
Williamson PE and Kroh F, 2007, The role of amplitude versus offset technology in promotion offshore petroleum exploration in Australia, The APPEA Journal, 47 (1), 161–174
World Energy Council, 2007, Survey of Energy Resources 2007, London, http://www.worldenergy.org

Australian Gas Resource Assessment 2012
Chapter title
47
Australian Gas Resource Assessment 2012
47
Appendices
Appendix A: Abbreviations and AcronymsABARES Australian Bureau of Agricultural and INF Inferred resources
Resource Economics and Sciences LNG Liquefied natural gas (Australian Government)
LPG Liquefied petroleum gas AEMO Australian Energy Market Operator
OECD Organisation for Economic Co-operation AER Australian Energy Regulator and Development APPEA Australian Petroleum Production and RET Department of Resources, Energy
Exploration Association and Tourism (Australian Government) BREE Bureau of Resources and Energy RET Renewable Energy Target
Economics (Australian Government)SDR Sub-economic demonstrated resources
CBM Coal bed methaneSEWPAC Department of Sustainability, Environment,
CCS Carbon (dioxide) capture and storage Water, Population and Communities CMM Coal mine methane (Australian Government)
CSG Coal seam gas SPE-PRMS Society of Petroleum Engineers’ Petroleum Resources Management SystemCSIRO Commonwealth Scientific and Industrial
Research Organisation STTM Short Term Trading Market
DEEDI Department of Employment, USGS United States Geological Survey Economic Development and Innovation VWGM Victorian Wholesale Gas Market (Queensland Government)
WEC World Energy Council DNRME Department of Natural Resources,
Mines and Energy (Australian Government) Units EDR Economic demonstrated resources
GJ Gigajoule – 109 joules EIA Energy Information Administration
GW Gigawatt – 109 watts EPBC Environmental Protection and
ML Megalitre – million (106) litres Biodiversity Conservation Act 1999 (Commonwealth of Australia) mmbbl Million (106) barrels
ESAA Energy Supply Association of Australia Mt Million (106) tonnes
ETS Emissions Trading Scheme MW Megawatts – 106 watts
FLNG Floating liquefied natural gas PJ Petajoules – 1015 joules
GA Geoscience Australia tcf Trillion (1012) cubic feet
GTL Gas-to-liquids TWh Terawatt-hours – 1012 watt-hours
IEA International Energy Agency

Australian Gas Resource Assessment 2012
48
Australian Gas Resource Assessment 2012
48
Appendix B: Glossary
Accumulation
An individual body of naturally occurring petroleum in a reservoir or a group of reservoirs that are related to a localised geological structural feature and/or stratigraphic condition (trap).
Availability factor
Percentage of time that an electricity generating plant can be operated at full output.
Basin
A geological depression filled with sedimentary rocks.
Basin-centred gas
A term used to describe “regionally pervasive gas accumulations that are abnormally pressured, commonly lack a downdip water contact and have low permeability reservoirs” (Law, 2002).
Coal seam gas (CSG)
Naturally occurring methane in coal seams.
Conventional resources (petroleum)
Petroleum resources within discrete accumulations that are recoverable through wells (boreholes) and typically require minimal processing prior to sale. For natural gas, the term generally refers to methane held in a porous rock reservoir frequently in combination with heavier hydrocarbons.
Conversion
The process of transforming one form of energy into another before use. Conversion itself consumes energy, calculated as the difference between the energy content of the fuels consumed and that of the fuels produced.
Development
Phase in which an oil or gas field is brought into production by drilling production wells and installing facilities.
Discovered petroleum initially-in-place
Quantity of petroleum that is estimated, as of a given date, to be contained in known accumulations prior to production.
Discovery
First well (borehole) in a new field from which any measurable amount of oil or gas has been recovered. A well that makes a discovery is classified as a new field discovery.
Exploration
Phase in which a company or organisation searches for petroleum or mineral resources by carrying out detailed geological and geophysical surveys, followed up where appropriate by drilling and other evaluation of the most prospective sites.
Extension/appraisal wells
Wells (boreholes) drilled to determine the physical extent, reserves and likely production rate of a field.
Field
An area consisting of a single reservoir or multiple reservoirs grouped on, or related to, the same individual geological structural feature and/or stratigraphic condition.
Fossil fuels
A hydrocarbon deposit in geological formations that may be used as fuel such as crude oil, coal or natural gas.
Gas-to-liquids
Technologies that use specialised processing (e.g. Fischer-Tropsch synthesis) to convert natural gas into liquid petroleum products.
Gas hydrates
Naturally occurring ice-like solids (clathrates) in which water molecules trap gas molecules in deep-sea sediments or in and below the permafrost soils of the polar regions.
Liquid fuels
All liquid hydrocarbons, including crude oil, condensate, LPG, and other refined petroleum products.
Liquefied natural gas (LNG)
Natural gas that is cooled to around -160°C until it forms a liquid, to make it easier and cheaper to transport long distances in LNG tankers to markets.
Megawatt, gigawatt, terawatt
106, 109, 1012 watts respectively. Measures of electricity generator capacity or output. Consumption is measured in multiples of watt-hours. See also Appendix D.
Non-renewable resources
Resources, such as fossil fuels (crude oil, natural gas, coal) and uranium that are depleted by extraction.
Petajoule
1015 joules, the standard form of reporting energy aggregates. One petajoule is equivalent to 278 gigawatt-hours. See also Appendix D.
Australian Gas Resource Assessment 2012
49Appendices
Australian Gas Resource Assessment 2012
49
Play (geological)
A model that can be used to direct petroleum exploration. It is a group of fields or prospects in the same region and controlled by the same set of geological circumstances.
Primary energy
Energy found in nature that has not been subjected to any conversion or transformation process.
Production
The phase of bringing well fluids to the surface, separating them and storing, gauging and otherwise preparing them for transport.
Prospect (geological)
A potential accumulation of petroleum or minerals that is sufficiently well-defined to represent a viable drilling target.
Resources
A concentration of naturally occurring solid, liquid or gaseous materials in or on the Earth’s crust in such form and amount that its economic exploitation is currently or potentially feasible. See also Appendix C.
Shale gas
Natural gas which has not migrated to a reservoir rock but is still contained within low permeability, organic-rich source rocks such as shales and fine-grained carbonates. Natural or hydraulically induced fracture networks are needed to produce shale gas at economic rates.
Total primary energy consumption
Also referred to as total domestic availability. The total of the consumption of each primary fuel (in energy units)
in both the conversion and end-use sectors. It includes the use of primary fuels in conversion activities – notably the consumption of fuels used to produce petroleum products and electricity. It also includes own-use and losses in the conversion sector.
Tight gas
Gas occurring within low permeability reservoir rocks, with matrix porosities of ≤10% and permeabilities ≤0.1 mD. In practice it is a poorly defined category that merges with conventional and shale gas, but generally tight gas can be considered as being found in low permeability reservoirs that require large scale hydraulic fracture treatments and/or horizontal wells to produce at economic flow rates or to recover economic volumes
Trap (geological)
Any barrier to the upward movement of oil or gas, allowing either or both to accumulate. The barrier can be a stratigraphic trap, an overlying impermeable rock formation or a structural trap as result of faulting or folding.
Unconventional resources
Resources within petroleum accumulations that are pervasive throughout a large area and that are not significantly affected by hydrodynamic influences. Typically, such accumulations require specialised extraction technology. Examples include coal seam gas (CSG), tight gas, shale gas and gas hydrates.
Undiscovered accumulation
Generally, all undiscovered petroleum deposits irrespective of their economic potential. All of the petroleum accumulations that may occur in multiple reservoirs within the same structural or stratigraphic trap are referred to as undiscovered fields.
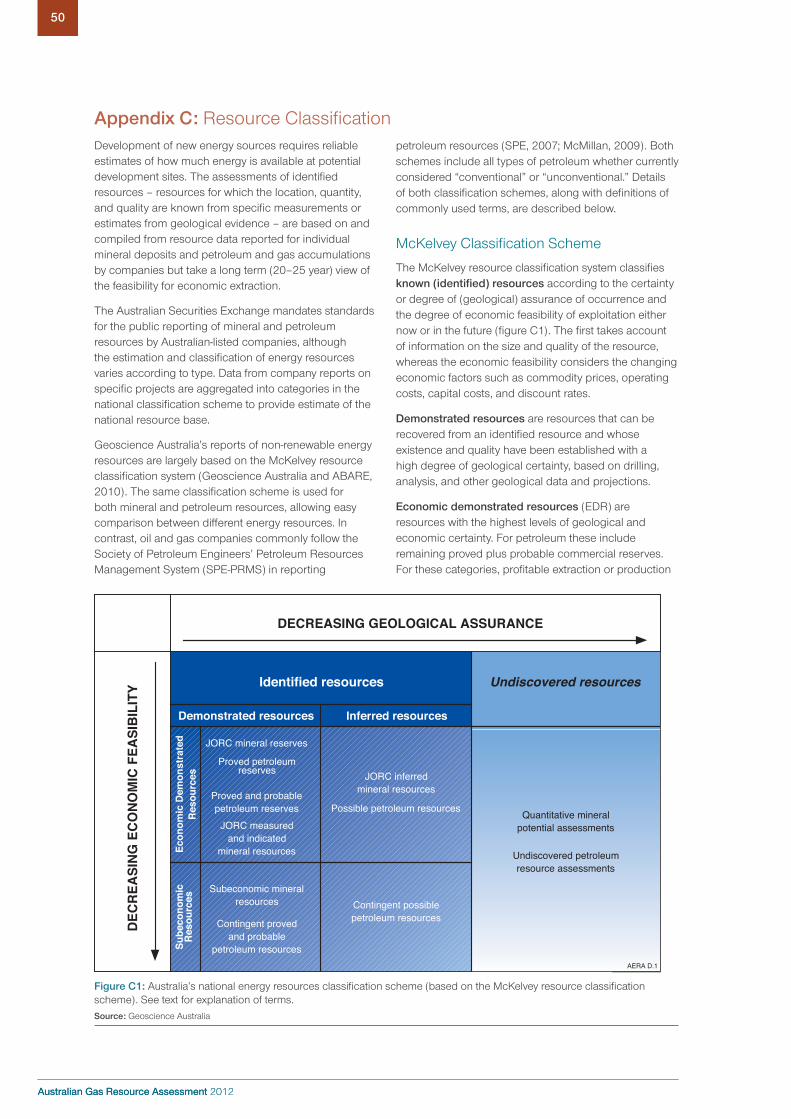
Australian Gas Resource Assessment 2012
50
Australian Gas Resource Assessment 2012
50
Appendix C: Resource ClassificationDevelopment of new energy sources requires reliable estimates of how much energy is available at potential development sites. The assessments of identified resources – resources for which the location, quantity, and quality are known from specific measurements or estimates from geological evidence – are based on and compiled from resource data reported for individual mineral deposits and petroleum and gas accumulations by companies but take a long term (20–25 year) view of the feasibility for economic extraction.
The Australian Securities Exchange mandates standards for the public reporting of mineral and petroleum resources by Australian-listed companies, although the estimation and classification of energy resources varies according to type. Data from company reports on specific projects are aggregated into categories in the national classification scheme to provide estimate of the national resource base.
Geoscience Australia’s reports of non-renewable energy resources are largely based on the McKelvey resource classification system (Geoscience Australia and ABARE, 2010). The same classification scheme is used for both mineral and petroleum resources, allowing easy comparison between different energy resources. In contrast, oil and gas companies commonly follow the Society of Petroleum Engineers’ Petroleum Resources Management System (SPE-PRMS) in reporting
petroleum resources (SPE, 2007; McMillan, 2009). Both schemes include all types of petroleum whether currently considered “conventional” or “unconventional.” Details of both classification schemes, along with definitions of commonly used terms, are described below.
McKelvey Classification Scheme
The McKelvey resource classification system classifies known (identified) resources according to the certainty or degree of (geological) assurance of occurrence and the degree of economic feasibility of exploitation either now or in the future (figure C1). The first takes account of information on the size and quality of the resource, whereas the economic feasibility considers the changing economic factors such as commodity prices, operating costs, capital costs, and discount rates.
Demonstrated resources are resources that can be recovered from an identified resource and whose existence and quality have been established with a high degree of geological certainty, based on drilling, analysis, and other geological data and projections.
Economic demonstrated resources (EDR) are resources with the highest levels of geological and economic certainty. For petroleum these include remaining proved plus probable commercial reserves. For these categories, profitable extraction or production
Quantitative mineralpotential assessments
Undiscovered resourcesIdentified resources
DEC
REA
SIN
G E
CO
NO
MIC
FEA
SIB
ILIT
Y
DECREASING GEOLOGICAL ASSURANCE
Undiscovered petroleumresource assessments
Possible petroleum resources
Contingent possiblepetroleum resources
Econ
omic
Dem
onst
rate
dR
esou
rces
Sube
cono
mic
Res
ourc
es
Subeconomic mineralresources
Proved petroleumreserves
Proved and probablepetroleum reserves
JORC mineral reserves
JORC inferredmineral resources
JORC measuredand indicated
mineral resources
Contingent provedand probable
petroleum resourcesAERA D.1
Demonstrated resources Inferred resources
Figure C1: Australia’s national energy resources classification scheme (based on the McKelvey resource classification scheme). See text for explanation of terms.Source: Geoscience Australia
Australian Gas Resource Assessment 2012
51Appendices
Australian Gas Resource Assessment 2012
51
contained in known accumulations prior to production plus those estimated quantities in accumulations yet to be discovered (equivalent to “total resources”).
Discovered petroleum initially-in-place is the quantity of petroleum that is estimated, as of a given date, to be contained in known accumulations prior to production. This is equivalent to “identified resources” in Australia’s energy resource classification scheme.
Reserves are those quantities of petroleum anticipated to be commercially recoverable by application of development projects to known accumulations from a given date forward under defined conditions. Reserves must further satisfy four criteria: they must be discovered, recoverable, commercial, and remaining (as of the evaluation date) based on the development project(s) applied.
Reserves are further categorized in accordance with the level of certainty associated with the estimates. Low best, and high estimates are donated as 1P/2P/3P, respectively and equate to the following:
• 1P (or P90): at least a 90% probability that the quantities actually recovered will equal or exceed the low estimate.
• 2P (or P50): at least a 50% probability that the quantities actually recovered will equal or exceed the best estimate.
� 3P (or P10): at least a 10% probability that the quantities actually recovered will equal or exceed the high estimate.
The different reserves categories are then based on these certainty levels as follows:
• Proved Reserves are those quantities of petroleum, which, by analysis of geoscience and engineering data, can be estimated with reasonable certainty to be commercially recoverable, from a given date forward, from known reservoirs and under defined economic conditions, operating methods, and government regulations. If deterministic methods are used, the term reasonable certainty is intended to express a high degree of confidence that the quantities will be recovered. If probabilistic methods are used, there should be at least a 90% probability (1P or P90) that the quantities actually recovered will equal or exceed the estimate.
• Probable Reserves are those additional Reserves which analysis of geoscience and engineering data indicate are less likely to be recovered than Proved Reserves but more certain to be recovered than Possible Reserves. It is equally likely that actual remaining quantities recovered will be greater than or less than the sum of the estimated Proved plus Probable Reserves (2P or P50). In this context, when probabilistic methods are used, there should be at least a 50% probability that the actual quantities recovered will equal or exceed the 2P estimate.
has been established, analytically demonstrated or assumed with reasonable certainty using defined investment assumptions.
Sub-economic demonstrated resources (SDR) are resources for which, at the time of determination, profitable extraction or production under defined investment assumptions has not been established, analytically demonstrated, or cannot be assumed with reasonable certainty (this includes contingent petroleum resources).
Inferred resources (INF) are those with a lower level of confidence that have been inferred from more limited geological evidence and assumed but not verified. Where probabilistic methods are used there should be at least a 10 per cent probability that recovered quantities will equal or exceed the sum of proved, probable and possible reserves.
Undiscovered or potential resources are unspecified resources that may exist based on certain geological assumptions and models, and be discovered through future exploration. Undiscovered resource assessments have inbuilt uncertainties, and are dynamic and change as knowledge improves and uncertainties are resolved.
Petroleum Resources Management System
When reporting petroleum resources, the majority of oil and gas companies follow the Society of Petroleum Engineers’ Petroleum Resources Management System (SPE-PRMS). This schema has been jointly developed by the Society of Petroleum Engineers (SPE), American Association of Petroleum Geologists (AAPG), Society of Exploration Geophysicists (SEG), World Petroleum Council (WPC); and Society of Petroleum Evaluation Engineers (SPEE) to standardise the definitions of petroleum resources and how they are estimated.
While in principle SPE-PRMS applies a similar matrix system to the McKelvey classification schema, of economic feasibility versus geological certainty, the terminology used differs. The system defines the major recoverable resources classes as Production, Reserves, Contingent Resources, and Prospective Resources, as well as Unrecoverable petroleum (figure C2). Definitions of these resource classes from SPE (2007) are listed below.
Production is the cumulative quantity of petroleum that has been recovered at a given date. While all recoverable resources are estimated and production is measured in terms of the sales product specifications, raw production (sales plus non-sales) quantities are also measured and required to support engineering analyses based on reservoir voidage
Total petroleum initially-in-place is the quantity of petroleum estimated to exist originally in naturally occurring accumulations. It includes that quantity of petroleum that is estimated, as of a given date, to be
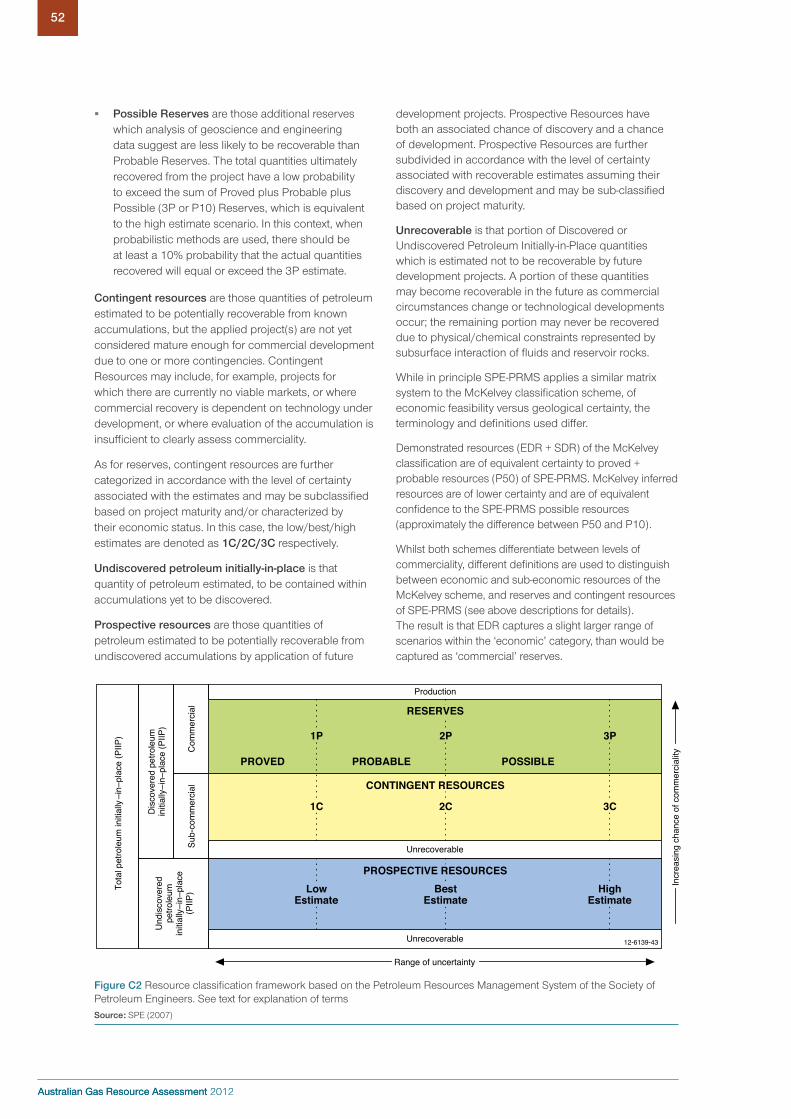
Australian Gas Resource Assessment 2012
52
Australian Gas Resource Assessment 2012
52
� Possible Reserves are those additional reserves which analysis of geoscience and engineering data suggest are less likely to be recoverable than Probable Reserves. The total quantities ultimately recovered from the project have a low probability to exceed the sum of Proved plus Probable plus Possible (3P or P10) Reserves, which is equivalent to the high estimate scenario. In this context, when probabilistic methods are used, there should be at least a 10% probability that the actual quantities recovered will equal or exceed the 3P estimate.
Contingent resources are those quantities of petroleum estimated to be potentially recoverable from known accumulations, but the applied project(s) are not yet considered mature enough for commercial development due to one or more contingencies. Contingent Resources may include, for example, projects for which there are currently no viable markets, or where commercial recovery is dependent on technology under development, or where evaluation of the accumulation is insufficient to clearly assess commerciality.
As for reserves, contingent resources are further categorized in accordance with the level of certainty associated with the estimates and may be subclassified based on project maturity and/or characterized by their economic status. In this case, the low/best/high estimates are denoted as 1C/2C/3C respectively.
Undiscovered petroleum initially-in-place is that quantity of petroleum estimated, to be contained within accumulations yet to be discovered.
Prospective resources are those quantities of petroleum estimated to be potentially recoverable from undiscovered accumulations by application of future
development projects. Prospective Resources have both an associated chance of discovery and a chance of development. Prospective Resources are further subdivided in accordance with the level of certainty associated with recoverable estimates assuming their discovery and development and may be sub-classified based on project maturity.
Unrecoverable is that portion of Discovered or Undiscovered Petroleum Initially-in-Place quantities which is estimated not to be recoverable by future development projects. A portion of these quantities may become recoverable in the future as commercial circumstances change or technological developments occur; the remaining portion may never be recovered due to physical/chemical constraints represented by subsurface interaction of fluids and reservoir rocks.
While in principle SPE-PRMS applies a similar matrix system to the McKelvey classification scheme, of economic feasibility versus geological certainty, the terminology and definitions used differ.
Demonstrated resources (EDR + SDR) of the McKelvey classification are of equivalent certainty to proved + probable resources (P50) of SPE-PRMS. McKelvey inferred resources are of lower certainty and are of equivalent confidence to the SPE-PRMS possible resources (approximately the difference between P50 and P10).
Whilst both schemes differentiate between levels of commerciality, different definitions are used to distinguish between economic and sub-economic resources of the McKelvey scheme, and reserves and contingent resources of SPE-PRMS (see above descriptions for details). The result is that EDR captures a slight larger range of scenarios within the ‘economic’ category, than would be captured as ‘commercial’ reserves.
Com
mer
cial
Sub-
com
mer
cial
Production
Unrecoverable
Range of uncertainty
Incr
easi
ng c
hanc
e of
com
mer
cial
ity
12-6139-43
PROBABLE POSSIBLEPROVED
Unrecoverable
Tota
l pet
role
um in
itial
lyin
plac
e (P
IIP) 1P
1C
LowEstimate
BestEstimate
PROSPECTIVE RESOURCESHigh
Estimate
CONTINGENT RESOURCES
2C 3C
2P 3P
RESERVES
Und
isco
vere
dpe
trole
umin
itial
lyin
plac
e(P
IIP)
Dis
cove
red
petro
leum
initi
ally
inpl
ace
(PIIP
)
Figure C2 Resource classification framework based on the Petroleum Resources Management System of the Society of Petroleum Engineers. See text for explanation of termsSource: SPE (2007)

Australian Gas Resource Assessment 2012
53Appendices
Australian Gas Resource Assessment 2012
53
Appendix D: Energy Measurement and Conversion FactorsThe basic international unit of energy across all energy types is the Joule (J). It is defined as the amount of work done by a force of one Newton exerted over a distance of one metre.
The basic unit of power – or energy per unit time – is the Watt (W), which is equal to one Joule per second. The common unit for electricity is watt (W or We) which refers to electric power produced, while watt thermal (Wt) refers to thermal (heat) power produced. Electricity usage (power consumption) is reported in kilowatt-hours per year (kWh/yr), the average rate at which energy is transferred.
Both Joules and Watts are more commonly recorded in multiples.
Decimal numbering system
Multiples of energy measurements in Australia are expressed in standard international decimal classification terms:
Multiple Scientific exp. Term Abbreviation
Thousand 103 Kilo k
Million 106 Mega M
Billion 109 Giga G
Trillion 1012 Tera T
Quadrillion 1015 Peta P
Energy measurement
Energy production and consumption are typically reported in the International System of Units (SI) as petajoules (PJ) as used here but in some cases are reported in barrels of oil equivalent (BOE) and million tonnes of oil equivalent (MTOE).
Individual energy resources are commonly reported according to prevailing industry conventions. Petroleum is reported by volume and weight according to either the SI or the United States system as used by the American Petroleum Institute.
In this report energy is reported in standard SI units (PJ) with the conventional volume or weight equivalent terms widely in use in industry in parentheses.
Energy resource Measure Abbreviation
Oil and condensate Production, reserves: Litres (usually millions or billions) or barrels (usually thousands or millions) Refinery throughput/capacity: Litres (usually thousands or millions) or barrels per day (usually thousands or millions)
L, ML, GLbbl, kbbl, mmbblML, GL per day bd, kbd, mmbd
Natural gas Cubic feet (usually billions or trillions)Or cubic metres (usually millions or billions of cubic metres)
bcf, tcfm3, mcm, bcm
LNG Tonnes (usually millions)Production rate: Million tonnes per year
t, MtMtpa
LPG Litres (usually megalitres)or barrels (usually millions)
L, MLbbl, mmbl
Coal Tonnes (usually millions or billions)Production rate: tonnes per year (usually kilotonnes or million tonnes per year)
t, Mt, Gttpa, Mtpa
Uranium Tonnes (usually kilotonnes) of uranium or of uranium oxide
t U; kt Ut U3O8; kt U3O8
Electricity Capacity: watts, kilowatts, etcProduction or use: watt-hours, kilowatt-hours, etc
W, kW, MW …Wh, kWh, MWh …
Bioenergy•bagasse,biomass
Tonnes (or thousands of tonnes) t, kt

Australian Gas Resource Assessment 2012
54
Australian Gas Resource Assessment 2012
54
Fuel-specific to standard unit conversion factors
Oil and condensate 1 barrel = 158.987 litres
1 gigalitre (GL) = 6.2898 million barrels
1 tonne (t) = 1250 litres (indigenous)/1160 litres (imported)
Ethanol 1 tonne = 1266 litres
Methanol 1 tonne = 1263 litres
LPG
•average 1 tonne = 1760–1960 litres
•naturallyoccurring 1 tonne = 1866 litres
Natural gas 1 cubic metre (m3) = 35.315 cubic feet (cf)
Liquefied natural gas 1 tonne = 2174 litres
Electricity 1 kilowatt-hour (kWh) = 3.6 megajoules (MJ)
Energy content conversion factors
The energy content of individual resources may vary, depending on the source, the quality of the resource, impurities
content, extent of pre-processing, technologies used, and so on. The following table provides a range of measured
energy contents and, where appropriate, the accepted average conversion factor.
a) Gaseous fuels
PJ/bcf MJ/m3
Natural gas
•Victoria 1.0987 38.8
•Queensland 1.1185 39.5
•WesternAustralia 1.1751 41.5
•SouthAustralia,NewSouthWales 1.0845 38.3
•NorthernTerritory 1.1468 40.5
•Average 1.1000 (54 GJ/t) 38.8
Ethane (average) 1.6282 57.5
Town gas
•syntheticnaturalgas 1.1043 39.0
•othertowngas 0.7079 25.0
•Cokeovengas 0.5125 18.1
•Blastfurnacegas 0.1133 4.0
b) Liquid fuels
PJ/mmbbl By volumeMJ/L
By weightGJ/t
Crude oil and condensate
•indigenous(average) 5.88 37.0 46.3
•imports(average) 6.15 38.7 44.9
LPG
•propane 4.05 25.5 49.6
•butane 4.47 28.1 49.1
•mixture 4.09 25.7 49.6
•naturallyoccurring(average) 4.21 26.5 49.4
Other
•Liquefiednaturalgas(NorthWestShelf) 3.97 25.0 54.4
Naphtha 4.99 31.4 48.1
Ethanol 3.72 23.4 29.6
Methanol 2.48 15.6 19.7

Australian Gas Resource Assessment 2012
55Appendices
Australian Gas Resource Assessment 2012
55
c) Solid fuels
GJ/t
Black coal
New South Wales
Exports – metallurgical coal 29.0
Exports – thermal coal 27.0
Electricity generation 23.4
Other 23.9–30.0
Queensland
Exports – metallurgical coal 30.0
Exports – thermal coal 27.0
Electricity generation 23.4
Other 23.0
Western Australia
Thermal coal 19.7
Tasmania
Thermal coal 22.8
Lignite (Brown Coal)
Victoria 9.8
Briquettes 22.1
South Australia 15.2
Uranium*
Metal (U) 560 000
Uranium Oxide (U3O8) 470 000
Other
Coke 27.0
Wood (dry) 16.2
Bagasse 9.6
Note:* The usable energy content of uranium metal (U) is 0.56 petajoules per tonne, and that of uranium oxide (U3O8) is 0.47 petajoules per tonne. The oxide contains 84.8 per cent of the metal by weight Source: ABARE; Geoscience Australia
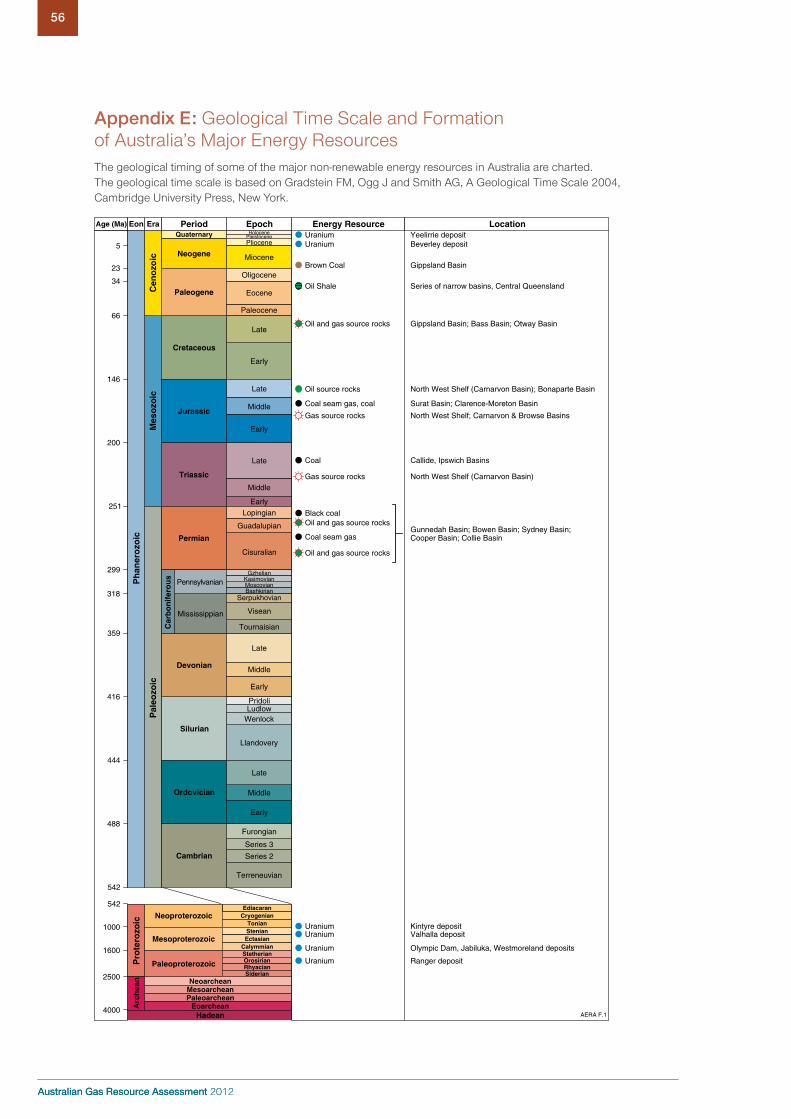
Australian Gas Resource Assessment 2012
56
Australian Gas Resource Assessment 2012
56
Appendix E: Geological Time Scale and Formation of Australia’s Major Energy ResourcesThe geological timing of some of the major non-renewable energy resources in Australia are charted. The geological time scale is based on Gradstein FM, Ogg J and Smith AG, A Geological Time Scale 2004, Cambridge University Press, New York.
Oil Shale
Late
Early
Middle
Late
Early
Paleocene
Eocene
Late
Oligocene
PliocenePleistoceneHolocene
Eon Era Period Epoch Energy Resource LocationAge (Ma)
UraniumUranium
Brown Coal
Oil and gas source rocks
Uranium
Uranium
Coal
Oil source rocks
Gas source rocks
Gas source rocks
Coal seam gas
Oil and gas source rocks
MioceneNeogene
Quaternary
Paleogene
Mes
ozo
ic
Jurassic
Triassic
Middle
Permian
Car
bo
nif
ero
us
Mississippian
Tournaisian
Visean
SerpukhovianBashkirianMoscovianKasimovian
Gzhelian
Ph
aner
ozo
ic
Pal
eozo
ic
EarlyLopingian
Guadalupian
Cisuralian
Devonian
Late
Middle
Early
PridoliLudlow
Wenlock
Llandovery
Silurian
Ordovician
Early
Middle
Late
Furongian
Series 3
Series 2
Terreneuvian
Cambrian
Arc
hea
nP
rote
rozo
ic
Neoproterozoic
Mesoproterozoic
Paleoproterozoic
NeoarcheanMesoarcheanPaleoarchean
EoarcheanHadean
SiderianRhyacianOrosirianStatherianCalymmian
EctasianStenianTonian
CryogenianEdiacaran
Cretaceous
Pennsylvanian
Cen
ozo
ic
Gippsland Basin; Bass Basin; Otway Basin
North West Shelf (Carnarvon Basin)
Black coalOil and gas source rocks
North West Shelf (Carnarvon Basin); Bonaparte Basin
North West Shelf; Carnarvon & Browse Basins
Coal seam gas, coal Surat Basin; Clarence-Moreton Basin
Callide, Ipswich Basins
Gunnedah Basin; Bowen Basin; Sydney Basin;Cooper Basin; Collie Basin
Kintyre depositUranium Valhalla deposit
Uranium Ranger deposit
Olympic Dam, Jabiluka, Westmoreland deposits
Yeelirrie depositBeverley deposit
Series of narrow basins, Central Queensland
Gippsland Basin23
5
34
66
146
200
251
299
359
416
444
542
488
4000
2500
1600
1000
318
542
AERA F.1