Embed Size (px)
Citation preview

Australian Microcap Investment Conference
18th October 2017

$31 $34 $37 $41$48
$54$62
FY11 FY12 FY13 FY14 FY15 FY16 FY17
LifeHealthcare Overview
LifeHealthcare is a leading independent provider of healthcare solutions in Australia and New Zealand across
clinically specialised therapeutic channels
2
Founded in 2006 from an integration of a number of
long standing businesses, LifeHealthcare has grown to
be one of the leading independent medical device
companies in Australia and New Zealand with over
180 employees
Business model focussed on global sourcing and
provision of local solutions in focus specialty channels
of Spine, Neurosurgery, Orthopaedics, Cardiology and
General Surgery
Full service offering providing tailored solutions for
customers including a global sourcing network,
dedicated regulatory capability, tailored professional
education programs and clinician training, product
development and specialised clinical services including
after sales care
Strong market presence, top three market share
position in core therapeutic channels in which
LifeHealthcare is present
Revenue EBITDA1
Note:
1. Underlying EBITDA excludes acquisition transaction costs in FY15, FY16 and FY17 and a one-off loss in share of an associate in FY17
($m)
$69 $70
$77
$87
$99
$115
$4.5$5.6 $6.2
$7.1$8.5 $8.5 $9.1
FY11 FY12 FY13 FY14 FY15 FY16 FY17
($m)
$12.2 $12.4
$14.1
$15.3
$17.3
$19.3
$127$20.4
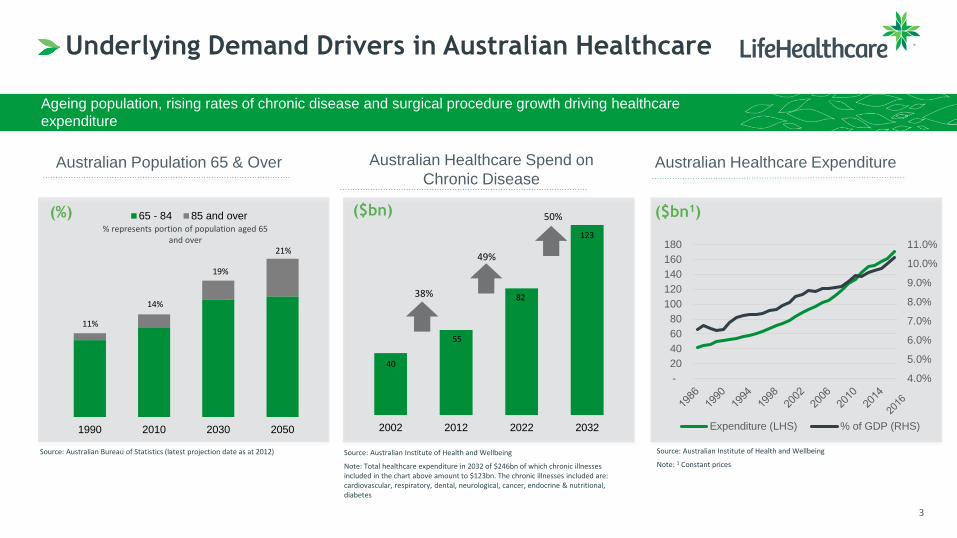
Underlying Demand Drivers in Australian Healthcare
Ageing population, rising rates of chronic disease and surgical procedure growth driving healthcare
expenditure
3
1990 2010 2030 2050
65 - 84 85 and over% represents portion of population aged 65
and over
(%)
11%
14%
19%
21%
Source: Australian Bureau of Statistics (latest projection date as at 2012)
Australian Population 65 & Over
38%
49%
50%
Source: Australian Institute of Health and Wellbeing
Note: Total healthcare expenditure in 2032 of $246bn of which chronic illnesses included in the chart above amount to $123bn. The chronic illnesses included are: cardiovascular, respiratory, dental, neurological, cancer, endocrine & nutritional, diabetes
Australian Healthcare Spend on
Chronic Disease
2002 2012 2022 2032
($bn)
40
55
82
123
($bn1)
Australian Healthcare Expenditure
Source: Australian Institute of Health and Wellbeing
Note: 1 Constant prices
4.0%
5.0%
6.0%
7.0%
8.0%
9.0%
10.0%
11.0%
-
20
40
60
80
100
120
140
160
180
Expenditure (LHS) % of GDP (RHS)

The Future of Healthcare
LifeHealthcare’s business model is well suited to address the changing needs of healthcare in delivering
more efficient and effective healthcare outcomes
4
Incorporation of data and outcome measures
Evolution in procedural technique
complemented by device innovation and
enabling technologies
Managing the patient journey through
prevention, early intervention and
rehabilitation
Advancements in genetic therapies and
regenerative biologics

Therapeutic Offering
LifeHealthcare has an established presence in select therapeutic channels providing implants, capital and
consumable technologies
5
Spine OrthopaedicsEndovascular
& Respiratory Neurosurgery General Surgery Neurophysiology UltrasoundTheatre
Capital
Customer
Service
Warehouse
& Distribution
Kit &
Consignment
Inventory &
Logistics
Capital Parts
& Service
Marketing, Regulatory Affairs
& Product Management
Surgical
Instruments &
ConsumablesCardiology
Supported by regulatory and compliance, dedicated service teams and operations

Full Service Integrated Business Model
A full service offering and tailored solutions for customers within the Australian and New Zealand
healthcare market
6
Dedicated team focussed on delivering
emerging technologies to the Australian
and New Zealand healthcare market
Strategic sourcing delivers channel
optimisation and technical innovation
Market leading sales representatives are
employed by LifeHealthcare and undergo
rigorous training
A typical LifeHealthcare sales representative has
significant medical or healthcare experience and
a bachelor of sciences or similar tertiary
qualification
In certain therapeutic market segments,
a LifeHealthcare sales representative
may be present in theatre assisting a
surgeon with a procedure
Delivery of capital service
Dedicated professional education
team facilitate world class training for
surgeons and other clinicians
Strongly supported by key partners
Regulatory Affairs and Compliance
team which seeks TGA and PDC
approval on behalf of manufacturers
Quality assurance a key strength
Regulatory and
ComplianceClinician
TrainingManufacturer Clinician
Product
SourcingSpecialised
Staff
After Sales
Care

Competitive Advantage
Competitive advantage generated through a high degree of market orientation and a compelling value
proposition
7
Value PropositionFocused on the needs of Australian and New Zealand
customers only
Scale of a multinational without being constrained by a
single foreign parent company
Rapid access to innovation
Global reach, local tailored solutions, best in class
products
Local ownership ensures decision makers are readily
accessible
We act with speed and conviction
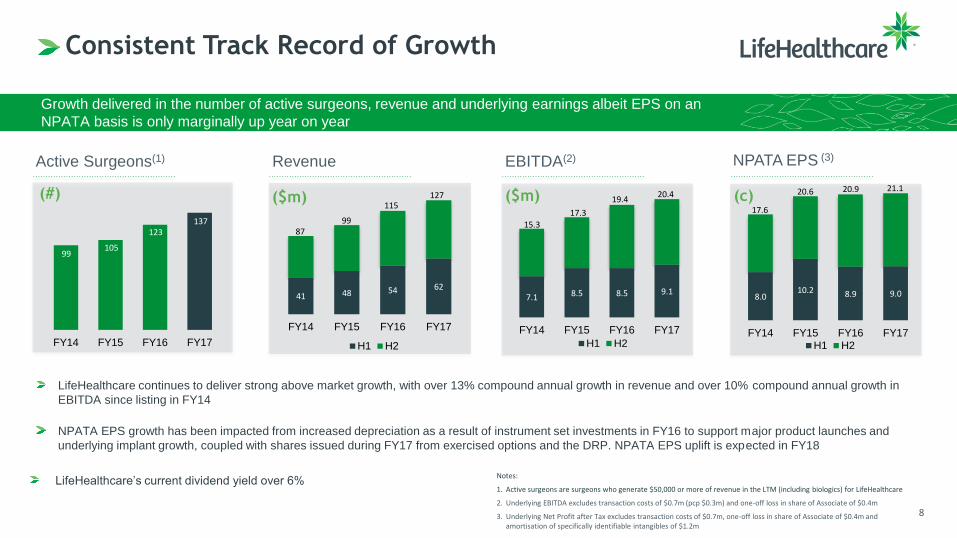
Consistent Track Record of Growth
Growth delivered in the number of active surgeons, revenue and underlying earnings albeit EPS on an
NPATA basis is only marginally up year on year
8
FY14 FY15 FY16 FY17
41 48 54 62
FY14 FY15 FY16 FY17
H1 H2
($m)
8799
115
7.1 8.5 8.5 9.1
FY14 FY15 FY16 FY17
H1 H2
($m)
15.3
17.3
19.4
Active Surgeons(1) Revenue EBITDA(2)
(#)
99105
123137
127 20.4
8.010.2 8.9 9.0
FY14 FY15 FY16 FY17
H1 H2
(c)17.6
20.6 20.9 21.1
NPATA EPS (3)
Notes:
1. Active surgeons are surgeons who generate $50,000 or more of revenue in the LTM (including biologics) for LifeHealthcare
2. Underlying EBITDA excludes transaction costs of $0.7m (pcp $0.3m) and one-off loss in share of Associate of $0.4m
3. Underlying Net Profit after Tax excludes transaction costs of $0.7m, one-off loss in share of Associate of $0.4m and amortisation of specifically identifiable intangibles of $1.2m
LifeHealthcare continues to deliver strong above market growth, with over 13% compound annual growth in revenue and over 10% compound annual growth in
EBITDA since listing in FY14
NPATA EPS growth has been impacted from increased depreciation as a result of instrument set investments in FY16 to support major product launches and
underlying implant growth, coupled with shares issued during FY17 from exercised options and the DRP. NPATA EPS uplift is expected in FY18
LifeHealthcare’s current dividend yield over 6%

Listed Journey
LifeHealthcare’s institutional shareholding has remained stable since listing in December 2013 despite
regulatory risk impacting valuation
9
Top 10 Shareholders
Investors Mutual
Perennial Investment Partners
Fidelity Management and Research
Renaissance Asset Management
Fidelity Investment Limited
Adam Smith Asset Management
Mason Stevens
Healthinvest
Contango Funds Management
Accident Compensation Corporation
As at 17 October 2017
As at 15 September 2017
Five out of the top 10 shareholders above were
in the top 20 shareholders at IPO

FY17 Key Metrics
Strong revenue performance for FY17 with 10.4% revenue growth on prior comparable period with modest
underlying earnings growth of 4.6% on prior comparable period
10
14 390 bps(6)
2640 bps
4.6%(6)
120 bps66% of
NPATA(5)
137Active Surgeons(1)
52.0%Gross Margin
$20.4EBITDA(2)
78.3%Operating Cash
Conversion(3)
(restated pcp 51.9%) (6)
31.0%Working Capital(restated pcp 32.2%)(6)
% to LTM sales 7.5c Final Dividend(4)
(pcp 7.5c)
Notes:
4. Final dividend fully franked and subject to Dividend Reinvestment Plan
5. Underlying Net Profit after Tax excludes transaction costs of $0.7m, one-off loss in share of Associate of $0.4m and amortisation of specifically identifiable intangibles of $1.2m
6. FY16 accounts restated due to a change in accounting policy relating to in-bound freight costs included in the cost of inventory. This has increased EBITDA by $0.1m and inventory by $0.8m and reduced the deferred tax asset by $0.3m from that reported in the 2016 annual report
11.4% growth from
30 June 2016
10.4%
$126.7mRevenue
16.8%
1.39xLeverage(restated pcp 1.67x) (6)
Net Debt to
Underlying EBITDA
FX impact represents
over 70% of decline
13.75c Full Year Dividend(pcp 12.5c)
9.1% organic growth
Notes:
1. Active surgeons are surgeons who generate $50,000 or more of revenue in the LTM (including biologics) for LifeHealthcare
2. Underlying EBITDA excludes transaction costs of $0.7m (pcp $0.3m) and one-off loss in share of Associate of $0.4m
3. Cashflow from operating activities as a percentage of underlying EBITDA
16.1% EBITDA
margin
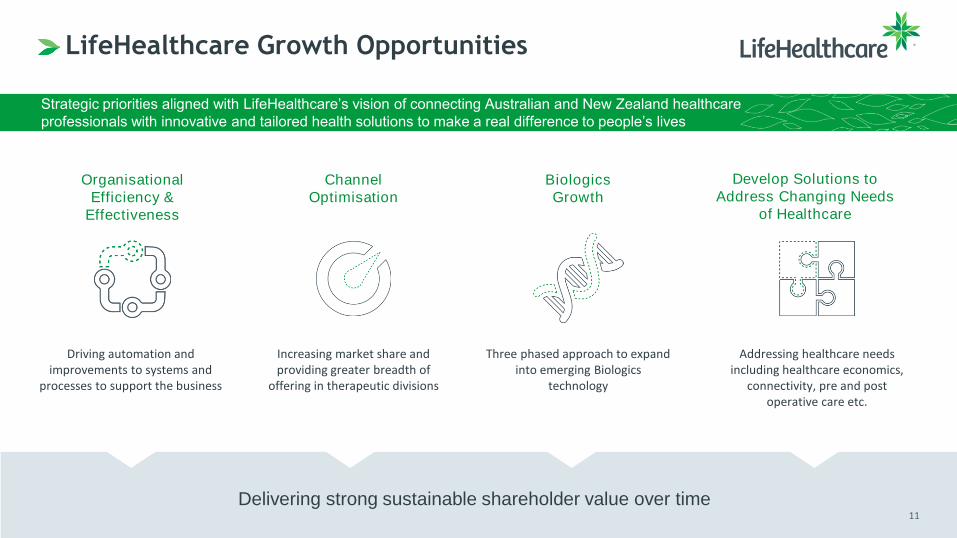
LifeHealthcare Growth Opportunities
Strategic priorities aligned with LifeHealthcare’s vision of connecting Australian and New Zealand healthcare
professionals with innovative and tailored health solutions to make a real difference to people’s lives
11
Delivering strong sustainable shareholder value over time
Organisational
Efficiency &
Effectiveness
Driving automation and improvements to systems and
processes to support the business
Biologics
Growth
Three phased approach to expand into emerging Biologics
technology
Develop Solutions to
Address Changing Needs
of Healthcare
Addressing healthcare needs including healthcare economics,
connectivity, pre and post operative care etc.
Channel
Optimisation
Increasing market share and providing greater breadth of
offering in therapeutic divisions
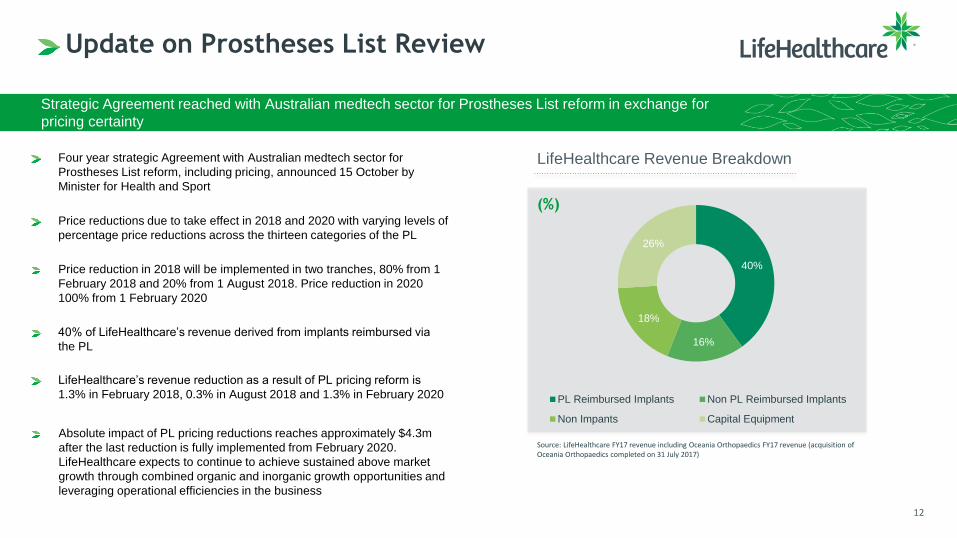
Update on Prostheses List Review
Strategic Agreement reached with Australian medtech sector for Prostheses List reform in exchange for
pricing certainty
12
40%
16%
18%
26%
PL Reimbursed Implants Non PL Reimbursed Implants
Non Impants Capital Equipment
(%)
LifeHealthcare Revenue Breakdown
Source: LifeHealthcare FY17 revenue including Oceania Orthopaedics FY17 revenue (acquisition of Oceania Orthopaedics completed on 31 July 2017)
Four year strategic Agreement with Australian medtech sector for
Prostheses List reform, including pricing, announced 15 October by
Minister for Health and Sport
Price reductions due to take effect in 2018 and 2020 with varying levels of
percentage price reductions across the thirteen categories of the PL
Price reduction in 2018 will be implemented in two tranches, 80% from 1
February 2018 and 20% from 1 August 2018. Price reduction in 2020
100% from 1 February 2020
40% of LifeHealthcare’s revenue derived from implants reimbursed via
the PL
LifeHealthcare’s revenue reduction as a result of PL pricing reform is
1.3% in February 2018, 0.3% in August 2018 and 1.3% in February 2020
Absolute impact of PL pricing reductions reaches approximately $4.3m
after the last reduction is fully implemented from February 2020.
LifeHealthcare expects to continue to achieve sustained above market
growth through combined organic and inorganic growth opportunities and
leveraging operational efficiencies in the business
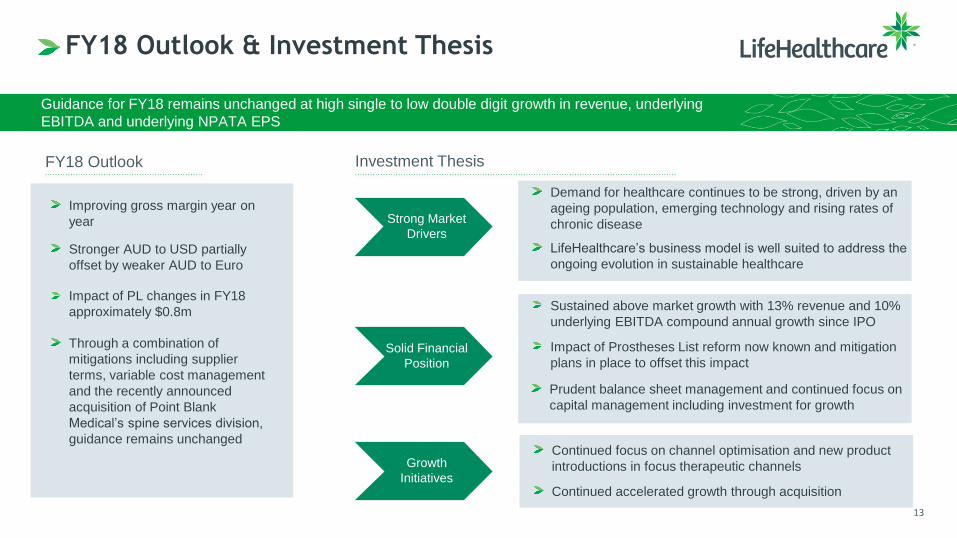
FY18 Outlook & Investment Thesis
Guidance for FY18 remains unchanged at high single to low double digit growth in revenue, underlying
EBITDA and underlying NPATA EPS
13
Improving gross margin year on
year
FY18 Outlook
Impact of PL changes in FY18
approximately $0.8m
Through a combination of
mitigations including supplier
terms, variable cost management
and the recently announced
acquisition of Point Blank
Medical’s spine services division,
guidance remains unchanged
Stronger AUD to USD partially
offset by weaker AUD to Euro
Investment Thesis
Strong Market
Drivers
Demand for healthcare continues to be strong, driven by an
ageing population, emerging technology and rising rates of
chronic disease
LifeHealthcare’s business model is well suited to address the
ongoing evolution in sustainable healthcare
Solid Financial
Position
Sustained above market growth with 13% revenue and 10%
underlying EBITDA compound annual growth since IPO
Impact of Prostheses List reform now known and mitigation
plans in place to offset this impact
Prudent balance sheet management and continued focus on
capital management including investment for growth
Growth
Initiatives
Continued focus on channel optimisation and new product
introductions in focus therapeutic channels
Continued accelerated growth through acquisition

Disclaimer
The material in this presentation has been prepared by LifeHealthcare Group Limited ABN 72 166 525 186 (“LifeHealthcare”) to provide shareholders with information on the business. This document is part of, and should be read in conjunction with a briefing to be given by LifeHealthcare. A copy of the briefing is available at http://www.lifehealthcare.com.au/investors/.
Information in this presentation, including forecast financial information should not be considered as advice or a recommendation to investors or potential investors and does not take into account investment objectives, financial situation or needs of any particular investor. These should be considered, with or without professional advice when deciding if an investment is appropriate. Persons needing advice should consult their stockbroker, solicitor, accountant or other independent financial advisor.
The release, publication or distribution of this presentation in certain jurisdictions may be restricted by law and therefore persons in such jurisdictions into which this presentation is released, published or distributed should inform themselves about and observe such restrictions.
This presentation does not constitute, or form part of, an offer to sell or the solicitation of an offer to subscribe for or buy any securities, nor the solicitation of any vote or approval in any jurisdiction, nor shall there be any sale, issue or transfer of the securities referred to in this presentation in any jurisdiction in contravention of applicable law.
Certain statements made in this presentation are forward-looking statements. These forward-looking statements are not historical facts but rather are based on LifeHealthcare’s current expectations, estimates and projections about the industry in which LifeHealthcare operates, and beliefs and assumptions. These statements are not guarantees of future performance and are subject to known and unknown risks, uncertainties and other factors, some of which are beyond the control of LifeHealthcare, are difficult to predict and could cause actual results to differ materially from those expressed or forecasted in the forward looking statements.
LifeHealthcare cautions investors and potential investors not to place undue reliance on these forward-looking statements, which reflect the view of LifeHealthcare only as of the date of this presentation. The forward-looking statements made in this presentation relate only to events as of the date on which the statements are made. LifeHealthcare will not undertake any obligation to release publicly any revisions or updates to these forward-looking statements to reflect events, circumstances or unanticipated events occurring after the date of this presentation except as required by law or by any appropriate regulatory authority.

Thank you
Subscribe to company news at www.lifehealthcare.com.au/investors/