Embed Size (px)
Citation preview
Australian National Waste Report 2016
PREPARED FOR
Department of the Environment and Energy
PREPARED IN ASSOCIATION WITH
Disclaimer
This report has been prepared for Department of the Environment and Energy in accordance with the terms and conditions of appointment dated 30 May 2016, and is based on the assumptions and exclusions set out in our scope of work. While all professional care has been undertaken in preparing this report, Blue Environment Pty Ltd cannot accept any responsibility for any use of or reliance on the contents of this report by any third party.
The mention of any company, product or process in this report does not constitute or imply endorsement by Blue Environment Pty Ltd.
© Department of the Environment and Energy and Blue Environment Pty Ltd
Blue Environment prints on 100% recycled content paper
Blue Environment Pty Ltd ABN 78 118 663 997 Suite 208, 838 Collins St, Docklands Vic 3008 Email: [email protected] Web: www.blueenvironment.com.au Phone: +61 3 9081 0440 / +61 3 5426 3536
Report title Australian National Waste Report 2016
Client Department of the Environment and Energy
Status Final
Author(s) Dr Joe Pickin and Paul Randell
Reviewer(s) Christine Wardle, Karen Cosson and Jenny Trinh
Project number P726
Report date 20 June 2017
Contract date 30 May 2016
Information current to Varies by data source
Copyright Department of the Environment and Energy & Blue Environment Pty Ltd
Australian National Waste Report 2016 Final
Page i
Contents
At a glance ................................................................................................................................... vi
1. Introduction .......................................................................................................................... 1
1.1 Scope ....................................................................................................................................... 1 1.2 Data collation methods ........................................................................................................... 1 1.3 Data in this report may differ from state and territory data .................................................. 2 1.4 Data quality ............................................................................................................................. 3 1.5 Report structure ...................................................................................................................... 3 1.6 Data layout .............................................................................................................................. 4
2. Context ................................................................................................................................. 5
2.1 Population growth ................................................................................................................... 5 2.2 Economic growth ..................................................................................................................... 5 2.3 Access to recycling markets..................................................................................................... 6 2.4 Carbon policy ........................................................................................................................... 6 2.5 Waste policies .......................................................................................................................... 6
3. The national picture .............................................................................................................. 9
3.1 Overall waste quantities analysis ............................................................................................ 9 3.2 Waste stream analysis ........................................................................................................... 15 3.3 Waste materials analysis ....................................................................................................... 19
4. International comparisons ................................................................................................... 26
4.1 Waste generation and fate .................................................................................................... 26 4.2 Municipal waste generation and fate ................................................................................... 27
5. Industry perspectives .......................................................................................................... 28
6. Current and emerging challenges ......................................................................................... 32
7. Waste generation and fate by state and territory ................................................................. 35
7.1 Australian Capital Territory ................................................................................................... 35 7.2 New South Wales .................................................................................................................. 40 7.3 Northern Territory ................................................................................................................. 44 7.4 Queensland ............................................................................................................................ 49 7.5 South Australia ...................................................................................................................... 53 7.6 Tasmania................................................................................................................................ 58 7.7 Victoria .................................................................................................................................. 62 7.8 Western Australia .................................................................................................................. 66
8. Data sources and assumptions ............................................................................................. 70
8.1 Data sources .......................................................................................................................... 70 8.2 Assumptions .......................................................................................................................... 71
Bibliography ................................................................................................................................ 72
Australian National Waste Report 2016 Final
Page ii
Figures Figure 1 Data inputs and outputs in the national waste data set reporting tool ........................................ 2 Figure 2 Australian population by state and territory, 2006-07 to 2014-15 ............................................... 5 Figure 3 Australian economic activity by state and territory (GSP), 2006-07 to 2014-15 ........................... 6 Figure 4 Waste generation and fate, Australia 2014-15 .............................................................................. 9 Figure 5 Waste generation and fate by state and territory, 2014-15 (megatonnes) ................................ 10 Figure 6 Waste generation and fate per capita by state and territory, 2014-15 (kilograms per capita) .. 10 Figure 7 Trends in waste generation and fate, Australia 2006-07 to 2014-15 .......................................... 12 Figure 8 Trends in waste generation and fate excluding fly ash, Australia 2006-07 to 2014-15 .............. 12 Figure 9 Trends in waste generation per capita by state and territory, 2006-07 to 2014-15 ................... 13 Figure 10 Waste generation and fate by stream, Australia 2014-15 ........................................................... 15 Figure 11 Waste generation and fate per capita by waste stream and state and territory, 2014-15 ......... 16 Figure 12 Trends in municipal waste generation and fate, Australia 2006-07 to 2014-15 ......................... 17 Figure 13 Trends in commercial and industrial waste generation and fate excluding fly ash, Australia
2006-07 to 2014-15 ..................................................................................................................... 18 Figure 14 Trends in construction and demolition waste generation and fate, Australia 2006-07 to
2014-15 ........................................................................................................................................ 18 Figure 15 Waste generation and fate by material category, Australia 2014-15 ......................................... 19 Figure 16 Trends in masonry material waste generation and fate, Australia 2006-07 to 2014-15............. 20 Figure 17 Trends in metal waste generation and fate, 2006-07 to 2014-15 ............................................... 20 Figure 18 Non-hazardous and hazardous organic waste generation and fate, Australia 2014-15 ............. 21 Figure 19 Food waste generation and fate by source sector, Australia 2014-15 ........................................ 22 Figure 20 Trends in organic waste generation and fate excluding hazardous organic wastes, Australia
2006-07 to 2014-15 ..................................................................................................................... 22 Figure 21 Trends in paper and cardboard waste generation and fate, Australia 2006-07 to 2014-15 ....... 23 Figure 22 Trends in plastic waste generation and fate, Australia 2006-07 to 2014-15 ............................... 24 Figure 23 Trends in glass waste generation and fate, Australia 2006-07 to 2014-15 ................................. 24 Figure 24 Trends in fly ash waste generation and fate, Australia 2006-07 to 2014-15 ............................... 25 Figure 25 Comparison of waste generation and fate per capita, Australia and selected OECD
countries ...................................................................................................................................... 26 Figure 26 Comparison of MSW generation, disposal, recycling, recovery and composting per capita in
selected OECD countries .............................................................................................................. 27 Figure 27 Waste generation and fate, ACT 2014-15 .................................................................................... 35 Figure 28 Waste generation and fate by stream, ACT 2014-15 ................................................................... 36 Figure 29 Waste generation and fate by material category, ACT 2014-15 ................................................. 37 Figure 30 Trends in waste generation and fate, ACT 2006-07 to 2014-15 .................................................. 38 Figure 31 Waste generation and fate, NSW 2014-15 .................................................................................. 40 Figure 32 Waste generation and fate by stream, NSW 2014-15 ................................................................. 41 Figure 33 Waste generation and fate by material category, NSW 2014-15 ................................................ 42 Figure 34 Trends in waste generation and fate excluding fly ash, NSW 2006-07 to 2014-15 ..................... 43 Figure 35 Waste generation and fate, NT 2014-15 ..................................................................................... 44 Figure 36 Waste generation and fate by stream, NT 2014-15 .................................................................... 45 Figure 37 Waste generation and fate by material category, NT 2014-15 ................................................... 46 Figure 38 Trends in waste generation and fate, NT 2006-07 to 2014-15 .................................................... 47 Figure 39 Waste generation and fate, Qld 2014-15 .................................................................................... 49 Figure 40 Waste generation and fate by stream, Qld 2014-15 ................................................................... 50 Figure 41 Waste generation and fate by material category, Qld 2014-15 .................................................. 51 Figure 42 Trends in waste generation and fate excluding fly ash, Qld 2006-07 to 2014-15 ....................... 52 Figure 43 Waste generation and fate, SA 2014-15 ...................................................................................... 53 Figure 44 Waste generation and fate by stream, SA 2014-15 ..................................................................... 54 Figure 45 Waste generation and fate by material category, SA 2014-15 .................................................... 55
Australian National Waste Report 2016 Final
Page iii
Figure 46 Trends in waste generation and fate excluding fly ash, SA 2006-07 to 2014-15......................... 56 Figure 47 Waste generation and fate, Tas 2014-15 ..................................................................................... 58 Figure 48 Waste generation and fate by stream, Tas 2014-15.................................................................... 59 Figure 49 Waste generation and fate by material category, Tas 2014-15 .................................................. 60 Figure 50 Trends in waste generation and fate, Tas 2006-07 to 2014-15 ................................................... 61 Figure 51 Waste generation and fate, Vic 2014-15 ..................................................................................... 62 Figure 52 Waste generation and fate by stream, Vic 2014-15 .................................................................... 63 Figure 53 Waste generation and fate by material category, Vic 2014-15 ................................................... 64 Figure 54 Trends in waste generation and fate excluding fly ash, Vic 2006-07 to 2014-15 ........................ 65 Figure 55 Waste generation and fate, WA 2014-15 .................................................................................... 66 Figure 56 Waste generation and fate by stream, WA 2014-15 ................................................................... 67 Figure 57 Waste generation and fate by material category, WA 2014-15 .................................................. 68 Figure 58 Trends in waste generation and fate excluding fly ash, WA 2006-07 to 2014-15 ....................... 69
Tables Table 1 Waste categories and types analysed in this report ...................................................................... 4 Table 2 Summary of state and territory waste policy settings ................................................................... 7 Table 3 Apparent 9-year percentage change in waste fate per capita by state and territory,
excluding fly ash, 2006-07 to 2014-15 ......................................................................................... 14 Table 4 Descriptions of the waste sources included in the data compared in Figure 25 ......................... 26 Table 5 Australia’s ranking in various aspects of MSW generation and management against the 28
countries listed in Figure 26 ......................................................................................................... 27 Table 6 Data from sources other than the states and territories ............................................................ 70
Australian National Waste Report 2016 Final
Page iv
Abbreviations and glossary
ABS Australian Bureau of Statistics
ACOR Australian Council of Recycling
ACT Australian Capital Territory
ALOA Australian Landfill Owners Association
AORA Australian Organics Recycling Association
AGR annual growth rate
biosolids solid, semi-solid or slurry material produced by the treatment of urban sewage
capita person
C&D construction and demolition
C&I commercial and industrial
commercial and industrial waste
Waste that is produced by institutions and businesses; includes waste from schools, restaurants, offices, retail and wholesale businesses, and industries including manufacturing.
construction and demolition waste
Waste produced by demolition and building activities, including road and rail construction and maintenance and excavation of land associated with construction activities.
disposal The deposit of solid waste in a landfill or incinerator, net of recovery of energy.
DoEE Department of the Environment and Energy
EPA Environment(al) Protection Agency / Authority (names vary with jurisdiction)
e-waste electrical or electronic waste
energy recovery The process of recovering energy that is embodied in solid waste (the amount of solid waste recovered is net of any residuals disposed).
EPR extended producer responsibility
fate What happens to a waste i.e. recycling, energy recovery or disposal.
fly ash Ash produced by burning coal or other materials that is driven out of the boiler with the flue gases and captured by pollution control equipment.
gross state product
The total market value of goods and services produced in a state or territory within a given period after deducting the cost of goods and services used up in the process of production but before deducting allowances for the consumption of fixed capital.
GSP gross state product
hazardous waste (or ‘hazwaste’)
Waste that, by its characteristics, poses a threat or risk to public health, safety or to the environment. In this report, this comprises wastes that cannot be imported to or exported from Australia without a permit under the Hazardous Waste (Regulation of Exports and Imports) Act 1989, or wastes that a jurisdiction regulates as requiring particularly high levels of control.
HDPE high-density polyethylene
kg kilograms
kt kilotonnes (thousands of tonnes)
LDPE low-density polyethylene
MSW municipal solid waste
municipal solid waste
Waste produced primarily by households and council facilities.
Mt megatonnes (millions of tonnes)
NGER National Greenhouse and Energy Reporting
NSW New South Wales
NT Northern Territory
OECD Organisation for Economic Cooperation and Development
per capita per person
PET polyethylene terephthalate
PP polypropylene
product stewardship
A policy approach recognising that manufacturers, importers, governments and consumers have a shared responsibility for the environmental impacts of a product throughout its full life cycle. Product stewardship schemes establish a means for relevant parties in the product chain to share responsibility for the products they produce, handle, purchase, use and discard.
PS polystyrene
PVC polyvinyl chloride
Australian National Waste Report 2016 Final
Page v
Qld Queensland
recycling Activities in which solid wastes are collected, sorted, processed (including through composting), and converted into raw materials to be used in the production of new products (the amount of solid waste recycled is net of any residuals disposed).
resource recovery For data collation purposes, this is the sum of materials sent to recycling and energy recovery net of contaminants and residual wastes sent to disposal.
resource recovery rate
The proportion calculated by dividing resource recovery by waste generation (also referred to as the ‘recovery rate’).
SA South Australia
solid waste Waste that can have an angle of repose of greater than 5 degrees above horizontal, or does not become free-flowing at or below 60 degrees Celsius or when it is transported, or is generally capable of being picked up by a spade or shovel.
t tonne(s)
Tas Tasmania
Vic Victoria
WA Western Australia
waste Materials or products that are unwanted or have been discarded, rejected or abandoned. This includes materials or products that are recycled, converted to energy, or disposed.
waste generation For data collation purposes, this is the sum of resource recovery and disposal.
WMAA Waste Management Association of Australia
Acknowledgements
We thank the states and territories for sharing their data, perspectives and commentary for this report. We are grateful to the waste industry associations for their contributions to Section 5, namely the Australian Council of Recycling, the Australian Landfill Owners Association, the Australian Organics Recycling Association, and the Waste Management Association of Australia.
Page vi
At a glance
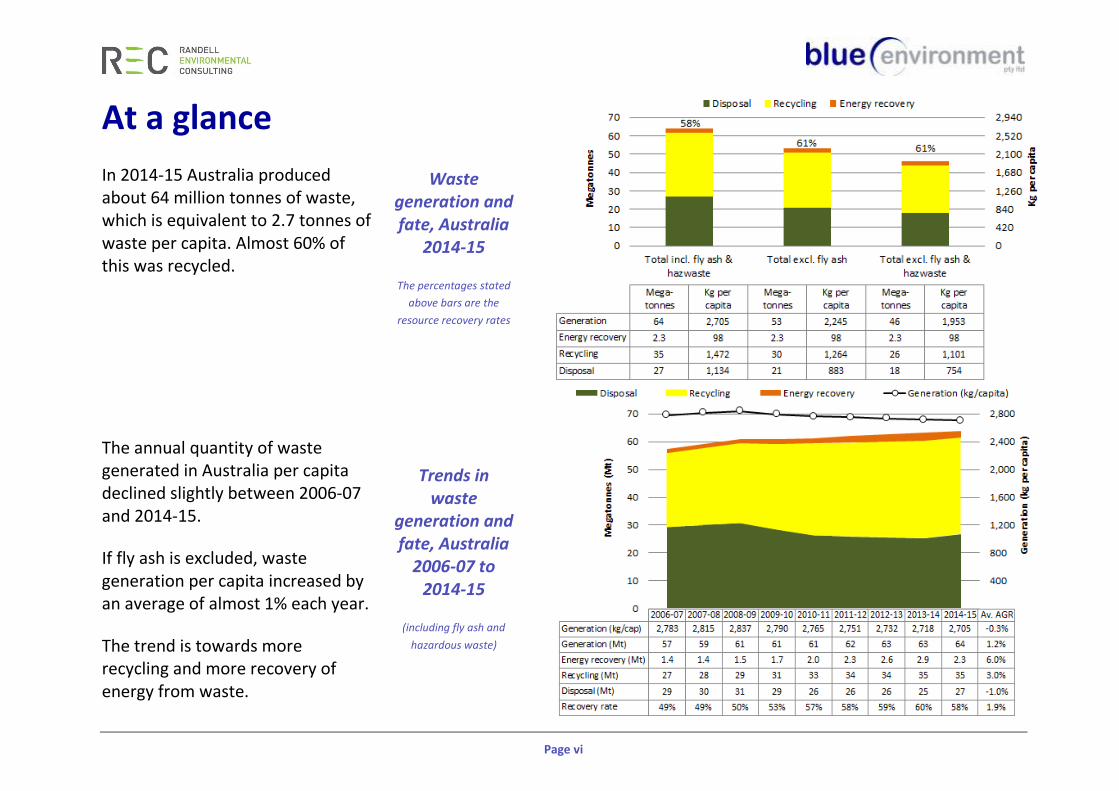
In 2014-15 Australia produced about 64 million tonnes of waste, which is equivalent to 2.7 tonnes of waste per capita. Almost 60% of this was recycled. The annual quantity of waste generated in Australia per capita declined slightly between 2006-07 and 2014-15.
If fly ash is excluded, waste generation per capita increased by an average of almost 1% each year.
The trend is towards more recycling and more recovery of energy from waste.
Waste generation and fate, Australia
2014-15
The percentages stated
above bars are the
resource recovery rates
Trends in waste
generation and fate, Australia
2006-07 to 2014-15
(including fly ash and
hazardous waste)
Page vii
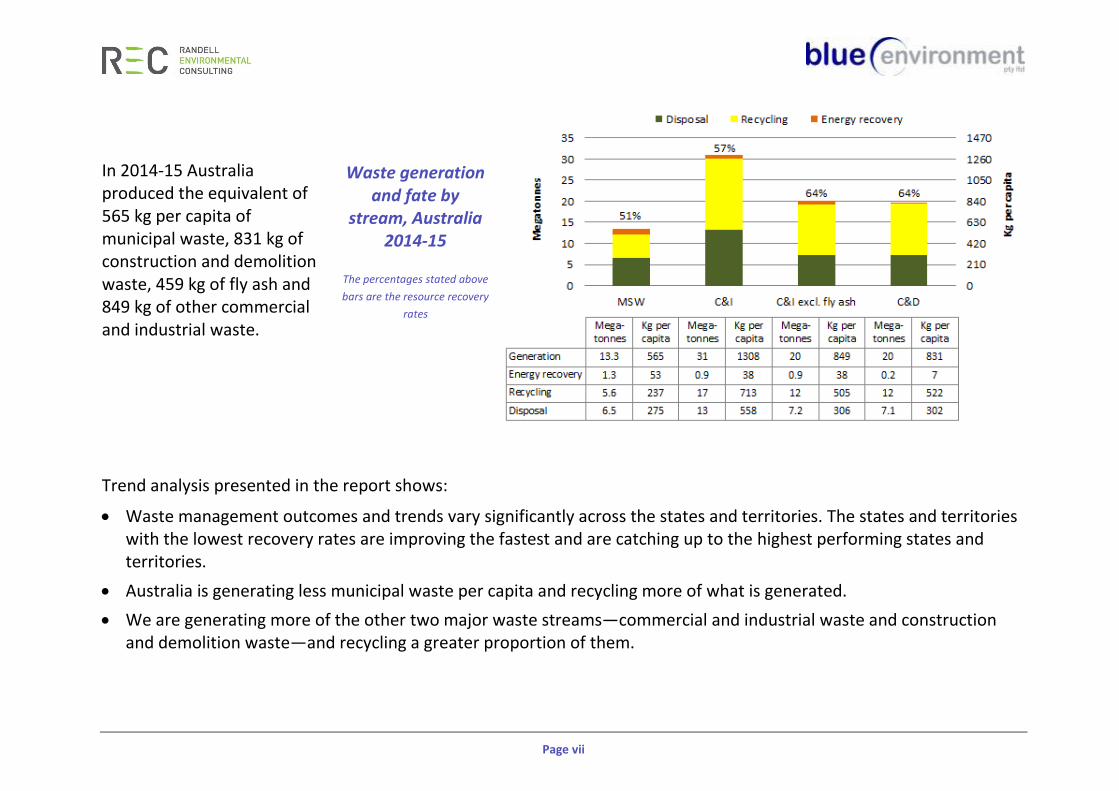
In 2014-15 Australia produced the equivalent of 565 kg per capita of municipal waste, 831 kg of construction and demolition waste, 459 kg of fly ash and 849 kg of other commercial and industrial waste.
Trend analysis presented in the report shows:
• Waste management outcomes and trends vary significantly across the states and territories. The states and territories with the lowest recovery rates are improving the fastest and are catching up to the highest performing states and territories.
• Australia is generating less municipal waste per capita and recycling more of what is generated.
• We are generating more of the other two major waste streams—commercial and industrial waste and construction and demolition waste—and recycling a greater proportion of them.
Waste generation and fate by
stream, Australia 2014-15
The percentages stated above
bars are the resource recovery
rates
Page viii
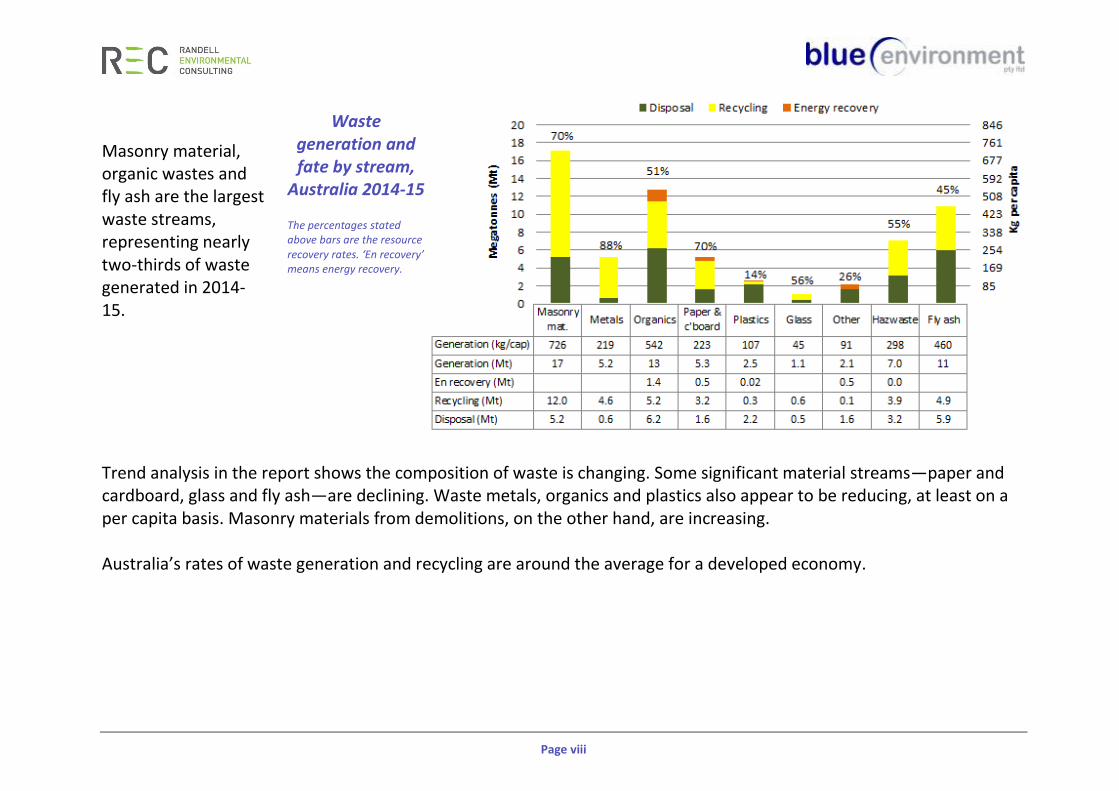
Masonry material, organic wastes and fly ash are the largest waste streams, representing nearly two-thirds of waste generated in 2014-15.
Trend analysis in the report shows the composition of waste is changing. Some significant material streams—paper and cardboard, glass and fly ash—are declining. Waste metals, organics and plastics also appear to be reducing, at least on a per capita basis. Masonry materials from demolitions, on the other hand, are increasing. Australia’s rates of waste generation and recycling are around the average for a developed economy.
Waste generation and fate by stream,
Australia 2014-15
The percentages stated above bars are the resource recovery rates. ‘En recovery’ means energy recovery.
Australian National Waste Report 2016 Final
Page 1
1. Introduction
This report was prepared on commission to the Australian Government Department of the Environment and Energy (DoEE). It provides a detailed picture of the status of solid waste generation, source streams, materials and fates in Australia during the financial year 2014-15. It also examines trends since 2006-07, and considers their causes. The report builds on the 2013 National Waste Report, which focused on data from 2010-11, and other earlier reports titled Waste and Recycling in Australia. The data in those reports has been updated for inclusion in the trends shown here, based on the current compilation method. Most of the data included in this report was obtained from state and territory governments, which collect it for their own monitoring and reporting. This data is supplemented, and sometimes replaced, by national industry data or other national estimates1. Quantity data is presented in kilograms (kg), tonnes (t), thousands of tonnes (kilotonnes or kt) or millions of tonnes (megatonnes or Mt). This report covers all Australian states and territories: Australian Capital Territory (ACT); New South Wales (NSW); Northern Territory (NT); Queensland (Qld); South Australia (SA); Tasmania (Tas); Victoria (Vic); and Western Australia (WA).
1.1 Scope
The report covers waste generated in Australia, including solid non-hazardous materials and all hazardous wastes including liquids (an accompanying report, Hazardous Waste in Australia 20172, considers hazardous waste in detail). The report excludes waste from primary production activities (agriculture, mining and forestry), waste that is reused (such as in ‘tip shops’), pre-consumer waste that is recycled as part of a production process, and clean fill/soil (whether or not it is sent to landfill). Waste sources are considered in three streams: municipal solid waste (MSW) from households and council operations; commercial and industrial (C&I) waste; and construction and demolition (C&D) waste. Waste fates are categorised into three types: disposal, which overwhelmingly means landfill; recycling; and energy recovery, which refers to processes such as conversion of organic waste into methane that is subsequently combusted to generate electricity. The term ‘resource recovery’ is used to represent the sum of recycling and energy recovery. ‘Waste generation’ is used to represent the sum of disposal and resource recovery.
1.2 Data collation methods
To obtain a national picture on waste, a common set of assumptions and categories must be applied to the collected data. This requires some manipulation of state and territory data, including recategorisation, applying assumed compositional splits and adjusting for cross-border transport. To facilitate these manipulations, in consultation with the states and territories, Randell Environmental Consulting and Blue Environment designed a national waste data set reporting tool as part of a previous
1 See Section 8 for more detail.
2 BE & AWE (2017)
Australian National Waste Report 2016 Final
Page 2
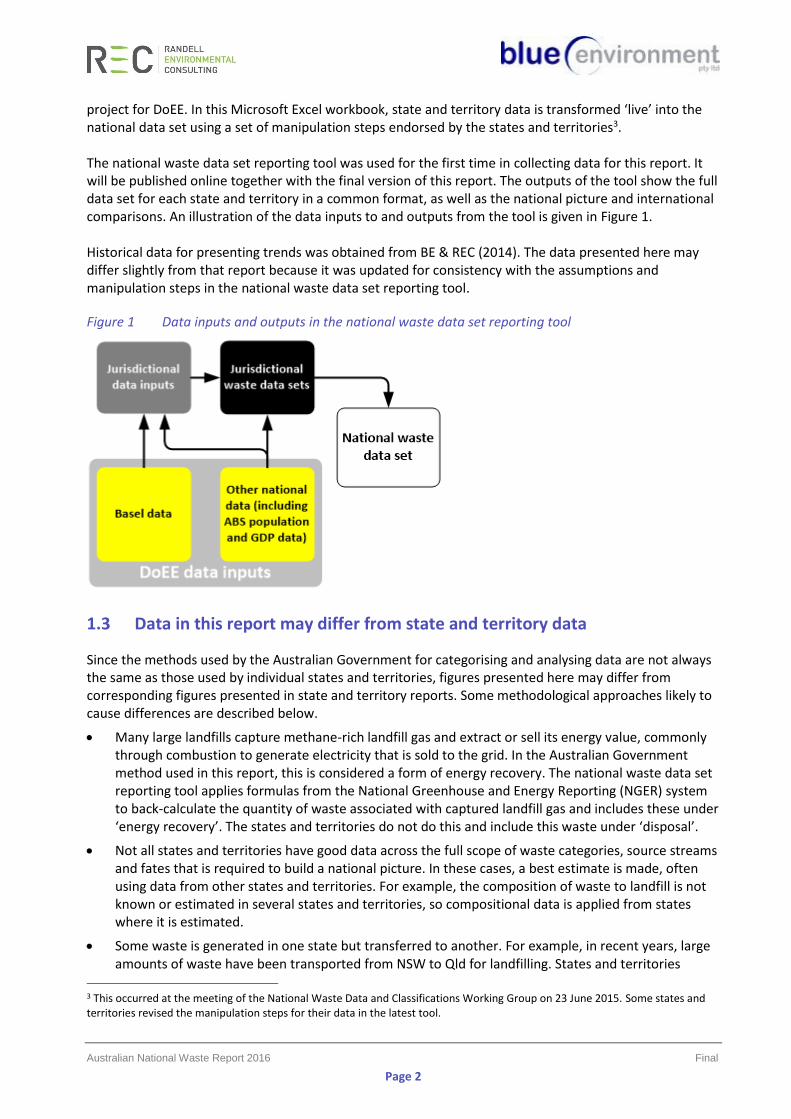
project for DoEE. In this Microsoft Excel workbook, state and territory data is transformed ‘live’ into the national data set using a set of manipulation steps endorsed by the states and territories3. The national waste data set reporting tool was used for the first time in collecting data for this report. It will be published online together with the final version of this report. The outputs of the tool show the full data set for each state and territory in a common format, as well as the national picture and international comparisons. An illustration of the data inputs to and outputs from the tool is given in Figure 1. Historical data for presenting trends was obtained from BE & REC (2014). The data presented here may differ slightly from that report because it was updated for consistency with the assumptions and manipulation steps in the national waste data set reporting tool.
Figure 1 Data inputs and outputs in the national waste data set reporting tool
1.3 Data in this report may differ from state and territory data
Since the methods used by the Australian Government for categorising and analysing data are not always the same as those used by individual states and territories, figures presented here may differ from corresponding figures presented in state and territory reports. Some methodological approaches likely to cause differences are described below.
• Many large landfills capture methane-rich landfill gas and extract or sell its energy value, commonly through combustion to generate electricity that is sold to the grid. In the Australian Government method used in this report, this is considered a form of energy recovery. The national waste data set reporting tool applies formulas from the National Greenhouse and Energy Reporting (NGER) system to back-calculate the quantity of waste associated with captured landfill gas and includes these under ‘energy recovery’. The states and territories do not do this and include this waste under ‘disposal’.
• Not all states and territories have good data across the full scope of waste categories, source streams and fates that is required to build a national picture. In these cases, a best estimate is made, often using data from other states and territories. For example, the composition of waste to landfill is not known or estimated in several states and territories, so compositional data is applied from states where it is estimated.
• Some waste is generated in one state but transferred to another. For example, in recent years, large amounts of waste have been transported from NSW to Qld for landfilling. States and territories
3 This occurred at the meeting of the National Waste Data and Classifications Working Group on 23 June 2015. Some states and territories revised the manipulation steps for their data in the latest tool.
Australian National Waste Report 2016 Final
Page 3
typically report only waste that is recovered or disposed within their boundaries but in this report, where data is available, transfers are reassigned to the jurisdiction where the waste was generated.
• This report covers wastes that are sometimes excluded from state and territory reports, such as biosolids from sewage treatment plants, fly ash from power stations and other types of hazardous waste (including hazardous liquid wastes).
• This report uses national instead of state and territory data for some wastes, including plastics and biosolids.
1.4 Data quality
Because waste data is often difficult and expensive to collect, the requirements, scope and mechanisms for collecting and reporting waste data vary across jurisdictions, industries and fates. The level of uncertainty in some of the presented data is likely to be high. For example, and as highlighted above, the composition of waste to landfill is estimated on the basis of periodic audits at a few landfills. In recognition of these limitations, data is generally presented to only two or three significant figures. There are data quality differences between states and territories:
• Data on waste to landfill: States with controlled fees or landfill levies (ACT, NSW, SA, Vic and WA) tend to have the most comprehensive data on waste to landfill, although Qld’s data is also good. WA’s is restricted to the Perth area.
• Data on recycling: ACT, NSW, Qld, SA, Vic and WA survey their recycling sectors and generate the most thorough data. NSW was unable to provide accurate 2014-15 recycling data for this report due to quality difficulties with the survey so the 2013-14 and 2014-15 data has been estimated (see Section 8.2 for details).
• Hazardous waste: NSW, Qld, SA, Vic and WA run hazardous waste tracking systems and generate the most comprehensive data on hazardous wastes. However, analysis of the Qld data found significant data quality problems (see BE & AWE 2017 for details).
The quality and quantity of the data on waste quantities, source streams and materials is continually improving. We are confident that the national data presented in this report is the most accurate to date.
1.5 Report structure
Section 2 provides further context for the report and discusses influences on waste generation and fate, namely population and economic growth, access to recycling markets, carbon policy, and state and territory waste policies. Section 3 aggregates state and territory data to present the national picture on waste. Section 4 compares the status of waste in Australia with various other countries and considers both waste generation and fate. Section 5 presents the perspectives of the four national industry associations on the status, challenges, opportunities and future of the industry. Section 6 presents the authors’ views on challenges and emerging issues. Section 7 presents the status of waste in each state and territory in alphabetical order, using the data layout described below. Commentary on the data from the state or territory is included where provided.
Australian National Waste Report 2016 Final
Page 4
A final section describes data sources and assumptions in more detail.
Technical terms and abbreviations used throughout are explained in the glossary on pages iv and v.
1.6 Data layout
State and territory data is presented in Section 7 in the following order:
1. Overall waste generation and fate (recycling, energy recovery or disposal) is presented on a total and per capita (or per person) basis.
2. This same data is presented by source stream (MSW, C&I, C&D).
3. Waste generation and fate is shown for eight or nine broad material categories as shown in Table 1.
4. A final subsection presents trends over the period 2006-07 to 2014-15 in waste disposal, recycling, energy recovery, generation and generation per capita.
National data is presented with more detail including trends by stream and material. Fly ash—a waste from coal-fired power plants—is emphasised in the report because it is generated in large volumes, it is mostly managed separately from the main waste management system, and it is generated in only five of the states and territories (NSW, Qld, SA, Vic and WA). Many charts and data sets in this report show quantities with and without fly ash so its significance can be understood and aggregated data on other wastes can be seen separately. Fly ash is excluded from the trend charts in Section 7 so that state and territory trends are readily comparable, whether or not they produce it.
Hazardous waste—both liquid and solid—is included in all the charts and data sets except where stated. The charts showing total quantities generated nationally and by state and territory show quantities with and without hazardous waste so its significance can be understood and aggregated data on other wastes can be seen separately.
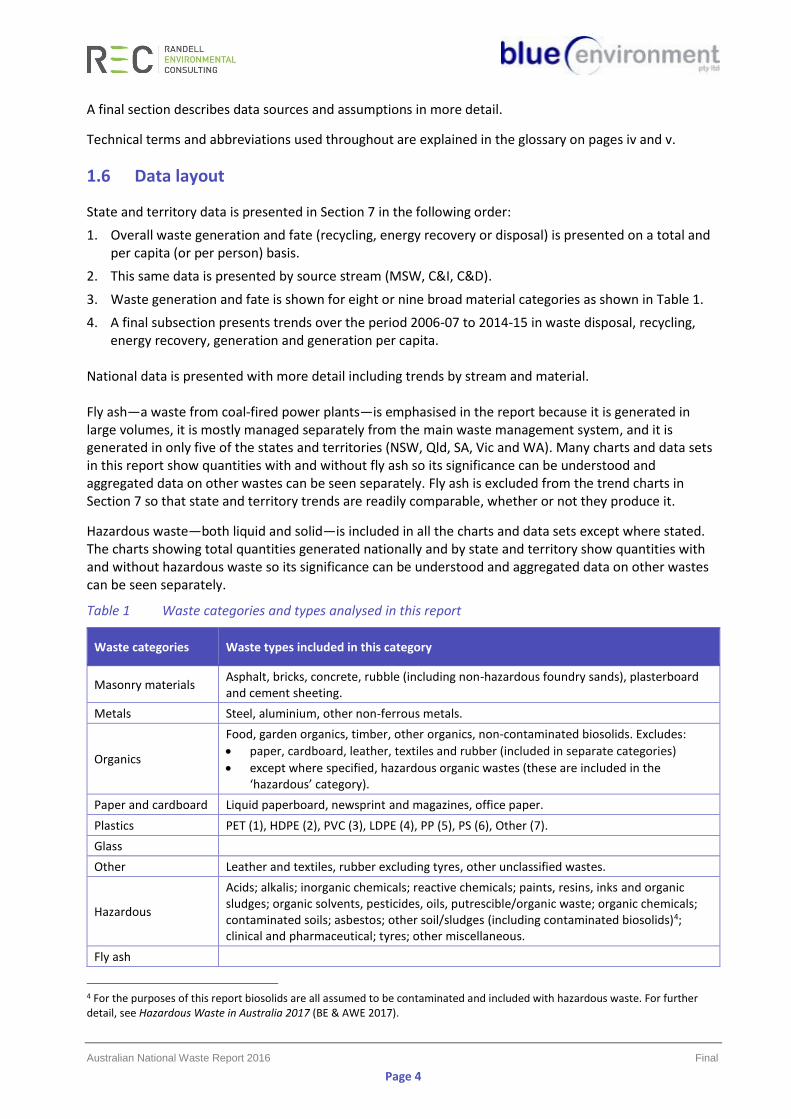
Table 1 Waste categories and types analysed in this report
4 For the purposes of this report biosolids are all assumed to be contaminated and included with hazardous waste. For further detail, see Hazardous Waste in Australia 2017 (BE & AWE 2017).
Waste categories Waste types included in this category
Masonry materials Asphalt, bricks, concrete, rubble (including non-hazardous foundry sands), plasterboard and cement sheeting.
Metals Steel, aluminium, other non-ferrous metals.
Organics
Food, garden organics, timber, other organics, non-contaminated biosolids. Excludes:
• paper, cardboard, leather, textiles and rubber (included in separate categories)
• except where specified, hazardous organic wastes (these are included in the ‘hazardous’ category).
Paper and cardboard Liquid paperboard, newsprint and magazines, office paper.
Plastics PET (1), HDPE (2), PVC (3), LDPE (4), PP (5), PS (6), Other (7).
Glass
Other Leather and textiles, rubber excluding tyres, other unclassified wastes.
Hazardous
Acids; alkalis; inorganic chemicals; reactive chemicals; paints, resins, inks and organic sludges; organic solvents, pesticides, oils, putrescible/organic waste; organic chemicals; contaminated soils; asbestos; other soil/sludges (including contaminated biosolids)4; clinical and pharmaceutical; tyres; other miscellaneous.
Fly ash
Australian National Waste Report 2016 Final
Page 5
2. Context
This section discusses five factors that influence Australia’s waste generation and management:
• population growth
• economic growth
• access to recycling markets
• carbon policy
• the main waste policy initiatives established in each state and territory.
2.1 Population growth
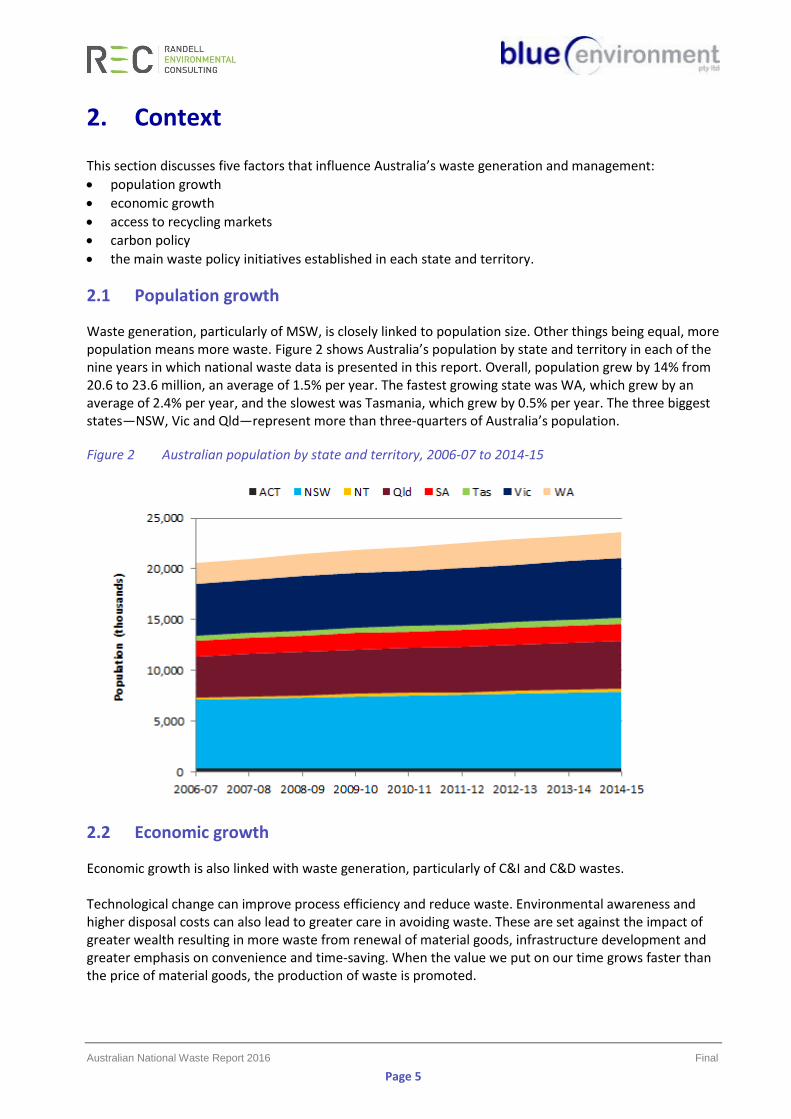
Waste generation, particularly of MSW, is closely linked to population size. Other things being equal, more population means more waste. Figure 2 shows Australia’s population by state and territory in each of the nine years in which national waste data is presented in this report. Overall, population grew by 14% from 20.6 to 23.6 million, an average of 1.5% per year. The fastest growing state was WA, which grew by an average of 2.4% per year, and the slowest was Tasmania, which grew by 0.5% per year. The three biggest states—NSW, Vic and Qld—represent more than three-quarters of Australia’s population.
Figure 2 Australian population by state and territory, 2006-07 to 2014-15
2.2 Economic growth
Economic growth is also linked with waste generation, particularly of C&I and C&D wastes. Technological change can improve process efficiency and reduce waste. Environmental awareness and higher disposal costs can also lead to greater care in avoiding waste. These are set against the impact of greater wealth resulting in more waste from renewal of material goods, infrastructure development and greater emphasis on convenience and time-saving. When the value we put on our time grows faster than the price of material goods, the production of waste is promoted.
Australian National Waste Report 2016 Final
Page 6
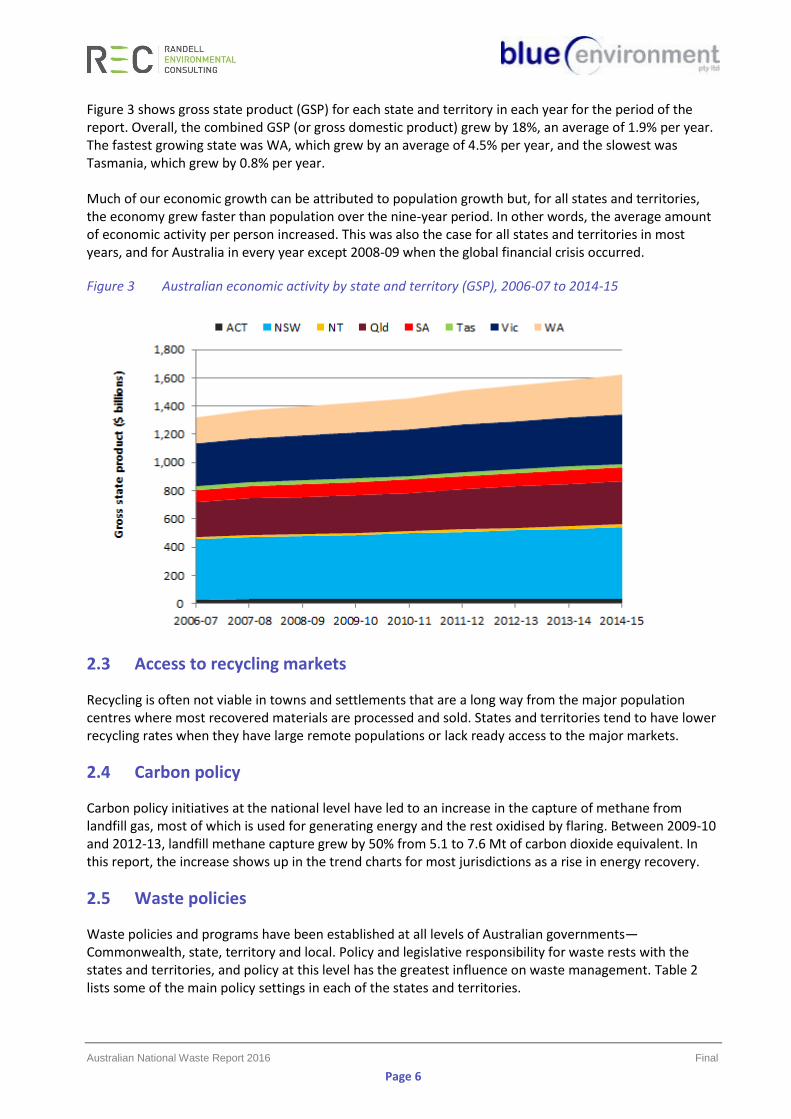
Figure 3 shows gross state product (GSP) for each state and territory in each year for the period of the report. Overall, the combined GSP (or gross domestic product) grew by 18%, an average of 1.9% per year. The fastest growing state was WA, which grew by an average of 4.5% per year, and the slowest was Tasmania, which grew by 0.8% per year. Much of our economic growth can be attributed to population growth but, for all states and territories, the economy grew faster than population over the nine-year period. In other words, the average amount of economic activity per person increased. This was also the case for all states and territories in most years, and for Australia in every year except 2008-09 when the global financial crisis occurred.
Figure 3 Australian economic activity by state and territory (GSP), 2006-07 to 2014-15
2.3 Access to recycling markets
Recycling is often not viable in towns and settlements that are a long way from the major population centres where most recovered materials are processed and sold. States and territories tend to have lower recycling rates when they have large remote populations or lack ready access to the major markets.
2.4 Carbon policy
Carbon policy initiatives at the national level have led to an increase in the capture of methane from landfill gas, most of which is used for generating energy and the rest oxidised by flaring. Between 2009-10 and 2012-13, landfill methane capture grew by 50% from 5.1 to 7.6 Mt of carbon dioxide equivalent. In this report, the increase shows up in the trend charts for most jurisdictions as a rise in energy recovery.
2.5 Waste policies
Waste policies and programs have been established at all levels of Australian governments—Commonwealth, state, territory and local. Policy and legislative responsibility for waste rests with the states and territories, and policy at this level has the greatest influence on waste management. Table 2 lists some of the main policy settings in each of the states and territories.
Australian National Waste Report 2016 Final
Page 7
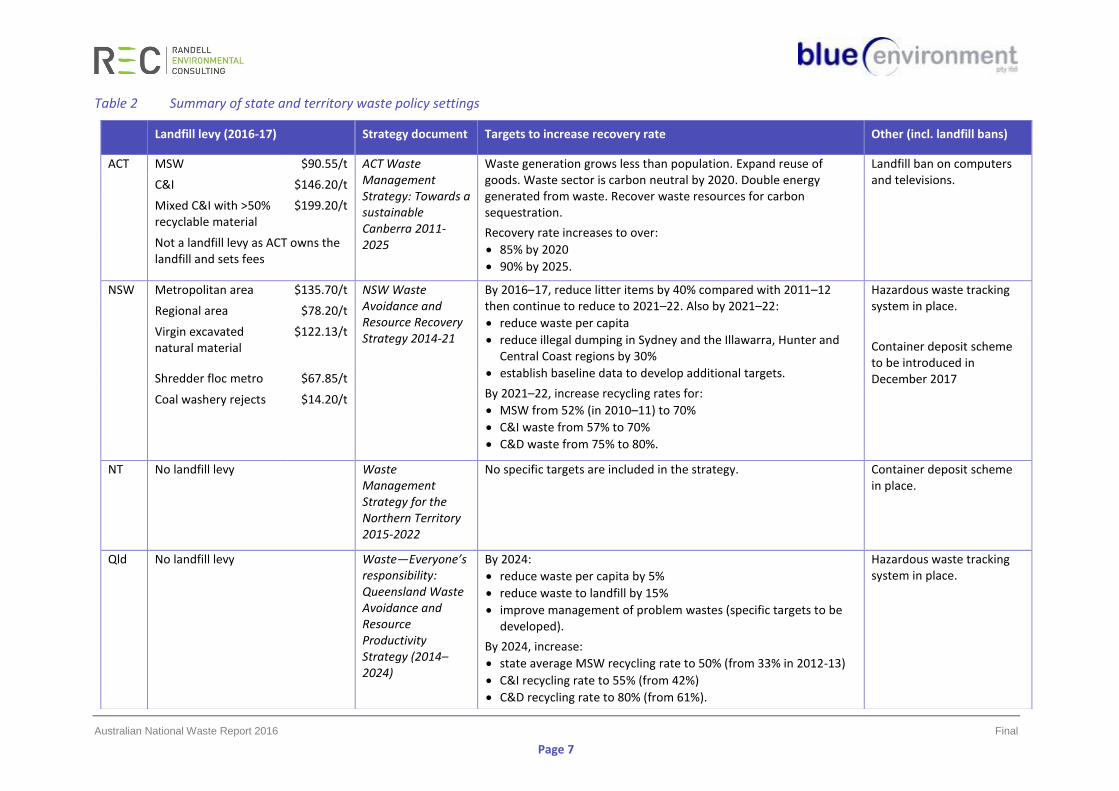
Table 2 Summary of state and territory waste policy settings
Landfill levy (2016-17) Strategy document Targets to increase recovery rate Other (incl. landfill bans)
ACT MSW $90.55/t ACT Waste Management Strategy: Towards a sustainable Canberra 2011-2025
Waste generation grows less than population. Expand reuse of goods. Waste sector is carbon neutral by 2020. Double energy generated from waste. Recover waste resources for carbon sequestration.
Recovery rate increases to over:
• 85% by 2020
• 90% by 2025.
Landfill ban on computers and televisions.
C&I $146.20/t
Mixed C&I with >50% recyclable material
$199.20/t
Not a landfill levy as ACT owns the landfill and sets fees
NSW Metropolitan area $135.70/t NSW Waste Avoidance and Resource Recovery Strategy 2014-21
By 2016–17, reduce litter items by 40% compared with 2011–12 then continue to reduce to 2021–22. Also by 2021–22:
• reduce waste per capita
• reduce illegal dumping in Sydney and the Illawarra, Hunter and Central Coast regions by 30%
• establish baseline data to develop additional targets.
By 2021–22, increase recycling rates for:
• MSW from 52% (in 2010–11) to 70%
• C&I waste from 57% to 70%
• C&D waste from 75% to 80%.
Hazardous waste tracking system in place.
Container deposit scheme to be introduced in December 2017
Regional area $78.20/t
Virgin excavated natural material
$122.13/t
Shredder floc metro $67.85/t
Coal washery rejects $14.20/t
NT No landfill levy Waste Management Strategy for the Northern Territory 2015-2022
No specific targets are included in the strategy. Container deposit scheme in place.
Qld No landfill levy Waste—Everyone’s responsibility: Queensland Waste Avoidance and Resource Productivity Strategy (2014–2024)
By 2024:
• reduce waste per capita by 5%
• reduce waste to landfill by 15%
• improve management of problem wastes (specific targets to be developed).
By 2024, increase:
• state average MSW recycling rate to 50% (from 33% in 2012-13)
• C&I recycling rate to 55% (from 42%)
• C&D recycling rate to 80% (from 61%).
Hazardous waste tracking system in place.
Australian National Waste Report 2016 Final
Page 8
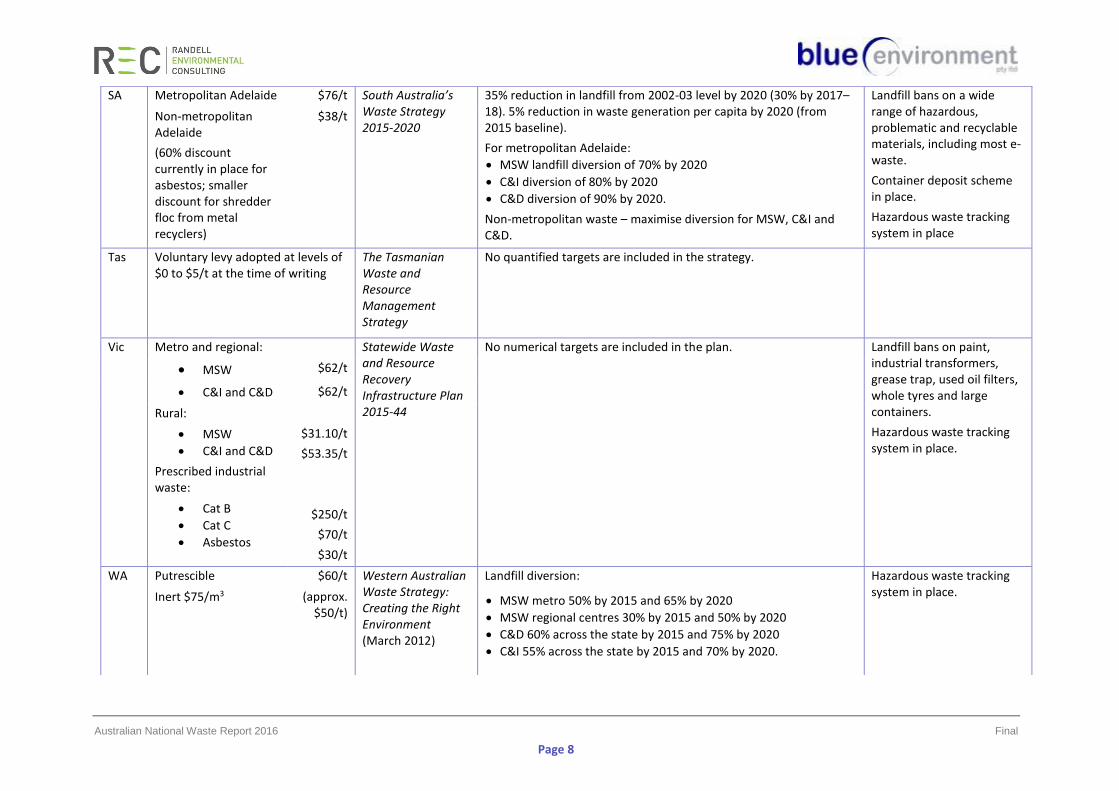
SA Metropolitan Adelaide $76/t South Australia’s Waste Strategy 2015-2020
35% reduction in landfill from 2002-03 level by 2020 (30% by 2017–18). 5% reduction in waste generation per capita by 2020 (from 2015 baseline).
For metropolitan Adelaide:
• MSW landfill diversion of 70% by 2020
• C&I diversion of 80% by 2020
• C&D diversion of 90% by 2020.
Non-metropolitan waste – maximise diversion for MSW, C&I and C&D.
Landfill bans on a wide range of hazardous, problematic and recyclable materials, including most e-waste.
Container deposit scheme in place.
Hazardous waste tracking system in place
Non-metropolitan Adelaide
(60% discount currently in place for asbestos; smaller discount for shredder floc from metal recyclers)
$38/t
Tas Voluntary levy adopted at levels of $0 to $5/t at the time of writing
The Tasmanian Waste and Resource Management Strategy
No quantified targets are included in the strategy.
Vic Metro and regional: Statewide Waste and Resource Recovery Infrastructure Plan 2015-44
No numerical targets are included in the plan. Landfill bans on paint, industrial transformers, grease trap, used oil filters, whole tyres and large containers.
Hazardous waste tracking system in place.
• MSW $62/t
• C&I and C&D $62/t
Rural:
• MSW
• C&I and C&D
Prescribed industrial waste:
• Cat B
• Cat C
• Asbestos
$31.10/t
$53.35/t
$250/t
$70/t
$30/t
WA Putrescible $60/t Western Australian Waste Strategy: Creating the Right Environment (March 2012)
Landfill diversion:
• MSW metro 50% by 2015 and 65% by 2020
• MSW regional centres 30% by 2015 and 50% by 2020
• C&D 60% across the state by 2015 and 75% by 2020
• C&I 55% across the state by 2015 and 70% by 2020.
Hazardous waste tracking system in place. Inert $75/m3 (approx.
$50/t)
Australian National Waste Report 2016 Final
Page 9
3. The national picture
3.1 Overall waste quantities analysis
Overall waste generation and fate, Australia 2014-15
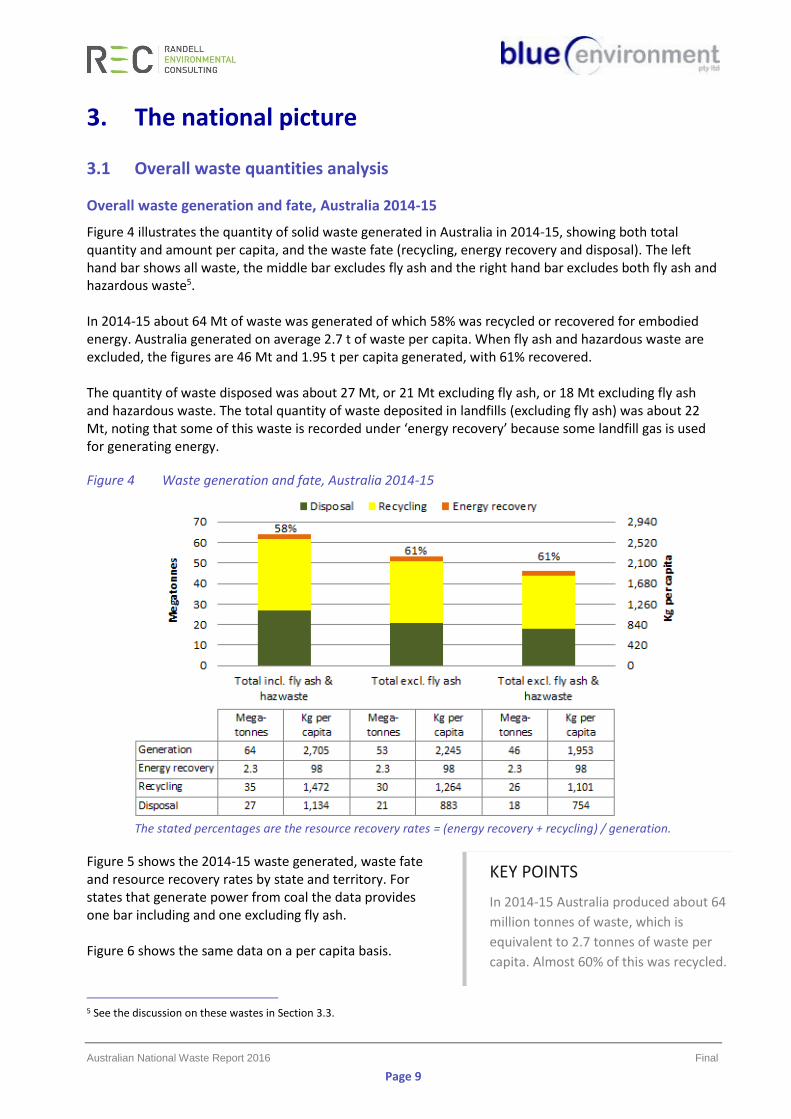
Figure 4 illustrates the quantity of solid waste generated in Australia in 2014-15, showing both total quantity and amount per capita, and the waste fate (recycling, energy recovery and disposal). The left hand bar shows all waste, the middle bar excludes fly ash and the right hand bar excludes both fly ash and hazardous waste5. In 2014-15 about 64 Mt of waste was generated of which 58% was recycled or recovered for embodied energy. Australia generated on average 2.7 t of waste per capita. When fly ash and hazardous waste are excluded, the figures are 46 Mt and 1.95 t per capita generated, with 61% recovered. The quantity of waste disposed was about 27 Mt, or 21 Mt excluding fly ash, or 18 Mt excluding fly ash and hazardous waste. The total quantity of waste deposited in landfills (excluding fly ash) was about 22 Mt, noting that some of this waste is recorded under ‘energy recovery’ because some landfill gas is used for generating energy.
Figure 4 Waste generation and fate, Australia 2014-15
The stated percentages are the resource recovery rates = (energy recovery + recycling) / generation.
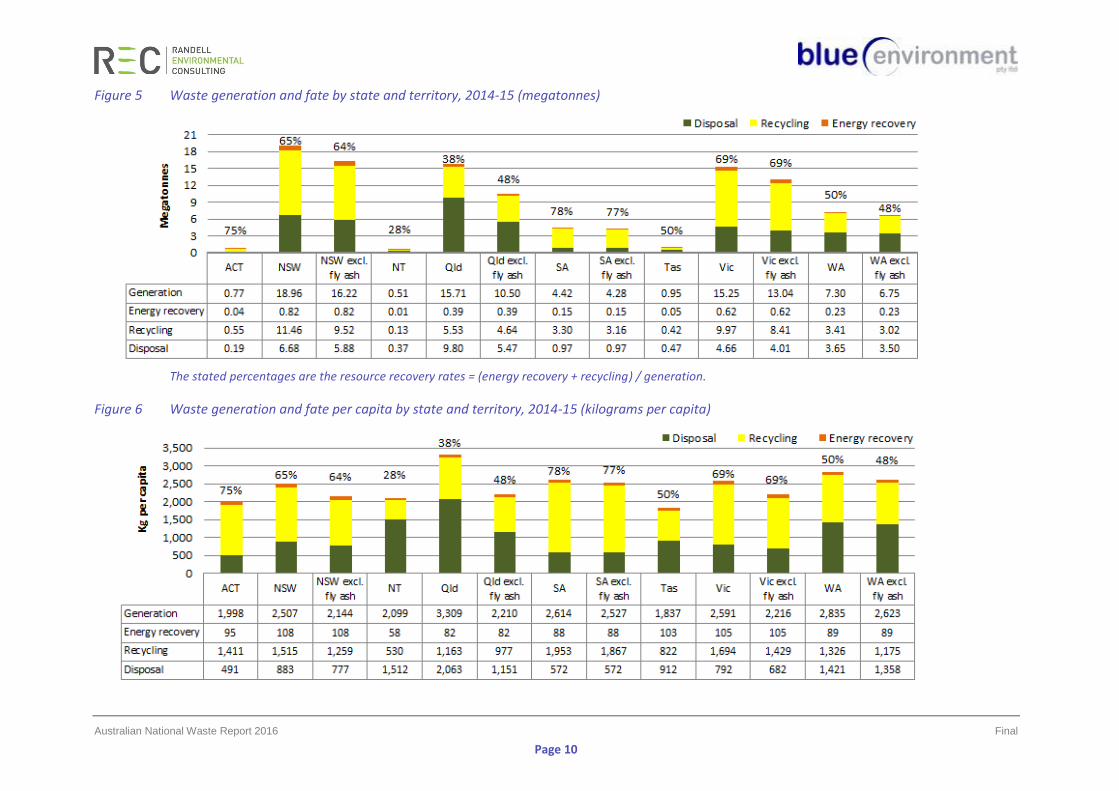
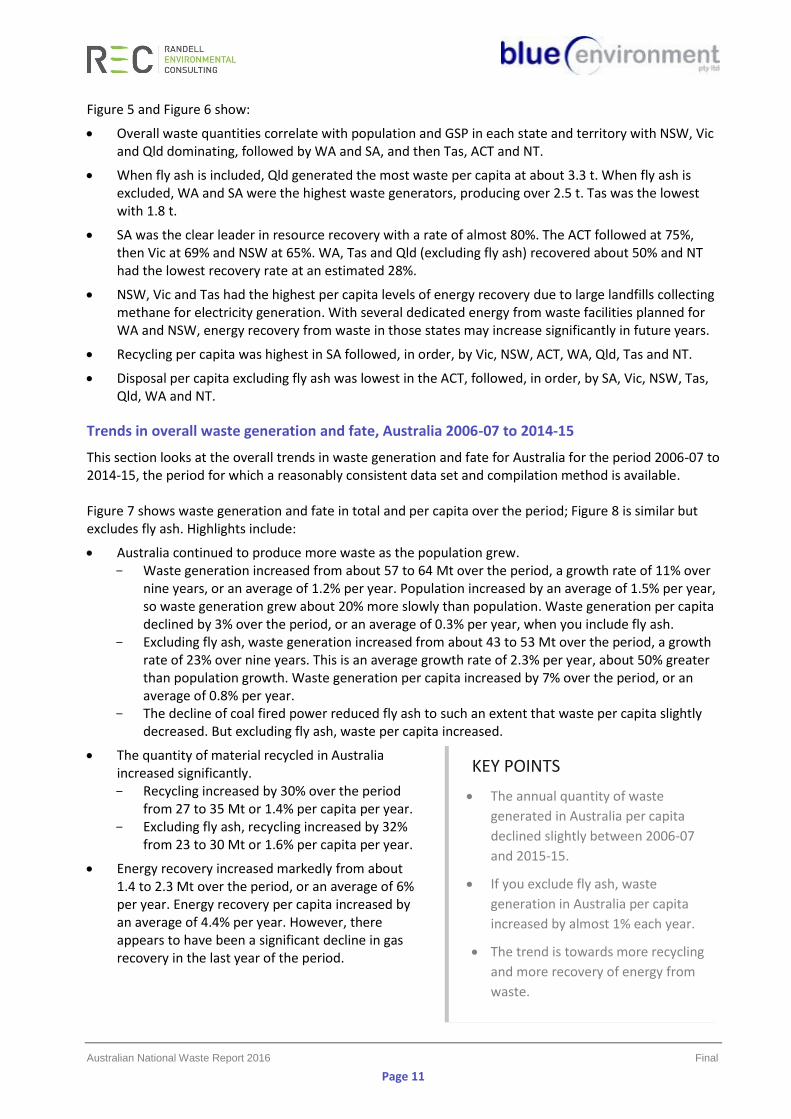
Figure 5 shows the 2014-15 waste generated, waste fate and resource recovery rates by state and territory. For states that generate power from coal the data provides one bar including and one excluding fly ash. Figure 6 shows the same data on a per capita basis.
5 See the discussion on these wastes in Section 3.3.
KEY POINTS
In 2014-15 Australia produced about 64
million tonnes of waste, which is
equivalent to 2.7 tonnes of waste per
capita. Almost 60% of this was recycled.
Australian National Waste Report 2016 Final
Page 10
Figure 5 Waste generation and fate by state and territory, 2014-15 (megatonnes)
The stated percentages are the resource recovery rates = (energy recovery + recycling) / generation.
Figure 6 Waste generation and fate per capita by state and territory, 2014-15 (kilograms per capita)
Australian National Waste Report 2016 Final
Page 11
Figure 5 and Figure 6 show:
• Overall waste quantities correlate with population and GSP in each state and territory with NSW, Vic and Qld dominating, followed by WA and SA, and then Tas, ACT and NT.
• When fly ash is included, Qld generated the most waste per capita at about 3.3 t. When fly ash is excluded, WA and SA were the highest waste generators, producing over 2.5 t. Tas was the lowest with 1.8 t.
• SA was the clear leader in resource recovery with a rate of almost 80%. The ACT followed at 75%, then Vic at 69% and NSW at 65%. WA, Tas and Qld (excluding fly ash) recovered about 50% and NT had the lowest recovery rate at an estimated 28%.
• NSW, Vic and Tas had the highest per capita levels of energy recovery due to large landfills collecting methane for electricity generation. With several dedicated energy from waste facilities planned for WA and NSW, energy recovery from waste in those states may increase significantly in future years.
• Recycling per capita was highest in SA followed, in order, by Vic, NSW, ACT, WA, Qld, Tas and NT.
• Disposal per capita excluding fly ash was lowest in the ACT, followed, in order, by SA, Vic, NSW, Tas, Qld, WA and NT.
Trends in overall waste generation and fate, Australia 2006-07 to 2014-15
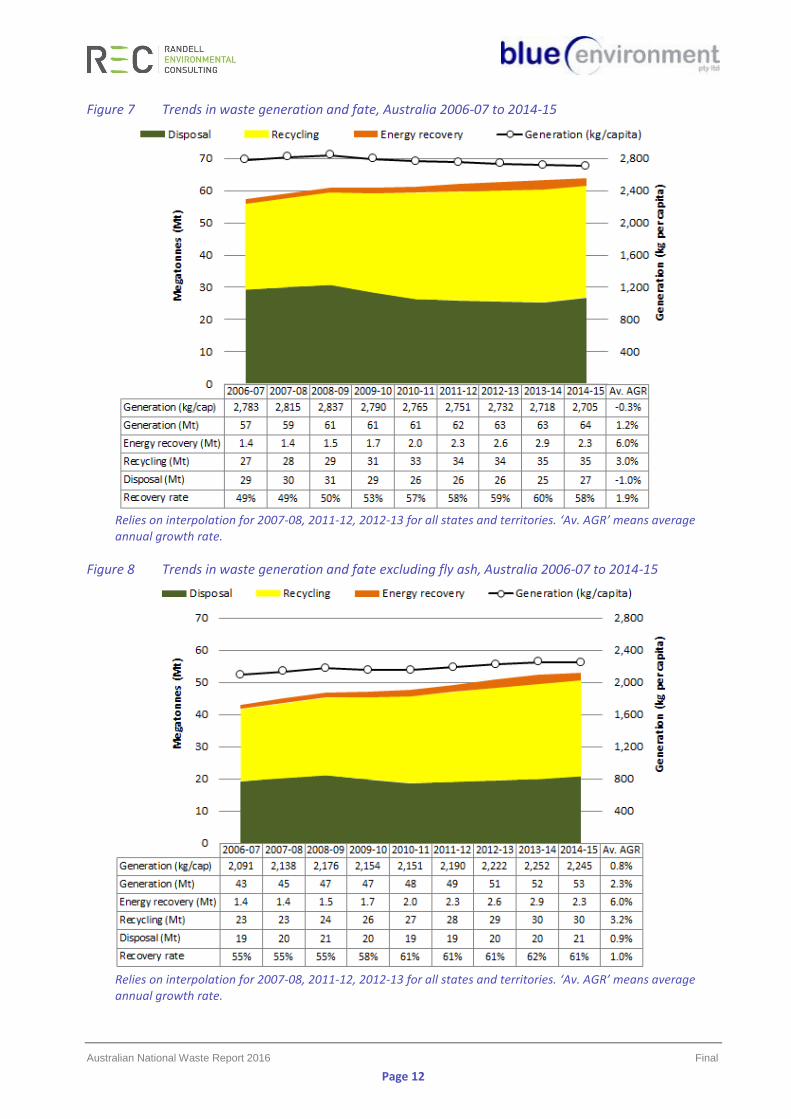
This section looks at the overall trends in waste generation and fate for Australia for the period 2006-07 to 2014-15, the period for which a reasonably consistent data set and compilation method is available. Figure 7 shows waste generation and fate in total and per capita over the period; Figure 8 is similar but excludes fly ash. Highlights include:
• Australia continued to produce more waste as the population grew. - Waste generation increased from about 57 to 64 Mt over the period, a growth rate of 11% over
nine years, or an average of 1.2% per year. Population increased by an average of 1.5% per year, so waste generation grew about 20% more slowly than population. Waste generation per capita declined by 3% over the period, or an average of 0.3% per year, when you include fly ash.
- Excluding fly ash, waste generation increased from about 43 to 53 Mt over the period, a growth rate of 23% over nine years. This is an average growth rate of 2.3% per year, about 50% greater than population growth. Waste generation per capita increased by 7% over the period, or an average of 0.8% per year.
- The decline of coal fired power reduced fly ash to such an extent that waste per capita slightly decreased. But excluding fly ash, waste per capita increased.
• The quantity of material recycled in Australia increased significantly. - Recycling increased by 30% over the period
from 27 to 35 Mt or 1.4% per capita per year. - Excluding fly ash, recycling increased by 32%
from 23 to 30 Mt or 1.6% per capita per year.
• Energy recovery increased markedly from about 1.4 to 2.3 Mt over the period, or an average of 6% per year. Energy recovery per capita increased by an average of 4.4% per year. However, there appears to have been a significant decline in gas recovery in the last year of the period.
KEY POINTS
• The annual quantity of waste
generated in Australia per capita
declined slightly between 2006-07
and 2015-15.
• If you exclude fly ash, waste
generation in Australia per capita
increased by almost 1% each year.
• The trend is towards more recycling
and more recovery of energy from
waste.
Australian National Waste Report 2016 Final
Page 12
Figure 7 Trends in waste generation and fate, Australia 2006-07 to 2014-15
Relies on interpolation for 2007-08, 2011-12, 2012-13 for all states and territories. ‘Av. AGR’ means average annual growth rate.
Figure 8 Trends in waste generation and fate excluding fly ash, Australia 2006-07 to 2014-15
Relies on interpolation for 2007-08, 2011-12, 2012-13 for all states and territories. ‘Av. AGR’ means average annual growth rate.
Australian National Waste Report 2016 Final
Page 13
• Australia’s disposal tonnages were fairly stable. - Disposal fell by 8% from about 29 to 27 Mt over the period. This is a decline per capita of about
2.5% per year. - Excluding fly ash, disposal increased by 9% from about 19 to 21 Mt. This is an average decline
per capita of about 0.6% per year.
• The resource recovery rate in Australia increased from 49% to 58% over the period. Excluding fly ash, it grew from 55% to 61%.
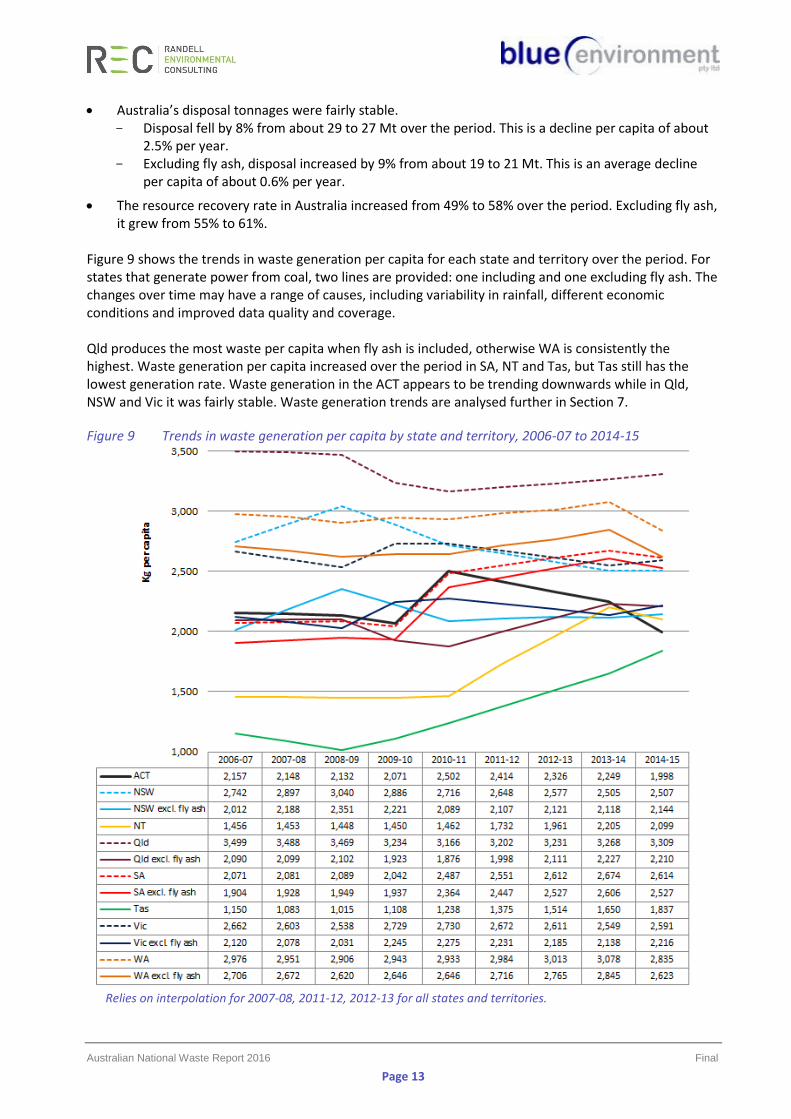
Figure 9 shows the trends in waste generation per capita for each state and territory over the period. For states that generate power from coal, two lines are provided: one including and one excluding fly ash. The changes over time may have a range of causes, including variability in rainfall, different economic conditions and improved data quality and coverage. Qld produces the most waste per capita when fly ash is included, otherwise WA is consistently the highest. Waste generation per capita increased over the period in SA, NT and Tas, but Tas still has the lowest generation rate. Waste generation in the ACT appears to be trending downwards while in Qld, NSW and Vic it was fairly stable. Waste generation trends are analysed further in Section 7.
Figure 9 Trends in waste generation per capita by state and territory, 2006-07 to 2014-15
Relies on interpolation for 2007-08, 2011-12, 2012-13 for all states and territories.
Australian National Waste Report 2016 Final
Page 14
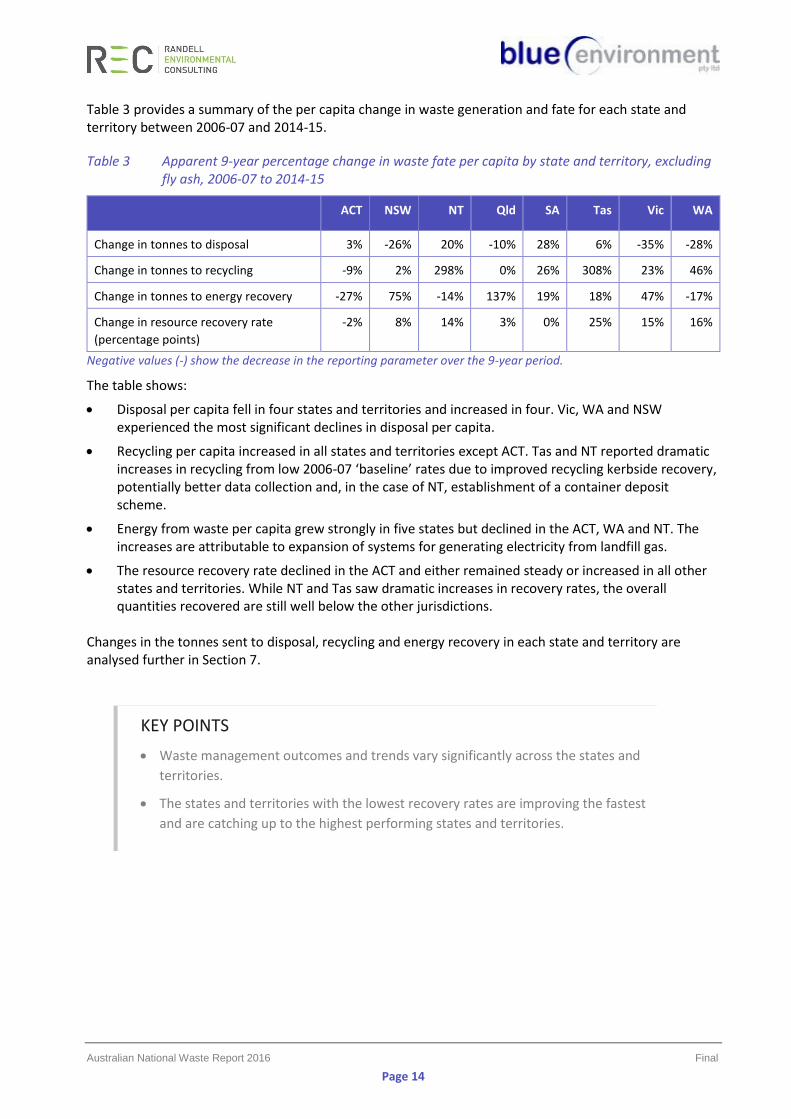
Table 3 provides a summary of the per capita change in waste generation and fate for each state and territory between 2006-07 and 2014-15.
Table 3 Apparent 9-year percentage change in waste fate per capita by state and territory, excluding fly ash, 2006-07 to 2014-15
Negative values (-) show the decrease in the reporting parameter over the 9-year period.
The table shows:
• Disposal per capita fell in four states and territories and increased in four. Vic, WA and NSW experienced the most significant declines in disposal per capita.
• Recycling per capita increased in all states and territories except ACT. Tas and NT reported dramatic increases in recycling from low 2006-07 ‘baseline’ rates due to improved recycling kerbside recovery, potentially better data collection and, in the case of NT, establishment of a container deposit scheme.
• Energy from waste per capita grew strongly in five states but declined in the ACT, WA and NT. The increases are attributable to expansion of systems for generating electricity from landfill gas.
• The resource recovery rate declined in the ACT and either remained steady or increased in all other states and territories. While NT and Tas saw dramatic increases in recovery rates, the overall quantities recovered are still well below the other jurisdictions.
Changes in the tonnes sent to disposal, recycling and energy recovery in each state and territory are analysed further in Section 7.
ACT NSW NT Qld SA Tas Vic WA
Change in tonnes to disposal 3% -26% 20% -10% 28% 6% -35% -28%
Change in tonnes to recycling -9% 2% 298% 0% 26% 308% 23% 46%
Change in tonnes to energy recovery -27% 75% -14% 137% 19% 18% 47% -17%
Change in resource recovery rate
(percentage points)
-2% 8% 14% 3% 0% 25% 15% 16%
KEY POINTS
• Waste management outcomes and trends vary significantly across the states and
territories.
• The states and territories with the lowest recovery rates are improving the fastest
and are catching up to the highest performing states and territories.
Australian National Waste Report 2016 Final
Page 15
3.2 Waste stream analysis
Generation and fate by waste stream, Australia 2014-15
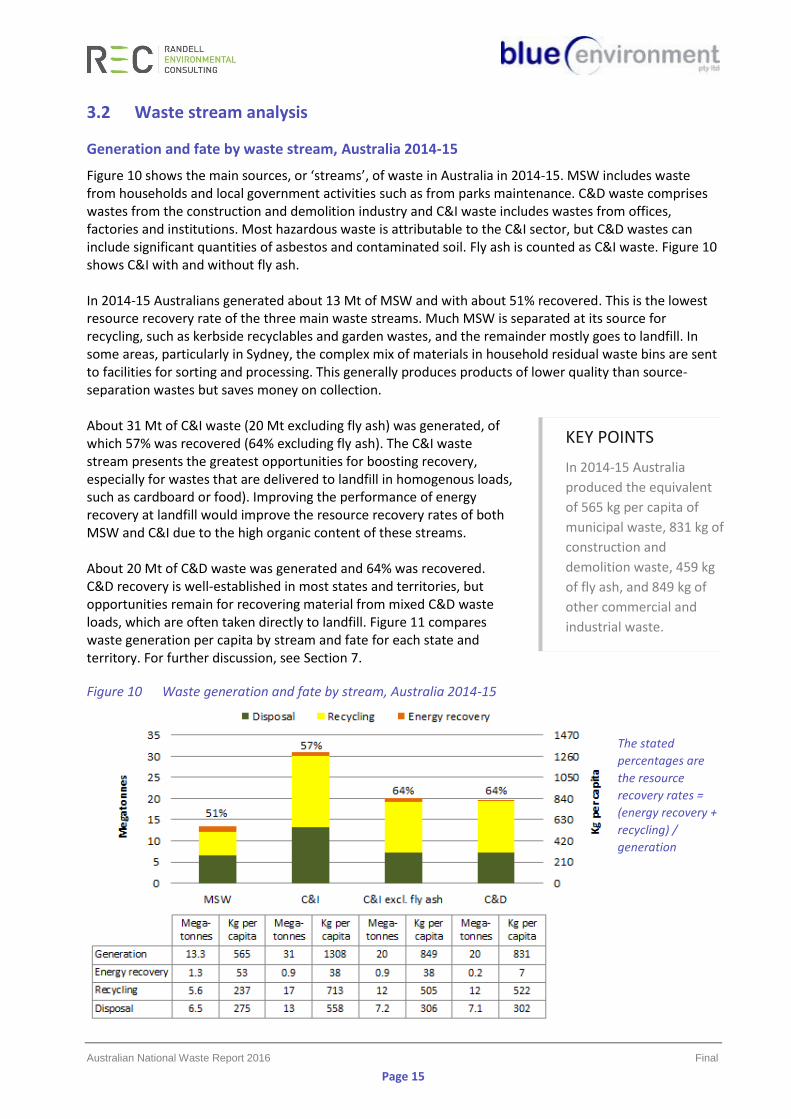
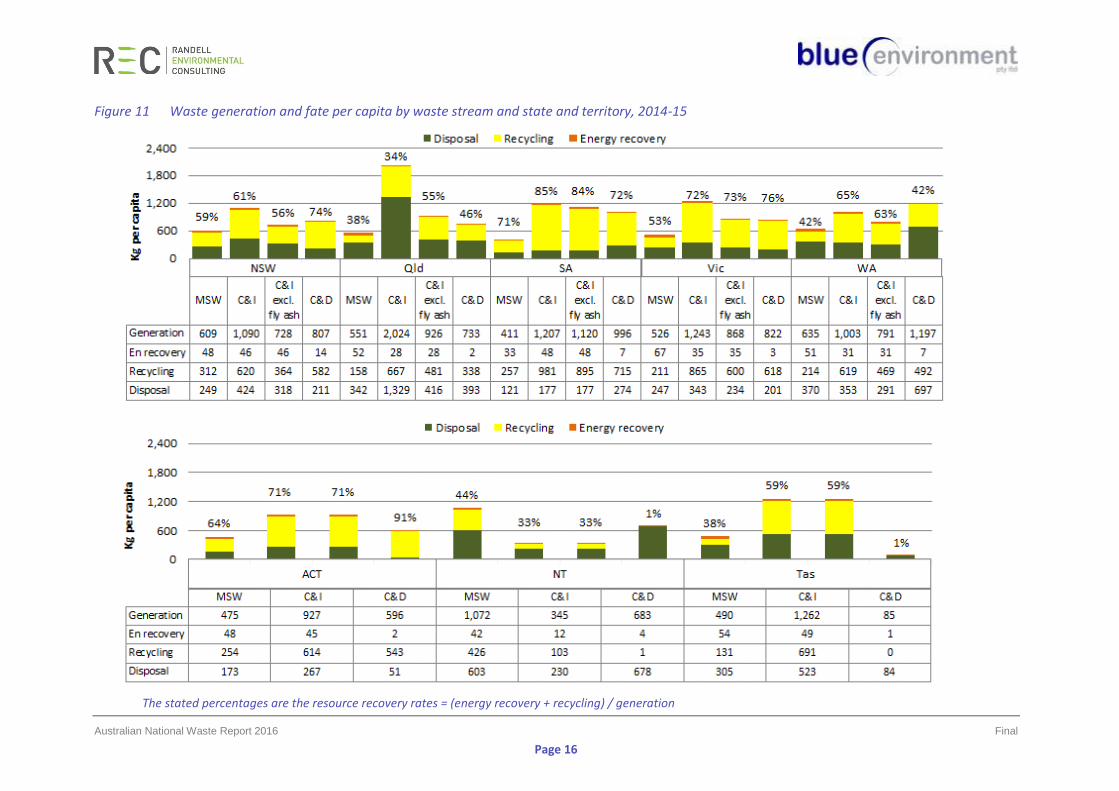
Figure 10 shows the main sources, or ‘streams’, of waste in Australia in 2014-15. MSW includes waste from households and local government activities such as from parks maintenance. C&D waste comprises wastes from the construction and demolition industry and C&I waste includes wastes from offices, factories and institutions. Most hazardous waste is attributable to the C&I sector, but C&D wastes can include significant quantities of asbestos and contaminated soil. Fly ash is counted as C&I waste. Figure 10 shows C&I with and without fly ash. In 2014-15 Australians generated about 13 Mt of MSW and with about 51% recovered. This is the lowest resource recovery rate of the three main waste streams. Much MSW is separated at its source for recycling, such as kerbside recyclables and garden wastes, and the remainder mostly goes to landfill. In some areas, particularly in Sydney, the complex mix of materials in household residual waste bins are sent to facilities for sorting and processing. This generally produces products of lower quality than source-separation wastes but saves money on collection. About 31 Mt of C&I waste (20 Mt excluding fly ash) was generated, of which 57% was recovered (64% excluding fly ash). The C&I waste stream presents the greatest opportunities for boosting recovery, especially for wastes that are delivered to landfill in homogenous loads, such as cardboard or food). Improving the performance of energy recovery at landfill would improve the resource recovery rates of both MSW and C&I due to the high organic content of these streams. About 20 Mt of C&D waste was generated and 64% was recovered. C&D recovery is well-established in most states and territories, but opportunities remain for recovering material from mixed C&D waste loads, which are often taken directly to landfill. Figure 11 compares waste generation per capita by stream and fate for each state and territory. For further discussion, see Section 7.
Figure 10 Waste generation and fate by stream, Australia 2014-15
The stated
percentages are
the resource
recovery rates =
(energy recovery +
recycling) /
generation
KEY POINTS
In 2014-15 Australia
produced the equivalent
of 565 kg per capita of
municipal waste, 831 kg of
construction and
demolition waste, 459 kg
of fly ash, and 849 kg of
other commercial and
industrial waste.
Australian National Waste Report 2016 Final
Page 16
Figure 11 Waste generation and fate per capita by waste stream and state and territory, 2014-15
The stated percentages are the resource recovery rates = (energy recovery + recycling) / generation
Australian National Waste Report 2016 Final
Page 17
Trends in waste generation and fate by waste stream, Australia 2006-07 to 2014-15
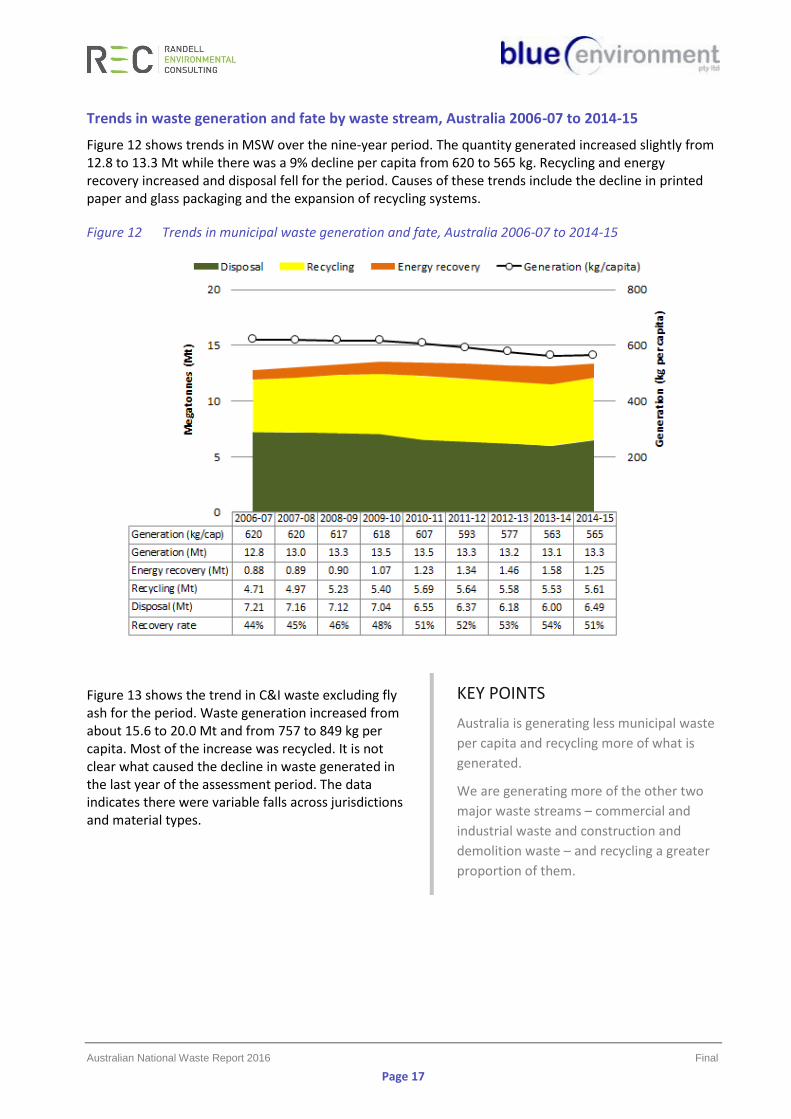
Figure 12 shows trends in MSW over the nine-year period. The quantity generated increased slightly from 12.8 to 13.3 Mt while there was a 9% decline per capita from 620 to 565 kg. Recycling and energy recovery increased and disposal fell for the period. Causes of these trends include the decline in printed paper and glass packaging and the expansion of recycling systems.
Figure 12 Trends in municipal waste generation and fate, Australia 2006-07 to 2014-15
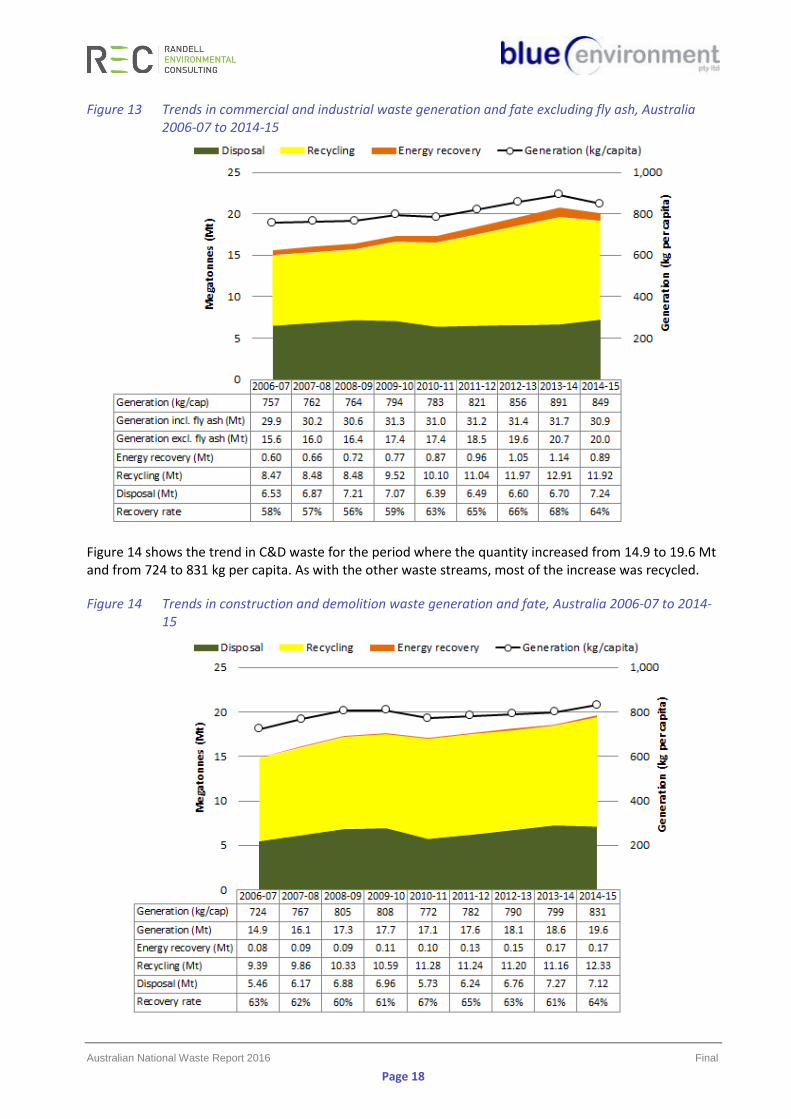
Figure 13 shows the trend in C&I waste excluding fly ash for the period. Waste generation increased from about 15.6 to 20.0 Mt and from 757 to 849 kg per capita. Most of the increase was recycled. It is not clear what caused the decline in waste generated in the last year of the assessment period. The data indicates there were variable falls across jurisdictions and material types.
KEY POINTS
Australia is generating less municipal waste
per capita and recycling more of what is
generated.
We are generating more of the other two
major waste streams – commercial and
industrial waste and construction and
demolition waste – and recycling a greater
proportion of them.
Australian National Waste Report 2016 Final
Page 18
Figure 13 Trends in commercial and industrial waste generation and fate excluding fly ash, Australia 2006-07 to 2014-15
Figure 14 shows the trend in C&D waste for the period where the quantity increased from 14.9 to 19.6 Mt and from 724 to 831 kg per capita. As with the other waste streams, most of the increase was recycled.
Figure 14 Trends in construction and demolition waste generation and fate, Australia 2006-07 to 2014-15
Australian National Waste Report 2016 Final
Page 19
3.3 Waste materials analysis
Generation and fate by material, Australia 2014-15
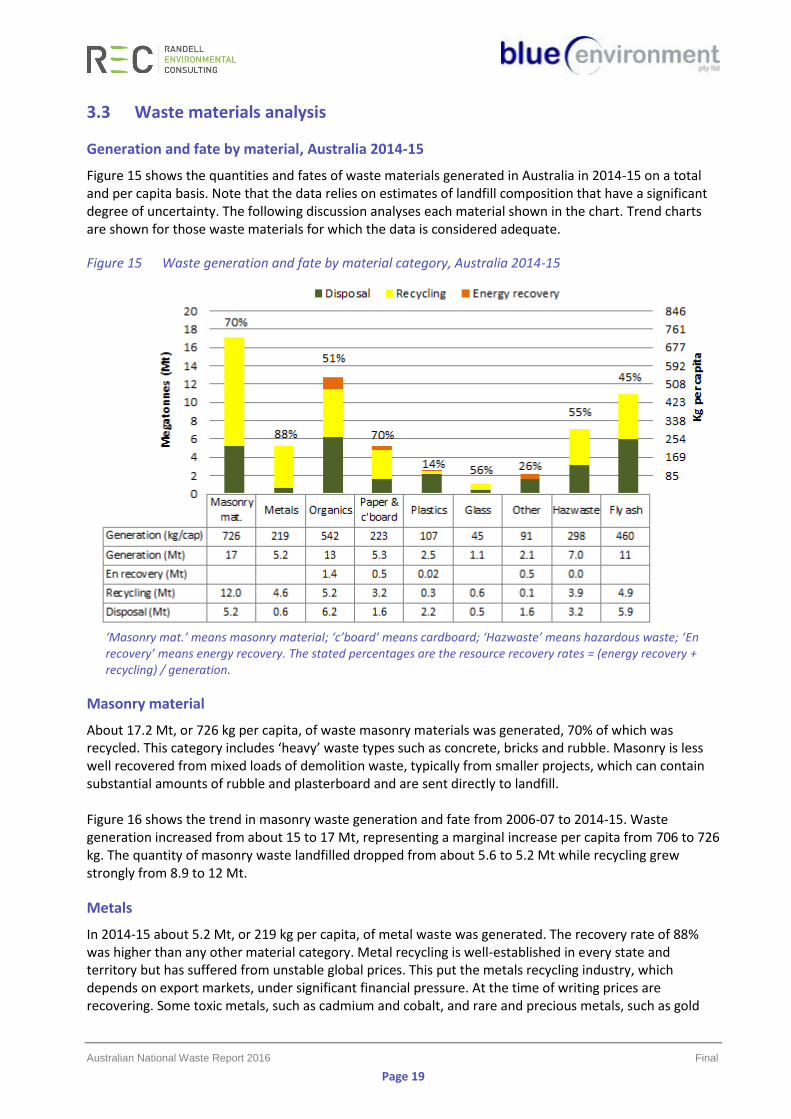
Figure 15 shows the quantities and fates of waste materials generated in Australia in 2014-15 on a total and per capita basis. Note that the data relies on estimates of landfill composition that have a significant degree of uncertainty. The following discussion analyses each material shown in the chart. Trend charts are shown for those waste materials for which the data is considered adequate.
Figure 15 Waste generation and fate by material category, Australia 2014-15
‘Masonry mat.’ means masonry material; ‘c’board’ means cardboard; ‘Hazwaste’ means hazardous waste; ‘En recovery’ means energy recovery. The stated percentages are the resource recovery rates = (energy recovery + recycling) / generation.
Masonry material
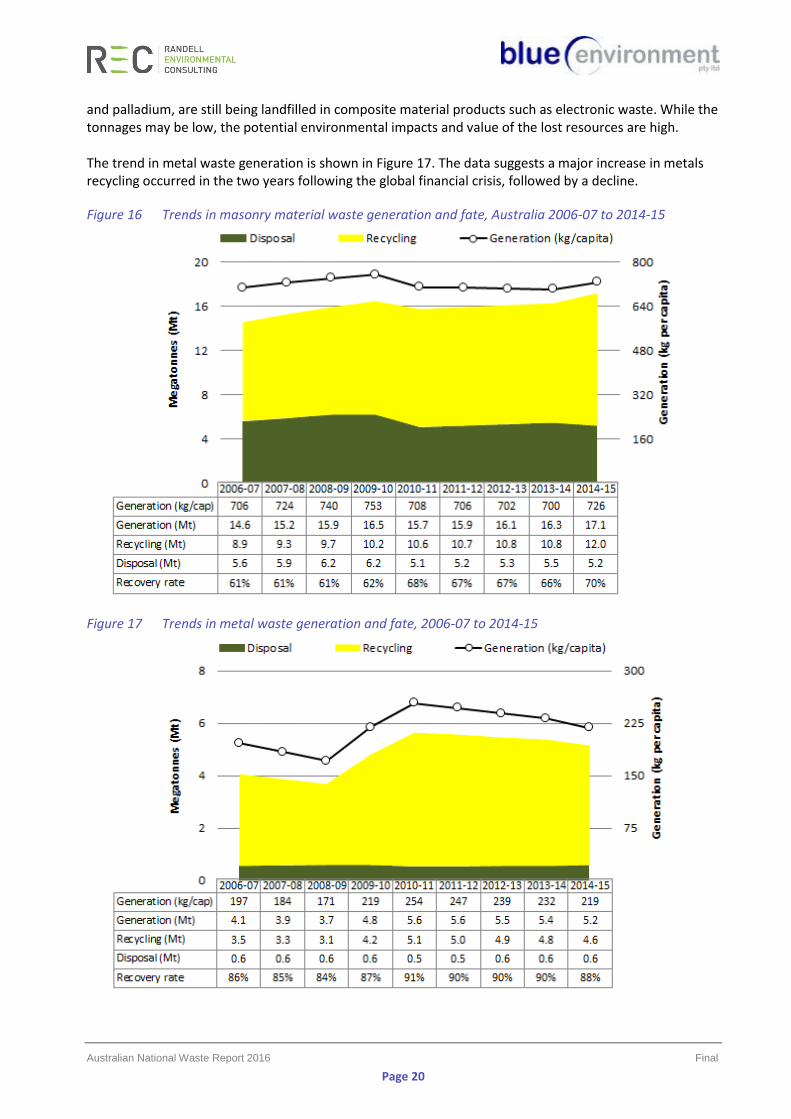
About 17.2 Mt, or 726 kg per capita, of waste masonry materials was generated, 70% of which was recycled. This category includes ‘heavy’ waste types such as concrete, bricks and rubble. Masonry is less well recovered from mixed loads of demolition waste, typically from smaller projects, which can contain substantial amounts of rubble and plasterboard and are sent directly to landfill. Figure 16 shows the trend in masonry waste generation and fate from 2006-07 to 2014-15. Waste generation increased from about 15 to 17 Mt, representing a marginal increase per capita from 706 to 726 kg. The quantity of masonry waste landfilled dropped from about 5.6 to 5.2 Mt while recycling grew strongly from 8.9 to 12 Mt.
Metals
In 2014-15 about 5.2 Mt, or 219 kg per capita, of metal waste was generated. The recovery rate of 88% was higher than any other material category. Metal recycling is well-established in every state and territory but has suffered from unstable global prices. This put the metals recycling industry, which depends on export markets, under significant financial pressure. At the time of writing prices are recovering. Some toxic metals, such as cadmium and cobalt, and rare and precious metals, such as gold
Australian National Waste Report 2016 Final
Page 20
and palladium, are still being landfilled in composite material products such as electronic waste. While the tonnages may be low, the potential environmental impacts and value of the lost resources are high. The trend in metal waste generation is shown in Figure 17. The data suggests a major increase in metals recycling occurred in the two years following the global financial crisis, followed by a decline.
Figure 16 Trends in masonry material waste generation and fate, Australia 2006-07 to 2014-15
Figure 17 Trends in metal waste generation and fate, 2006-07 to 2014-15
Australian National Waste Report 2016 Final
Page 21
Organics
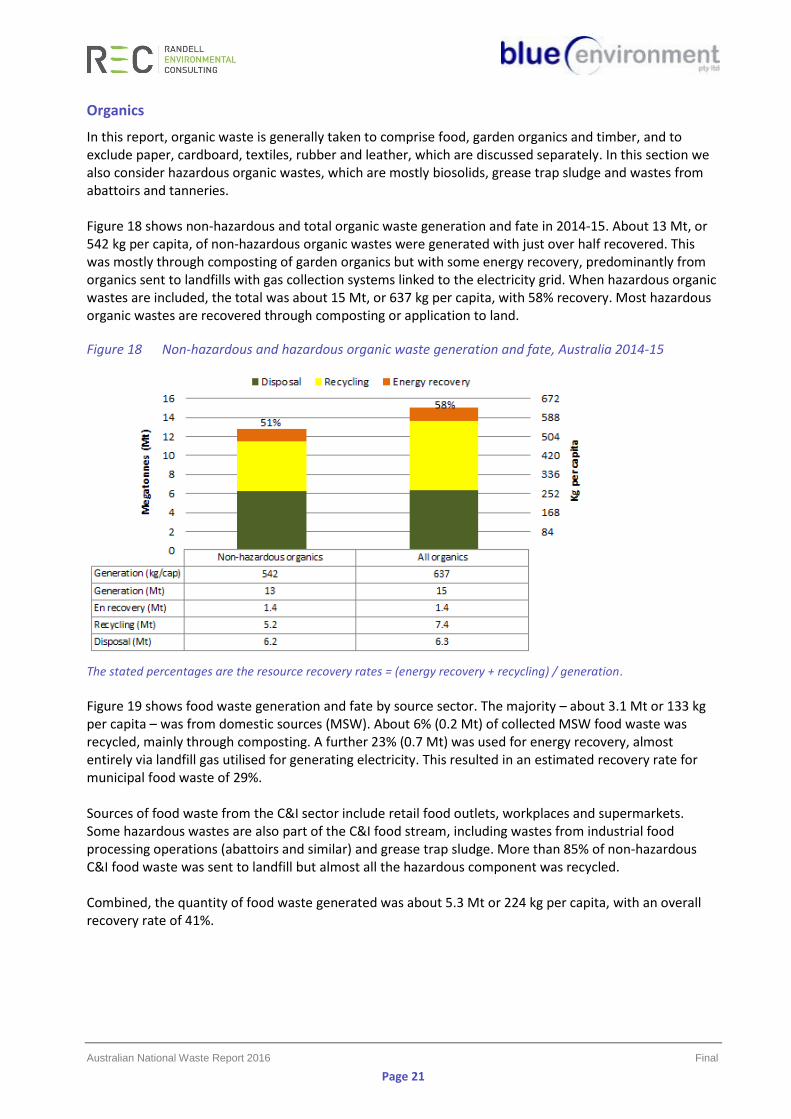
In this report, organic waste is generally taken to comprise food, garden organics and timber, and to exclude paper, cardboard, textiles, rubber and leather, which are discussed separately. In this section we also consider hazardous organic wastes, which are mostly biosolids, grease trap sludge and wastes from abattoirs and tanneries. Figure 18 shows non-hazardous and total organic waste generation and fate in 2014-15. About 13 Mt, or 542 kg per capita, of non-hazardous organic wastes were generated with just over half recovered. This was mostly through composting of garden organics but with some energy recovery, predominantly from organics sent to landfills with gas collection systems linked to the electricity grid. When hazardous organic wastes are included, the total was about 15 Mt, or 637 kg per capita, with 58% recovery. Most hazardous organic wastes are recovered through composting or application to land.
Figure 18 Non-hazardous and hazardous organic waste generation and fate, Australia 2014-15
The stated percentages are the resource recovery rates = (energy recovery + recycling) / generation.
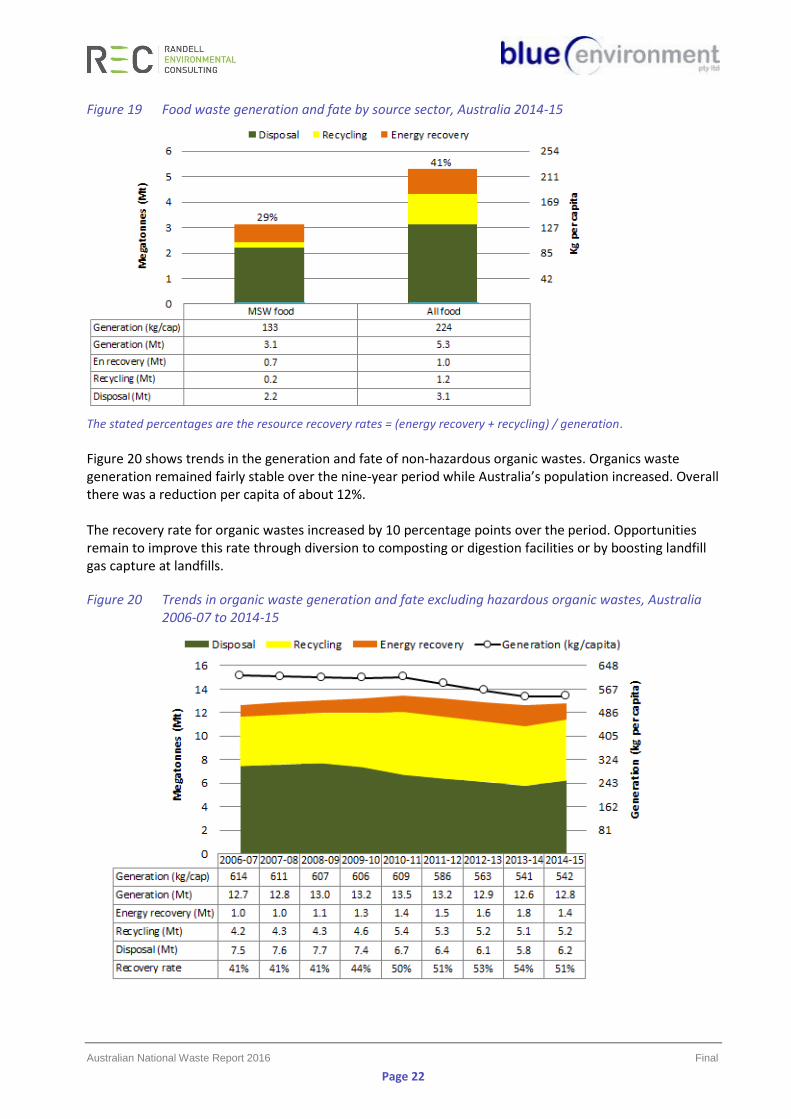
Figure 19 shows food waste generation and fate by source sector. The majority – about 3.1 Mt or 133 kg per capita – was from domestic sources (MSW). About 6% (0.2 Mt) of collected MSW food waste was recycled, mainly through composting. A further 23% (0.7 Mt) was used for energy recovery, almost entirely via landfill gas utilised for generating electricity. This resulted in an estimated recovery rate for municipal food waste of 29%. Sources of food waste from the C&I sector include retail food outlets, workplaces and supermarkets. Some hazardous wastes are also part of the C&I food stream, including wastes from industrial food processing operations (abattoirs and similar) and grease trap sludge. More than 85% of non-hazardous C&I food waste was sent to landfill but almost all the hazardous component was recycled. Combined, the quantity of food waste generated was about 5.3 Mt or 224 kg per capita, with an overall recovery rate of 41%.
Australian National Waste Report 2016 Final
Page 22
Figure 19 Food waste generation and fate by source sector, Australia 2014-15
The stated percentages are the resource recovery rates = (energy recovery + recycling) / generation.
Figure 20 shows trends in the generation and fate of non-hazardous organic wastes. Organics waste generation remained fairly stable over the nine-year period while Australia’s population increased. Overall there was a reduction per capita of about 12%. The recovery rate for organic wastes increased by 10 percentage points over the period. Opportunities remain to improve this rate through diversion to composting or digestion facilities or by boosting landfill gas capture at landfills.
Figure 20 Trends in organic waste generation and fate excluding hazardous organic wastes, Australia 2006-07 to 2014-15
Australian National Waste Report 2016 Final
Page 23
Paper and cardboard
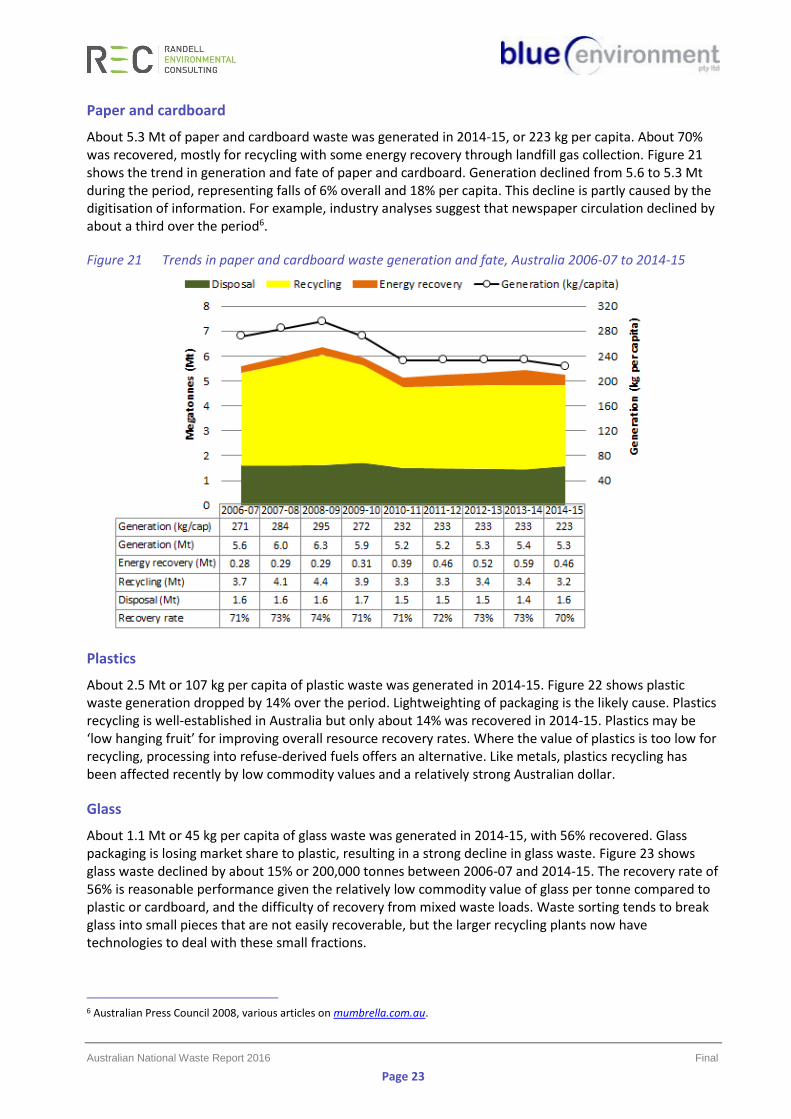
About 5.3 Mt of paper and cardboard waste was generated in 2014-15, or 223 kg per capita. About 70% was recovered, mostly for recycling with some energy recovery through landfill gas collection. Figure 21 shows the trend in generation and fate of paper and cardboard. Generation declined from 5.6 to 5.3 Mt during the period, representing falls of 6% overall and 18% per capita. This decline is partly caused by the digitisation of information. For example, industry analyses suggest that newspaper circulation declined by about a third over the period6.
Figure 21 Trends in paper and cardboard waste generation and fate, Australia 2006-07 to 2014-15
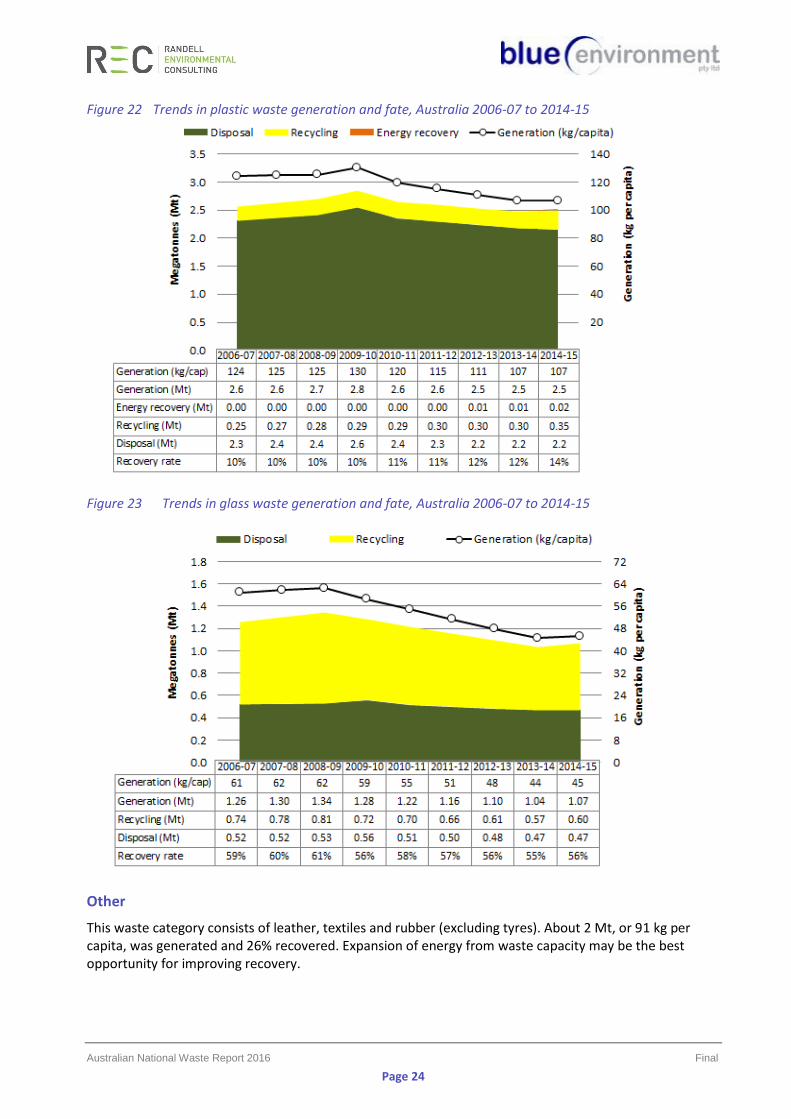
Plastics
About 2.5 Mt or 107 kg per capita of plastic waste was generated in 2014-15. Figure 22 shows plastic waste generation dropped by 14% over the period. Lightweighting of packaging is the likely cause. Plastics recycling is well-established in Australia but only about 14% was recovered in 2014-15. Plastics may be ‘low hanging fruit’ for improving overall resource recovery rates. Where the value of plastics is too low for recycling, processing into refuse-derived fuels offers an alternative. Like metals, plastics recycling has been affected recently by low commodity values and a relatively strong Australian dollar.
Glass
About 1.1 Mt or 45 kg per capita of glass waste was generated in 2014-15, with 56% recovered. Glass packaging is losing market share to plastic, resulting in a strong decline in glass waste. Figure 23 shows glass waste declined by about 15% or 200,000 tonnes between 2006-07 and 2014-15. The recovery rate of 56% is reasonable performance given the relatively low commodity value of glass per tonne compared to plastic or cardboard, and the difficulty of recovery from mixed waste loads. Waste sorting tends to break glass into small pieces that are not easily recoverable, but the larger recycling plants now have technologies to deal with these small fractions.
6 Australian Press Council 2008, various articles on mumbrella.com.au.
Australian National Waste Report 2016 Final
Page 24
Figure 22 Trends in plastic waste generation and fate, Australia 2006-07 to 2014-15
Figure 23 Trends in glass waste generation and fate, Australia 2006-07 to 2014-15
Other
This waste category consists of leather, textiles and rubber (excluding tyres). About 2 Mt, or 91 kg per capita, was generated and 26% recovered. Expansion of energy from waste capacity may be the best opportunity for improving recovery.
Australian National Waste Report 2016 Final
Page 25
Hazardous waste
Hazardous waste comprised 7 Mt, or 298 kg per capita, of waste and 55% was recovered. The bulk of this category comprised contaminated soils, biosolids7, asbestos and tyres8. Treatment options are available to remove the hazards from some contaminated soils and biosolids enabling reuse or recycling. Waste tyres have potential value as fuel or as an input to production processes and there remains a significant opportunity to increase their recovery in Australia.
Fly ash
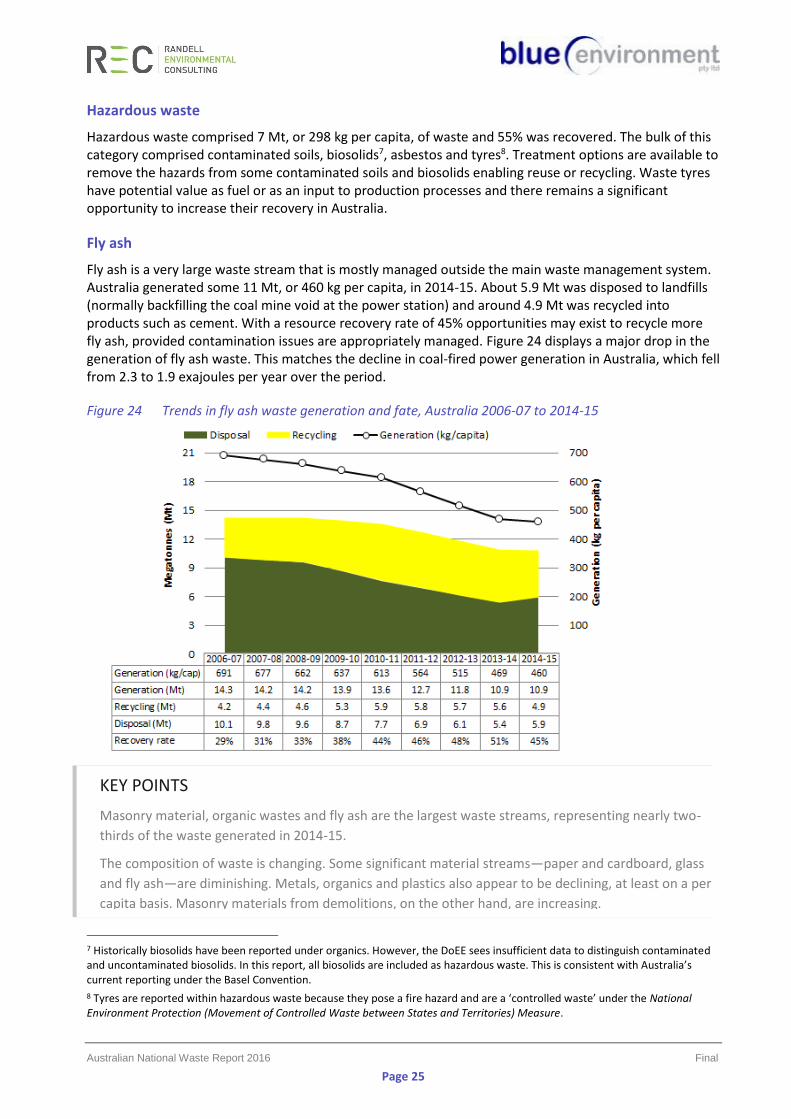
Fly ash is a very large waste stream that is mostly managed outside the main waste management system. Australia generated some 11 Mt, or 460 kg per capita, in 2014-15. About 5.9 Mt was disposed to landfills (normally backfilling the coal mine void at the power station) and around 4.9 Mt was recycled into products such as cement. With a resource recovery rate of 45% opportunities may exist to recycle more fly ash, provided contamination issues are appropriately managed. Figure 24 displays a major drop in the generation of fly ash waste. This matches the decline in coal-fired power generation in Australia, which fell from 2.3 to 1.9 exajoules per year over the period.
Figure 24 Trends in fly ash waste generation and fate, Australia 2006-07 to 2014-15
7 Historically biosolids have been reported under organics. However, the DoEE sees insufficient data to distinguish contaminated and uncontaminated biosolids. In this report, all biosolids are included as hazardous waste. This is consistent with Australia’s current reporting under the Basel Convention.
8 Tyres are reported within hazardous waste because they pose a fire hazard and are a ‘controlled waste’ under the National Environment Protection (Movement of Controlled Waste between States and Territories) Measure.
KEY POINTS
Masonry material, organic wastes and fly ash are the largest waste streams, representing nearly two-
thirds of the waste generated in 2014-15.
The composition of waste is changing. Some significant material streams—paper and cardboard, glass
and fly ash—are diminishing. Metals, organics and plastics also appear to be declining, at least on a per
capita basis. Masonry materials from demolitions, on the other hand, are increasing.
Australian National Waste Report 2016 Final
Page 26
4. International comparisons
4.1 Waste generation and fate
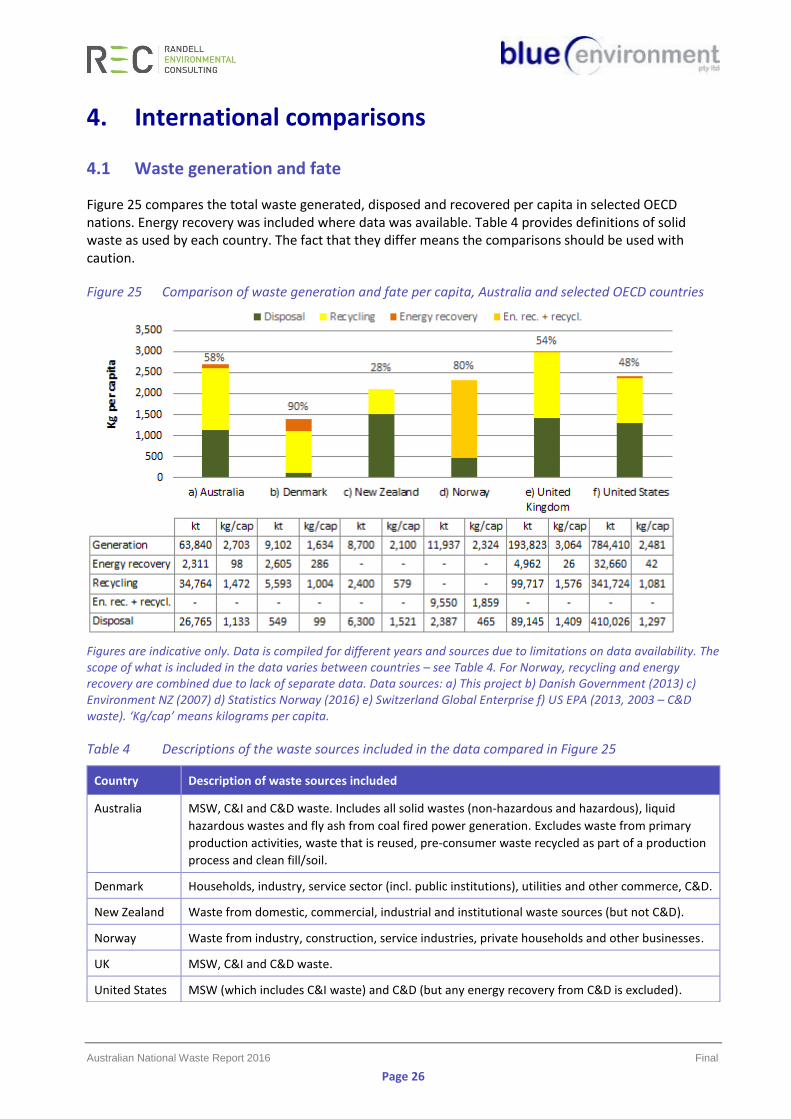
Figure 25 compares the total waste generated, disposed and recovered per capita in selected OECD nations. Energy recovery was included where data was available. Table 4 provides definitions of solid waste as used by each country. The fact that they differ means the comparisons should be used with caution.
Figure 25 Comparison of waste generation and fate per capita, Australia and selected OECD countries
Figures are indicative only. Data is compiled for different years and sources due to limitations on data availability. The scope of what is included in the data varies between countries – see Table 4. For Norway, recycling and energy recovery are combined due to lack of separate data. Data sources: a) This project b) Danish Government (2013) c) Environment NZ (2007) d) Statistics Norway (2016) e) Switzerland Global Enterprise f) US EPA (2013, 2003 – C&D waste). ‘Kg/cap’ means kilograms per capita.
Table 4 Descriptions of the waste sources included in the data compared in Figure 25
Country Description of waste sources included
Australia MSW, C&I and C&D waste. Includes all solid wastes (non-hazardous and hazardous), liquid
hazardous wastes and fly ash from coal fired power generation. Excludes waste from primary
production activities, waste that is reused, pre-consumer waste recycled as part of a production
process and clean fill/soil.
Denmark Households, industry, service sector (incl. public institutions), utilities and other commerce, C&D.
New Zealand Waste from domestic, commercial, industrial and institutional waste sources (but not C&D).
Norway Waste from industry, construction, service industries, private households and other businesses.
UK MSW, C&I and C&D waste.
United States MSW (which includes C&I waste) and C&D (but any energy recovery from C&D is excluded).
Australian National Waste Report 2016 Final
Page 27
4.2 Municipal waste generation and fate
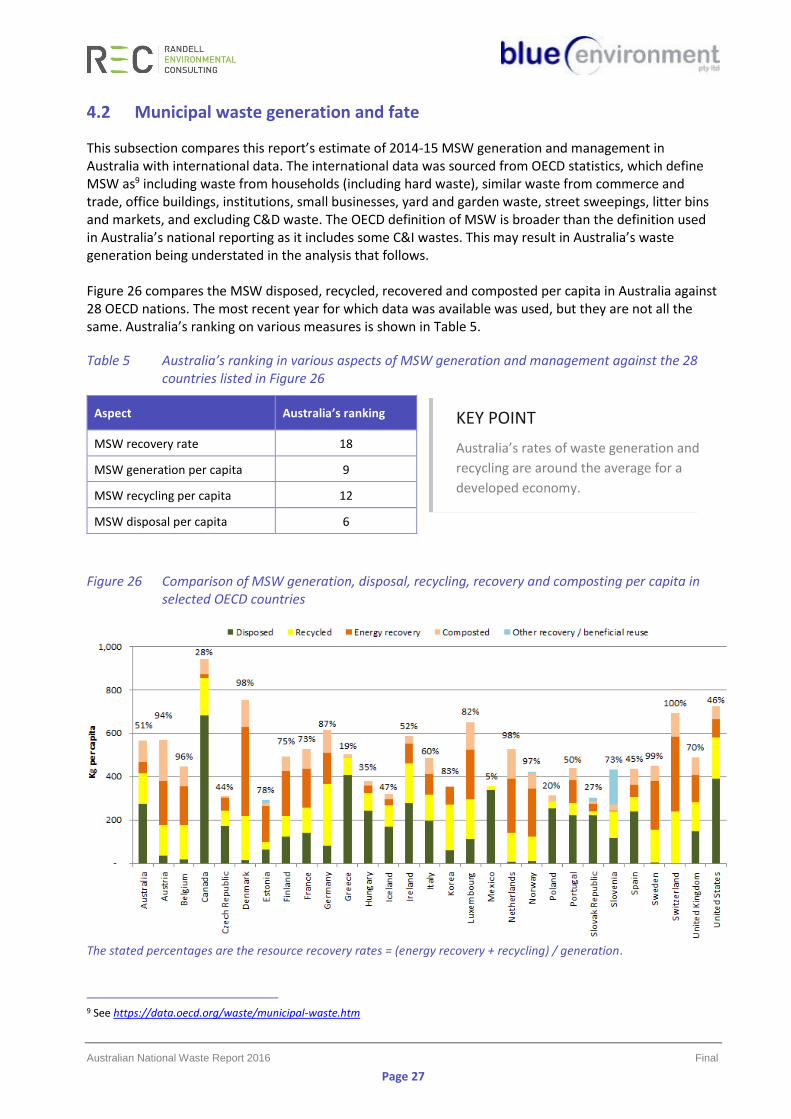
This subsection compares this report’s estimate of 2014-15 MSW generation and management in Australia with international data. The international data was sourced from OECD statistics, which define MSW as9 including waste from households (including hard waste), similar waste from commerce and trade, office buildings, institutions, small businesses, yard and garden waste, street sweepings, litter bins and markets, and excluding C&D waste. The OECD definition of MSW is broader than the definition used in Australia’s national reporting as it includes some C&I wastes. This may result in Australia’s waste generation being understated in the analysis that follows. Figure 26 compares the MSW disposed, recycled, recovered and composted per capita in Australia against 28 OECD nations. The most recent year for which data was available was used, but they are not all the same. Australia’s ranking on various measures is shown in Table 5.
Table 5 Australia’s ranking in various aspects of MSW generation and management against the 28 countries listed in Figure 26
Figure 26 Comparison of MSW generation, disposal, recycling, recovery and composting per capita in selected OECD countries
The stated percentages are the resource recovery rates = (energy recovery + recycling) / generation.
9 See https://data.oecd.org/waste/municipal-waste.htm
Aspect Australia’s ranking
MSW recovery rate 18
MSW generation per capita 9
MSW recycling per capita 12
MSW disposal per capita 6
KEY POINT
Australia’s rates of waste generation and
recycling are around the average for a
developed economy.
Australian National Waste Report 2016 Final
Page 28
5. Industry perspectives
Four peak associations representing the solid waste sector or elements of it were invited to provide their perspective in this National Waste Report. The associations were the Australian Council of Recycling (ACOR), Australian Landfill Owners Association (ALOA), Australian Organics Recycling Association (AORA) and the Waste Management Association of Australia (WMAA). Each of these organisations was asked to provide their perspective on the status of waste management, the challenges and opportunities facing the industry and where the industry should aim to be in 10 years.
Status of waste management Australia is one of the richest countries in the world yet we are losing the recycling race, ranked 17th among OECD nations. Australia’s waste generation has increased significantly by 23% between 2006-07 and 2014-
15. Australians are also generating more waste at 2.2 tonnes of waste per person per year. Waste is Australia’s most rapidly increasing environmental and economic metric, according to the ABS (2016). Challenges The recycling and resource recovery industry is being undermined by bad landfill levy design at the state level, with the technologically and commercially unavoidable residues from recycling subject to the landfill levy and, at the time of writing, one mainland state without a landfill levy. Levy alignment led by the Commonwealth would stop perverse outcomes such as interstate waste trafficking. In addition, waste levy revenue should be confined to waste management and resource recovery initiatives and illegal dumping, not propping up state budgets. While extended producer responsibility (EPR) is typically mandatory in many other OECD countries for problematic wastes, Australia is still behind with the only non-voluntary scheme being a co-regulatory National TV and Computer Recycling Scheme with a mere 50% target at the time of writing. Government procurement policies typically focus on lowest cost, with purchasing of recycled materials not mandated. Opportunities Given our advanced technology and economic development, there are great opportunities for the sector. Standardisation across states and territories, enhanced product stewardship and EPR schemes as well as better waste education to the public, are some examples of the opportunities facing the sector. Within 10 years, Australia should have a mandatory national product stewardship scheme for tyres, batteries and fluorescent lights and no e-waste should go to landfill. By 2026 Ten years from now, Australia should be aiming for world leading recycling rates and a vibrant and innovative reprocessing sector, delivering not only an essential service to the community, but also: reducing greenhouse gas emissions; reducing the amount of waste sent to landfills; conserving natural resources such as timber, water, and minerals; preventing pollution by reducing the need to collect new raw materials; saving energy; sustaining the environment for future generations; and creating new and innovative high technology jobs in the recycling and re-manufacturing industries. This report is a valuable resource that will assist us on an evidence-based path to a more viable, profitable and sustainable industry delivering benefits to the entire community.
Plastics baled for recycling
Australian National Waste Report 2016 Final
Page 29
Status of waste management In general terms, Australia’s waste management industry meets international best practice and provides a sustainable balance between meeting resource recovery expectations and keeping costs at affordable levels. The industry is committed to improving employee safety, enhancing environmental protection and minimising climate change impacts.
Challenges The waste industry currently recycles around half of the waste generated in Australia. The remainder – residuals from recycling and mixed putrescible wastes – is landfilled. Each of these activities has its challenges:
• Recycling – The recycling industry comprises three segments construction materials; organics; and discarded packaging. Notwithstanding recent advances in processing technology across the three segments, growth continues to be hindered by the availability of secure markets for the various products produced.
• Landfill – Major landfill practices have improved significantly over the past twenty years and now are at world's best practice. This is evidenced by most sites embracing composite liners, leachate extraction and disposal capability, landfill gas combustion and responsible long term rehabilitation and after use. Unfortunately, many smaller regional landfills are not at this standard and more needs to be done to close the poorer quality sites and provide local waste transfer facilities.
Other challenges facing landfills include the permitting of replacement facilities and managing the receipt of recoverable materials such as e-waste and tyres. Opportunities As concern over climate change continues to influence environmental policy, the waste industry is well positioned to contribute to emission reduction by diverting organics from landfills for processing. This initiative has commenced in some city markets but has considerable scope for expansion. Diverting organics from landfill has a double benefit – reduced landfill gas emissions and sequestered soil carbon contributing to improved farm production. Other opportunities are also now becoming available from the use of mechanised waste sorting technology that allows acceptance of organic wastes with higher levels of contamination without compromising product quality. By 2026 The waste industry has seen much change over the past 20 years and this trend will continue for the next 10. Many of these changes will be driven as new harmonisation programs lift the service levels in regional levels. Further, it is expected that energy from waste will begin to be introduced over the next decade.
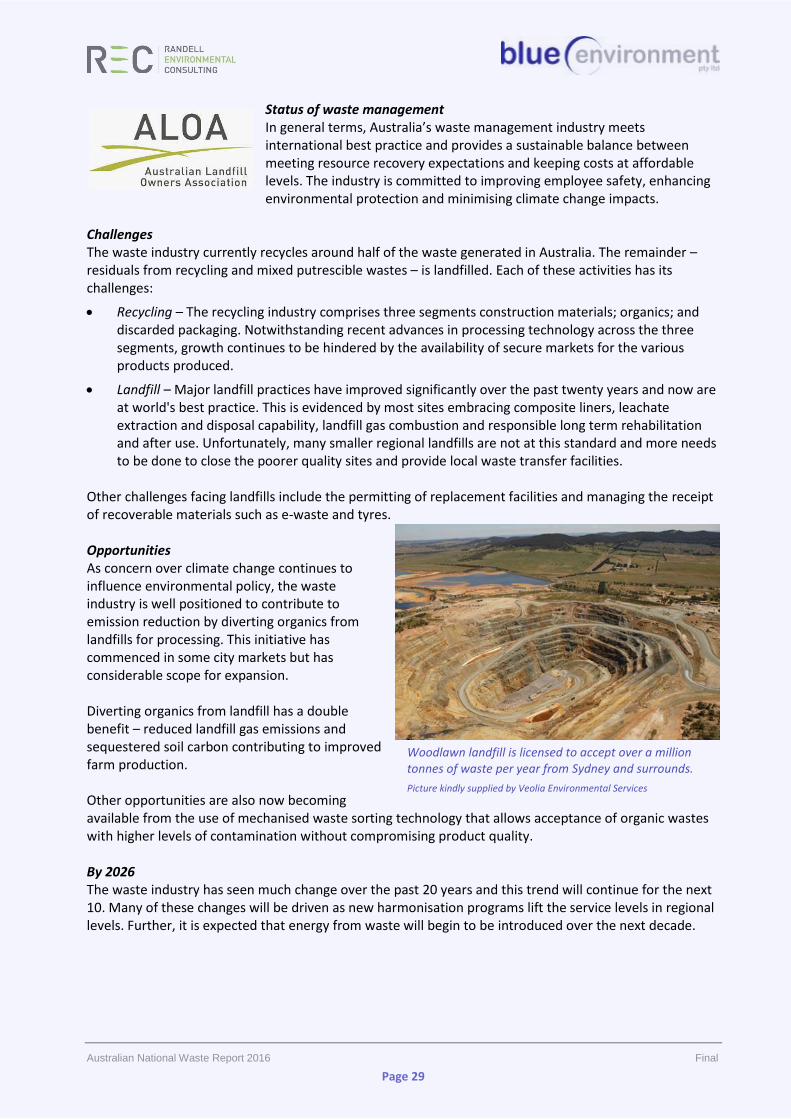
Woodlawn landfill is licensed to accept over a million tonnes of waste per year from Sydney and surrounds.
Picture kindly supplied by Veolia Environmental Services
Australian National Waste Report 2016 Final
Page 30
Status of waste management The Australian Organics Recycling Association (AORA) is leading the drive towards a circular economy for surplus organic material. Substantial economic and environmental benefits will result from a cultural change to society’s ingrained practice of burying our surplus organic material in landfills. Changing attitudes will require campaigns that channel the seatbelt use, stop smoking and sun protection campaigns of the past to
encourage source separation of this valuable resource for recovery/beneficial reuse. This is a medium-term activity with the aim that future generations consider it entirely normal. Challenges Suitable locations are needed for processing this important and beneficial resource. Facilities must be located with consideration to end user markets to reduce freight costs to end users. The capital investment required to establish these facilities requires early support to deliver long term benefits. Material should be categorised and directed to its most suitable reuse process; either sustainable power generation or manufacture of compost and other soil amendments. Opportunities The key to delivering change is the establishment of sustainable demand for finished products. Agriculture is the primary target. Prior to the development of synthetic fertiliser, manure and compost were the primary soil fertility products. While synthetic fertilisers have delivered extraordinary growth in yields and profits, those gains are now plateauing and the re-emergence of the two soil fertility products looks inevitable. In many cases the loss of soil fertility can be attributed to a reduction in soil organic matter through ‘conventional’ farming methods. It is here that the greatest opportunities lie to improve soil health and vitality, leading to increased yields and profits. This link is not in dispute. Improvements to soil health deliver:
• more efficient nutrient cycling resulting in lower fertiliser requirements
• increased water holding capacity, which buffers against unreliable rainfall
• reduced pest infestations. Farmer education on soil health is critical to establishing sustainable demand for recycled organic products. Where this has been undertaken, the results have been profound. Demand is quickly established and grows as awareness spreads through demonstration of the benefits available. Farmers literally see the opportunity. By 2026 Industry cannot achieve the desired outcomes alone. The need for support from all levels of government to deliver this change is clear. Equally, each level of government stands to benefit. The challenge is complicated by the involvement of many portfolios with no obvious leader; environment, agriculture, power generation, industry and infrastructure. The industry needs a long term champion and the industry is advocating for a longer term fully national and consistent organics recycling industry report. This will ensure we can benchmark our performance and more effectively spread best practice across the country, especially in relation to government policy.
Compost windrows and turner Photo by Christine Wardle
Australian National Waste Report 2016 Final
Page 31
Status of waste management In 2016 Australia continues to provide environmentally responsible and effective waste management systems around almost all of the country. In many areas, we are achieving best
practice approaches in how material is gathered and handled to reduce inefficient use of resources and increase the diversion of waste from landfill. Significant investment is occurring in many states developing infrastructure that supports the ethos that waste is a resource and something to be harnessed rather than discarded. This comes at a time when household, construction, and commercial waste volumes continue to increase despite significant economic challenges. Challenges Australian waste management providers must adapt to the ever-changing regulatory frameworks for waste and resource recovery, which will further emphasise increased diversion from landfill and increased levels of resource recovery, as the industry moves from a linear to a circular model in waste and resource management. Tied into this is the changing commercial and industrial economic base (and its resultant material waste streams) upon which traditional resource recovery and waste management systems have been based. This then drives the continued need for investment in resource recovery and waste management infrastructure, covering both the upgrade of existing facilities and the development of new ones. Opportunities Government policy and community expectations are significant drivers within the waste management sector, balanced by the cost of delivering such services. An increased emphasis on recovery and recycling, complemented by traditional, environmentally responsible waste management methods, can fuel jobs growth in a number of sectors and lead to improved operations for many waste management providers. Another significant opportunity is the potential to use technological improvements to drive efficiencies within business and deliver a better product for customers. In addition to those already in the marketplace (for example collections routing systems, use of GPS and so on), it is those that are yet to be developed that will continue to provide competitive advantage for players in the waste management sector. By 2026 The waste industry must position itself as an essential service which is integral to the lives of all Australians, one that underpins economic growth and employment, which links to our quality of life, and plays a significant role in environmental and public health, planning and infrastructure, resource and energy production, and emergency management. In addition to this, the waste management sector should play an important part in forming part of environmentally and economically sustainable development philosophy that helps drive the Australian economy forward.

Australian National Waste Report 2016 Final
Page 32
6. Current and emerging challenges
Waste management is a dynamic industry, always changing in response to community demand, government policy and technological and market development. This section reviews some of the challenges currently faced by the waste sector or likely to emerge in the near future. References are provided for key studies and information sources.
National harmonisation of waste policy
Waste has traditionally been managed locally, and most waste policy and regulation is developed by states and territories. Increasingly, however, waste is moving across borders and national industries are facing waste management issues in multiple jurisdictions. With support from the states and territories, the Australian Government is spearheading efforts to harmonise policy and regulation to ensure rational and efficient management, particularly in the hazardous waste area. Consistent national data and reporting is part of this effort.
Product stewardship
Product stewardship is one area where national leadership is required. Product stewardship agreements10 can reduce waste and improve its management through sharing responsibility, including with manufacturers. Sometimes a levy on initial purchases is used to fund the changes needed. Product stewardship arrangements are in place for petroleum-based oils, packaging, tyres, televisions and computers, mobile phones and mercury-containing lamps. The Australian Government has proposed a number of other products for a stewardship arrangement, including plastic microbeads and products containing them, photovoltaic systems, electrical and electronic products and plastic oil containers.
Container deposit schemes
A current area of policy development is container deposit scheme (CDS). A CDS has been in place in SA since the 1970s but until recently all other states and territories, supported by the packaging and beverage industries, preferred to focus on local government collection systems. A CDS was established in NT in 2013 and will commence in NSW in 2017 and Qld and WA in 2018. Environmental groups have long advocated for CDS and see this as a victory that will reduce litter and improve recovery.
The circular economy
A concept gaining currency in waste policy is the ‘circular economy’11, which envisages keeping products, components, and materials at their highest utility and value at all times. This contrasts with the ‘take, make and dispose’ economic model, which relies on plentiful, cheap and easily accessible materials and energy. Several states and territories are examining the value of the concept within their policy frameworks.
Prevention of recycling failures
Several states are responding to a recurrent problem in which recycling operators accumulate large volumes of material they fail to recycle, which then become a liability for the community and the state. Significant stockpiles of tyres, demolition rubble and timber have been abandoned, inadequately managed or have burned in recent years. NSW has amended its waste levy system to reduce the financial incentive for this behaviour. Vic is now proposing to license some recycling facilities and recently amended regulations to require an EPA licence to store more than 40 tonnes of end-of-life tyres.
10 See https://www.environment.gov.au/protection/national-waste-policy/product-stewardship.
11 See https://www.ellenmacarthurfoundation.org/circular-economy.
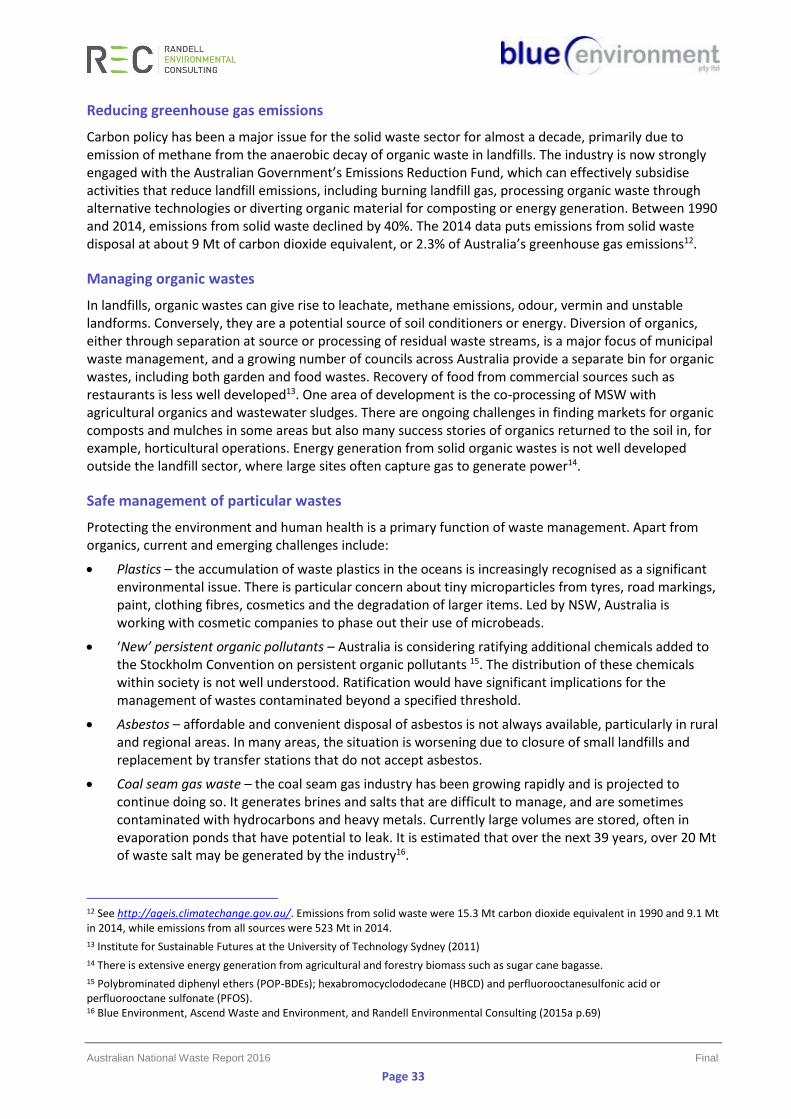
Australian National Waste Report 2016 Final
Page 33
Reducing greenhouse gas emissions
Carbon policy has been a major issue for the solid waste sector for almost a decade, primarily due to emission of methane from the anaerobic decay of organic waste in landfills. The industry is now strongly engaged with the Australian Government’s Emissions Reduction Fund, which can effectively subsidise activities that reduce landfill emissions, including burning landfill gas, processing organic waste through alternative technologies or diverting organic material for composting or energy generation. Between 1990 and 2014, emissions from solid waste declined by 40%. The 2014 data puts emissions from solid waste disposal at about 9 Mt of carbon dioxide equivalent, or 2.3% of Australia’s greenhouse gas emissions12.
Managing organic wastes
In landfills, organic wastes can give rise to leachate, methane emissions, odour, vermin and unstable landforms. Conversely, they are a potential source of soil conditioners or energy. Diversion of organics, either through separation at source or processing of residual waste streams, is a major focus of municipal waste management, and a growing number of councils across Australia provide a separate bin for organic wastes, including both garden and food wastes. Recovery of food from commercial sources such as restaurants is less well developed13. One area of development is the co-processing of MSW with agricultural organics and wastewater sludges. There are ongoing challenges in finding markets for organic composts and mulches in some areas but also many success stories of organics returned to the soil in, for example, horticultural operations. Energy generation from solid organic wastes is not well developed outside the landfill sector, where large sites often capture gas to generate power14.
Safe management of particular wastes
Protecting the environment and human health is a primary function of waste management. Apart from organics, current and emerging challenges include:
• Plastics – the accumulation of waste plastics in the oceans is increasingly recognised as a significant environmental issue. There is particular concern about tiny microparticles from tyres, road markings, paint, clothing fibres, cosmetics and the degradation of larger items. Led by NSW, Australia is working with cosmetic companies to phase out their use of microbeads.
• ‘New’ persistent organic pollutants – Australia is considering ratifying additional chemicals added to the Stockholm Convention on persistent organic pollutants 15. The distribution of these chemicals within society is not well understood. Ratification would have significant implications for the management of wastes contaminated beyond a specified threshold.
• Asbestos – affordable and convenient disposal of asbestos is not always available, particularly in rural and regional areas. In many areas, the situation is worsening due to closure of small landfills and replacement by transfer stations that do not accept asbestos.
• Coal seam gas waste – the coal seam gas industry has been growing rapidly and is projected to continue doing so. It generates brines and salts that are difficult to manage, and are sometimes contaminated with hydrocarbons and heavy metals. Currently large volumes are stored, often in evaporation ponds that have potential to leak. It is estimated that over the next 39 years, over 20 Mt of waste salt may be generated by the industry16.
12 See http://ageis.climatechange.gov.au/. Emissions from solid waste were 15.3 Mt carbon dioxide equivalent in 1990 and 9.1 Mt in 2014, while emissions from all sources were 523 Mt in 2014.
13 Institute for Sustainable Futures at the University of Technology Sydney (2011)
14 There is extensive energy generation from agricultural and forestry biomass such as sugar cane bagasse.
15 Polybrominated diphenyl ethers (POP-BDEs); hexabromocyclododecane (HBCD) and perfluorooctanesulfonic acid or perfluorooctane sulfonate (PFOS). 16 Blue Environment, Ascend Waste and Environment, and Randell Environmental Consulting (2015a p.69)
Australian National Waste Report 2016 Final
Page 34
• Electronic waste – some types of electronic equipment contain heavy metals and other toxic substances. So-called ‘e-waste’ can also have resource value, particularly in metals recovery. Diversion of the rapidly growing17 e-waste stream to recycling is a significant issue in Australia and throughout the world. A product stewardship program for TVs and computers is expanding its reach, and a ban on disposing of some e-wastes to landfill is in place in SA and under development in Vic.
• Hazardous waste stockpiles – there are many examples in Australia of stockpiles of hazardous waste that have not been safely processed due to cost or lack of local capacity. Examples include: 15,000 tonnes of hexachlorobenzine at Orica in Sydney; 700,000 tonnes of spent pot liner from the aluminium industry at sites in Tas, NSW, Vic and Qld; various Department of Defence sites contaminated with asbestos; and several megatonnes of metals-contaminated biosolids at Vic’s Western Treatment Plant. Where waste has not moved from the site where it was generated it may be poorly regulated and controlled. There is a need for authorities to encourage or require stockpile owners to send their wastes for safe storage, destruction or processing.
Waste technologies
In comparison with many countries, particularly in western Europe, Australia continues to rely on relatively basic waste technologies. Some 95% of our residual wastes are sent to landfill, most composting occurs in open windrow systems and most hazardous wastes are treated using relatively simple processes. Energy from waste is not well developed, either through thermal methods such as incineration or through anaerobic digestion of organics. Some processing of residual wastes is occurring in Sydney and Perth where landfill capacity is more constrained. Facilities such as the Global Renewables UR-3R plant accept mixed municipal waste and are able to recover recyclables and process the residuals into an organic soil conditioner. In general, such facilities are financially competitive with landfill only where there is a shortage of local landfill capacity or a large levy applies on disposal of waste to landfill. There are ongoing efforts to boost the sophistication of waste technologies in Australia, but these are inevitably weighed against cost increases.
Infrastructure planning
Australian states and territories have been developing and renewing waste strategies for several decades, often setting targets for the recovery of particular materials or waste streams from landfill. Recently there has been a shift in several jurisdictions towards plans and strategies to ensure adequate infrastructure is provided for a growing waste stream, covering both disposal and recovery of waste. Infrastructure assessments have been completed or are in process by the ACT18, NSW, Qld, SA19, Vic20, WA21 and, in relation to hazardous waste, the Australian Government22.
17 Victorian modelling projects growth of Australian e-waste from 0.4 to 1 Mt between 2014 and 2035.
18 Hyder Consulting (2011)
19 ZWSA (2016)
20 SV (2015)
21 WA Waste Authority (2015)
22 Blue Environment, Ascend Waste and Environment, and Randell Environmental Consulting (2015b)
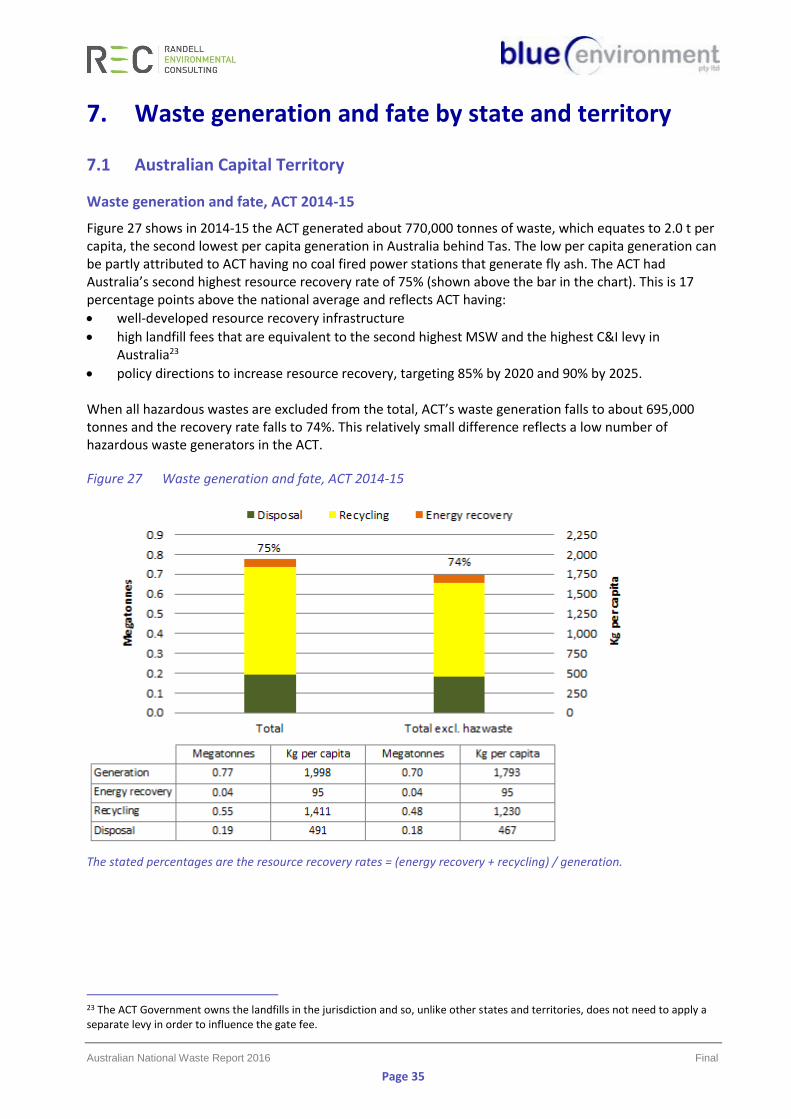
Australian National Waste Report 2016 Final
Page 35
7. Waste generation and fate by state and territory
7.1 Australian Capital Territory
Waste generation and fate, ACT 2014-15
Figure 27 shows in 2014-15 the ACT generated about 770,000 tonnes of waste, which equates to 2.0 t per capita, the second lowest per capita generation in Australia behind Tas. The low per capita generation can be partly attributed to ACT having no coal fired power stations that generate fly ash. The ACT had Australia’s second highest resource recovery rate of 75% (shown above the bar in the chart). This is 17 percentage points above the national average and reflects ACT having:
• well-developed resource recovery infrastructure
• high landfill fees that are equivalent to the second highest MSW and the highest C&I levy in Australia23
• policy directions to increase resource recovery, targeting 85% by 2020 and 90% by 2025. When all hazardous wastes are excluded from the total, ACT’s waste generation falls to about 695,000 tonnes and the recovery rate falls to 74%. This relatively small difference reflects a low number of hazardous waste generators in the ACT.
Figure 27 Waste generation and fate, ACT 2014-15
The stated percentages are the resource recovery rates = (energy recovery + recycling) / generation.
23 The ACT Government owns the landfills in the jurisdiction and so, unlike other states and territories, does not need to apply a separate levy in order to influence the gate fee.
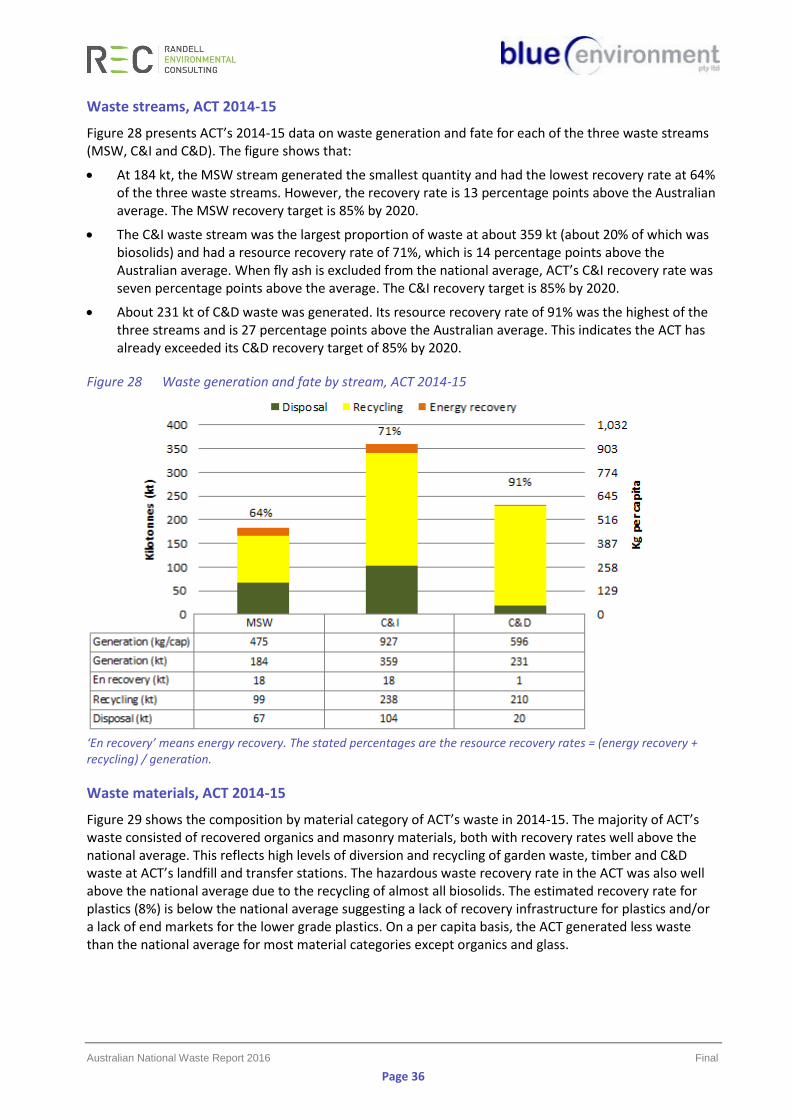
Australian National Waste Report 2016 Final
Page 36
Waste streams, ACT 2014-15
Figure 28 presents ACT’s 2014-15 data on waste generation and fate for each of the three waste streams (MSW, C&I and C&D). The figure shows that:
• At 184 kt, the MSW stream generated the smallest quantity and had the lowest recovery rate at 64% of the three waste streams. However, the recovery rate is 13 percentage points above the Australian average. The MSW recovery target is 85% by 2020.
• The C&I waste stream was the largest proportion of waste at about 359 kt (about 20% of which was biosolids) and had a resource recovery rate of 71%, which is 14 percentage points above the Australian average. When fly ash is excluded from the national average, ACT’s C&I recovery rate was seven percentage points above the average. The C&I recovery target is 85% by 2020.
• About 231 kt of C&D waste was generated. Its resource recovery rate of 91% was the highest of the three streams and is 27 percentage points above the Australian average. This indicates the ACT has already exceeded its C&D recovery target of 85% by 2020.
Figure 28 Waste generation and fate by stream, ACT 2014-15
‘En recovery’ means energy recovery. The stated percentages are the resource recovery rates = (energy recovery + recycling) / generation.
Waste materials, ACT 2014-15
Figure 29 shows the composition by material category of ACT’s waste in 2014-15. The majority of ACT’s waste consisted of recovered organics and masonry materials, both with recovery rates well above the national average. This reflects high levels of diversion and recycling of garden waste, timber and C&D waste at ACT’s landfill and transfer stations. The hazardous waste recovery rate in the ACT was also well above the national average due to the recycling of almost all biosolids. The estimated recovery rate for plastics (8%) is below the national average suggesting a lack of recovery infrastructure for plastics and/or a lack of end markets for the lower grade plastics. On a per capita basis, the ACT generated less waste than the national average for most material categories except organics and glass.
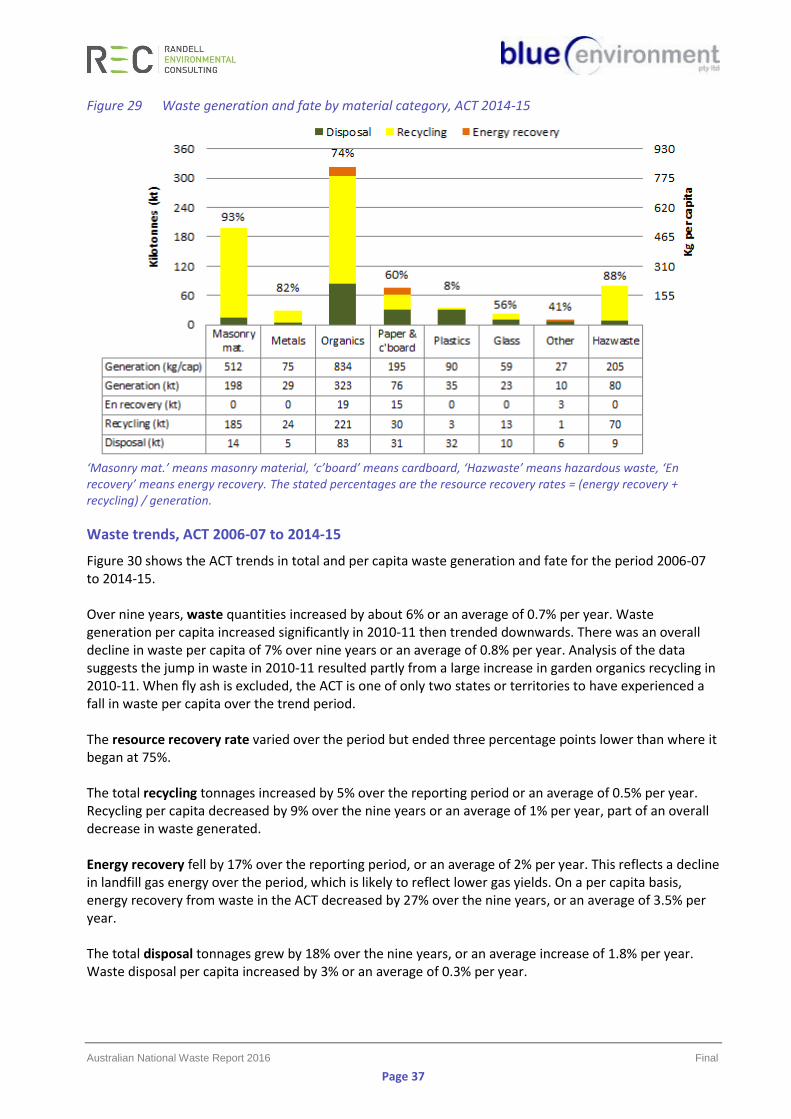
Australian National Waste Report 2016 Final
Page 37
Figure 29 Waste generation and fate by material category, ACT 2014-15
‘Masonry mat.’ means masonry material, ‘c’board’ means cardboard, ‘Hazwaste’ means hazardous waste, ‘En recovery’ means energy recovery. The stated percentages are the resource recovery rates = (energy recovery + recycling) / generation.
Waste trends, ACT 2006-07 to 2014-15
Figure 30 shows the ACT trends in total and per capita waste generation and fate for the period 2006-07 to 2014-15. Over nine years, waste quantities increased by about 6% or an average of 0.7% per year. Waste generation per capita increased significantly in 2010-11 then trended downwards. There was an overall decline in waste per capita of 7% over nine years or an average of 0.8% per year. Analysis of the data suggests the jump in waste in 2010-11 resulted partly from a large increase in garden organics recycling in 2010-11. When fly ash is excluded, the ACT is one of only two states or territories to have experienced a fall in waste per capita over the trend period. The resource recovery rate varied over the period but ended three percentage points lower than where it began at 75%. The total recycling tonnages increased by 5% over the reporting period or an average of 0.5% per year. Recycling per capita decreased by 9% over the nine years or an average of 1% per year, part of an overall decrease in waste generated. Energy recovery fell by 17% over the reporting period, or an average of 2% per year. This reflects a decline in landfill gas energy over the period, which is likely to reflect lower gas yields. On a per capita basis, energy recovery from waste in the ACT decreased by 27% over the nine years, or an average of 3.5% per year. The total disposal tonnages grew by 18% over the nine years, or an average increase of 1.8% per year. Waste disposal per capita increased by 3% or an average of 0.3% per year.

Australian National Waste Report 2016 Final
Page 38
Figure 30 Trends in waste generation and fate, ACT 2006-07 to 2014-15
Relies on interpolation for 2007-08, 2011-12 and 2012-13. ‘Av. AGR’ means average annual growth rate.
Australian National Waste Report 2016 Final
Page 39
ACT Government perspective
The ACT Waste Management Strategy 2011-2025 (the Strategy) sets the direction for management of waste in the ACT. Key education initiatives include the sustainable schools initiative (AuSSI ACT), the ACTSmart program and facilitating learning opportunities at the materials recovery facility/landfill and household recycling facilities. All of these initiatives contribute towards the Strategy’s goal of leading innovation to achieve full resource recovery and a carbon neutral waste sector. The waste data trends in the territory are partially impacted by factors such as waste leaving the Territory (for example, to Woodlawn landfill) and respondents choosing not to answer the annual recycling survey. The new Waste Management and Resource Recovery Act 2016 will require the waste industry to provide data, improving the Territory’s ability to better understand what happens to waste, to develop strategies to minimise waste and to encourage improved resource recovery. Major developments in waste management in the ACT are:
• The ACT Legislative Assembly passed new waste legislation in 2016.
• Waste figures are likely to increase in the coming years, specifically due to asbestos contaminated materials from ‘Mr Fluffy’ homes. Over 1,000 houses will be demolished and safely landfilled in the next three years.
• In early 2017, the ACT Government will undertake a formal market sounding to inform its future infrastructure needs. Industry will be encouraged to offer innovative solutions to improve ACT waste outcomes.
The Territory’s key waste management challenges include:
• Increasing amounts of waste due to growth in population, economic activity, income and consumption (ACT is among the highest income per capita areas in the country).
• Meeting the targets outlined in the Strategy, including boosting resource recovery to a target of 90% by 2025 (recovery rates have rested around 79%-80% for the last five years).
The Waste Feasibility Study will be released in mid 2017, and will inform key strategies.
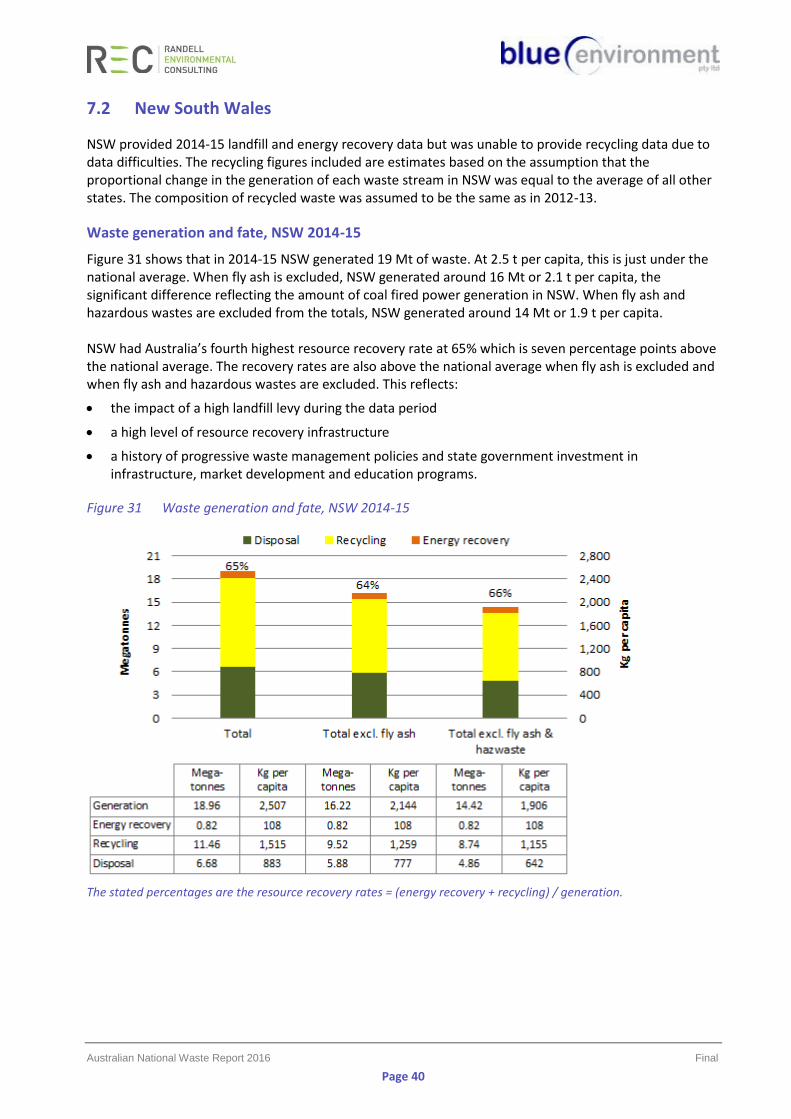
Australian National Waste Report 2016 Final
Page 40
7.2 New South Wales
NSW provided 2014-15 landfill and energy recovery data but was unable to provide recycling data due to data difficulties. The recycling figures included are estimates based on the assumption that the proportional change in the generation of each waste stream in NSW was equal to the average of all other states. The composition of recycled waste was assumed to be the same as in 2012-13.
Waste generation and fate, NSW 2014-15
Figure 31 shows that in 2014-15 NSW generated 19 Mt of waste. At 2.5 t per capita, this is just under the national average. When fly ash is excluded, NSW generated around 16 Mt or 2.1 t per capita, the significant difference reflecting the amount of coal fired power generation in NSW. When fly ash and hazardous wastes are excluded from the totals, NSW generated around 14 Mt or 1.9 t per capita. NSW had Australia’s fourth highest resource recovery rate at 65% which is seven percentage points above the national average. The recovery rates are also above the national average when fly ash is excluded and when fly ash and hazardous wastes are excluded. This reflects:
• the impact of a high landfill levy during the data period
• a high level of resource recovery infrastructure
• a history of progressive waste management policies and state government investment in infrastructure, market development and education programs.
Figure 31 Waste generation and fate, NSW 2014-15
The stated percentages are the resource recovery rates = (energy recovery + recycling) / generation.
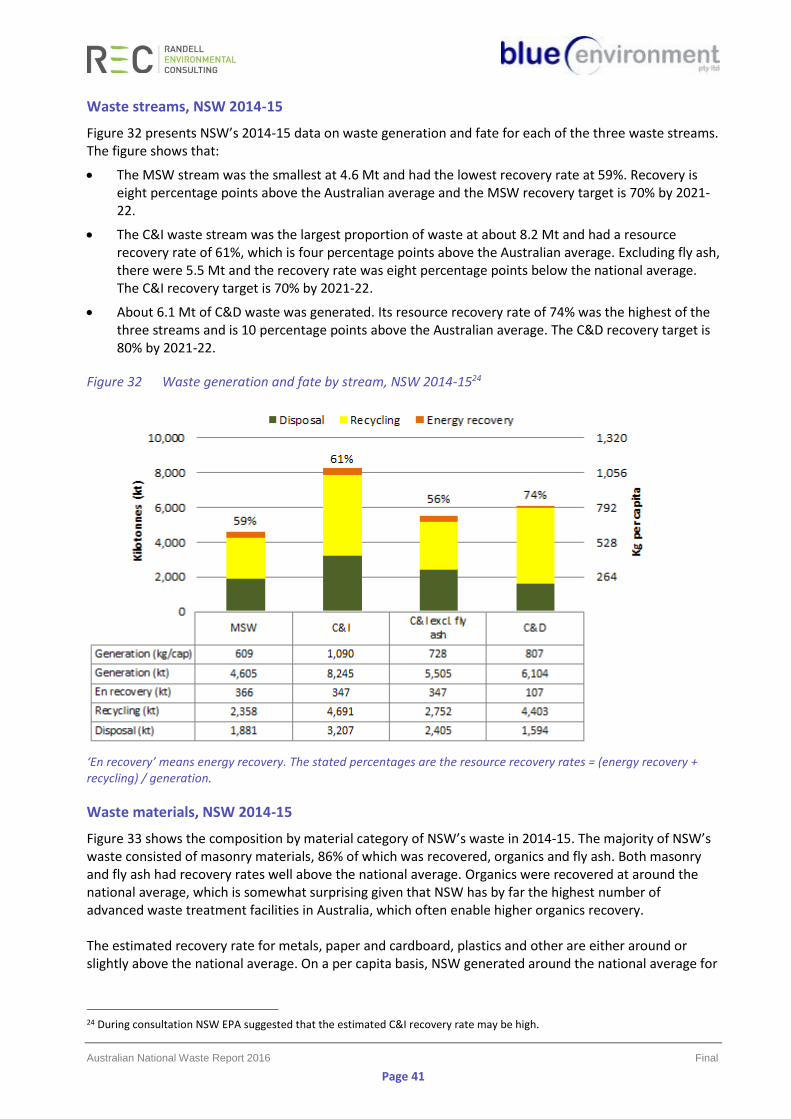
Australian National Waste Report 2016 Final
Page 41
Waste streams, NSW 2014-15
Figure 32 presents NSW’s 2014-15 data on waste generation and fate for each of the three waste streams. The figure shows that:
• The MSW stream was the smallest at 4.6 Mt and had the lowest recovery rate at 59%. Recovery is eight percentage points above the Australian average and the MSW recovery target is 70% by 2021-22.
• The C&I waste stream was the largest proportion of waste at about 8.2 Mt and had a resource recovery rate of 61%, which is four percentage points above the Australian average. Excluding fly ash, there were 5.5 Mt and the recovery rate was eight percentage points below the national average. The C&I recovery target is 70% by 2021-22.
• About 6.1 Mt of C&D waste was generated. Its resource recovery rate of 74% was the highest of the three streams and is 10 percentage points above the Australian average. The C&D recovery target is 80% by 2021-22.
Figure 32 Waste generation and fate by stream, NSW 2014-1524
‘En recovery’ means energy recovery. The stated percentages are the resource recovery rates = (energy recovery + recycling) / generation.
Waste materials, NSW 2014-15
Figure 33 shows the composition by material category of NSW’s waste in 2014-15. The majority of NSW’s waste consisted of masonry materials, 86% of which was recovered, organics and fly ash. Both masonry and fly ash had recovery rates well above the national average. Organics were recovered at around the national average, which is somewhat surprising given that NSW has by far the highest number of advanced waste treatment facilities in Australia, which often enable higher organics recovery. The estimated recovery rate for metals, paper and cardboard, plastics and other are either around or slightly above the national average. On a per capita basis, NSW generated around the national average for
24 During consultation NSW EPA suggested that the estimated C&I recovery rate may be high.
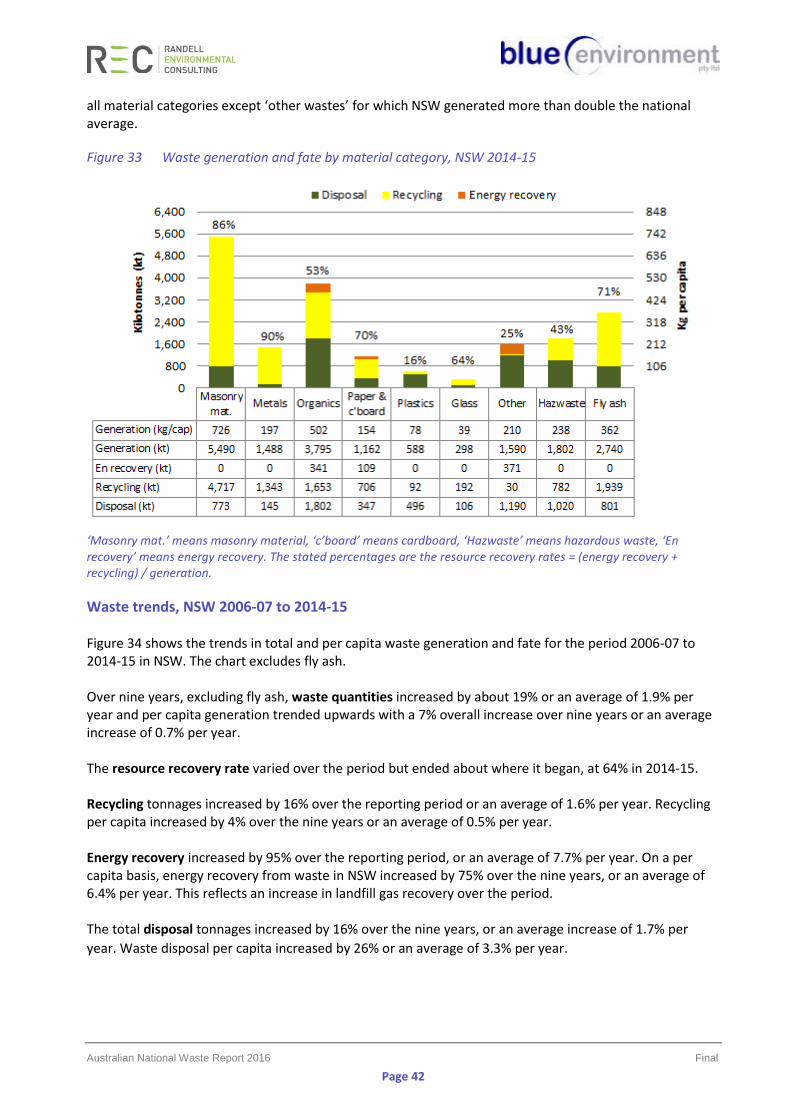
Australian National Waste Report 2016 Final
Page 42
all material categories except ‘other wastes’ for which NSW generated more than double the national average.
Figure 33 Waste generation and fate by material category, NSW 2014-15
‘Masonry mat.’ means masonry material, ‘c’board’ means cardboard, ‘Hazwaste’ means hazardous waste, ‘En recovery’ means energy recovery. The stated percentages are the resource recovery rates = (energy recovery + recycling) / generation.
Waste trends, NSW 2006-07 to 2014-15 Figure 34 shows the trends in total and per capita waste generation and fate for the period 2006-07 to 2014-15 in NSW. The chart excludes fly ash. Over nine years, excluding fly ash, waste quantities increased by about 19% or an average of 1.9% per year and per capita generation trended upwards with a 7% overall increase over nine years or an average increase of 0.7% per year. The resource recovery rate varied over the period but ended about where it began, at 64% in 2014-15. Recycling tonnages increased by 16% over the reporting period or an average of 1.6% per year. Recycling per capita increased by 4% over the nine years or an average of 0.5% per year. Energy recovery increased by 95% over the reporting period, or an average of 7.7% per year. On a per capita basis, energy recovery from waste in NSW increased by 75% over the nine years, or an average of 6.4% per year. This reflects an increase in landfill gas recovery over the period. The total disposal tonnages increased by 16% over the nine years, or an average increase of 1.7% per
year. Waste disposal per capita increased by 26% or an average of 3.3% per year.
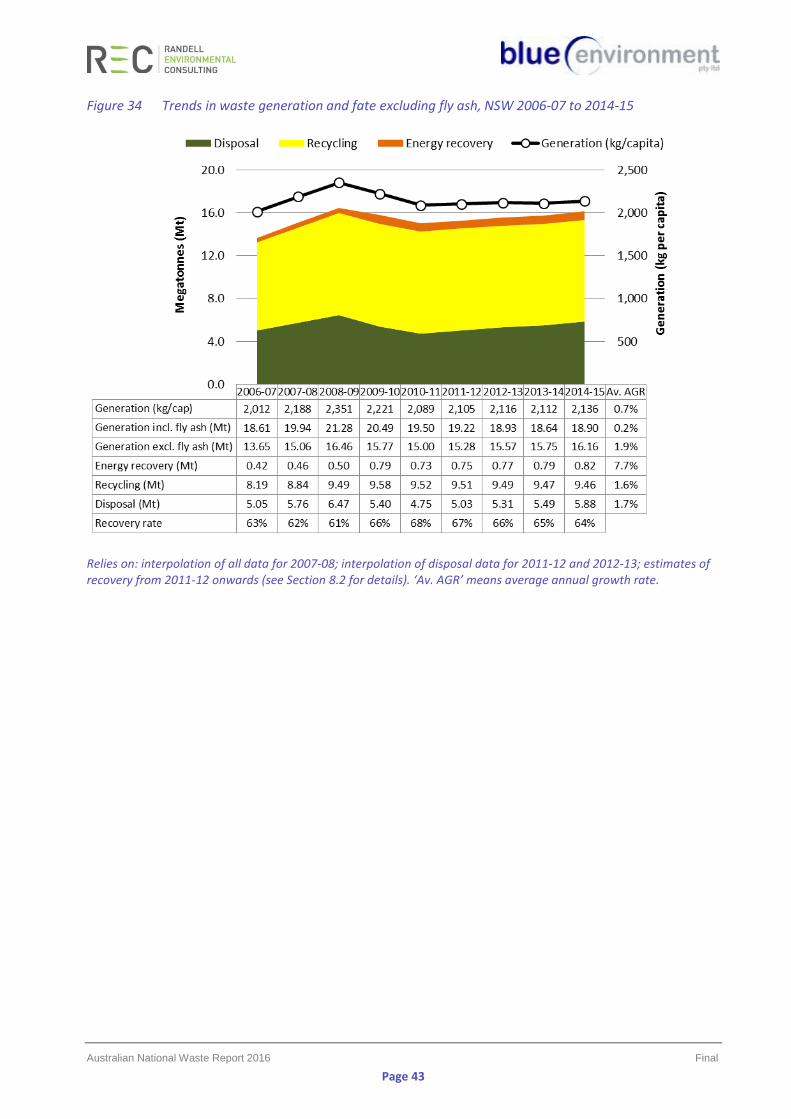
Australian National Waste Report 2016 Final
Page 43
Figure 34 Trends in waste generation and fate excluding fly ash, NSW 2006-07 to 2014-15
Relies on: interpolation of all data for 2007-08; interpolation of disposal data for 2011-12 and 2012-13; estimates of recovery from 2011-12 onwards (see Section 8.2 for details). ‘Av. AGR’ means average annual growth rate.
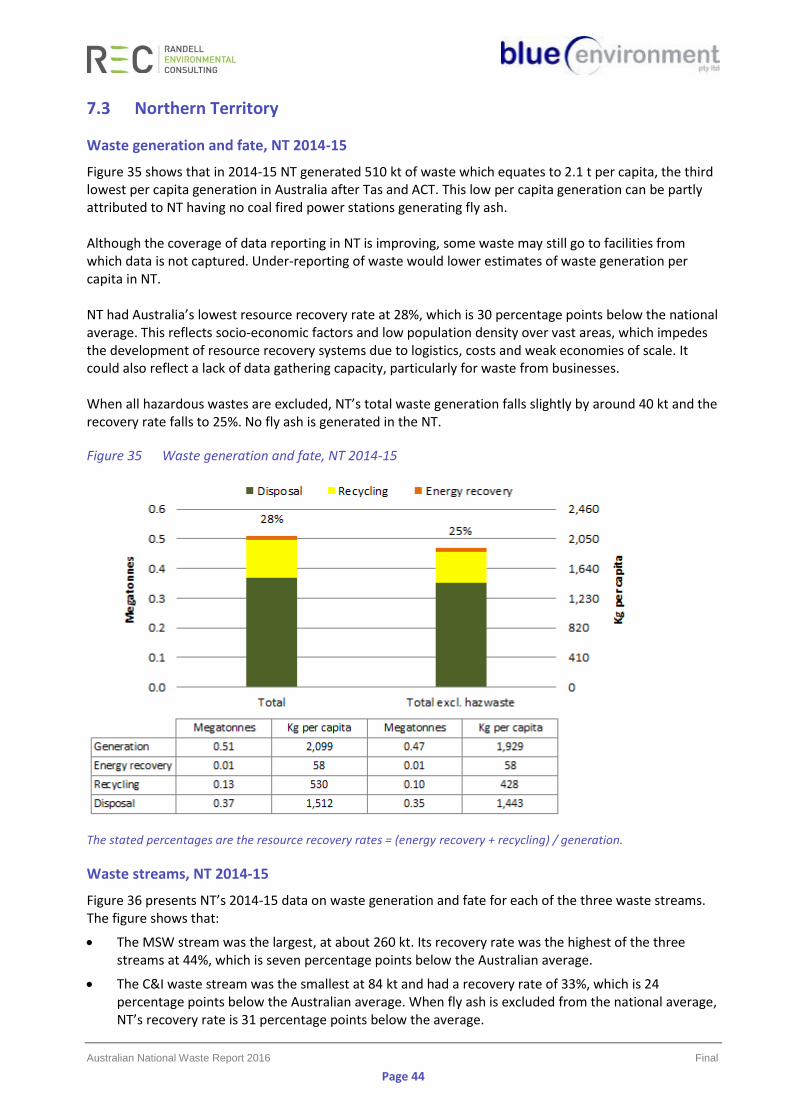
Australian National Waste Report 2016 Final
Page 44
7.3 Northern Territory
Waste generation and fate, NT 2014-15
Figure 35 shows that in 2014-15 NT generated 510 kt of waste which equates to 2.1 t per capita, the third lowest per capita generation in Australia after Tas and ACT. This low per capita generation can be partly attributed to NT having no coal fired power stations generating fly ash. Although the coverage of data reporting in NT is improving, some waste may still go to facilities from which data is not captured. Under-reporting of waste would lower estimates of waste generation per capita in NT. NT had Australia’s lowest resource recovery rate at 28%, which is 30 percentage points below the national average. This reflects socio-economic factors and low population density over vast areas, which impedes the development of resource recovery systems due to logistics, costs and weak economies of scale. It could also reflect a lack of data gathering capacity, particularly for waste from businesses. When all hazardous wastes are excluded, NT’s total waste generation falls slightly by around 40 kt and the recovery rate falls to 25%. No fly ash is generated in the NT.
Figure 35 Waste generation and fate, NT 2014-15
The stated percentages are the resource recovery rates = (energy recovery + recycling) / generation.
Waste streams, NT 2014-15
Figure 36 presents NT’s 2014-15 data on waste generation and fate for each of the three waste streams. The figure shows that:
• The MSW stream was the largest, at about 260 kt. Its recovery rate was the highest of the three streams at 44%, which is seven percentage points below the Australian average.
• The C&I waste stream was the smallest at 84 kt and had a recovery rate of 33%, which is 24 percentage points below the Australian average. When fly ash is excluded from the national average, NT’s recovery rate is 31 percentage points below the average.
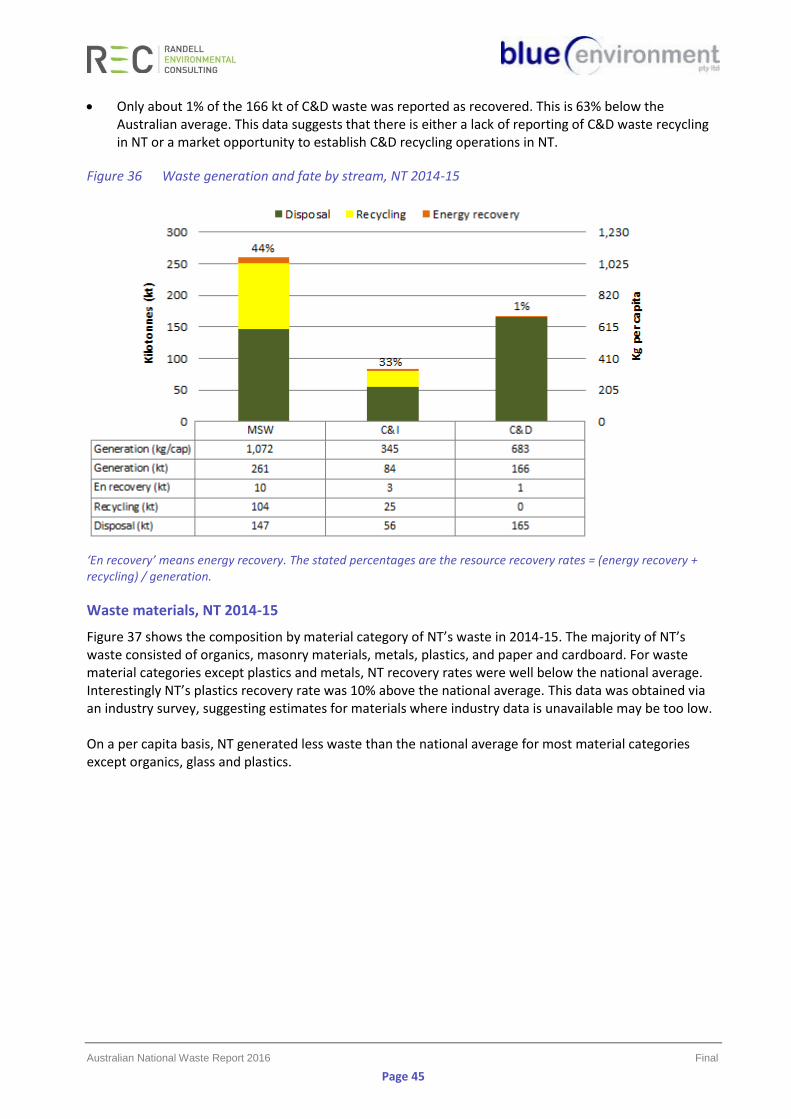
Australian National Waste Report 2016 Final
Page 45
• Only about 1% of the 166 kt of C&D waste was reported as recovered. This is 63% below the Australian average. This data suggests that there is either a lack of reporting of C&D waste recycling in NT or a market opportunity to establish C&D recycling operations in NT.
Figure 36 Waste generation and fate by stream, NT 2014-15
‘En recovery’ means energy recovery. The stated percentages are the resource recovery rates = (energy recovery + recycling) / generation.
Waste materials, NT 2014-15
Figure 37 shows the composition by material category of NT’s waste in 2014-15. The majority of NT’s waste consisted of organics, masonry materials, metals, plastics, and paper and cardboard. For waste material categories except plastics and metals, NT recovery rates were well below the national average. Interestingly NT’s plastics recovery rate was 10% above the national average. This data was obtained via an industry survey, suggesting estimates for materials where industry data is unavailable may be too low. On a per capita basis, NT generated less waste than the national average for most material categories except organics, glass and plastics.
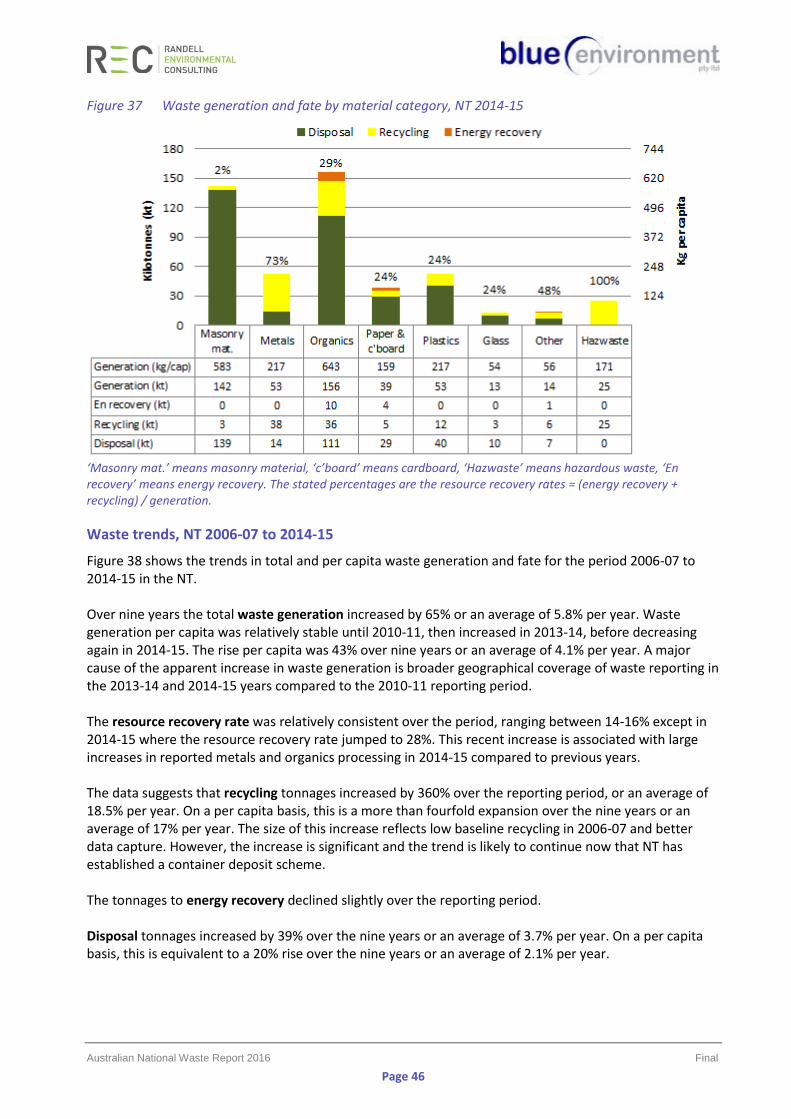
Australian National Waste Report 2016 Final
Page 46
Figure 37 Waste generation and fate by material category, NT 2014-15
‘Masonry mat.’ means masonry material, ‘c’board’ means cardboard, ‘Hazwaste’ means hazardous waste, ‘En recovery’ means energy recovery. The stated percentages are the resource recovery rates = (energy recovery + recycling) / generation.
Waste trends, NT 2006-07 to 2014-15
Figure 38 shows the trends in total and per capita waste generation and fate for the period 2006-07 to 2014-15 in the NT. Over nine years the total waste generation increased by 65% or an average of 5.8% per year. Waste generation per capita was relatively stable until 2010-11, then increased in 2013-14, before decreasing again in 2014-15. The rise per capita was 43% over nine years or an average of 4.1% per year. A major cause of the apparent increase in waste generation is broader geographical coverage of waste reporting in the 2013-14 and 2014-15 years compared to the 2010-11 reporting period. The resource recovery rate was relatively consistent over the period, ranging between 14-16% except in 2014-15 where the resource recovery rate jumped to 28%. This recent increase is associated with large increases in reported metals and organics processing in 2014-15 compared to previous years. The data suggests that recycling tonnages increased by 360% over the reporting period, or an average of 18.5% per year. On a per capita basis, this is a more than fourfold expansion over the nine years or an average of 17% per year. The size of this increase reflects low baseline recycling in 2006-07 and better data capture. However, the increase is significant and the trend is likely to continue now that NT has established a container deposit scheme. The tonnages to energy recovery declined slightly over the reporting period. Disposal tonnages increased by 39% over the nine years or an average of 3.7% per year. On a per capita basis, this is equivalent to a 20% rise over the nine years or an average of 2.1% per year.
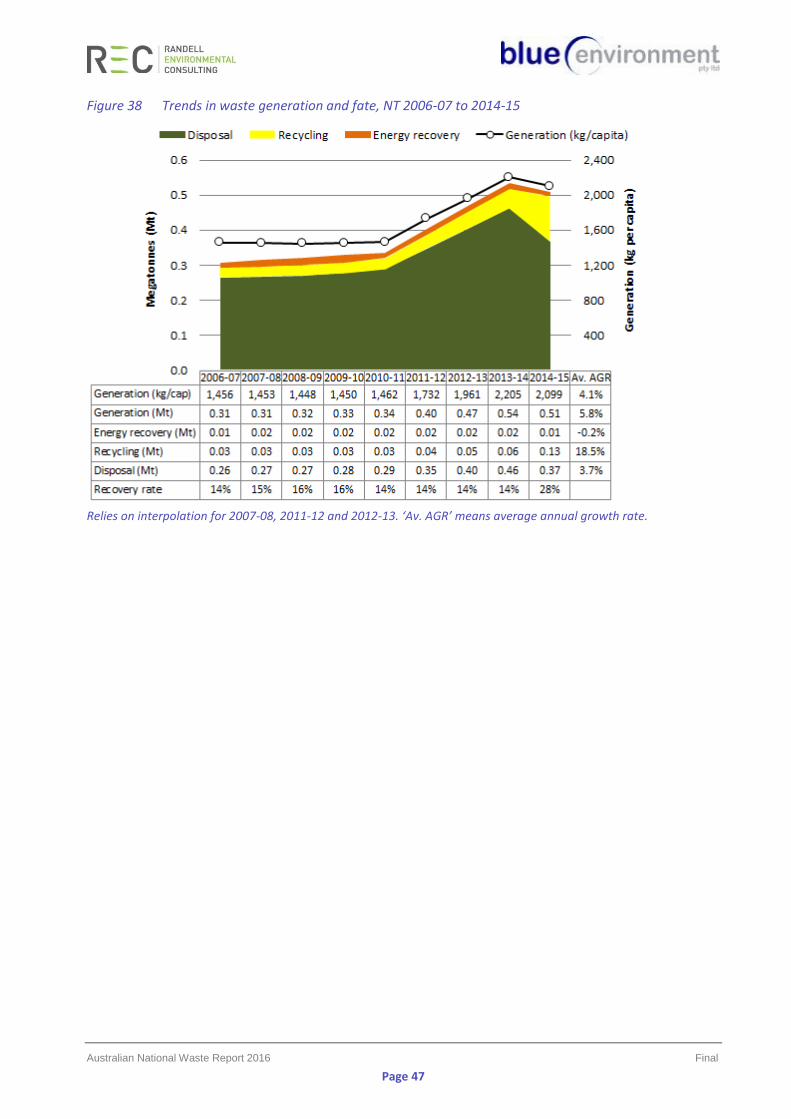
Australian National Waste Report 2016 Final
Page 47
Figure 38 Trends in waste generation and fate, NT 2006-07 to 2014-15
Relies on interpolation for 2007-08, 2011-12 and 2012-13. ‘Av. AGR’ means average annual growth rate.
Australian National Waste Report 2016 Final
Page 48
NT Government perspective
It is encouraging to see that, despite the increase over time in waste generation and disposal rates in the NT, there was a decrease between the 2013-14 and 2014-15 periods. With the release of the Waste Management Strategy for the Northern Territory 2015-2022 it is anticipated that this trend will continue downwards as management actions are implemented and objectives of the strategy are met. The NT is especially encouraged by the increase in recycling by 360%! Whilst it is acknowledged that this is more likely due to improved data coverage for 2014-15 with more facilities providing data (in previous years only City of Darwin has been able to provide consistent recycling data), it is interesting to note that the largest increase in recycling (between 2013-14 and 2014-15) coincided with a decrease in generation and disposal rates. Another influencing factor is that the NT’s container deposit scheme reported an increased return rate of 20% over the same period which has been attributed to improved public access to the scheme in the high population base of the Darwin region. The release of the Waste Management Strategy for the Northern Territory 2015-2022 was an important step for the NT to understand and improve the management of waste across the NT. The 41 Management Actions identified in the Strategy have been categorised into five broader groupings of:
• engagement and education
• improve waste management
• improve waste data collection, monitoring and analysis
• improve the regulatory framework
• reporting and public reviews. Projects including the release of an online licensing system (NT EPA Online), remote landfill management including involvement with the Central Australian and Big Rivers waste management working groups, and investigations into the acquisition and implementation of an online waste tracking system for the NT, are all contributing to improved waste management across the NT. Challenges for waste management in the NT also provide opportunities, particularly in regional and remote areas where access to waste management schemes (such as the container deposit and various product stewardship schemes) are impacted by logistical challenges such as transport distances, seasonal access and economies of scale. Engaging with local community, local government and industry stakeholders will be essential in identifying innovative approaches to waste management in these areas. The NT is not the only jurisdiction to face challenges in managing waste and increasing resource recovery in remote areas. Improving this scenario should be a focus of waste management in Australia over the coming decade.
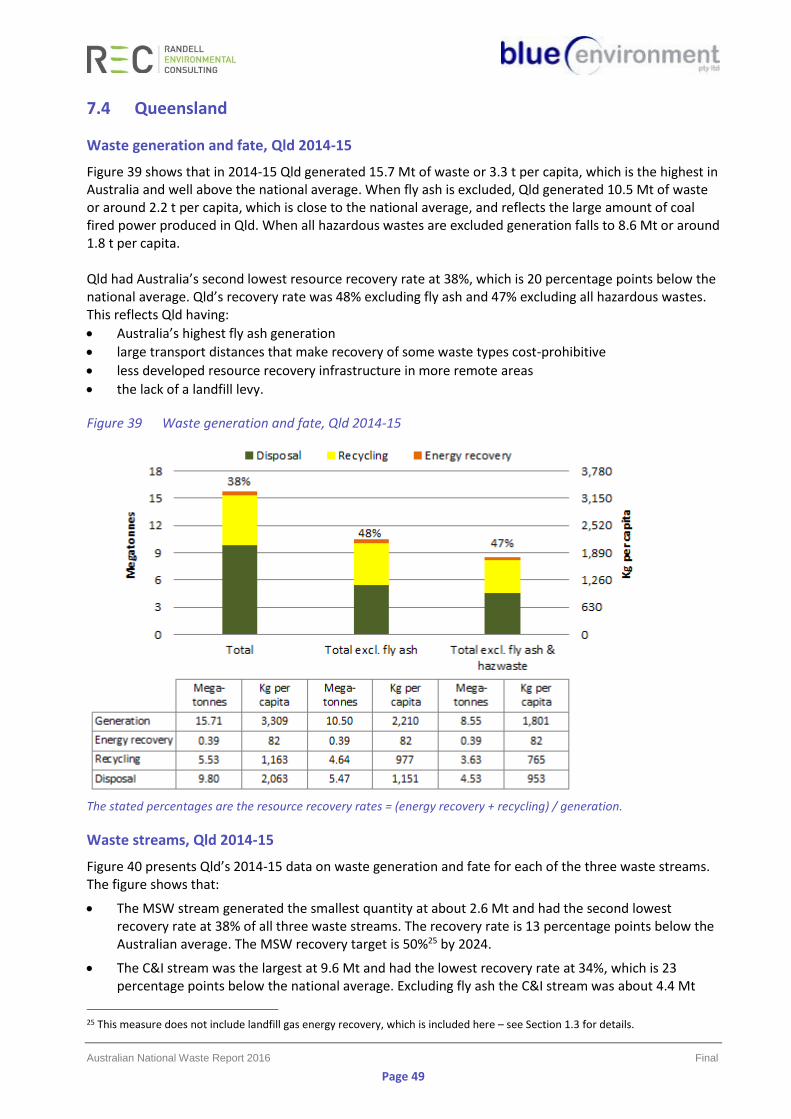
Australian National Waste Report 2016 Final
Page 49
7.4 Queensland
Waste generation and fate, Qld 2014-15
Figure 39 shows that in 2014-15 Qld generated 15.7 Mt of waste or 3.3 t per capita, which is the highest in Australia and well above the national average. When fly ash is excluded, Qld generated 10.5 Mt of waste or around 2.2 t per capita, which is close to the national average, and reflects the large amount of coal fired power produced in Qld. When all hazardous wastes are excluded generation falls to 8.6 Mt or around 1.8 t per capita. Qld had Australia’s second lowest resource recovery rate at 38%, which is 20 percentage points below the national average. Qld’s recovery rate was 48% excluding fly ash and 47% excluding all hazardous wastes. This reflects Qld having:
• Australia’s highest fly ash generation
• large transport distances that make recovery of some waste types cost-prohibitive
• less developed resource recovery infrastructure in more remote areas
• the lack of a landfill levy.
Figure 39 Waste generation and fate, Qld 2014-15
The stated percentages are the resource recovery rates = (energy recovery + recycling) / generation.
Waste streams, Qld 2014-15
Figure 40 presents Qld’s 2014-15 data on waste generation and fate for each of the three waste streams. The figure shows that:
• The MSW stream generated the smallest quantity at about 2.6 Mt and had the second lowest recovery rate at 38% of all three waste streams. The recovery rate is 13 percentage points below the Australian average. The MSW recovery target is 50%25 by 2024.
• The C&I stream was the largest at 9.6 Mt and had the lowest recovery rate at 34%, which is 23 percentage points below the national average. Excluding fly ash the C&I stream was about 4.4 Mt
25 This measure does not include landfill gas energy recovery, which is included here – see Section 1.3 for details.
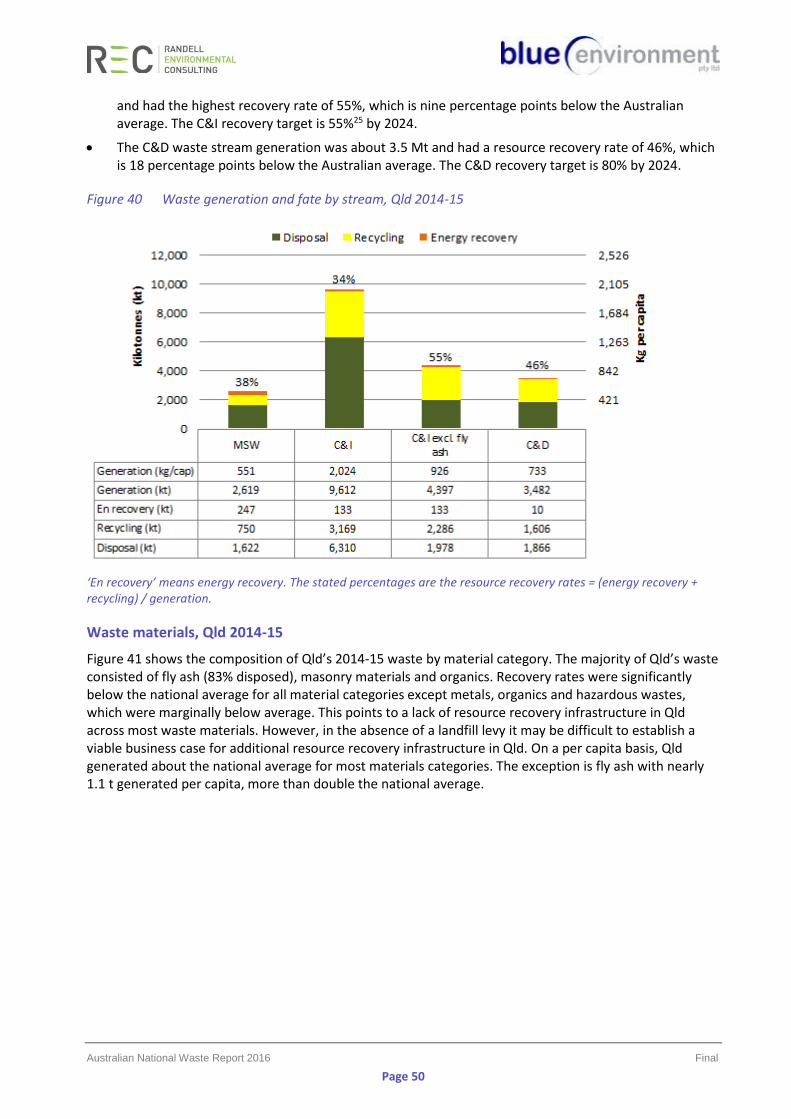
Australian National Waste Report 2016 Final
Page 50
and had the highest recovery rate of 55%, which is nine percentage points below the Australian average. The C&I recovery target is 55%25 by 2024.
• The C&D waste stream generation was about 3.5 Mt and had a resource recovery rate of 46%, which is 18 percentage points below the Australian average. The C&D recovery target is 80% by 2024.
Figure 40 Waste generation and fate by stream, Qld 2014-15
‘En recovery’ means energy recovery. The stated percentages are the resource recovery rates = (energy recovery + recycling) / generation.
Waste materials, Qld 2014-15
Figure 41 shows the composition of Qld’s 2014-15 waste by material category. The majority of Qld’s waste consisted of fly ash (83% disposed), masonry materials and organics. Recovery rates were significantly below the national average for all material categories except metals, organics and hazardous wastes, which were marginally below average. This points to a lack of resource recovery infrastructure in Qld across most waste materials. However, in the absence of a landfill levy it may be difficult to establish a viable business case for additional resource recovery infrastructure in Qld. On a per capita basis, Qld generated about the national average for most materials categories. The exception is fly ash with nearly 1.1 t generated per capita, more than double the national average.
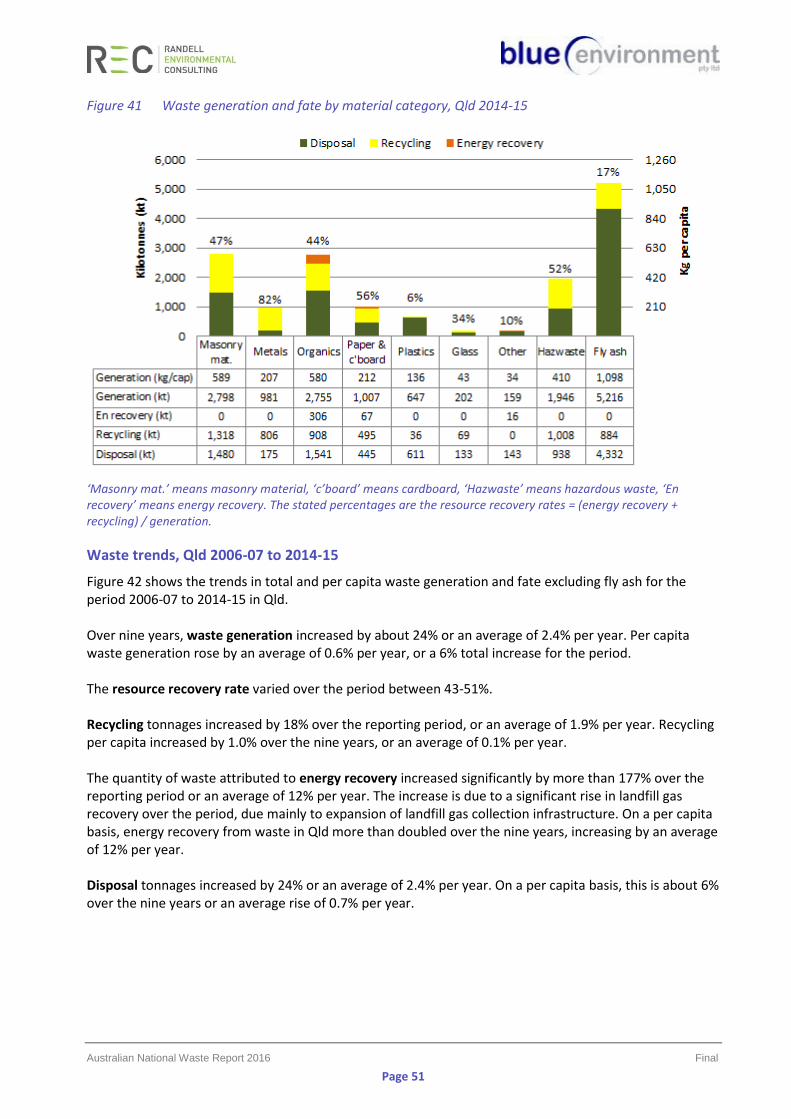
Australian National Waste Report 2016 Final
Page 51
Figure 41 Waste generation and fate by material category, Qld 2014-15
‘Masonry mat.’ means masonry material, ‘c’board’ means cardboard, ‘Hazwaste’ means hazardous waste, ‘En recovery’ means energy recovery. The stated percentages are the resource recovery rates = (energy recovery + recycling) / generation.
Waste trends, Qld 2006-07 to 2014-15
Figure 42 shows the trends in total and per capita waste generation and fate excluding fly ash for the period 2006-07 to 2014-15 in Qld. Over nine years, waste generation increased by about 24% or an average of 2.4% per year. Per capita waste generation rose by an average of 0.6% per year, or a 6% total increase for the period. The resource recovery rate varied over the period between 43-51%. Recycling tonnages increased by 18% over the reporting period, or an average of 1.9% per year. Recycling per capita increased by 1.0% over the nine years, or an average of 0.1% per year. The quantity of waste attributed to energy recovery increased significantly by more than 177% over the reporting period or an average of 12% per year. The increase is due to a significant rise in landfill gas recovery over the period, due mainly to expansion of landfill gas collection infrastructure. On a per capita basis, energy recovery from waste in Qld more than doubled over the nine years, increasing by an average of 12% per year. Disposal tonnages increased by 24% or an average of 2.4% per year. On a per capita basis, this is about 6% over the nine years or an average rise of 0.7% per year.
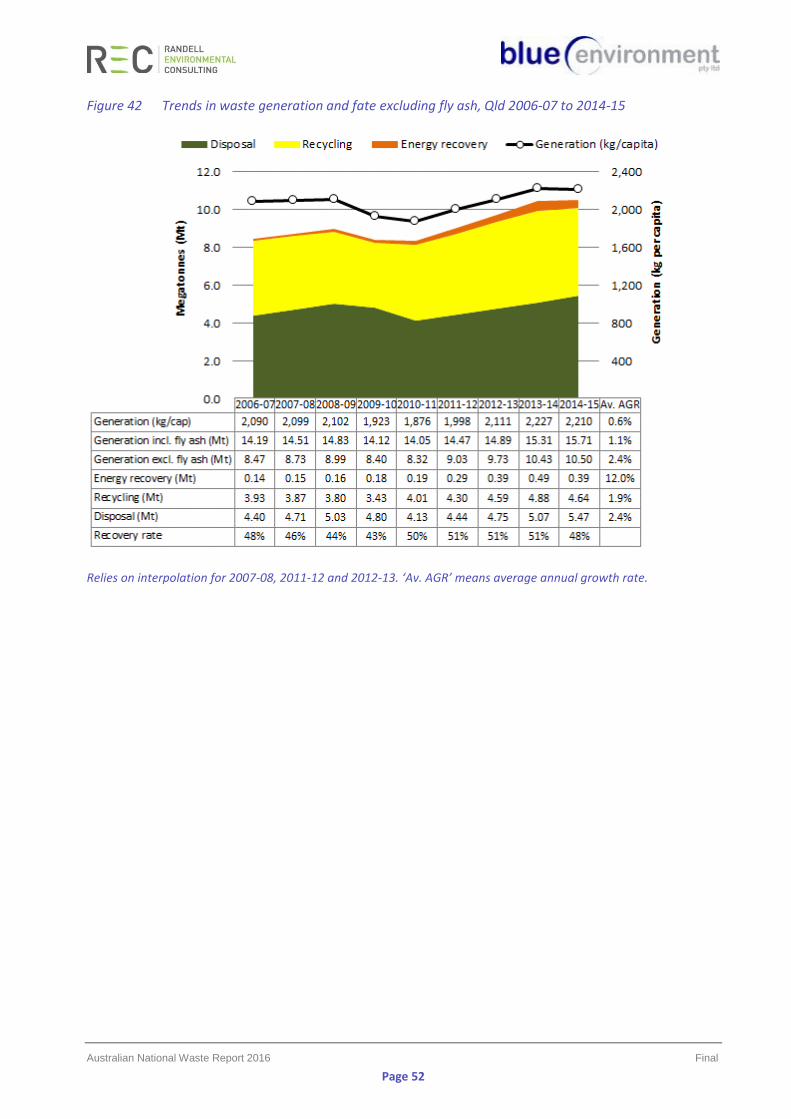
Australian National Waste Report 2016 Final
Page 52
Figure 42 Trends in waste generation and fate excluding fly ash, Qld 2006-07 to 2014-15
Relies on interpolation for 2007-08, 2011-12 and 2012-13. ‘Av. AGR’ means average annual growth rate.
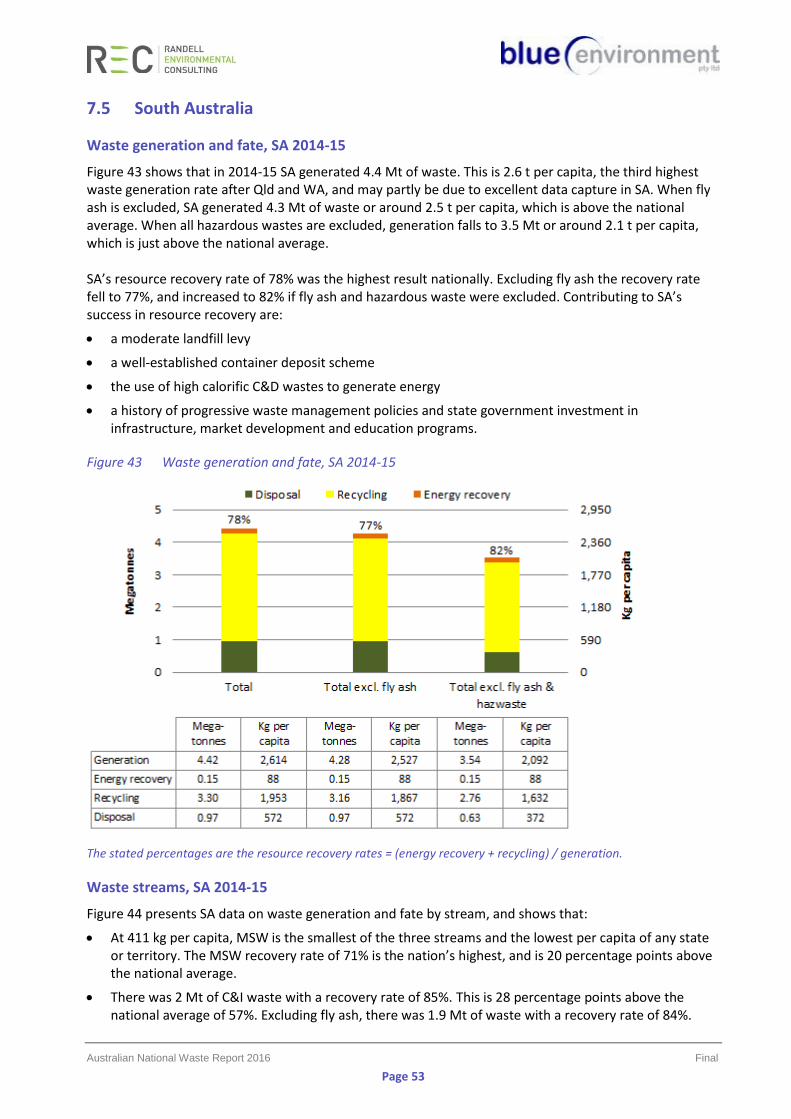
Australian National Waste Report 2016 Final
Page 53
7.5 South Australia
Waste generation and fate, SA 2014-15
Figure 43 shows that in 2014-15 SA generated 4.4 Mt of waste. This is 2.6 t per capita, the third highest waste generation rate after Qld and WA, and may partly be due to excellent data capture in SA. When fly ash is excluded, SA generated 4.3 Mt of waste or around 2.5 t per capita, which is above the national average. When all hazardous wastes are excluded, generation falls to 3.5 Mt or around 2.1 t per capita, which is just above the national average. SA’s resource recovery rate of 78% was the highest result nationally. Excluding fly ash the recovery rate fell to 77%, and increased to 82% if fly ash and hazardous waste were excluded. Contributing to SA’s success in resource recovery are:
• a moderate landfill levy
• a well-established container deposit scheme
• the use of high calorific C&D wastes to generate energy
• a history of progressive waste management policies and state government investment in infrastructure, market development and education programs.
Figure 43 Waste generation and fate, SA 2014-15
The stated percentages are the resource recovery rates = (energy recovery + recycling) / generation.
Waste streams, SA 2014-15
Figure 44 presents SA data on waste generation and fate by stream, and shows that:
• At 411 kg per capita, MSW is the smallest of the three streams and the lowest per capita of any state or territory. The MSW recovery rate of 71% is the nation’s highest, and is 20 percentage points above the national average.
• There was 2 Mt of C&I waste with a recovery rate of 85%. This is 28 percentage points above the national average of 57%. Excluding fly ash, there was 1.9 Mt of waste with a recovery rate of 84%.
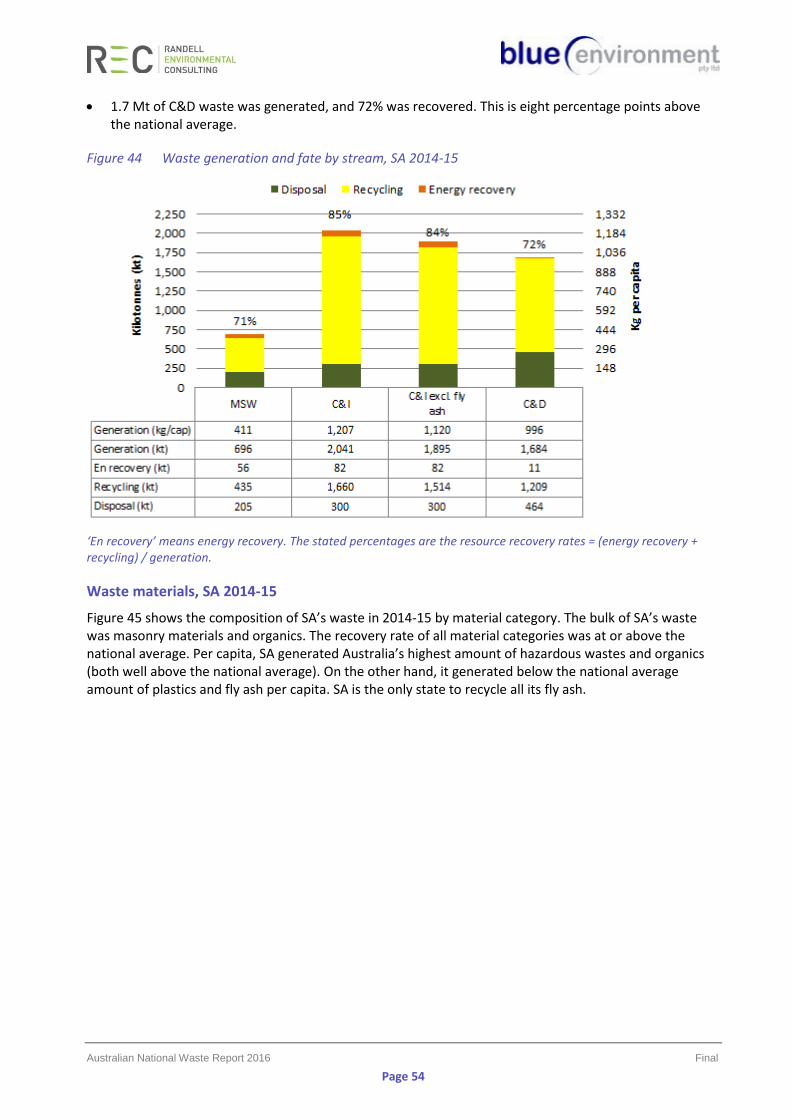
Australian National Waste Report 2016 Final
Page 54
• 1.7 Mt of C&D waste was generated, and 72% was recovered. This is eight percentage points above the national average.
Figure 44 Waste generation and fate by stream, SA 2014-15
‘En recovery’ means energy recovery. The stated percentages are the resource recovery rates = (energy recovery + recycling) / generation.
Waste materials, SA 2014-15
Figure 45 shows the composition of SA’s waste in 2014-15 by material category. The bulk of SA’s waste was masonry materials and organics. The recovery rate of all material categories was at or above the national average. Per capita, SA generated Australia’s highest amount of hazardous wastes and organics (both well above the national average). On the other hand, it generated below the national average amount of plastics and fly ash per capita. SA is the only state to recycle all its fly ash.
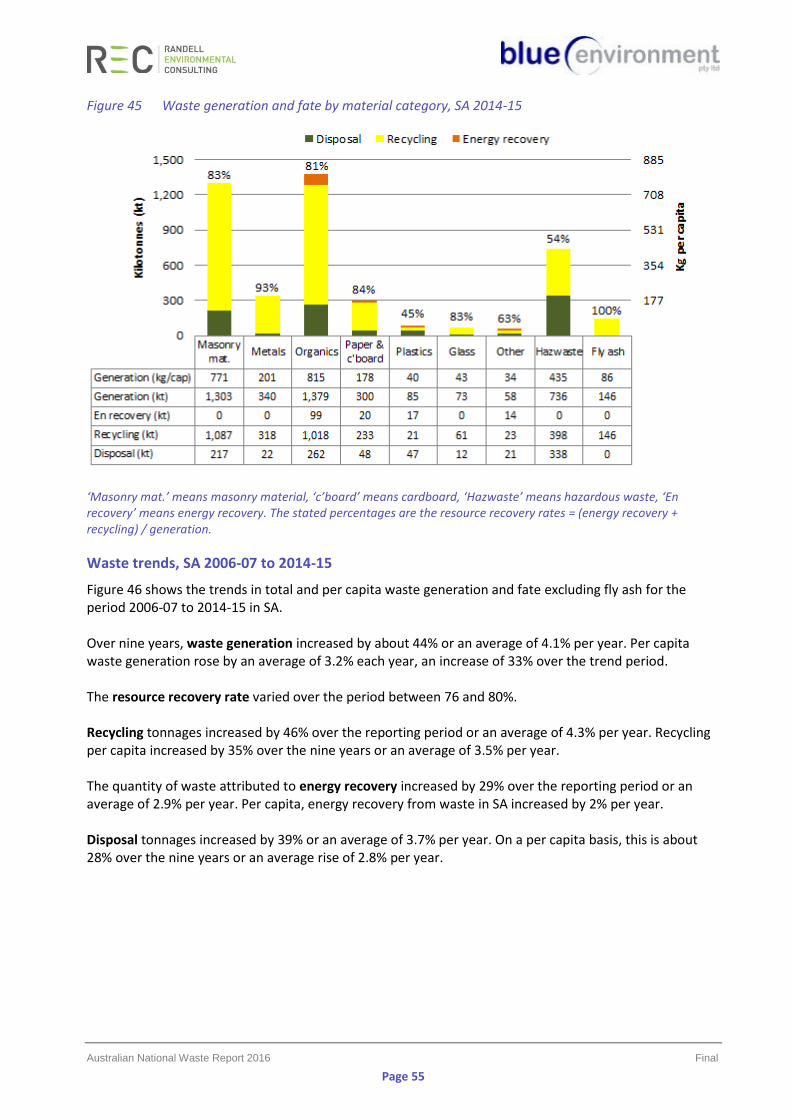
Australian National Waste Report 2016 Final
Page 55
Figure 45 Waste generation and fate by material category, SA 2014-15
‘Masonry mat.’ means masonry material, ‘c’board’ means cardboard, ‘Hazwaste’ means hazardous waste, ‘En recovery’ means energy recovery. The stated percentages are the resource recovery rates = (energy recovery + recycling) / generation.
Waste trends, SA 2006-07 to 2014-15
Figure 46 shows the trends in total and per capita waste generation and fate excluding fly ash for the period 2006-07 to 2014-15 in SA. Over nine years, waste generation increased by about 44% or an average of 4.1% per year. Per capita waste generation rose by an average of 3.2% each year, an increase of 33% over the trend period. The resource recovery rate varied over the period between 76 and 80%. Recycling tonnages increased by 46% over the reporting period or an average of 4.3% per year. Recycling per capita increased by 35% over the nine years or an average of 3.5% per year. The quantity of waste attributed to energy recovery increased by 29% over the reporting period or an average of 2.9% per year. Per capita, energy recovery from waste in SA increased by 2% per year. Disposal tonnages increased by 39% or an average of 3.7% per year. On a per capita basis, this is about 28% over the nine years or an average rise of 2.8% per year.
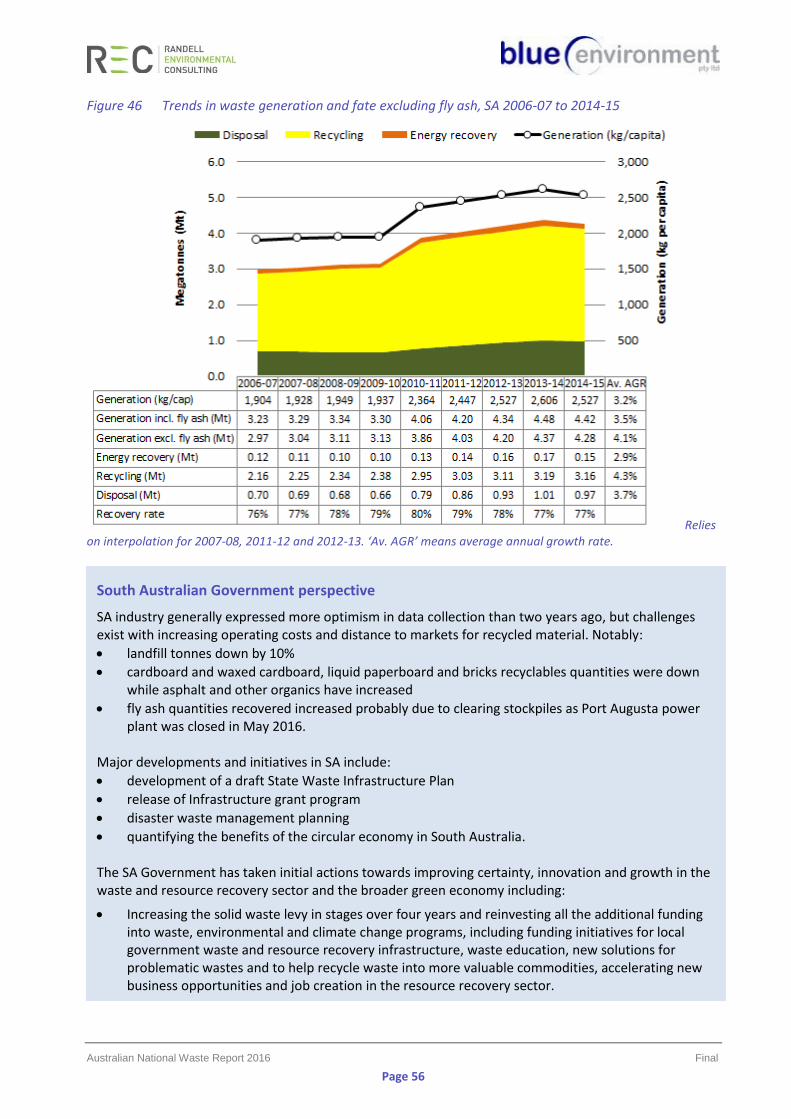
Australian National Waste Report 2016 Final
Page 56
Figure 46 Trends in waste generation and fate excluding fly ash, SA 2006-07 to 2014-15
Relies on interpolation for 2007-08, 2011-12 and 2012-13. ‘Av. AGR’ means average annual growth rate.
South Australian Government perspective
SA industry generally expressed more optimism in data collection than two years ago, but challenges exist with increasing operating costs and distance to markets for recycled material. Notably:
• landfill tonnes down by 10%
• cardboard and waxed cardboard, liquid paperboard and bricks recyclables quantities were down while asphalt and other organics have increased
• fly ash quantities recovered increased probably due to clearing stockpiles as Port Augusta power plant was closed in May 2016.
Major developments and initiatives in SA include:
• development of a draft State Waste Infrastructure Plan
• release of Infrastructure grant program
• disaster waste management planning
• quantifying the benefits of the circular economy in South Australia. The SA Government has taken initial actions towards improving certainty, innovation and growth in the waste and resource recovery sector and the broader green economy including:
• Increasing the solid waste levy in stages over four years and reinvesting all the additional funding into waste, environmental and climate change programs, including funding initiatives for local government waste and resource recovery infrastructure, waste education, new solutions for problematic wastes and to help recycle waste into more valuable commodities, accelerating new business opportunities and job creation in the resource recovery sector.
Australian National Waste Report 2016 Final
Page 57
• From 1 September 2016, significantly reducing the levy for packaged asbestos waste to promote its safe and lawful disposal.
• Statutory establishment of a new entity, Green Industries SA, replacing Zero Waste SA, whose primary objectives will be to promote: - waste management practices that, as far as possible, eliminate waste or its disposal to landfill - innovation and business activity in the waste management, resource recovery and green
industry sectors, recognising that these areas present a valuable opportunity to contribute to the state's economic growth.
The SA Government has released the draft Environment Protection (Waste Reform) Amendment Bill 2016 for consultation. This Bill will provide the necessary underpinning for the EPA to be able to better tackle illegal dumping and achieve a suite of waste reforms. Significant waste management challenges exist in SA including:
• Economies of scale present challenges to remanufacturing locally as much material is exported for recovery.
• Waste and recyclables flow to the lowest cost management solution often leading to sub optimal outcomes for recycled materials.
• Contamination of kerbside bins continues to be a problem to composters and recyclers.
• The recyclables quantities recovered at kerbside are reducing which is attributed to a number of factors such as lighter weight packaging and decreased paper quantities consumed.
• Use of composite materials is creating future challenges to recycling.
• Static or growing stockpiles including soils, construction and demolition waste, timber and green waste – this has been raised by industry as a significant concern due to the potential for levy avoidance through the indefinite holding of material without either recovering and selling the materials or disposing of the material to landfill.
• Waste promoted as ‘product’ and ensuring environmental risks are reliably tested to determine consistency of character and contaminant levels to support the use of only genuine recovered products, with materials that pose risks of harm being safely disposed as waste.
• Potentially reuseable, low-risk ‘fill materials’ ending up at landfill due to uncertainty regarding testing and treatment and time-cost pressures.
• The ability and capacity to manage and appropriately deal with certain problematic wastes via cost-effective recovery and disposal mechanisms.
• Clean up and management of illegal dumping on both public and private land continues to result in a significant cost to the EPA, local government and the SA community.
The greatest opportunities in waste management exist in diverting more material from waste currently destined for landfill, and new technology that can make marginal recycling viable. Further potential exists in the incorporation of the recovery of the embodied energy within waste, such as energy from waste as a waste and resource recovery management option for SA waste otherwise destined for landfill. The future should involve less waste generated per person, increased diversion from landfill and a continued emphasis on recirculating material in the economy. Facilitating this requires:
• better harmonisation of waste practices and policies in place across all states and territories
• extended producer responsibility in place for a broad range of wastes strategies involving reliable long term, industry funded strategies for dealing with problematic waste such as tyres.
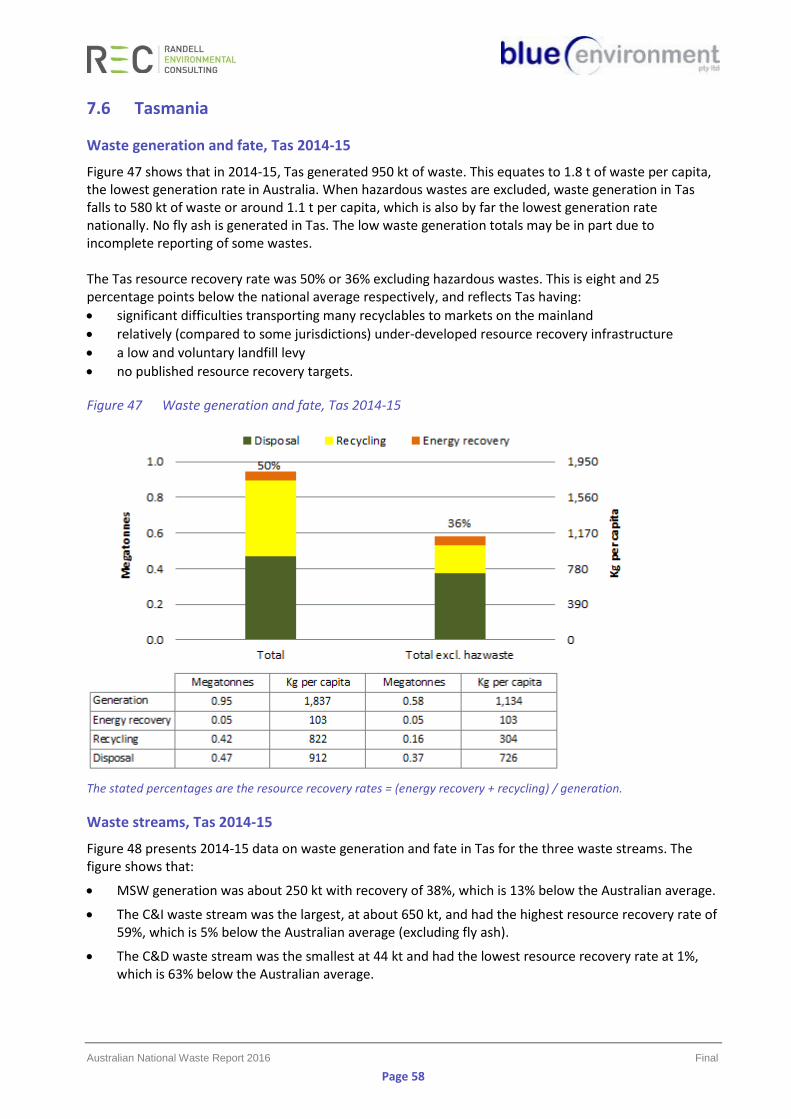
Australian National Waste Report 2016 Final
Page 58
7.6 Tasmania
Waste generation and fate, Tas 2014-15
Figure 47 shows that in 2014-15, Tas generated 950 kt of waste. This equates to 1.8 t of waste per capita, the lowest generation rate in Australia. When hazardous wastes are excluded, waste generation in Tas falls to 580 kt of waste or around 1.1 t per capita, which is also by far the lowest generation rate nationally. No fly ash is generated in Tas. The low waste generation totals may be in part due to incomplete reporting of some wastes. The Tas resource recovery rate was 50% or 36% excluding hazardous wastes. This is eight and 25 percentage points below the national average respectively, and reflects Tas having:
• significant difficulties transporting many recyclables to markets on the mainland
• relatively (compared to some jurisdictions) under-developed resource recovery infrastructure
• a low and voluntary landfill levy
• no published resource recovery targets.
Figure 47 Waste generation and fate, Tas 2014-15
The stated percentages are the resource recovery rates = (energy recovery + recycling) / generation.
Waste streams, Tas 2014-15
Figure 48 presents 2014-15 data on waste generation and fate in Tas for the three waste streams. The figure shows that:
• MSW generation was about 250 kt with recovery of 38%, which is 13% below the Australian average.
• The C&I waste stream was the largest, at about 650 kt, and had the highest resource recovery rate of 59%, which is 5% below the Australian average (excluding fly ash).
• The C&D waste stream was the smallest at 44 kt and had the lowest resource recovery rate at 1%, which is 63% below the Australian average.
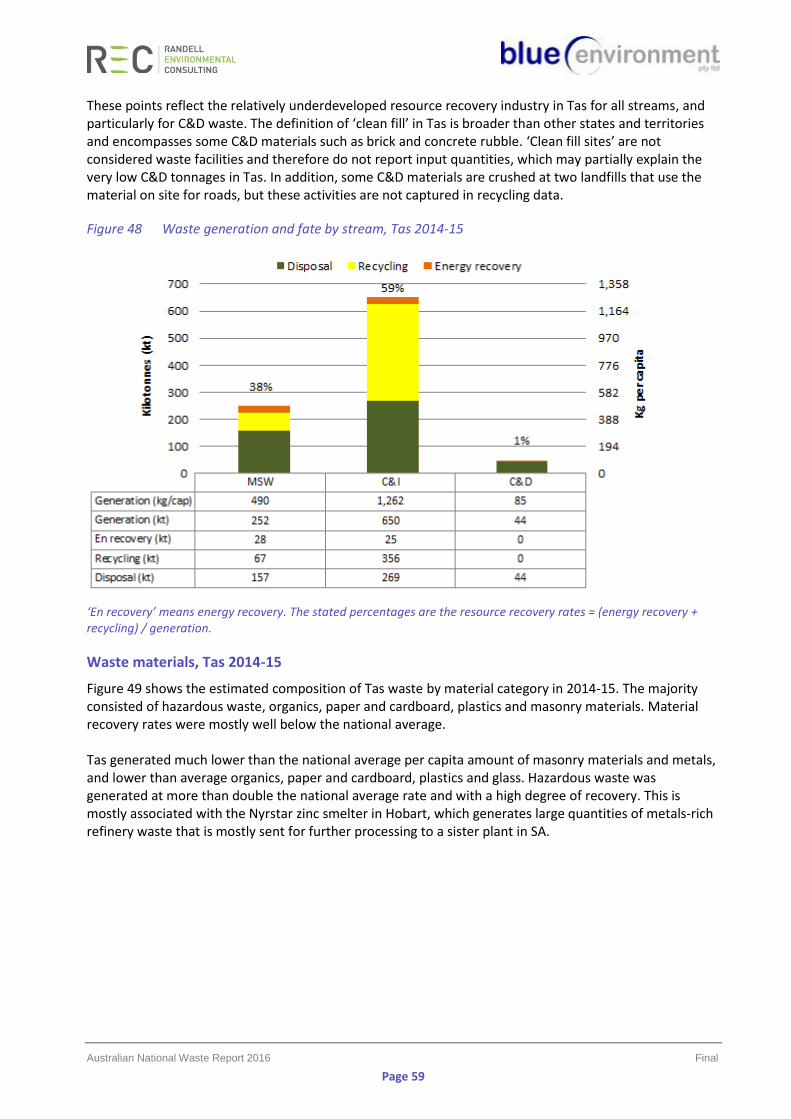
Australian National Waste Report 2016 Final
Page 59
These points reflect the relatively underdeveloped resource recovery industry in Tas for all streams, and particularly for C&D waste. The definition of ‘clean fill’ in Tas is broader than other states and territories and encompasses some C&D materials such as brick and concrete rubble. ‘Clean fill sites’ are not considered waste facilities and therefore do not report input quantities, which may partially explain the very low C&D tonnages in Tas. In addition, some C&D materials are crushed at two landfills that use the material on site for roads, but these activities are not captured in recycling data.
Figure 48 Waste generation and fate by stream, Tas 2014-15
‘En recovery’ means energy recovery. The stated percentages are the resource recovery rates = (energy recovery + recycling) / generation.
Waste materials, Tas 2014-15
Figure 49 shows the estimated composition of Tas waste by material category in 2014-15. The majority consisted of hazardous waste, organics, paper and cardboard, plastics and masonry materials. Material recovery rates were mostly well below the national average. Tas generated much lower than the national average per capita amount of masonry materials and metals, and lower than average organics, paper and cardboard, plastics and glass. Hazardous waste was generated at more than double the national average rate and with a high degree of recovery. This is mostly associated with the Nyrstar zinc smelter in Hobart, which generates large quantities of metals-rich refinery waste that is mostly sent for further processing to a sister plant in SA.
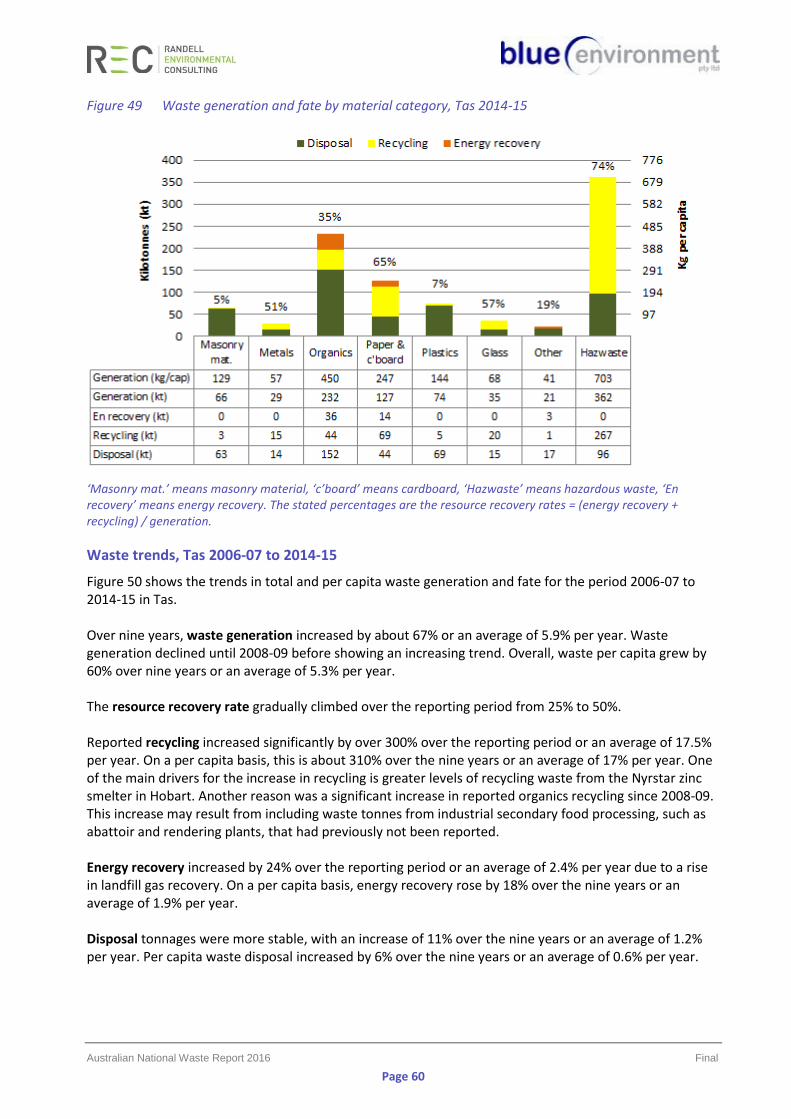
Australian National Waste Report 2016 Final
Page 60
Figure 49 Waste generation and fate by material category, Tas 2014-15
‘Masonry mat.’ means masonry material, ‘c’board’ means cardboard, ‘Hazwaste’ means hazardous waste, ‘En recovery’ means energy recovery. The stated percentages are the resource recovery rates = (energy recovery + recycling) / generation.
Waste trends, Tas 2006-07 to 2014-15
Figure 50 shows the trends in total and per capita waste generation and fate for the period 2006-07 to 2014-15 in Tas. Over nine years, waste generation increased by about 67% or an average of 5.9% per year. Waste generation declined until 2008-09 before showing an increasing trend. Overall, waste per capita grew by 60% over nine years or an average of 5.3% per year. The resource recovery rate gradually climbed over the reporting period from 25% to 50%. Reported recycling increased significantly by over 300% over the reporting period or an average of 17.5% per year. On a per capita basis, this is about 310% over the nine years or an average of 17% per year. One of the main drivers for the increase in recycling is greater levels of recycling waste from the Nyrstar zinc smelter in Hobart. Another reason was a significant increase in reported organics recycling since 2008-09. This increase may result from including waste tonnes from industrial secondary food processing, such as abattoir and rendering plants, that had previously not been reported. Energy recovery increased by 24% over the reporting period or an average of 2.4% per year due to a rise in landfill gas recovery. On a per capita basis, energy recovery rose by 18% over the nine years or an average of 1.9% per year. Disposal tonnages were more stable, with an increase of 11% over the nine years or an average of 1.2% per year. Per capita waste disposal increased by 6% over the nine years or an average of 0.6% per year.
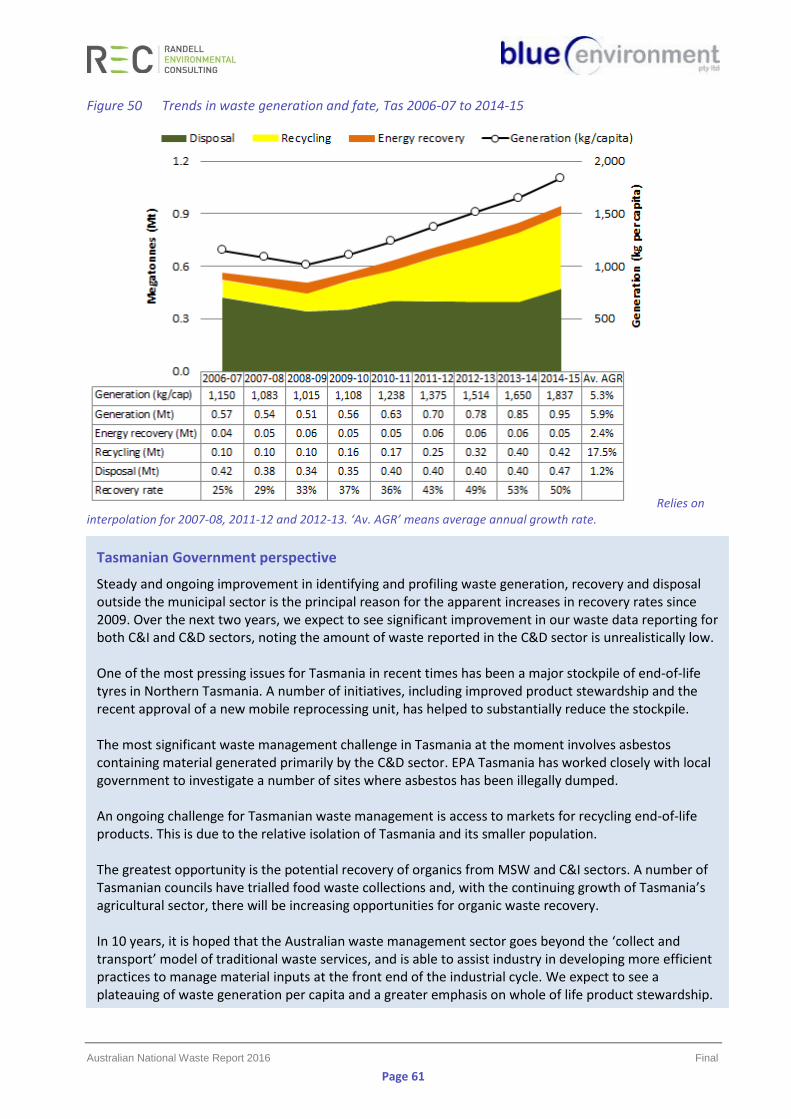
Australian National Waste Report 2016 Final
Page 61
Figure 50 Trends in waste generation and fate, Tas 2006-07 to 2014-15
Relies on interpolation for 2007-08, 2011-12 and 2012-13. ‘Av. AGR’ means average annual growth rate.
Tasmanian Government perspective
Steady and ongoing improvement in identifying and profiling waste generation, recovery and disposal outside the municipal sector is the principal reason for the apparent increases in recovery rates since 2009. Over the next two years, we expect to see significant improvement in our waste data reporting for both C&I and C&D sectors, noting the amount of waste reported in the C&D sector is unrealistically low. One of the most pressing issues for Tasmania in recent times has been a major stockpile of end-of-life tyres in Northern Tasmania. A number of initiatives, including improved product stewardship and the recent approval of a new mobile reprocessing unit, has helped to substantially reduce the stockpile. The most significant waste management challenge in Tasmania at the moment involves asbestos containing material generated primarily by the C&D sector. EPA Tasmania has worked closely with local government to investigate a number of sites where asbestos has been illegally dumped. An ongoing challenge for Tasmanian waste management is access to markets for recycling end-of-life products. This is due to the relative isolation of Tasmania and its smaller population. The greatest opportunity is the potential recovery of organics from MSW and C&I sectors. A number of Tasmanian councils have trialled food waste collections and, with the continuing growth of Tasmania’s agricultural sector, there will be increasing opportunities for organic waste recovery. In 10 years, it is hoped that the Australian waste management sector goes beyond the ‘collect and transport’ model of traditional waste services, and is able to assist industry in developing more efficient practices to manage material inputs at the front end of the industrial cycle. We expect to see a plateauing of waste generation per capita and a greater emphasis on whole of life product stewardship.
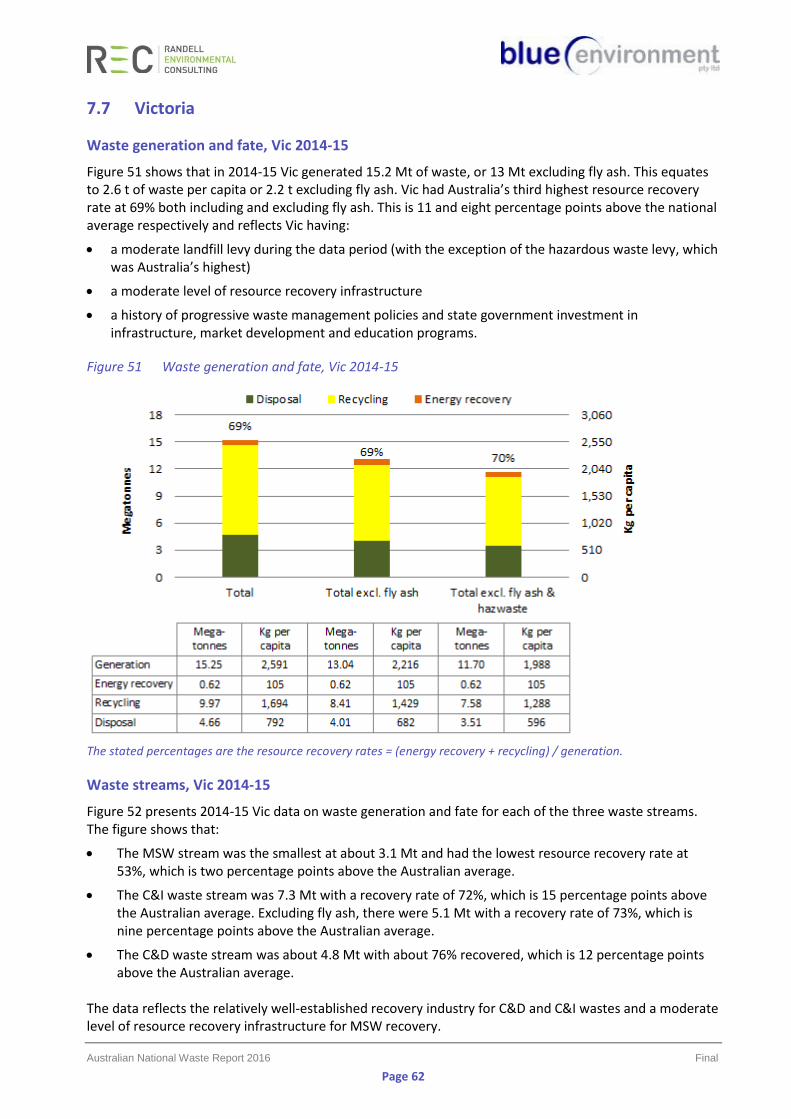
Australian National Waste Report 2016 Final
Page 62
7.7 Victoria
Waste generation and fate, Vic 2014-15
Figure 51 shows that in 2014-15 Vic generated 15.2 Mt of waste, or 13 Mt excluding fly ash. This equates to 2.6 t of waste per capita or 2.2 t excluding fly ash. Vic had Australia’s third highest resource recovery rate at 69% both including and excluding fly ash. This is 11 and eight percentage points above the national average respectively and reflects Vic having:
• a moderate landfill levy during the data period (with the exception of the hazardous waste levy, which was Australia’s highest)
• a moderate level of resource recovery infrastructure
• a history of progressive waste management policies and state government investment in infrastructure, market development and education programs.
Figure 51 Waste generation and fate, Vic 2014-15
The stated percentages are the resource recovery rates = (energy recovery + recycling) / generation.
Waste streams, Vic 2014-15
Figure 52 presents 2014-15 Vic data on waste generation and fate for each of the three waste streams. The figure shows that:
• The MSW stream was the smallest at about 3.1 Mt and had the lowest resource recovery rate at 53%, which is two percentage points above the Australian average.
• The C&I waste stream was 7.3 Mt with a recovery rate of 72%, which is 15 percentage points above the Australian average. Excluding fly ash, there were 5.1 Mt with a recovery rate of 73%, which is nine percentage points above the Australian average.
• The C&D waste stream was about 4.8 Mt with about 76% recovered, which is 12 percentage points above the Australian average.
The data reflects the relatively well-established recovery industry for C&D and C&I wastes and a moderate level of resource recovery infrastructure for MSW recovery.
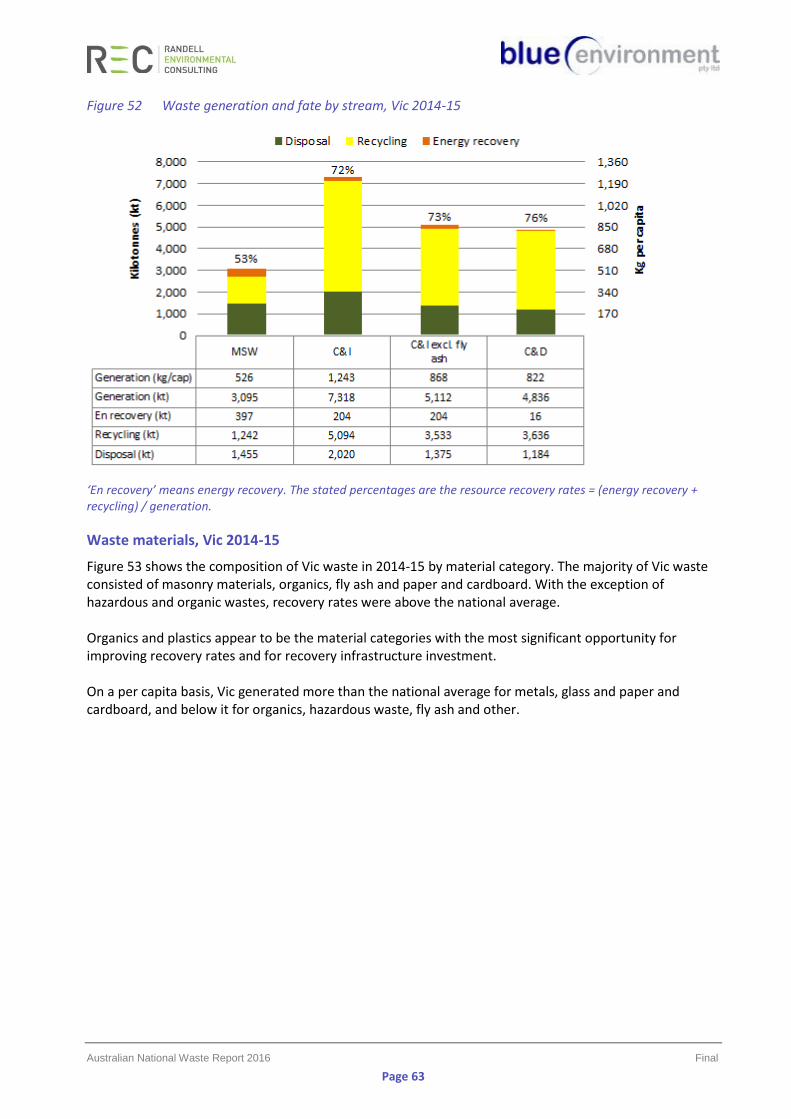
Australian National Waste Report 2016 Final
Page 63
Figure 52 Waste generation and fate by stream, Vic 2014-15
‘En recovery’ means energy recovery. The stated percentages are the resource recovery rates = (energy recovery + recycling) / generation.
Waste materials, Vic 2014-15
Figure 53 shows the composition of Vic waste in 2014-15 by material category. The majority of Vic waste consisted of masonry materials, organics, fly ash and paper and cardboard. With the exception of hazardous and organic wastes, recovery rates were above the national average. Organics and plastics appear to be the material categories with the most significant opportunity for improving recovery rates and for recovery infrastructure investment. On a per capita basis, Vic generated more than the national average for metals, glass and paper and cardboard, and below it for organics, hazardous waste, fly ash and other.
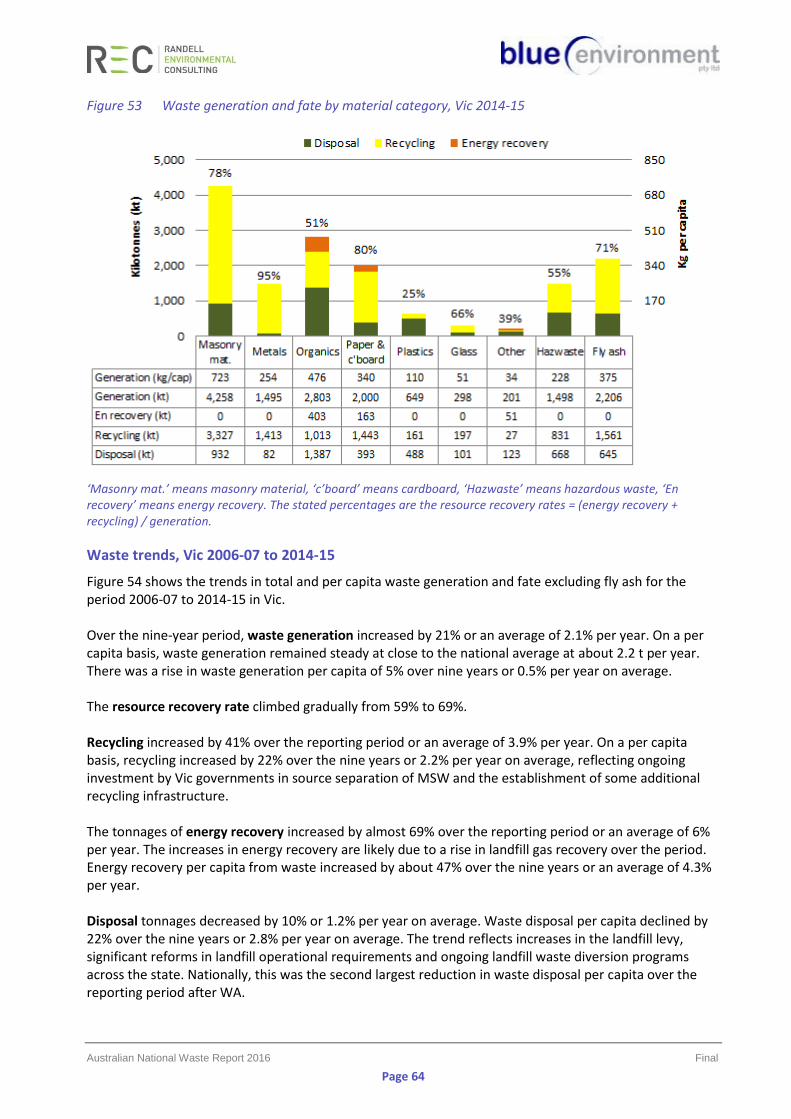
Australian National Waste Report 2016 Final
Page 64
Figure 53 Waste generation and fate by material category, Vic 2014-15
‘Masonry mat.’ means masonry material, ‘c’board’ means cardboard, ‘Hazwaste’ means hazardous waste, ‘En recovery’ means energy recovery. The stated percentages are the resource recovery rates = (energy recovery + recycling) / generation.
Waste trends, Vic 2006-07 to 2014-15
Figure 54 shows the trends in total and per capita waste generation and fate excluding fly ash for the period 2006-07 to 2014-15 in Vic. Over the nine-year period, waste generation increased by 21% or an average of 2.1% per year. On a per capita basis, waste generation remained steady at close to the national average at about 2.2 t per year. There was a rise in waste generation per capita of 5% over nine years or 0.5% per year on average. The resource recovery rate climbed gradually from 59% to 69%. Recycling increased by 41% over the reporting period or an average of 3.9% per year. On a per capita basis, recycling increased by 22% over the nine years or 2.2% per year on average, reflecting ongoing investment by Vic governments in source separation of MSW and the establishment of some additional recycling infrastructure. The tonnages of energy recovery increased by almost 69% over the reporting period or an average of 6% per year. The increases in energy recovery are likely due to a rise in landfill gas recovery over the period. Energy recovery per capita from waste increased by about 47% over the nine years or an average of 4.3% per year. Disposal tonnages decreased by 10% or 1.2% per year on average. Waste disposal per capita declined by 22% over the nine years or 2.8% per year on average. The trend reflects increases in the landfill levy, significant reforms in landfill operational requirements and ongoing landfill waste diversion programs across the state. Nationally, this was the second largest reduction in waste disposal per capita over the reporting period after WA.
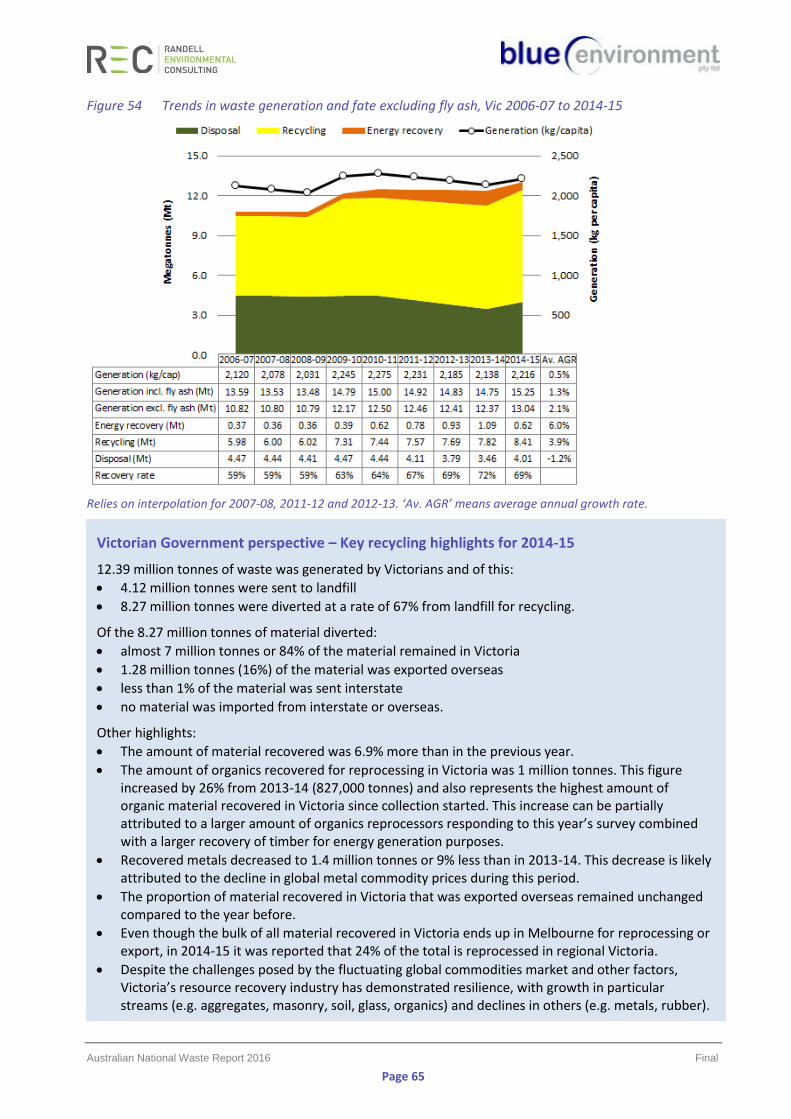
Australian National Waste Report 2016 Final
Page 65
Figure 54 Trends in waste generation and fate excluding fly ash, Vic 2006-07 to 2014-15
Relies on interpolation for 2007-08, 2011-12 and 2012-13. ‘Av. AGR’ means average annual growth rate.
Victorian Government perspective – Key recycling highlights for 2014-15
12.39 million tonnes of waste was generated by Victorians and of this:
• 4.12 million tonnes were sent to landfill
• 8.27 million tonnes were diverted at a rate of 67% from landfill for recycling.
Of the 8.27 million tonnes of material diverted:
• almost 7 million tonnes or 84% of the material remained in Victoria
• 1.28 million tonnes (16%) of the material was exported overseas
• less than 1% of the material was sent interstate
• no material was imported from interstate or overseas.
Other highlights:
• The amount of material recovered was 6.9% more than in the previous year.
• The amount of organics recovered for reprocessing in Victoria was 1 million tonnes. This figure increased by 26% from 2013-14 (827,000 tonnes) and also represents the highest amount of organic material recovered in Victoria since collection started. This increase can be partially attributed to a larger amount of organics reprocessors responding to this year’s survey combined with a larger recovery of timber for energy generation purposes.
• Recovered metals decreased to 1.4 million tonnes or 9% less than in 2013-14. This decrease is likely attributed to the decline in global metal commodity prices during this period.
• The proportion of material recovered in Victoria that was exported overseas remained unchanged compared to the year before.
• Even though the bulk of all material recovered in Victoria ends up in Melbourne for reprocessing or export, in 2014-15 it was reported that 24% of the total is reprocessed in regional Victoria.
• Despite the challenges posed by the fluctuating global commodities market and other factors, Victoria’s resource recovery industry has demonstrated resilience, with growth in particular streams (e.g. aggregates, masonry, soil, glass, organics) and declines in others (e.g. metals, rubber).
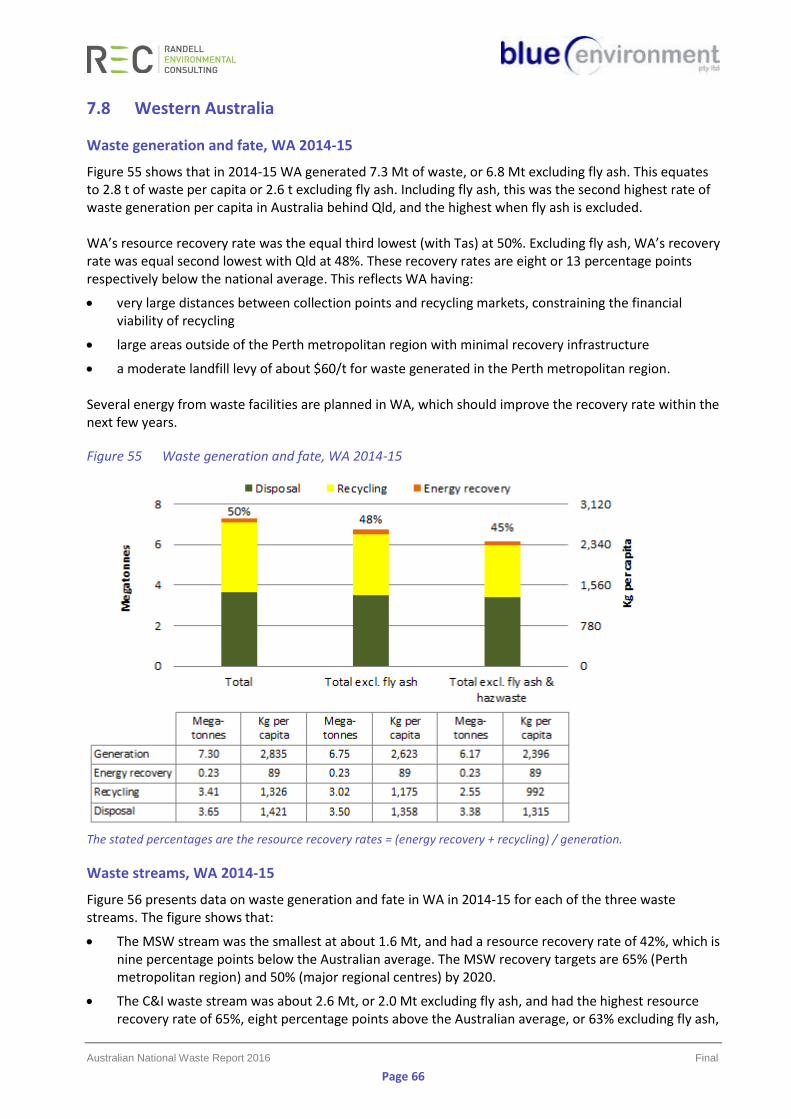
Australian National Waste Report 2016 Final
Page 66
7.8 Western Australia
Waste generation and fate, WA 2014-15
Figure 55 shows that in 2014-15 WA generated 7.3 Mt of waste, or 6.8 Mt excluding fly ash. This equates to 2.8 t of waste per capita or 2.6 t excluding fly ash. Including fly ash, this was the second highest rate of waste generation per capita in Australia behind Qld, and the highest when fly ash is excluded. WA’s resource recovery rate was the equal third lowest (with Tas) at 50%. Excluding fly ash, WA’s recovery rate was equal second lowest with Qld at 48%. These recovery rates are eight or 13 percentage points respectively below the national average. This reflects WA having:
• very large distances between collection points and recycling markets, constraining the financial viability of recycling
• large areas outside of the Perth metropolitan region with minimal recovery infrastructure
• a moderate landfill levy of about $60/t for waste generated in the Perth metropolitan region. Several energy from waste facilities are planned in WA, which should improve the recovery rate within the next few years.
Figure 55 Waste generation and fate, WA 2014-15
The stated percentages are the resource recovery rates = (energy recovery + recycling) / generation.
Waste streams, WA 2014-15
Figure 56 presents data on waste generation and fate in WA in 2014-15 for each of the three waste streams. The figure shows that:
• The MSW stream was the smallest at about 1.6 Mt, and had a resource recovery rate of 42%, which is nine percentage points below the Australian average. The MSW recovery targets are 65% (Perth metropolitan region) and 50% (major regional centres) by 2020.
• The C&I waste stream was about 2.6 Mt, or 2.0 Mt excluding fly ash, and had the highest resource recovery rate of 65%, eight percentage points above the Australian average, or 63% excluding fly ash,
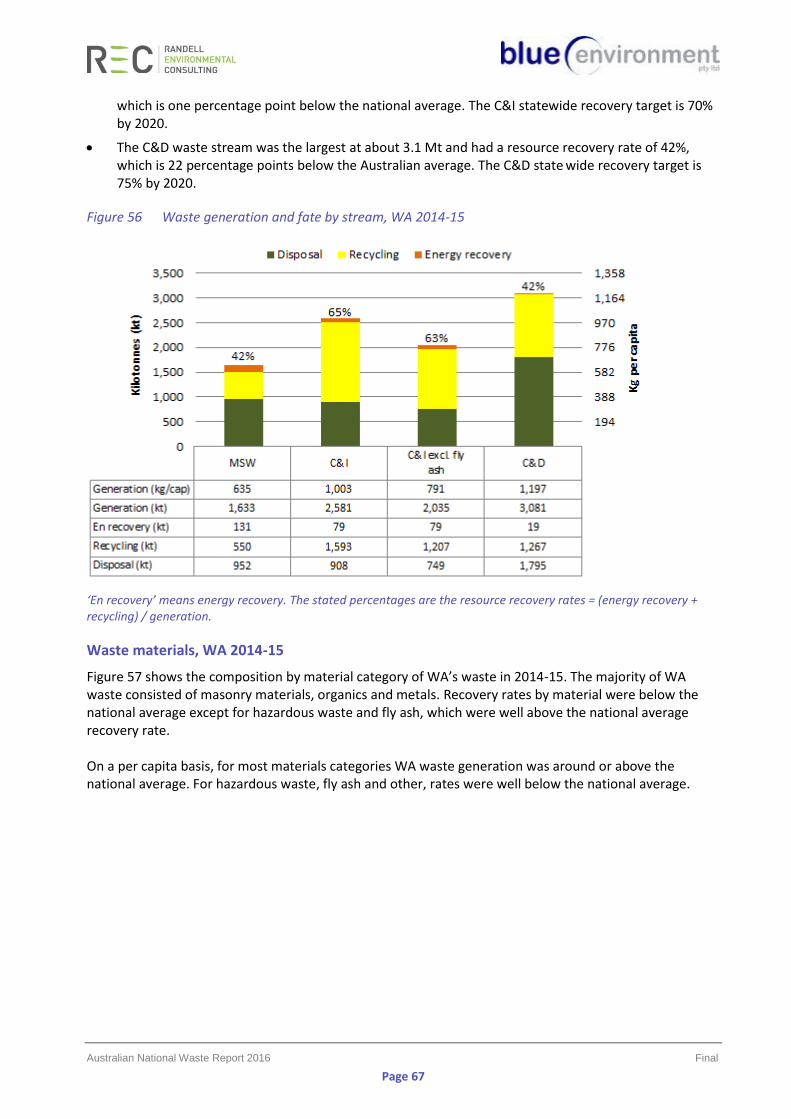
Australian National Waste Report 2016 Final
Page 67
which is one percentage point below the national average. The C&I statewide recovery target is 70% by 2020.
• The C&D waste stream was the largest at about 3.1 Mt and had a resource recovery rate of 42%, which is 22 percentage points below the Australian average. The C&D state wide recovery target is 75% by 2020.
Figure 56 Waste generation and fate by stream, WA 2014-15
‘En recovery’ means energy recovery. The stated percentages are the resource recovery rates = (energy recovery + recycling) / generation.
Waste materials, WA 2014-15
Figure 57 shows the composition by material category of WA’s waste in 2014-15. The majority of WA waste consisted of masonry materials, organics and metals. Recovery rates by material were below the national average except for hazardous waste and fly ash, which were well above the national average recovery rate. On a per capita basis, for most materials categories WA waste generation was around or above the national average. For hazardous waste, fly ash and other, rates were well below the national average.
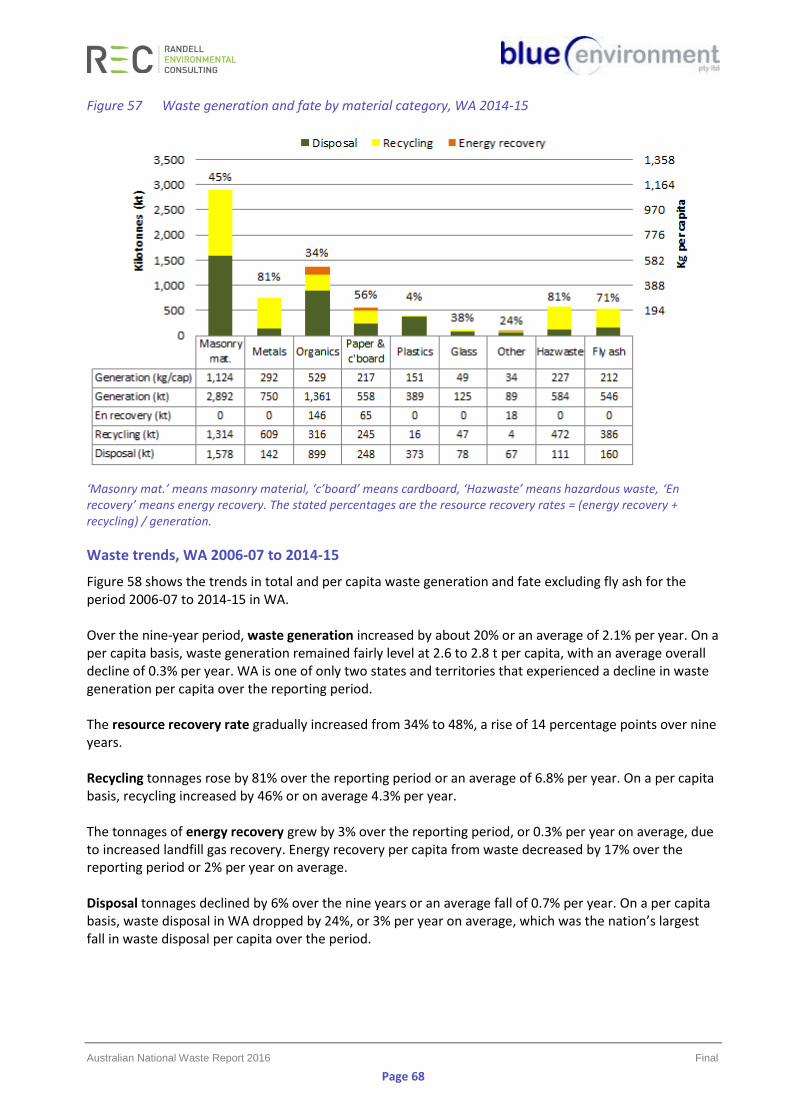
Australian National Waste Report 2016 Final
Page 68
Figure 57 Waste generation and fate by material category, WA 2014-15
‘Masonry mat.’ means masonry material, ‘c’board’ means cardboard, ‘Hazwaste’ means hazardous waste, ‘En recovery’ means energy recovery. The stated percentages are the resource recovery rates = (energy recovery + recycling) / generation.
Waste trends, WA 2006-07 to 2014-15
Figure 58 shows the trends in total and per capita waste generation and fate excluding fly ash for the period 2006-07 to 2014-15 in WA. Over the nine-year period, waste generation increased by about 20% or an average of 2.1% per year. On a per capita basis, waste generation remained fairly level at 2.6 to 2.8 t per capita, with an average overall decline of 0.3% per year. WA is one of only two states and territories that experienced a decline in waste generation per capita over the reporting period. The resource recovery rate gradually increased from 34% to 48%, a rise of 14 percentage points over nine years. Recycling tonnages rose by 81% over the reporting period or an average of 6.8% per year. On a per capita basis, recycling increased by 46% or on average 4.3% per year. The tonnages of energy recovery grew by 3% over the reporting period, or 0.3% per year on average, due to increased landfill gas recovery. Energy recovery per capita from waste decreased by 17% over the reporting period or 2% per year on average. Disposal tonnages declined by 6% over the nine years or an average fall of 0.7% per year. On a per capita basis, waste disposal in WA dropped by 24%, or 3% per year on average, which was the nation’s largest fall in waste disposal per capita over the period.
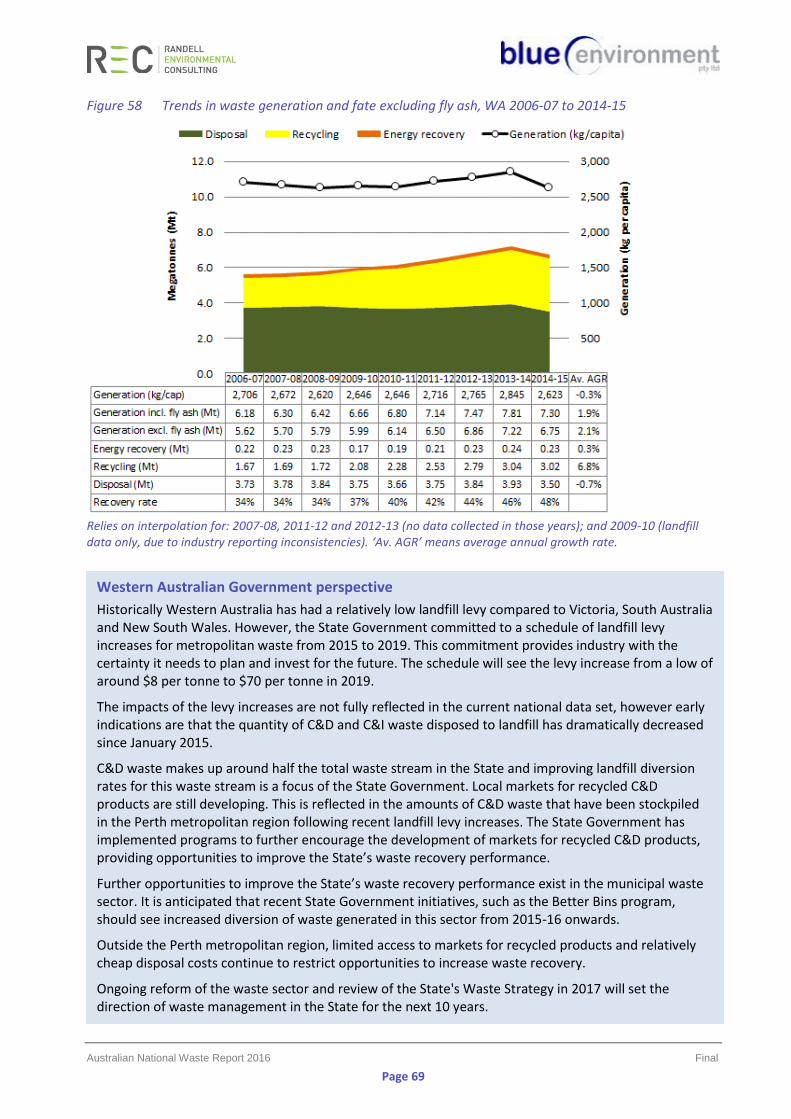
Australian National Waste Report 2016 Final
Page 69
Figure 58 Trends in waste generation and fate excluding fly ash, WA 2006-07 to 2014-15
Relies on interpolation for: 2007-08, 2011-12 and 2012-13 (no data collected in those years); and 2009-10 (landfill data only, due to industry reporting inconsistencies). ‘Av. AGR’ means average annual growth rate.
Western Australian Government perspective
Historically Western Australia has had a relatively low landfill levy compared to Victoria, South Australia and New South Wales. However, the State Government committed to a schedule of landfill levy increases for metropolitan waste from 2015 to 2019. This commitment provides industry with the certainty it needs to plan and invest for the future. The schedule will see the levy increase from a low of around $8 per tonne to $70 per tonne in 2019.
The impacts of the levy increases are not fully reflected in the current national data set, however early indications are that the quantity of C&D and C&I waste disposed to landfill has dramatically decreased since January 2015.
C&D waste makes up around half the total waste stream in the State and improving landfill diversion rates for this waste stream is a focus of the State Government. Local markets for recycled C&D products are still developing. This is reflected in the amounts of C&D waste that have been stockpiled in the Perth metropolitan region following recent landfill levy increases. The State Government has implemented programs to further encourage the development of markets for recycled C&D products, providing opportunities to improve the State’s waste recovery performance.
Further opportunities to improve the State’s waste recovery performance exist in the municipal waste sector. It is anticipated that recent State Government initiatives, such as the Better Bins program, should see increased diversion of waste generated in this sector from 2015-16 onwards.
Outside the Perth metropolitan region, limited access to markets for recycled products and relatively cheap disposal costs continue to restrict opportunities to increase waste recovery.
Ongoing reform of the waste sector and review of the State's Waste Strategy in 2017 will set the direction of waste management in the State for the next 10 years.
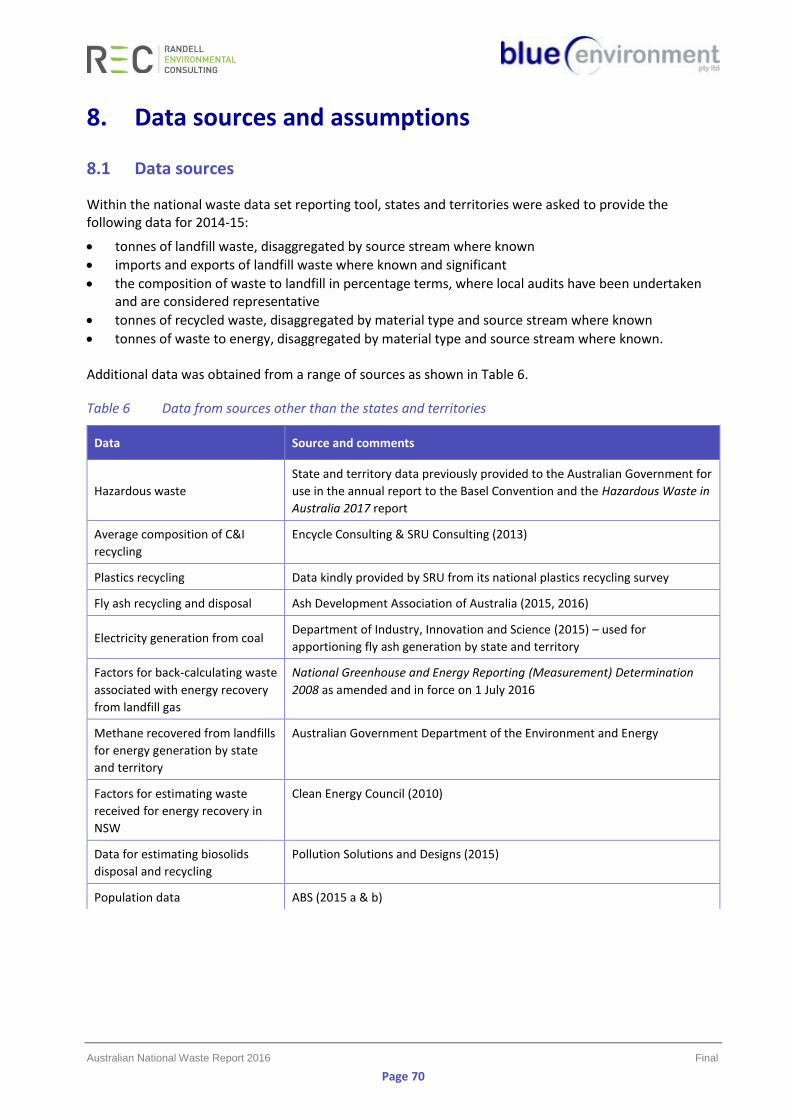
Australian National Waste Report 2016 Final
Page 70
8. Data sources and assumptions
8.1 Data sources
Within the national waste data set reporting tool, states and territories were asked to provide the following data for 2014-15:
• tonnes of landfill waste, disaggregated by source stream where known
• imports and exports of landfill waste where known and significant
• the composition of waste to landfill in percentage terms, where local audits have been undertaken and are considered representative
• tonnes of recycled waste, disaggregated by material type and source stream where known
• tonnes of waste to energy, disaggregated by material type and source stream where known. Additional data was obtained from a range of sources as shown in Table 6.
Table 6 Data from sources other than the states and territories
Data Source and comments
Hazardous waste
State and territory data previously provided to the Australian Government for
use in the annual report to the Basel Convention and the Hazardous Waste in
Australia 2017 report
Average composition of C&I
recycling
Encycle Consulting & SRU Consulting (2013)
Plastics recycling Data kindly provided by SRU from its national plastics recycling survey
Fly ash recycling and disposal Ash Development Association of Australia (2015, 2016)
Electricity generation from coal Department of Industry, Innovation and Science (2015) – used for
apportioning fly ash generation by state and territory
Factors for back-calculating waste
associated with energy recovery
from landfill gas
National Greenhouse and Energy Reporting (Measurement) Determination
2008 as amended and in force on 1 July 2016
Methane recovered from landfills
for energy generation by state
and territory
Australian Government Department of the Environment and Energy
Factors for estimating waste
received for energy recovery in
NSW
Clean Energy Council (2010)
Data for estimating biosolids
disposal and recycling
Pollution Solutions and Designs (2015)
Population data ABS (2015 a & b)
Australian National Waste Report 2016 Final
Page 71
8.2 Assumptions
Assumptions were needed to fill data gaps so that a complete national picture could be developed. These are described in the national waste data set reporting tool, which was endorsed by the states and territories, and is released with this report. The methods for gap-filling often included assuming that proportions or rates in a jurisdiction, time period, area or waste stream were similar to those in another, or had particular values. Specific assumptions for non-hazardous waste include the:
• Proportional change in waste generation per capita in each waste stream (MSW, C&I and C&D) between 2012-13 and 2013-14 in NSW was the same as the rest of Australia combined.
• Proportional split of recyclables by material and stream in NSW in 2014-15 were the same as in 2012-13.
• Composition of each waste stream (MSW, C&I and C&D) to landfill in the ACT, NSW, SA and Vic is as determined by each jurisdiction through their own landfill audits.
• Composition of each waste stream in NT, Qld, Tas and WA is based on national average figures calculated by assuming (a) the organic fraction and proportions are equal to those set out in the NGER (Measurement) Determination 5.11, and (b) the inert proportions are equal to the population-weighted average calculated from ACT, NSW, SA and Vic.
• Mass of waste associated with energy recovery from landfill gas can be estimated using NGER default values applied to non-hazardous wastes assuming instantaneous emission of methane.
• Default proportional splits of landfill waste into the three streams given in the NGER (Measurement) Determination 5.11 apply to NT, Qld and Tas.
Specific assumptions for hazardous waste are given in the national waste data set reporting tool in the worksheet ‘Other national data’. They include that:
• The proportions of each hazardous waste type sent to disposal, recycling, or energy recovery in each state or territory are equal to either: - the proportion of that waste type sent to that fate in 2014-15 where known and calculable or - the weighted average of that waste type sent to that fate in 2014-15 as recorded in NSW, Qld,
Vic and WA waste tracking systems (considered the best estimate).
In calculating these proportions, waste classified according to the management codes ‘chemical or physical treatment’, ‘storage or transfer’ and ‘other’ are ignored. These proportions are calculated from NSW, Qld and Vic waste tracking system data from 2014-15.
• Some waste recorded in tracking systems is double-counted because it is sent to more than one facility. This proportion needs to be subtracted from the total to derive waste generation. The proportion to be subtracted is equal to the proportion of each waste type that was sent to waste codes associated with waste transfer in Qld and Vic in 2014-15. This amounts to 20% of hazardous waste arisings recorded in tracking systems.
• Hazardous wastes, including biosolids, are assumed to be sourced from the C&I stream except N120 contaminated soils and N220 asbestos, of which 72% and 54% respectively are assumed to be sourced from C&D waste. This is based on data from SA and Vic, which states run tracking systems that cover these wastes and record waste fate.
Australian National Waste Report 2016 Final
Page 72
Bibliography
This bibliography incorporates references from the national waste data reporting tools used in compiling this report.
ABS (Australian Bureau of Statistics 2015) Australian Demographic Statistics, publication 3101.0, December, available from: http://www.abs.gov.au/AUSSTATS/[email protected]/DetailsPage/3101.0Mar%202016?OpenDocument
ABS (Australian Bureau of Statistics 2015) Australian National Accounts: State Accounts, 2014-15, publication 5220.0, November, available from: http://www.abs.gov.au/AUSSTATS/[email protected]/DetailsPage/5220.02014-15?OpenDocument
ABS (Australian Bureau of Statistics 2015) Regional population growth, Australia, publication 3218.0, March, available from: http://www.abs.gov.au/AUSSTATS/[email protected]/DetailsPage/3218.02014-15?OpenDocument
ABS (Australian Bureau of Statistics 2016) Australian Environmental-Economic Accounts, 2016, publication 4655, available from: http://www.abs.gov.au/AUSSTATS/[email protected]/DetailsPage/4655.02016?OpenDocument
ACT Government (2016) Waste Minimisation (Fees) Determination 2016 (No 1), available from: http://www.legislation.act.gov.au/di/2016-161/current/pdf/2016-161.pdf
Ash Development Association of Australia (2015) Annual membership survey results 2014, HBM Group Pty Ltd, Wollongong, available from: www.adaa.asn.au/resource-utilisation/ccp-utilisation
Ash Development Association of Australia (2016) Annual membership survey results 2015, HBM Group Pty Ltd, Wollongong, available from: www.adaa.asn.au/resource-utilisation/ccp-utilisation
Australian Press Council (2008) State of the News Print Media in Australia, available from: http://www.presscouncil.org.au/uploads/52321/state-of-the-news-print-media-2008.pdf
BE & AWE (Blue Environment and Ascend Waste and Environment 2017) Hazardous Waste in Australia 2017 (unpublished at the time of writing)
BE & REC (Blue Environment and Randell Environmental Consulting 2014) Waste generation and resource recovery in Australia, prepared for the DSEWPaC (now DoEE), February, available from: https://www.environment.gov.au/system/files/resources/4b666638-1103-490e-bdef-480581a38d93/files/wgrra.pdf
Blue Environment, Ascend Waste and Environment, and Randell Environmental Consulting (2015a) Hazardous Waste in Australia, 2012-13 data, prepared for the Department of the Environment, available from: http://www.environment.gov.au/system/files/resources/9ae68d42-d52e-4b1d-9008-111ad8bacfea/files/hazardous-waste-australia.pdf
Blue Environment, Ascend Waste and Environment, and Randell Environmental Consulting (2015b) Hazardous waste infrastructure needs and capacity assessment, prepared for the Department of the Environment, available from: https://www.environment.gov.au/system/files/resources/8d295260-d9af-46c6-9a3a-824c2fedfb64/files/hazardous-waste-infrastructure-needs-capacity-assessment.pdf
Blue Environment, Ascend Waste and Environment, and Randell Environmental Consulting (2016) Reporting hazardous waste under the Basel Convention – guidance to states, territories and the Commonwealth (2014 data), prepared for the Department of the Environment, June, available from: https://www.environment.gov.au/system/files/resources/74c62aad-77c0-4663-9838-1ebdcf38732a/files/basel-reporting-guide-2014-data.pdf
CEC (Clean Energy Council, 2010) Bioenergy Industry, prepared by Stephen Schuck, June
Danish Government (2013) Denmark without waste, prepared by Ministry of Environment and Food of Denmark Environmental Protection Agency, November, available from: http://eng.mst.dk/media/mst/Attachments/Ressourcestrategi_UK_web.pdf
Australian National Waste Report 2016 Final
Page 73
Department of Environment and Climate Change NSW (2007) Report into the Construction and Demolition Waste Stream Audit 2000-2005, available from: http://www.epa.nsw.gov.au/resources/waste/070320-constr-demolition.pdf
Department of Environment and Climate Change NSW (2010) Disposal based survey of the commercial and industrial waste stream in Sydney, available from: http://www.epa.nsw.gov.au/resources/warrlocal/100005-waste-survey-pt1.pdf
Department of Environment and Heritage Protection Qld (2016) State of Waste and Recycling in Queensland 2015, available from: https://www.ehp.qld.gov.au/waste/pdf/state-of-waste-report-2015.pdf
Department of Environment Regulation WA (n.d) Landfill levy rates to rise from January 2015, available from: https://www.der.wa.gov.au/about-us/media-statements/112-landfill-levy-rates-to-rise-from-january-2015
Department of the Environment and Energy (2013) National Waste Reporting 2013, available from: http://www.environment.gov.au/topics/environment-protection/nwp/reporting
Department of the Environment and Energy (n.d) Product stewardship, available from: https://www.environment.gov.au/protection/national-waste-policy/product-stewardship
Department of Industry, Innovation and Science (2015) Australian Energy Update, Canberra, August, available from: http://www.industry.gov.au/Office-of-the-Chief-Economist/Publications/Pages/Australian-energy-statistics.aspx#
Encycle Consulting & SRU Consulting (2013) A Study into Commercial and Industrial Waste and Recycling in Australia by Industry Division, prepared for the DSEWPaC (now DoEE), January, available from: www.environment.gov.au/system/files/resources/91b2180c-b805-44c5-adf7-adbf27a2847e/files/commercial-industrial-waste.pdf
EPA NSW (2014) Domestic kerbside waste and recycling in NSW, available from: http://www.epa.nsw.gov.au/resources/warrlocal/140442-audits-2011.pdf
EPA NSW (2016) Environmental Guidelines Solid waste landfills, edition 3, NSW, April, available from: http://www.epa.nsw.gov.au/resources/waste/solid-waste-landfill-guidelines-160259.pdf
EPA NSW (2016) Waste levy, available from: http://www.epa.nsw.gov.au/wasteregulation/waste-levy.htm
EPA SA (Environmental Protection Agency of South Australia 2016) Waste levy, available from: http://www.epa.sa.gov.au/business_and_industry/waste-levy
EPA Victoria (2016) Landfill and prescribed waste levies, October, available from: http://www.epa.vic.gov.au/your-environment/waste/landfills/landfill-and-prescribed-waste-levies
EPA Victoria (2016) Prescribed industrial waste classifications, July, available from: http://www.epa.vic.gov.au/business-and-industry/guidelines/waste-guidance/prescribed-industrial-waste-classifications
Hyder Consulting (2011) Assessment of Waste Infrastructure and Services Options for the ACT, prepared for Environment and Sustainable Development Directorate ACT, available from: http://www.environment.act.gov.au/__data/assets/pdf_file/0009/576918/AA004437_R03-02_ACT_Waste_Scenarios_Analysis_FINAL_REPORT.pdf
Hyder Consulting (2012) Waste Definitions and Classifications, Report on Issues, Opportunities and Information Gaps, prepared for the DSEWPaC (now DoEE), February, available from: http://www.environment.gov.au/system/files/resources/d05aa2d3-be01-44f3-904b-04dd09e9b0a1/files/waste-classification-gaps-part1.pdf
Institute for Sustainable Futures at the University of Technology Sydney (2011) National Food Waste Assessment, prepared for DSEWPaC (now DoEE), available from: https://www.environment.gov.au/system/files/resources/128a21f0-5f82-4a7d-b49c-ed0d2f6630c7/files/food-waste.pdf
Australian National Waste Report 2016 Final
Page 74
Ministry for the Environment (2007) Environment New Zealand 2007, section 02, available from: http://www.mfe.govt.nz/publications/environmental-reporting/environment-new-zealand-2007
OECD Data (2016) Municipal waste, available from: https://data.oecd.org/waste/municipal-waste.htm
OECD.Stat (2016) Municipal waste, Generation and Treatment, available from: http://stats.oecd.org/index.aspx?r=389695
OECD.Stat (2016) Population, available from: http://stats.oecd.org/index.aspx?r=389695
O’Farrell, Kyle, pers. comm. pre-publication data from the annual plastics recycling survey
Plastics and Chemicals Industry Association (2013) 2011-12 National Plastics Recycling Survey, prepared by SRU, available from: http://www.pacia.org.au/reports/plasticsrecyclingsurvey
Pollution Solutions and Designs (2015) Biosolids Production in Australia October 2015, prepared for the Australia & New Zealand Biosolids Partnership, available for members only from http://www.biosolids.com.au/
SRU (Sustainable Resource Use 2012) Australian Waste Definitions, prepared for the DSEWPaC (now DoEE), May, available from: http://www.environment.gov.au/system/files/resources/f3403579-8378-418d-8410-6578749189c6/files/australian-waste-definitions.pdf
Statistics Norway (2016), Waste accounts, 2014, available from: https://www.ssb.no/en/natur-og-miljo/statistikker/avfregno/aar/2016-05-25
Sustainability Victoria (2015) Statewide Waste and Resource Recovery Infrastructure Plan Victoria 2015-44, available from: http://www.sustainability.vic.gov.au/our-priorities/statewide-waste-planning/2015-2020-priorities/statewide-waste-and-resource-recovery-infrastructure-plan
Sustainability Victoria (2015) Victorian Recycling Industries Annual Survey 2013-14.
Switzerland Global Enterprise (2014) UK Waste Sector Report, prepared by LRS Consultancy, available from: http://www.s-ge.com/sites/default/files/private_files/BBK_Waste_management_report_UK_0.pdf
US EPA (2003) Estimating 2003 Building – related construction and demolition materials amounts, available from: https://www.epa.gov/sites/production/files/2015-11/documents/cd-meas.pdf
US EPA (2015) Advancing Sustainable Management: Facts and Figures 2013, June, available from: https://www.epa.gov/sites/production/files/2015-09/documents/2013_advncng_smm_rpt.pdf
Waste Authority Western Australia (2014) Waste and Recycling Infrastructure Plan for the Perth Metropolitan and Peel Regions Investigations Report, available from: http://www.wasteauthority.wa.gov.au/media/files/documents/SWIPWG_Investigation_Report.pdf
Waste Authority Western Australia (2015) Recycling Activity in Western Australia 2013-14, prepared by ASK Waste Management, available from: http://www.wasteauthority.wa.gov.au/publications/recycling-activity-2014-15
Waste Authority Western Australia (2016) Recycling Activity in Western Australia 2014-15, prepared by ASK Waste Management, available from: http://www.wasteauthority.wa.gov.au/publications/recycling-activity-2014-15
Zero Waste South Australia (2007) Disposal Based Survey Zero Waste SA October/November, prepared by Waste Audit and Consultancy Services (Aust), available from: www.zerowaste.sa.gov.au/upload/resources/publications/landfill/Landfill_Audit_2007_1.pdf
Zero Waste South Australia (2009) ZWSA Food Waste Pilot Kerbside Audit 2008-2009 Master Report, prepared by EC Sustainable
Zero Waste South Australia (2016) South Australia’s Waste and Resource Recovery Infrastructure Plan Consultation Draft, September, available from: http://www.zerowaste.sa.gov.au/About-Us/waste-resource-recovery-infrastructure-plan-consultation-draft