Embed Size (px)
Citation preview
- • *
COMMONWEALTH OF AUSTRALIA ^ " ' •> '»"
ARL-Tft—oSG
DEPARTMENT OF HKAI.TH, HOI SIN(i &
COMMUNITY SERVICES
Properties of Plutonium-Contaminated Particles Resulting from British Vixen B Trials at Maralinga
by
Peter A. Burns"1", Malcolm B. Cooper"1", Peter N. Johnston* and Geoffrey A. Williams +
Australian Radiation Laboratory Lower Plenty Road, Yallambie, Victoria 3085
Telephone: (03) 433 2211 Facsimile: (03) 432 1835
AUSTRALIAN RADIATION LABORATORY
Properties of Plutonium-Contaminated Particles Resulting from British Vixen B Trials at Maralinga
by
Perer A. Burns,"*" Malcolm B. Cooper,+ Peter N. Johnston* and Geoffrey A. Williams"*"
+ Australian Radiation Laboratory * Department of Applied Physics,
Royal Melbourne Institute of Technology, Melbourne
ARL/TR086 LOWER PLENTY ROAD ISSN 0157-1400 YALLAMBIE VIC. 3085 DECEMBER 1990 TEL: (03) 433 2211

-«. ,J 1'-
ABSTRACT
Since 1984 a number of studies have been performed to investigate residual contamination at the former atomic weapons test site at Maralinga in South Australia, and to aid in the rehabilitation of the area. The largest site of plutonium contamination at Maralinga results from twelve Vixen B trials conducted at Taranaki in 1960, 1961 and 1963. Plutonium was dispersed along four major plumes from these trials. Many of the rehabilitation studies are based on measurements of z^ 1Am which is a contaminant in the plutonium dispersed from these trials. Measurements of the ratios of activities of 2 3 9Pu and z*°Pu to 2^ 1Am are presented for the plumes. These are identified with individual trials where possible. Some measurements have also been made of 2-*JU activities.
From the present work and earlier data (Johnston et al., 1968), recoirrrendej mean values (valid at end 1988) for the 2-i'Pu/z^1Am activity ratios are 6.8 for the north-west plume and 8.0 for the west plume. The north and north-east plumes contain material with widely differing isotopic content of actinides. For the north-east plume the activity ratio of 239pu/241Am £ s i n t\xB range of 6 to 12, while in the north plume values range from 6 to 22.
Recommended mean values (valid at end 1988) for the 2^°Pu/ 2^Am activity ration, based on the present work and earlier data (Johnston et al., 1988), are 1.0 for the north-west plume and 1.2 for the west plume. For the north and north-east plumes, a spread of values for the 2^°Pu/2**Am activity ratio is found, with values of either 0.9 or 1.5 in the north-east plume and a range 0.8 to 2.0 for the north plume.
An examination of meteorological anu health physics survey data suggests that the most extensive part of the north-west plume results from a single trial, viz. Vixen B2 round 5 of 1961. It appears that the level of contamination in this plume was augmented by rainout of material, and the extent of the plume was enhanced by the considerable windspeed at the time.
Results of proton-induced X-ray emission spectroscopy (PIXE), which provides elemental content and maps of the distribution of elements on the surface of some of the active particles, are presented, together with some other physical characteristics of the particles, in the expectation that these will aid in hazard assessment and with the development of techniques to rehabilitate the Taranaki site at Maralinga.
INTRODUCTION
As a result of the recommendations of the Royal Commission into British Nuclear Weapons Tests in Australia, the Australian and British Governments established a Technical Assessment Group (TAG) to investigate the rehabilitation of the former atomic weapons test sites at Haralinga and Emu in South Australia.
The major difficulties in rehabilitating the Haralinga site come from contamination of some areas with plutonium. Direct determination of plutonium activity by detection of its emissions from radioactive decay is very difficult because of the low abundance of gamma-rays from the decay of Z 3 9Pu and 2 °Pu, and the extensive radiochemistry necessary for analysis by alpha spec ro.T.etry. However, a contaminant in the plutonium, 2*1Am, can be readily detected by the 59.54 keV gamma-ray from its decay. Many recent studies at Maralinga have relied upon detection cf the 2^Am gamma-ray to determine the quantity and distribution of plutonium.
In a previous report (Johnston et al., 1988) measurements of the activity ratios of 2 3 9Pu/ 2^ 1Am and 2^°Pu/2^^Am were reported for numerous plutonium contair.Lnated sites at Marajinga and Emu. At all of the sites other than Taranaki, the isotopic composition of actinides appears to be described by a jingle set of values. At Taranaki the isotopic composition of actinides varies over the site.
Taranaki was the site of one nuclear weapon test (major trial) with a yield of approximately 27 kiloton on 9 October 1957 and later It was the site of twelve Vixen B safety shots (minor trials). In the major trial the device was suspended from balloons and was detonated at 30C m above the ground. There was very little contamination of the area at ground zero other than short-lived activation products and consequently the area was re-used for a series of Vixen B minor trials in 1960, 1961 and 1963.
The purpose of the Vixen B trials was to assess the effects of the accidental detonation of a nuclear weapon by explosive initiation at a single point (McLean, 1961). These trials produced little or no nuclear yield. However, a jet of material was ejected from the test device and the experiment was arranged so that this jet went almost vertically upward. These jets were visible to about 500 feet and subsequently were swept up with
m -. •>• in... . .
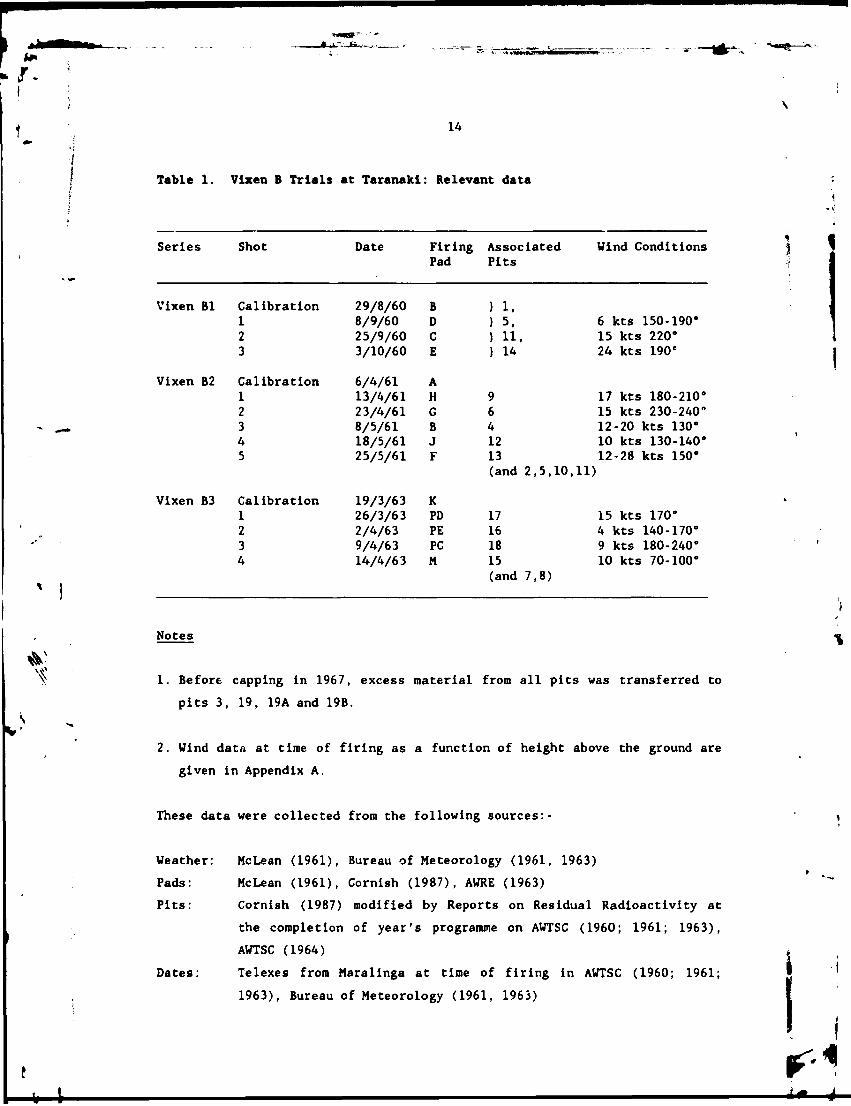
the clouds from the explosion which rose to heights above 2500 feet. The twelve Vixen B trials were fired with wind directions ranging from south-west to east through south and have resulted in four major tracts of contaminated land, or plumes, on which plutonium can be detected for many kilometres from the detonation sites. Some details of the trials are , iven in Table 1.
Measurements made in 1984 on soil samples collected from within a few hundred metres of the firing pads (Cooper et al., 1985) were analysed to produce a recommended value of 7.4 ± 0.6 for the ratio of "'Pu to 2^^Am activities in samples from Taranaki. These measurements were supplemented by data on sub-millimetre particles collected from the same area at Taranaki in 1988 (Johnston et al., 1988) for use in a TAG bioavailability study, and on some particles previously collected from this inner area. These measurements confirmed that the plutonium used in the Vixen B trials varied considerably in isotopic composition. Because the plutonium contamination at Taranaki represents the largest radiological hazard at Maralinga, measurements have now been made on sub-millimetre particles from each of the defined plumes to assess the isotopic composition(s) in these areas.
Since 1984, the UK Atomic Weapons Research Establishment (AWRE), Aldermaston, have provided some data (AWRE, 1984; BDRSS, 1986; Cornish, 1987) indicating that the 2 3 9Pu/ 2^Am activity ratios were much higher for the first series of Vixen B trials than the later two series which have ratios similar to the estimate given above.
All available data are brought together in this report to give estimates of 2 3 9Pu/ 2^ 1Am ratios in the individual plumes of contamination at Taranaki together with values that may be applicable to material in some pits.
Analyses have been undertaken to examine physical characteristics of the particles found in the plumes at Taranaki. Results of these analyses are presented and deductions are made about the nature of the sub-millimetre particles found around Tara.iaki.
ARCHIVAL DATA
There is considerable interest in the distribution of plutonium from the Vixen B trials. This interest has caused several people in Australia and the United Kingdom to research archival material available to them to set down details of the minor trials conducted at Taranaki (e.g. Cornish, 1987).

3
There were twelve Vixen B firings involving plutonium at Taranaki and a further three calibration rounds which involved natural uranium in 1960 and depleted uranium in 1961 and 1963 (Cornish, 1987). Three of the trials involving plutonium were conducted in 1960 (Vixen Bl), five were conducted in 1961 (Vixen B2) and four were conducted in 1963 (Vixen B3). The firing pads used for these rounds, together with associated burial pits, are given in Table 1 and shown in Figure 1.
Australian archival data relevant to the Vixen B trials include meteorological data for 1961 and 1963 (Bureau of Meteorology, 1961; 1963) as well as Atomic Ueapons Tests Safety Committee (AWTSC) files which contain health physics survey and other data (AWTSC, 1960; 1961; 1963; 1964). Meteorological data for the 1960 Vixen Bl trials are in Mclean (1961).
A synouiii-s of the wind conditions at time of firing for each of the Vixen B trials is given in Table 1. The directions of close-in fallout for eac'.i round, covering the area from which active samples were collected for use in the measurements presented below, are shown in Figure 1. Wind data at time of firing are given as a function of height above the ground in Appendix A.
As part of the trials, ground surveys of deposited alpha-active material were performed to measure the distribution of contamination arising from the firings. Measurements were made at varying distances along the ring-road system around Taranaki and along the other bulldozed tracks in the forward area bounded by West Street, Twenty-fifth Avenue and East Street. These data were supplemented by air samples collected after each trial.
The health physics survey maps from the ground surveys, copies of which are held at the Australian Radiation Laboratory, show the individual plumes of deposited plutonium contamination arising from each round of the 1960 and 1963 Vixen B series. However, for 1961 only a composite map for the whole series is available.
Plots for the 1960 series (drawing no. 1, August 1960 - contamination from E ring road to Fifth Avenue; drawing no. k, September 1960 -contamination from I ring road to Twenty-fifth Avenue) indicate that material from rounds 1 and 3 went essentially northward while material from round 2 went north-easterly. McLean (1961) gives similar plots for the 1960 series, plus a plot showing the close-in contamination contours around firing pads C, 0 and E extending out to the C ring road (200 yards from the pads).
4
The composite health physics survey data (drawn on map PFE/RF/279) for 1961 shows most contamination in the north-westerly direction with another smaller area of contamination f the north-east. This map shows no northerly plume of contamination. The meteorological data for the firings indicate that the material from the first round went northerly, the material from the second went north-easterly, while material from the last three rounds went north-westerly. It appears that the extent and level of contamination in the north-west plume may have been enhanced by rainout of material from the last round of this series (Appendix A; Bureau of Meteorology, 1961).
Individual health physics survey sheets for each firing in the 1963 series (AWRE, 1963) indicate that material from rounds 1 and 3 went essentially northward. Material from round 2 was dispersed mainly in the north-westerly direction with a second plume going to the north-east, while material from the final round went westerly.
In summary, the archival data suggest that the north-east plume derives from Vixen Bl round 2, Vixen B2 round 2 and Vixen B3 round 2. The north plume is composed of Vixen Bl rounds 1 and 3, Vixen B2 round 1 and Vir.en B3 rounds 1 and 3. The north-west plume is composed of material from Vixen B2 rounds 3, 4 and 5 and Vixen B3 round 2, with the main contributor to the more extensive portion of the north-west plume probably being Vixen B2 roun^ 5. The west plume comes exclusively from Vixen B3 round 4.
It is obvious that the plumes that are composed of material from several firings are more extensive and broader than others. The paths of material deposition do not coincide and attempts to identify the characteristics of a plume, particularly close to the firing pads, may only identify properties of material from one of the firings in that general direction.
The last (fifth) round of the Vixen B2 series, fired from pad F on 25 May 1961, is thought to be largely responsible for the extensive contamination extending off range to the north west. At time of firing (1500 CST), the wind regime (Appendix A) up to 1500 ft was constant in direction (150 ± 3°) and the speed increased from 12 knots at 250 ft to a substantial 28 knots at 1500 ft. These wind data are consistent with extensive airborne transport of contamination in a north-westerly direction. Furthermore, the firing took place in circumstances of low cloud and rain showers (Bureau of Meteorology, 1961), conditions which would aid in the deposition of airborne
5
contamination. The other available meteorological data pertinent to this particular firing come from those tabulated (Bureau of Meteorology, 1961) for the firing of round 8 of the Vixen A series at VK60 (Uewak) at 2015 CST on 25 May 1961. These data indicate that five hours after the Vixen E firing, the wind was a constant 12 ± 2 knots, with direction varying steadily from 190* at 200 ft through 150' at 600 ft, 100* at 1300 ft, 70" at 1900 ft, to 40" at 2560 ft. Hence the contamination from the Vixen B firing of 25 May 1961 would be expected to be initially fairly narrowly defined in a north-westerly direction (150°), but over distances of 100 km and more the plume would be expected to become more diffuse and to have a more westerly bearing. Of the remaining three rounds which contributed to contamination in the northwesterly diiTec inn, Vixen B2 round 3 was conducted in conditions of quite strong wind (12-20 knots, 130°), with winds considerably less strong for the other two firings (Table 1).
The situation with the north plume is more confused. Figure 2 of McLean (1961), showing the plumes of contamination out to Fifth Avenue from the three Vixen Bl trials, suggests that rounds 1 and 3 both go initially north but that round 1, in particular, deviates to the west and is probably the source of a minor plume observed in the aerial survey (EG&G, 1988). The health physics survey sheet tor Vixen B3 round 1 suggests that this round also deviates to the west, passing through the intersection of West Street and Twenty-fifth Avenue. For each of the remaining three shots that were conducted with winds from the south, winds were strong enough that all could contribute to the main north plume and there remains great uncertainty regarding the composition of material in this plume. This is further discussed below in relation to measured isotopic ratios for this plume.
EXPERIMENTAL
Activity Ratios
Other than a few particles which had been isolated earlier in the course of other studies, samples were obtained in two ways. Firstly, sub-millimetre particles were hunted by use of a hand-held 50 mm diameter and 2mm thick Nal(Tl) detector connected to an Eberline 'RASCAL' scal r/ratemf-.ter. The window of the single channel analyser within the 'RASCAL' was set to cover the pulse-height range of the full-energy peaic of the 59.5 keV gamm*-ray from 2 4 1Am. The detector was held about 20 cm above the ground and particles were located by use of the audible increase in count-rate near the particle.
6
Secondly, in the course of collecting large samples of soil for the artificial dust-raising study of the TAG assessment of inhalation hazard (Williams, 1990), some particles were isolated.
Measurement and calibration details are given in Johnston et al. (1988). The locations at which fra„. en':s were found are defined in a number of ways; viz. by the site designated Area 3 (in Burns et al. , 1986), the ARL grid (defined in Bums et al., 1986; Williams, 1990), the sites used for high volume air sampling (HVAS) (Williams, 1990), and a site designated GNE which lies approximately 200 m south of Apu.
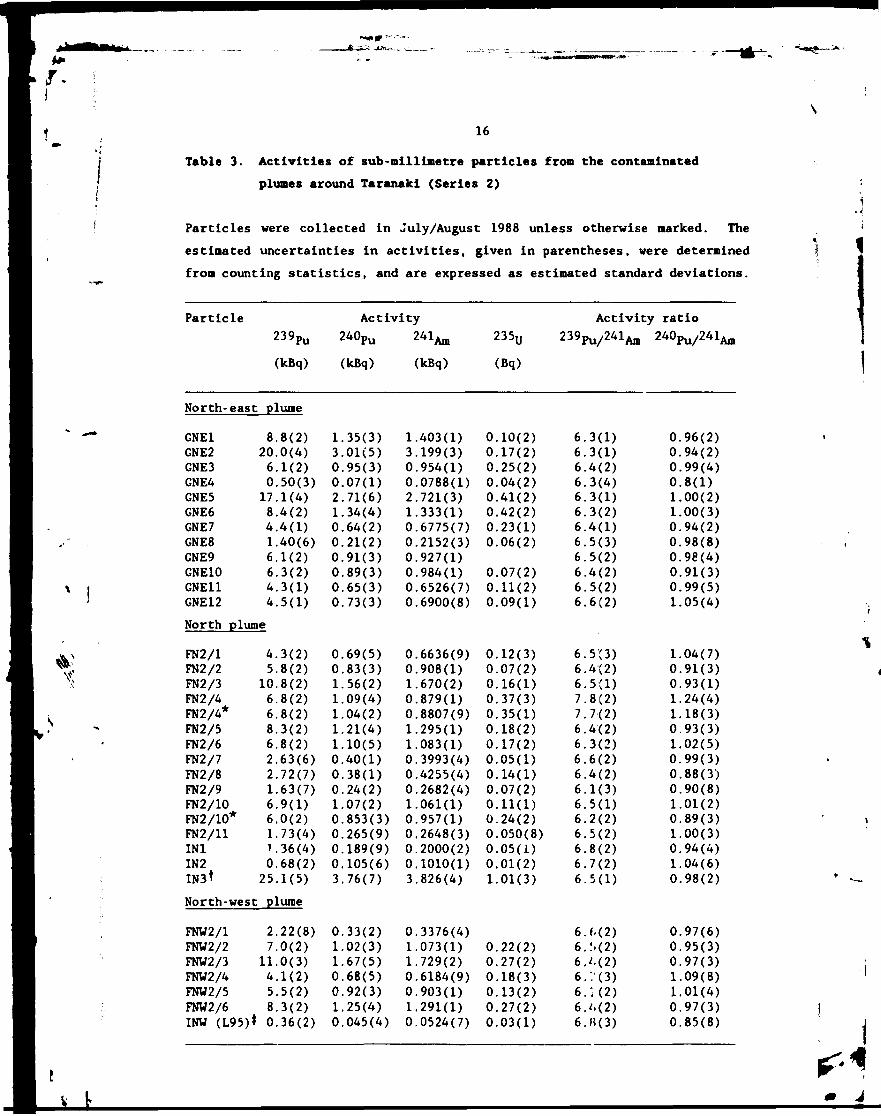
Results of these measurements are given in Tables 2 and 3. The activity ratios in these Tables are time dependent due mainly to the half life of 24lpu (14.4 y) and ^l^m (432.2 years), and therefore the ratios presented are valid for the time of measurement, viz. end 1988. These results are considered together with data presented in Johnston et al. (1988).
Physical characteristics
Five sub-millimetre particles were suitably mounted and analysed by the Micro Analytical Research Centre at The University of Melbourne by use of a proton microprobe. Proton-induced X-ray emission spectroscopy (PIXE) was used to provide elemental content and maps of the distribution of element.1: on the surface of the particles.
Four of these particles were from Taranaki, arising from the Vixen B minor trials, and one was from the Tadje major trial. The four from Taranaki were collected from the HVAS sites GNE, IN, INW and FW which range between 1500 and 5000 yards from th< firing sites and encompass each of the major plume directions.
In all cases, only a fraction of the particle was analysed. The area examined by PIXE analysis was 320 /im x 320 /im for the particle from GNE and 250 urn x 250 ^m for the other particles. For the four particles from Taranaki these areas were sufficient to cover most of one side of the particle, but not all. In addition, the proton beam only penetrated approximately 30 nm into the sample. Thus only a small fraction of uhe particle volume was sampled, probably of the order of ten percent. During the analyses, the particles were observed to be quite porous.

7
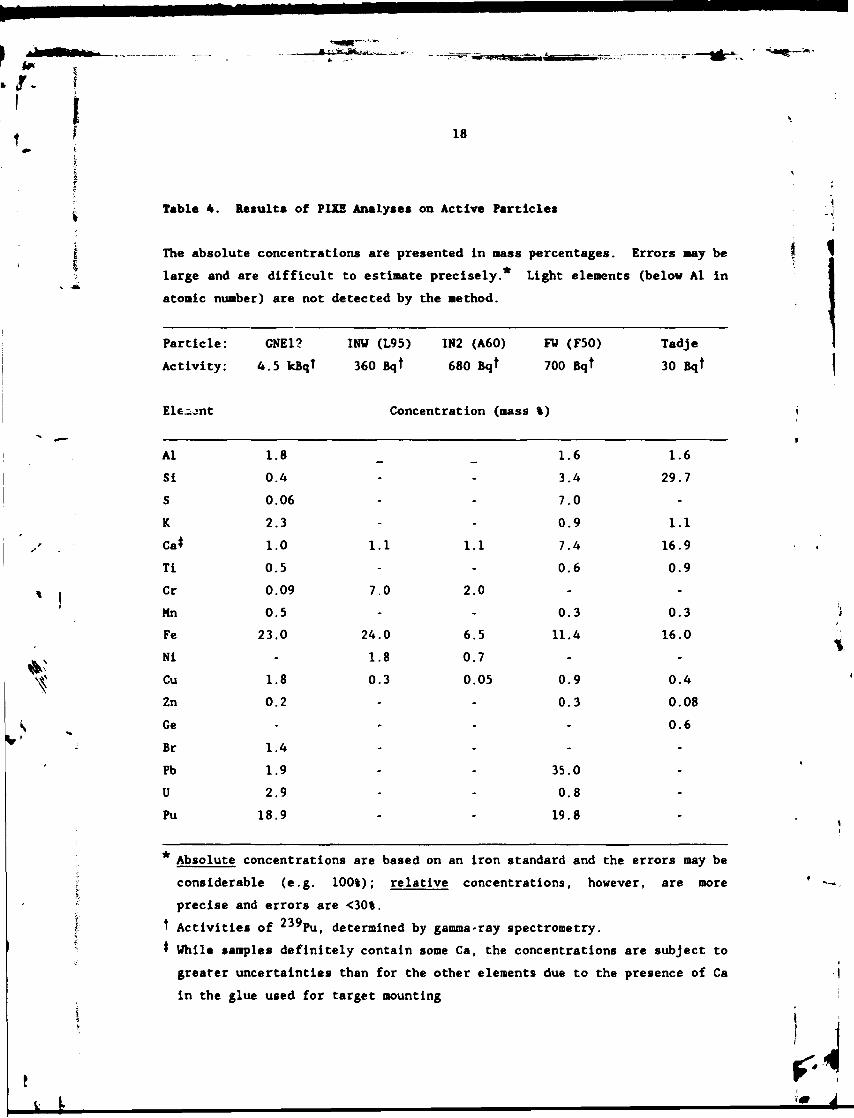
Results of the PIXE analyses are presented in Table 4. Unlike the sample from Tadje, none of the samples from Taranaki appear to contain soil. The total concentration of detected elements is much less than 100% for most of the samples. This is because of the presence of elements lighter than aluminium. Also the amount of calcium shown is distorted by the presence of calcium in the adhesive used in mounting the particles. The samples from INV and IN have a similar composition which is presumably some type of steel mixed or associated with other light elements. The sample from GNE appears to be a composite of steel, actinides and other device material. The sample from FW is mainly lead, actinides and other device material.
For those samples in which particular elements (e.g. Pu, U) were not observed, it is possible that those elements are still present but localised in the sa...;.ie beyond reach of the beam. For those samples in which plutonium and uranium were observed by the technique, the radioactive elements were homogeneously distributed across the surface of view.
Visual Inspection
Particles collected for bioavailability studies performed by the UK National Radiological Protection Board were visually examined to determine their size and appearance. These inspections were performed to assess whether there was any relationship between particle size and activity. The descriptions of the forty particles collected for these studies are given in Appendix B. There is no apparent link between activity and size. Activity measurements for these particles are reported in Johnston et al. (1988).
SUMMARY AND DISCUSSION
Activity ratios in the plumes
The measurements presented in Tables 2 and 3 are considered together with the data in Johnston et al. (1988). AWRE have indicated that the Vixen Bl series should have much higher activity ratios of 239p u/241 A m than the later series (BDRSS, 1986; Cornish, 1987). Measurements of this ratio from sub-millimetre particles found at U587 (22.3; Johnston et al., 1988), U317 (11.9; Johnston et al., 1988), and FN (11.5 at FNl/6; Table 2) are consistent with values given by AWRE and with the directions indicated by meteorological data and the health physics survey plots for rounds 1, 2 and 3 respectively of the
1960 series. No particles with comparably high 2 3*Pu/ 2 4*Am ratios were found in or near the north-west or west plumes.
Particles from the west plume indicate a value of 8.0 for the 2 3'Pu/ 2 4*Am activity ratio and 1.2 for the ^"Pu/^lAm ratio. The north-west plume is composed of material from several trials. Particles from U875, V1100, S1010, Area 3, FNW and INU yield 2 3 9Pu/ 2 4 1Am ratios in the range 6.1 to 7.4. The median of results in the north-west plume, 6.8, is recommended as the best estimate to use for the north-west plume. A mean value of 1.0 is observed for the 2 4 0Pu/ 2 4 1Am ratio.
Particles in the north-east plume have 2 3'Pu/ 2 4^Am activity ratios of either 6.5 or 12 and 2 4 0Pu/ 2 4 1Am ratios of either 0.9 or 1.5. All the particles sampled at FENE and GNE were nearer the lower values. However, this is probably due to bias of sampling sites rather than overall lack of material with the higher activity ratios. All of the particles from the less-remote site U317 had the highar values (Johnston et al., 1988).
Particles in the north plume have 2™Pu/ 2 4 1Am ratios ranging froa 6 to 22 and 2 4 0Pu/ 2 4^Am ratios ranging from 0.8 to 2.0. Most samples from the north plume appear to have come from trials which had lower values. It is clear, however, that examples of four different trials have been sampled, for example particles FN1/1 and others with 2 3 9Pu/ 2 4^Ara ratios of 6.5, FN2/4 (ratio 7.8), FNl/b (ratio 11.5) and those from U587 (ratio 22.3).
Meteorological data indicate that two of the shots which have 2^'Pu/24^Am activity ratios greater than 8, Vixen Bl/1 (empirical ratio ca. 22) and Bl/3 (empirical ratio 11.5), contribute to the north plume. However, as discussed above, the first of these does net appear to be the source of the most intense northerly plume but possibly constitutes a minor plume observed by the aerial survey (EG&G, 1988) that deviates west of the main plume some four to five kilometres north of the firing pads. The main north plume is probably from Vixen Bl/3, B2/i, B3/3, and perhaps B3/1, the latter rhree shots having 2 3 9Pu/ 2 4 1Am ratios between 6 and 8. In the present study, a large number of particles collecteJ from the north pluim to a distance of 5000 yards from central Taranaki all had ratios in the range 6 to 8 and only one was collected from the Vixen Bl/3 round with a ratio of 11.5 (FN1/6). This suggests that the main north plume does not result from Vixen Bl/3, but the possibility remains of sample bias and hence that some of the more remote contamination in this plume has a 2^ Pu/24*Ani ratio of 11.5.
«Wt-JsU._
In the inhalation dose assessment reported recently (Williams, 1990), a value of 8 for the "'Pu/^^Am activity ratio was taken as a reasonable conpromise for the more remote contamination in the north plume, together with a 2 4 0Pu/ 2 4 1Am ratio of 1.
The nature of the particles
The PIXE analyses of particles from close to Taranaki suggest that they are composed of material from the device that was exploded. In addition, the fact that actinides were only observed on two of the particles indicates that the others were only partially contaminated in parts of the particle not analysed. Also certain other features are not consistent from one element to another, for example the distribution of titanium in the particle from FW is different f\om that of other elements. Therefore one c?n conclude that these particles were not formed from recondensed material .ior even from molten material. However, fragments were probably combined at quite high temperatures where some material may have been plastic or partially molten.
It is known that a considerable quantity of beryllium was used in the Vixen B trials (Cornish, 1987) and that beryllium was used in the core of the devices from which the jet of material emerged in the trials. Beryllium may constitute a major part of the light elements which cannot be accounted for in the PIXE analyses.
It must be emphasised that the samples studied by PIXE are biased to particles from the most contaminated area at Taranaki, within a few kilometres of the firing pads, and no data are presented on the composition of smaller particles, such as could constitute an inhalation hazard, from further out in the plumes.
There is ample evidence from animal metabolic data and from in-vitro solubility studies (Williams, 1990) that 2^ 1Am in contamination from Tarar.aki can be expected to behave somewhat like plutonium in the human body. This is not surprising when it is considered that in this case the z^ 1Am has arisen from the transmutation of 2 ^ P u in situ, and hence the ^^An if, filling a plutonium site in a plutonium lattice and would be expected to behave as the plutonium host in terms of solubility. It is not consistent with ICRP (1988), however, which suggests that all americiu^ should be considered to be Class W (fairly soluble) foi the inhalation pathway, whereas high-tired

10
plutonium oxides such as we are dealing with at Maralinga are very insoluble (Class Y). The observation that Pu/Am activity ratios are consistent for a collection of diverse and widely-scattered particles from individual trials, despite weathering effects, is further evidence that the plutonium and americium within a particle have similar solubility properties.
' • 4

JkAS&JStaS:. - _
11
REFERENCES
AWRE (1963) 'AWRE H.P. Survey Sheet - Taranaki' for Vixen B3, 1963, Rounds LI, L2, L3 and LA on AWTSC (1963) (UNCLASSIFIED).
AWRE (1984) 'Maralinga Range - UK Experimental Programmes and Assessment Trials Involving the use of Plutonium 1959-1963', ref: D/AWRE/SFS/A/26 (MEP), 25 September 1984 (UK UNCLASSIFIED: NOT FOR PUBLICATION).
AWTSC (1960) Department of Supply File No. R57/6/38 'Atomic Weapons Tests Safety Committee - Assessment Tests at Maralinga during 1960 - Safety Aspects' (UNCLASSIFIED).
AWTSC (1961) Department of Supply File No. R57/6/42 'Atomic Weapons Tests Safety Committee - Maralinga Experimental Programme 1961 - Safety Aspects' (UNCLASSIFIED).
A'.TSC (1963) Department of Supply File No. R57/6/58 'Atomic Weapons Tests Safety Committee - Maralinga Experimental Programme 1963 - Safety Aspects' (UNCLASSIFIED).
AWTSC (1964) Several reports on residual radioactivity from 1964 on Department of Supply File No. R57/6/27 'Atomic Weapons Tests Safety Committee - Maralinga Range Health Physics Management' (UNCLASSIFIED).
BDRSS (1986) private communication of 21 May 1986, British Defence Research and Supply Staff, Canberra, ref: JAA/243/01/MAST (UK CONFIDENTIAL).
Bureau of Meteorology (1961) 'Assessment Tests - Maralinga 1961', Bureau of Meteorology File No. 60/9043.
Bureau of Meteorology (1°63) 'Maralinga Experimental Program 1963 Trials Results', Bureau of Meteorology File No. 63/9060.
Burns, P.A., Cooper, M.B., Duggleby, J.C., Mika, J.F. and Williams, G.A. (1986) 'Plutonium-Contaminated Fragments at the Taranaki Site at Maralinga'. Australian Radiation Laboratory Report ARL/TR075, July 1986.
12
Cooper, M.B., Burns, P.A., Williams, G.A., Lokan, K.H. and Duggleby, J.C. (1985) 'Plutonium Contamination at Maralinga', Chapter 1 in 'Residual Radioactive Contamination at Maralinga and Emu, 1985', ed. K.H. Lokan, Australian Radiation Laboratory Report ARL/TR070, April 1985.
Cornish, F.W. (1987) 'Review of Contamination and Possible Treatment Options at Maralinga', AWRE Report No. 023/86, Atomic Weapons Research Establishment, Aldermaston, Berks., U.K. (UK CONFIDENTIAL).
EG&G (1988) 'An Aerial Radiological Survey of Maralinga and Emu, South Australia', EG&G Energy Measurements Report No. AMO-8807, Nevada, October 1988.
ICRP (1988) 'Limits for Intakes of Radionuclides by Workers: an Addendum', ICRP Publication 30, Part 4, Annals of the ICRP, 19, No. 4 (Pergamon Press: Oxford).
Johnston, P.N., Burns, P.A., Cooper, M.B. and Williams, G.A. (1988) 'Isotopic Ratios of Actinides used in British Nuclear Trials at Maralinga and Emu', Australian Radiation Laboratory Report ARL/TR080, October 1988.
McLean, J. (1961) 'NS Group Report' in 'Operation Vixen Bl', AWRE Report No. T4/61 (Sanitized), United Kingdom Atomic Energy Authority, Atomic Weapons Research Establishment, Alderiraston, Berks, U.K. (UK UNCLASSIFIED).
Williams, G.A. (1990) (ed.) 'Inhalation Hazard Assessment at Maralinga and Emu', Australian Radiation Laboratory Report ARL/TR087, May 1990.

* • • ' - * » • - - • -
13
m-
ITS a <
Q. Q.
1/1 l/l UJ r 2 * ' o D *-u UJ
a •D o r> j o « i a _ i 10 IB r 4 » 01 s s
\ \ < " • / \ £ S i -
u # 0 2 at - m A
- - - -o ^ a.
n 8#
-\ 0 a • " a. UJ A
^PlT
rfc tf s#
»n
in
1 • a 1
/ >*• /
s"\'
I I
" • •
• o>
) I
z < or <
i 1
Pig. 1. Th* directions of close-in fallout from the 12 Vixen B firings at Taranaki, with associated firing pads.
-J*-*? <4»1H*MU.lWI
14
Table 1. Vixen B Trials at Taranaki: Relevant data
Series Shot Date Firing Associated Wind Conditions Pad Pits
Vixen Bl Calibration 29/8/60 B ) 1. 1 8/9/60 D ) 5, 6 kts 150-190° 2 25/9/60 C ) 11. 15 kts 220° 3 3/10/60 E } 14 24 kts 190'
Vixen B2 Calibration 6/4/61 A 1 13/4/61 H 9 17 kts 180-210° 2 23/4/61 G 6 15 kts 230-240° 3 8/5/61 B 4 12-20 kts 130° 4 18/5/61 J 12 10 kts 130-140° 5 25/5/61 F 13
(and 2 5,10 12-28 kts 150°
11)
Vixen B3 Calibration 19/3/63 K 1 26/3/63 PD 17 15 kts 170° 2 2/4/63 PE 16 4 kts 140-170° 3 9/4/63 PC 18 9 kts 180-240° 4 14/4/63 M 15
(and 7 8) 10 kts 70-100°
Notes
1. Before capping in 1967, excess material from all pits was transferred to pits 3, 19, 19A and 19B.
2. Wind data at time of firing as a function of height above the ground are given in Appendix A.
These data were collected from the following sources:-
Weather: Pads: Pits:
Dates:
McLean (1961), Bureau of Meteorology (1961, 1963) McLean (1961), Cornish (1987), AWRE (1963) Cornish (1987) modified by Reports on Residual Radioactivity at the completion of year's programme on AWTSC (I960; 1961; 1963), AWTSC (1964) Telexes from Maralinga at time of firing in AWTSC (1960; 1961; 1963), Bureau of Meteorology (1961, 1963)

M M marm-.-^- - -
15
Table 2. Activities of sub-millimetre particles from the contaminated plumes around Taranaki collected in Harch 1988 (Series 1)
The estimated uncertainties in activities, given in parentheses, were determined from counting statistics alone, and are expressed as estimated standard deviations.
Particle 239 Pu
Activity 240 Pu
(kBq) (kBq) 2^Am (kBq)
235, (Bq)
Activity ratio 239^/241^ 240^,241^
North-east plume
FENE1-1 4 0(1) 0.48(2) 0.5824(7) 0.11(3) 6.8(2) 0.82(4) FENE2-1 6.7(2) 0.81(5) 0.966(1) 0.18(4) 6.9(2) 0.84(5) FENE3-1 6.0(2) 0.80(4) 0.928(1) 0.12(3) 6.5(2) 0.86(4) FENE5-1 3.5(1) 0.46(2) 0.5421(6) 0.18(2) 6.5(2) 0.85(4) FENE1-2 4.8(1) 0.64(3) 0.7302(8) 0.13(3) 6.6(2) 0.88(4) FENE3-2 2.47(8) 0.33(2) 0.3719(4) 0.05(2) 6.6(2) 0.89(5) FENE6-2 3.6(1) 0.50(2) 0.5682(6) 0.08(2) 6.4(2) 0.88(4) FENE7-2 4.8(1) 0.57(3) 0.7208(8) 0.06(3) 6.7(2) 0.80(4) FENE1-3 3.6(1) 0.47(2) 0.5474(6) 0.09(2) 6.6(2) 0.85(4) FENE5-3 6.0(2) 0.77(6) 0.912(1) 0.27(3) 6.6(2) 0.85(4) FENE7-3 2.51(8) 0.32(2) 0.3784(5) 0.08(2) 6.7(2) 0.85(5) FENE5-5 3.5(1) 0.44(2) 0.5211(6) 0.03(3) 6.7(2) 0.85(4) NorLn plume
FN1/1 2.28(9) 0.29(2) 0.3543(4) 0.11(3) 6.4(2) 0.81(5) FN1/2 2.22(7) 0.28(2) 0.3513(4) 6.3(2) 0.80(5) FN1/3 51(1) 6.1(2) 7.669(8) 1.41(7) 6.6(2) 0.80(3) FN1/4 6.6(2) 0.83(5) 0.968(1) 0.08(4) 6.8(2) 0.86(5) FN1/5 5.5(2) 0.71(5) 0.862(1) 6.4(2) 0.83(5) FN1/6 26.5(6) 2.61(9) 2.298(2) 2.08(5) 11.5(3) 1.14(4) FN1/7 16.2(4) 2.17(9) 2.426(3) 0.58(5) 6.7(2) 0.89(4) FN1/8 14.2(4) ?..71(8) 2.175(2) 0.32(4) 6.5(2) 0.79(4) FN1/9 6.1(2) 0.74(5) 0.940(1) 0.21(4) 6.5(2) 0.79(5) FN1/10 1.74(6) 0.24(1) 0.2591(3) 0.04(2) 6.7(2) 0.95(6) FN1/11 2.05(7) 0.25(2) 0.3015(4) 0.08(2) 6.8(2) 0.83(5) FN1/14 16.1(4) 2.00(9) 2.408(3) 0.57(6) 6.7(2) 0.83(4) FNI/IS 7.8(2) 0.97(4) 1.212(1) 0.06(3) 6.4(2) 0.80(3) North-west plume
FNW1/1 3.0(1) 0.39(2) 0.4637(6) 0.12(3) 6.6(2) 0.84(5) INW1 3.2(1) 0.43(3) 0.5190(6) 0.05(3) 6.2(2) 0.84(5) INW2 1.36(4) 0.179(8) 0.1994(2) 0.02(2) 6.8(2) 0.90(4) INW3 1.42(4) 0.189(9) 0.2111(2) 0.05(2) 6.7(2) 0.89(4)
16
Table 3. Activities of sub-millimetre particles from the contaminated plumes around Taranaki (Series 2)
Particles were collected in July/August 1988 unless otherwise marked. The estimated uncertainties in activities, given in parentheses, were determined from counting statistics, and are expressed as estimated standard deviations.
P a r t i c l e A c t i v i t y Ac t iv i ty r a t i o 2 3 9 P u 2 4 0 P u 2"Am 235u 239PU/241A,, 2 ^ P u / 2 4 1 A m
(kBq) (kBq) (kBq) (Bq)
North-east plume
GNE1 8.8(2) 1 .35(3) 1.403(1) 0 .10(2) 6 .3 (1) 0 .96(2) GNE2 20.0(4) 3 .01(5) 3.199(3) 0 .17(2) 6 .3(1) 0 .94(2) GNE3 6.1(2) 0 .95(3) 0 .954(1) 0 .25(2) 6 .4(2) 0 .99(4) GNE4 0.50(3) 0 .07(1) 0.0788(1) 0 .04(2) 6 .3(4) 0 .8 (1 ) GNE5 17.1(4) 2 .71(6) 2.721(3) 0 .41(2) 6 .3(1) 1.00(2) GNE6 8.4(2) 1.34(4) 1.333(1) 0 .42(2) 6 .3(2) 1.00(3) GNE7 4 .4(1) 0 .64(2) 0.6775(7) 0 .23(1) 6 .4(1) 0 .94(2) GNE8 1.40(6) 0 .21(2) 0.2152(3) 0 .06(2) 6 .5(3) 0 .98(8) GNE9 6.1(2) 0 .91(3) 0 .927(1) 6 .5(2) 0 .98(4) GNE10 6.3(2) 0 .89(3) 0 .984(1) 0 .07(2) 6 .4(2) 0 .91(3) GNE11 4 .3(1) 0 .65(3) 0.6526(7) 0 .11(2) 6 .5(2) 0 .99(5) GNE12 4 .5(1) 0 .73(3) 0.6900(8) 0 .09(1) 6 .6(2) 1.05(4) North plume
FN2/1 4 .3(2) 0 .69(5) 0.6636(9) 0 .12(3) 6 .5 (3) 1.04(7) FN2/2 5 .8(2) 0 .83(3) 0 .908(1) 0 .07(2) 6 .4 (2) 0 .91(3) FN2/3 10.8(2) 1.56(2) 1.670(2) 0 .16(1) 6 .5(1) 0 .93(1) FN2/4 6.8(2) 1.09(4) 0 .879(1) 0 .37(3) 7 .8(2) 1.24(4) FN2/4* 6.8(2) 1.04(2) 0.8807(9) 0 .35(1) 7 .7(2) 1.18(3) FN2/5 8.3(2) 1.21(4) 1.295(1) 0 .18(2) 6 .4(2) 0 .93(3) FN2/6 6 .8(2) 1.10(5) 1.083(1) 0 .17(2) 6 .3(2) 1.02(5) FN2/7 2.63(6) 0 .40(1) 0.3993(4) 0 .05(1) 6 .6 (2) 0 .99(3) FN2/8 2.72(7) 0 .38(1) 0.4255(4) 0 .14(1) 6 .4 (2) 0 .88(3) FN2/9 1.63(7) 0 .24(2) 0.2682(4) 0 .07(2) 6 .1(3) 0 .90(8) FN2/10 6 .9(1) 1.07(2) 1.061(1) 0 .11(1) 6 .5(1) 1.01(2) FN2/10* 6.0(2) 0 .853(3) 0 .957(1) 0 .24(2) 6 .2(2) 0 .89(3) FN2/11 1.73(4) 0 .265(9) 0.2648(3) 0 .050(8) 6 .5(2) 1.00(3) INI 1.36(4) 0 .189(9) 0.2000(2) 0 .05(1) 6 .8(2) 0 .94(4) IN2 0.68(2) 0 .105(6) 0.1010(1) 0 .01(2) 6 .7(2) 1.04(6) IN3t 25 .1(5) 3 .76(7) 3.826(4) 1.01(3) 6 .5 (1) 0 .98(2)
North-west plume
FNW2/1 2.22(8) 0 .33(2) 0.3376(4) 6.<.(2) 0 .97(6) FNW2/2 7-0(2) 1.02(3) 1.073(1) 0 .22(2) 6 .S(2) 0 .95(3) FNW2/3 11.0(3) 1.67(5) 1.729(2) 0 .27(2) 6 .M2) 0 .97(3) FNW2/4 4 .1 (2) 0 .68(5) 0.6184(9) 0 .18(3) 6 . / ( 3 ) 1.09(8) FNW2/5 5.5(2) 0 .92(3) 0 .903(1) 0 .13(2) 6 . : ( 2 ) 1.01(4) FNW2/6 8.3(2) 1.25(4) 1.291(1) 0 .27(2) 6.' .(2) 0 .97(3) INW (L95) * 0.36(2) 0 .045(4) 0.0524(7) 0 .03(1) 6.11(3) 0 .85(8)

17
Table 3 (cont'd).
Particle Activity Activity ratio 239pu 240 p u 2"Am 235„ 239^/241^ 2^/241^ (kBq) (kBq) (kBq) (Bq)
North-west plume
ZD600 1 23.9(5) 3.59(7) 3.767(4) 0.98(3) 6.3(1) 0.95(2) ZD600 2 5.9(2) 0.82(3) 0.889(1) 0.12(2) 6.6(2) 0.93(3) ZD600 4 2.46(8) 0.34(2) 0.3673(4) 0.06(1) 6.7(2) 0.93(6) ZD600 5 3.93(9) 0.56(1) 0.6168(6) 0.03(1) 6.4(1) 0.90(2) ZD600 6 9.0(2) 1.31(4) 1.436(2) 0.73(3) 6.3(2) 0.91(3) ZD600 7 194(4) 28.4(5) 29.91(3) 4.6(2) 6.5(1) 0.95(2) ZD600 8 30.6(7) 4.57(7) 4.755(5) 0.29(2) 6.4(1) 0.96(2) ZD600 9 4.4(1) 0.63(2) 0.6663(7) 0.12(1) 6.7(2) 0.94(3) ZH590t '5(6) 0.25(2) 0.2265(3) 6.5(3) 1.09(7) West plume
FW1 2.06(7) 0.33(2) 0.2582(3) 0.05(2) 8.0(3) 1.28(7) FW2 4.6(1) 0.72(3) 0.5763(7) 0.14(2) 7.9(2) 1.24(5) FW3 1.21(5) 0.15(1) 0.1466(2) 0.05(2) 8.2(3) 1.03(9) FWlt 4.7(1) 0.73(1) 0.5886(6) 0.14(1) 7.9(2) 1.24(3)
duplicate measurement on alternative side of particle
t .MlVcted during field work in November 1988
$ collected during field work prior to 1988
•j4V4i*JlMjn*fc?A4j>-U_..;X' *
18
, Table 4. Results of PUS Analyses on Active Particles
| The absolute concentrations are presented in mass percentages. Errors may be % •
large and are difficult to estimate precisely. Light elements (below Al in atomic number) are not detected by the method.
Particle: GNE1? INW (L95) IN2 (A60) FW (F50) Tadje Activity: 4.5 kBqT 360 Bqt 680 Bqt 700 Bqt 30 Bqt
1
Ele-jnt Concentration (mass %)
Al 1.8 1.6 1.6 Si 0.4 - - 3.4 29.7 S 0.06 - - 7.0 -K 2.3 - - 0.9 1.1 Ca* 1.0 1.1 1.1 7.4 16.9 Ti 0.5 - - 0.6 0.9 Cr 0.09 7.0 2.0 - -Mn 0.5 - - 0.3 0.3 Fe 23.0 24.0 6.5 11.4 16.0 Ni - 1.8 0.7 - -Cu 1.8 0.3 0.05 0.9 0.4 Zn 0.2 • - 0.3 0.08 Ge - - - - 0.6
J. Br 1.4 - - - -Pb 1.9 • - 35.0 -U 2.9 - - 0.8 -Pu 18.9 - - 19.8 -
* Absolute concentrations are based on an iron standard and the errors may be i
i considerable (e.g. 100%); rela tive concentrations, however, are more i
i precise
t Activiti and errors es of 239Pv.
are i, de
<30%. teroined b1 / £ai una-ray spe :trometry
$ While samples definitely contain some Ca, the concentrations are subject to greater uncertainties than for the other elements due to the presence of Ca in the glue used for target mounting
u j u i ifi-O.
-M-Sl^^B**-*;^.
19
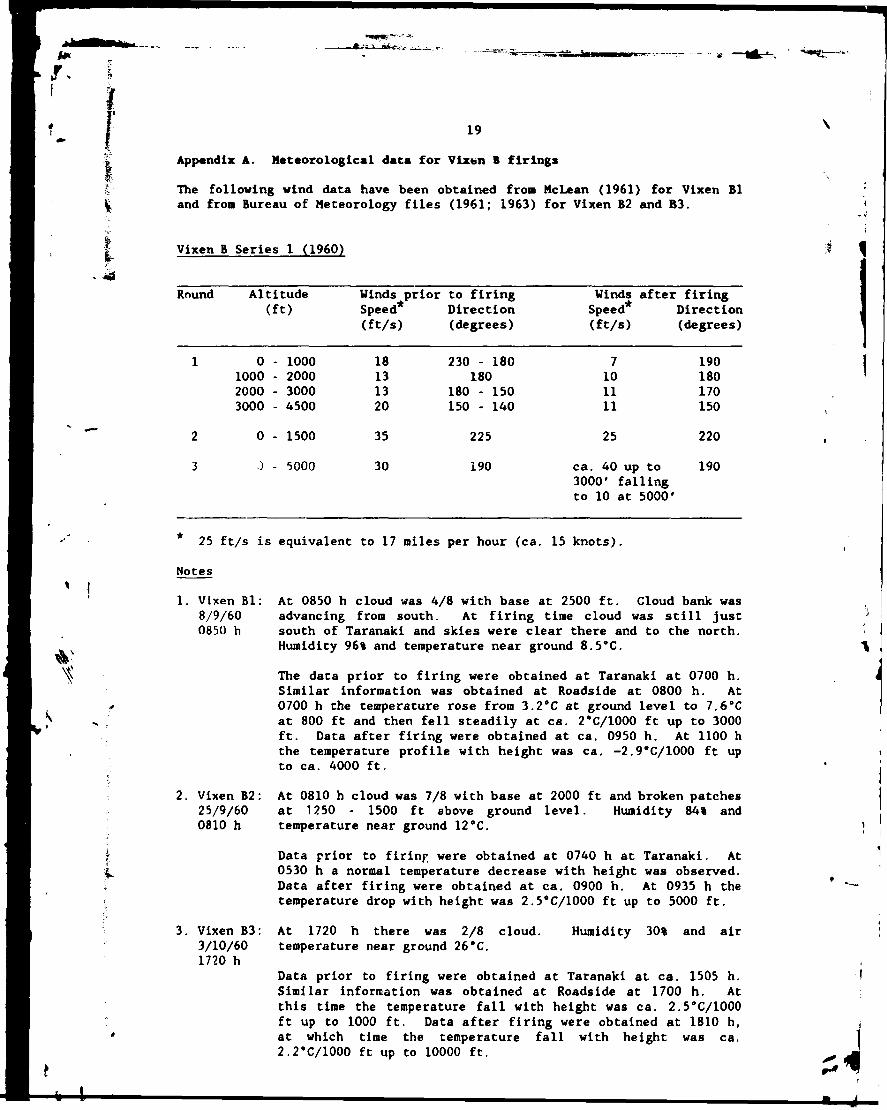
Appendix A. Meteorological data for Vixen B firings
The following wind data have been obtained from McLean (1961) for Vixen Bl and froa Bureau of Meteorology files (1961; 1963) for Vixen B2 and B3.
Vixen B Series 1 (1960)
Round Altitude Winds prior to firing (ft) Speed* Direction
(ft/s) (degrees)
Winds after firing Speed Direction (ft/s) (degrees)
1 0 • 1000 18 230 - 180 7 190 1000 2000 13 180 10 180 2000 • 3000 13 180 - 150 11 170 3000 4500 20 150 - 140 11 150
2 0 1500 35 225 25 220 3 ) 5000 30 190 ca 40 up to 190
3000' falling to 10 at 5000'
25 ft/s is equivalent to 17 miles per hour (ca. 15 knots).
Notes
1. Vixen Bl: 8/9/60 0850 h
2. Vixen B2: 25/9/60 0810 h
3. Vixen B3: 3/10/60 1720 h
At 0850 h cloud was 4/8 with base at 2500 ft. Cloud bank was advancing from south. At firing time cloud was still just south of Taranaki and skies were clear there and to the north. Humidity 96% and temperature near ground 8.5°C.
The data prior to firing were obtained at Taranaki at 0700 h. Similar information was obtained at Roadside at 0800 h. At 0700 h the temperature rose from 3.2°C at ground level to 7.6"C at 800 ft and then fell steadily at ca. 2'C/IOOO ft up to 3000 ft. Data after firing were obtained at ca. 0950 h. At 1100 h the temperature profile with height was ca. -2.9"C/1000 ft up to ca. 4000 ft.
At 0810 h cloud was 7/8 with base at 2000 ft and broken patches at 1250 - 1500 ft above ground level. Humidity 84% and temperature near ground 12°C.
Data prior to firing were obtained at 0740 h at Taranaki. At 0530 h a normal temperature decrease with height was observed. Data after firing were obtained at ca. 0900 h. At 0935 h the temperature drop with height was 2.5*C/1000 ft up to 5000 ft.
At 1720 h there was 2/8 cloud, temperature near ground 26°C.
Humidity 30% and air
Data prior to firing were obtained at Taranaki at ca. 1505 h. Similar information was obtained at Roadside at 1700 h. At this time the temperature fall with height was ca. 2.5"C/1000 ft up to 1000 ft. Data after firing were obtained at 1810 h, at which time the temperature fall with height was ca. 2.2-C/100O ft up to 10000 ft.

20
Appendix A (cont'd).
Vixen B Series 2 (1961)
Wind data are expressed as direction (degrees)/speed (knots). Time is expressed in Central Standard Time (CST).
Round Lima 1 Lima 2 Lima 3 Lima 4 Lima 5 Date April 13 April 23 May 8 May 18 May 25 Time of Firing 2114 1430 2130 1700 1500 Time of Ascent* 2135 1435 2127 1700 1500
Surface Win<i 170/05 240/14 -250 ft 133/12 130/10 500 ft 179/15 235/15 134/18 130/12 750 ft 132/20 135/12 1000 ft 184/18 235/17 129/20 138/10 1250 ft 138/9 1500 ft 187/19 244/10 126/19 141/9 1750 ft 145/7 2000 ft 198/16 234/14 120/17 167/4 2500 ft 211/19 233/17 116/15 139/4 3000 ft 230/17 231/17 10V15 3500 ft 230/20 4000 ft 230/20 4500 ft 230/25 5000 ft cloud
Notes 1 2,3 1 2
Time of balloon launch from which meteorological d.-?ta were obtained.
Notes
1. Winds recorded at Wewak. 2. Winds recorded at Roadside. 3. Televised 100 ft wind of 220°/20 kts at Taranaki at time of firing. 4. The winds for 2000 and 2500 ft were taken from a wind find at 1445 CST.
The wind find at 1500 terminated at 1500 ft due to low cloud and showers.
149/12 152/16 147/20 149/17 150/22 150/28
159/1' 154/8
2,4

21
Appendix A (cont'd).
Vixen B Series 3 (1963)
Wind data are expressed as direction (degrees)/speed (knots). Time is expressed in Central Standard Time (CST).
Round Lima 1 Lima 2 Lima 3 Lima 4 Date March 26 April 2 April 9 April 14 Time of Firing 0950 1545 1440 1324 Time of Ascent* 0950 1545 1440 1324
Surface Wind 163/8 170/5t 180/9 100/10 500 ft 162/11 171/4 185/10 100/10 1000 ft 166/16 171/4 215/5 88/11 1500 ft 175/15 139/5 191/10 92/9 2000 ft 167/16 137/3 192/11 67/8 2500 ft 173/15 118/4 196/11 68/10 3000 ft 172/13 128/4 238/12 45/4 3500 ft 140/3 243/15 61/5 4000 ft 144/4 255/14 86/6 4500 ft 151/4 263/14 105/7 5000 ft 137/3 264/16 132/6
Time of balloon launch from which meteorological data were obtained at Roadside observation point.
t AWRE (1963) records the met. conditions at time of firing for round 2 as 165 to 160" from surface to 3000 ft, speed 8 knots.
22
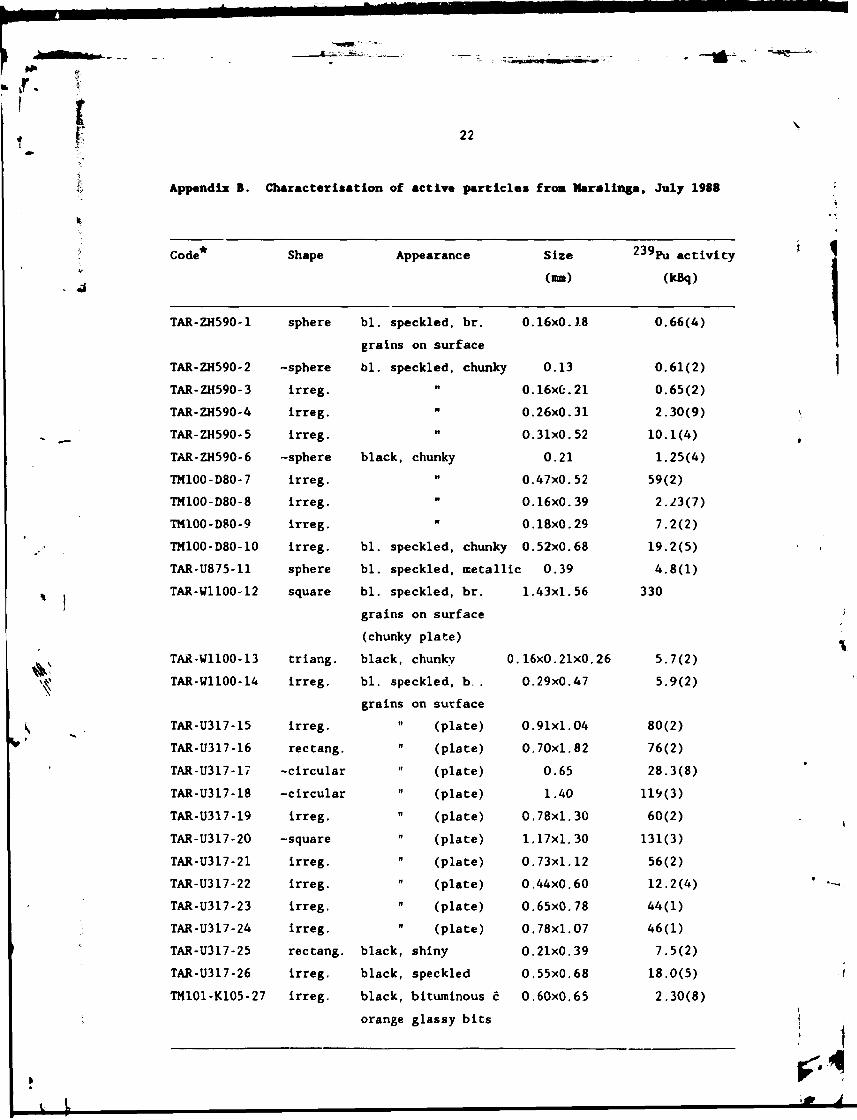
Appendix B. Characterisation of active particles froa Maralinga, July 1988
Code* Shape Appearance Size 2 3 9Pu activity (nm) (kBq)
TAR-ZH590-1 sphere bl. speckled, br. 0.16x0.18 0.66(4) grains on surface
TAR-ZH590-2 -sphere bl. speckled, chunky 0.13 0.61(2) TAR-ZH590-3 irreg. n 0.16x0.21 0.65(2) TAR-ZH590-4 irreg. n 0.26x0.31 2.30(9) TAR-ZH590-5 irreg. it 0.31x0.52 10.1(4) TAR-ZH590-6 -sphere black, chunky 0.21 1.25(4) TM100-D80-7 irreg. n 0.47x0.52 59(2) TM100-D80-8 irreg. n 0.16x0.39 2.23(7) TM100-D80-9 irreg. If 0.18x0.29 7.2(2) TM100-D80-10 irreg. bl. speckled, chunky 0.52x0.68 19.2(5) TAR-U875-11 sphere bl. speckled, metalli c 0.39 4.8(1) TAR-W1100-12 square bl. speckled, br. 1.43x1.56 330
grains on surface (chunky plate)
TAR-W1100-13 triang. black, chunky 0 .16x0.21x0.26 5.7(2) TAR-W1100-14 irreg. bl. speckled, b. . 0.29x0.47 5.9(2)
grains on surface TAR-U317-15 irreg. it (plate) 0.91x1.04 80(2) TAR-U317-16 rectang. n (plate) 0.70x1.82 76(2) TAR-U317-17 -circular it (plate) 0.65 28.3(8) TAR-U317-18 -circular ft (plate) 1.40 119(3) TAR-U317-19 irreg. n (plate) 0.78x1.30 60(2) TAR-U317-20 -square it (plate) 1.17x1.30 131(3) TAR-U317-21 irreg. n (plate) 0.73x1.12 56(2) TAR-U317-22 irreg. it (plate) 0.44x0.60 12.2(4) TAR-U317-23 irreg. n (plate) 0.65x0.78 44(1) TAR-U317-24 irreg. it (plate) 0.78x1.07 46(1) TAR-U317-25 rectang. black, shiny 0.21x0.39 7.5(2) TAR-U317-26 irreg. bla ck, speckled 0.55x0.68 18.0(5) TM101-K105-27 irreg. black,
orange bituminous c glassy bits
0.60x0.65 2.30(8)

t-^x -ji_--.- ___
23
Appendix B (cont'd).
Code* Shape Appearance Size (mm)
2 3 9 P u activity (kBq)
TAR-U317-28 triang. bl. speckled, 0 metallic appearance
.23x0.26x0.34 3.14(9)
TM101-M?04-29 irreg. orange glass c few small black specks (2 main pieces)
0.39, 1.04 1.25(5)
TM101-M104-30 irreg. " (many small pieces) 0.3 - 0.6 3.0(1) TM101-MIG4-31 -sphere bl. speckled, br.
grains on surface 0.52 186(7)
TM101-M104-32 irreg. (plate) 0.52x0.73 300 TM101 M104-33 irreg. (plate) 0.31x0.52 94(6) TM101-M104-34 irreg. (plate) 0.26x0.36 41(1) TM101-M104-35 irreg. " (plate) 0.23x0.29 34(1) TAR-U587-36 -square (plate) 1.56x1.82 85(2) TAR-U587-37 square " (plate) 1.04x1.04 49(1) TAK-Ub37-38 irreg. brown/orange c
black specks 0.83x1.64 42(1)
TAR-ZC590-39 sphere bl. speckled, metallic appearance
0.29 7.5(3)
TAR-S1010-40 ellipsoid n 0.26x0.31 4.6(1)
*The sample code defines the site [i.e. Taranaki (TAR), TM100, TMIOJj from which the sample was obtained and rhe specific grid location at the site; for example, TAR-ZH590-1 was obtained from the ARL grid location ZH590 at Taranaki.