Embed Size (px)
Citation preview
Australian reserving practices
An analysis of the 2006 General Insurance Claims Reserving and Risk Margins Survey
Prepared by Jefferson Gibbs and Samantha Hu on behalf of the General Insurance Practice Committee of the Institute of Actuaries of
Australia.
This paper has been prepared for issue to, and discussion by, Members of the Institute of Actuaries of Australia (the Institute). The Council of the Institute wishes it to be understood that opinions put forward herein are not
necessarily those of the Institute and the Council is not responsible for those opinions.
© 2007 Institute of Actuaries of Australia The I ns t i tu te o f Actuar ies of Aus t ra l ia
A BN 69 000 423 656
Lev el 7 Chal l i s House 4 Mar t in P lace Sydney NSW Aus t ra l ia 2000
Te lephone 02 9233 3466 Facs im i le 02 9233 3446 Emai l : actuar ies@actuar ies .asn .au Web s i te : www.actuar ies .asn .au
Executive summary The inaugural Australian General Insurance Claims Reserving and Risk Margins Survey (the survey) was conducted in August 2006. It was initiated by the General Insurance Practice Committee (GIPC) of the Institute of Actuaries of Australia (the Institute). The aim of the survey was to collect information on Australian reserving practices in general insurance, compare these practices with those adopted in the United Kingdom and assist the GIPC in re-examining education and research priorities. Respondents’ views and insights were sought on a range of issues, including reserving practices, risk margins, the overall state of the Australian general insurance market, education and research. Our survey was based on an earlier, similar exercise undertaken by the General Insurance Reserving Taskforce (GRIT) of the UK Institute of Actuaries. We thank GRIT — especially its chairman, Tony Jones — for allowing us to use some of their questions and for assisting with the design of the Australian survey. Additional questions were included in the local version of the survey. Where appropriate results from the Australian and UK surveys are compared in the body of this paper. Our analysis of the survey results is based on a presentation by the authors to a seminar for the Institute on Reserving for General Insurers — Current Challenges and Future Opportunities staged in Melbourne in September 2006. The balance of this paper is divided into two sections. The first section contains commentary on those sections of the survey we believe to have yielded particularly interesting or noteworthy results. Any views expressed or conclusions reached in this commentary are those of the authors. The second section is an appendix summarising the results of each survey question without commentary. We received 89 responses to the Australian survey. This was a credible response rate and was actually slightly higher in total than the UK survey. We thank those IAAust members who took the time and trouble to complete the survey. We also acknowledge the assistance of our colleague, Nina Xiao. We trust our findings will be of interest to professional actuaries, regulators, general insurance underwriters and reinsurers, corporations with internal insurance departments and government entities with a self-insurance function.
Page 2 of 32 Institute of Actuaries of Australia

Australian reserving practices: the survey Our survey respondents covered a broad range of actuarial experience.
Among respondents, 93 percent said that general insurance was their primary practice area.
Forty-two percent worked for an insurer or reinsurer. (For the UK survey the equivalent
figure was 67 percent.)
Fifty-three percent reported working for a consultancy. (UK 33 percent.) More than three quarters of respondents indicated that a valuation role was their primary function. Other functions included mergers and acquisitions, regulatory supervision, accounting standards, risk management, research, dynamic financial analysis, stockbroking research, management information and product management. Respondents’ roles within general insurance enterprises are summarised in Figure 1.
Roles w ithin General Insurance - All and primary
24%
44%
15%
25%
13%
9%
39%
44%
34%
11%
19%
0%3%3%
1%2%
30%30%
0
5
10
15
20
25
30
35
40
45
App Actry Valn Pricing RI Inv/CapM an
EPR AuditAssist
Reserving- Non-APRA
Other
All ro les Primary ro le
Key
• App Actry: Approved Actuary
• Valn: Valuation Actuary supporting Approved Actuary
• Pricing: Pricing Actuary • RI: Reinsurance Actuary • Inv/Cap Man: Investment/Capital Management
• EPR: External Peer Review
• Audit Assist: Audit Assist Actuary
• Reserving – Non‐APRA: Reserving Actuary – non‐APRA regulated entity
Figure 1 It is perhaps noteworthy that the mandatory Australian Prudential Regulation Authority (APRA) Approved Actuary role is not the dominant activity among respondents, although it is when the Valuation Actuary supporting the Approved Actuary (Valn) function is added in. We believe professional development needs to reflect the other actuarial roles being undertaken.
Page 3 of 32 Institute of Actuaries of Australia
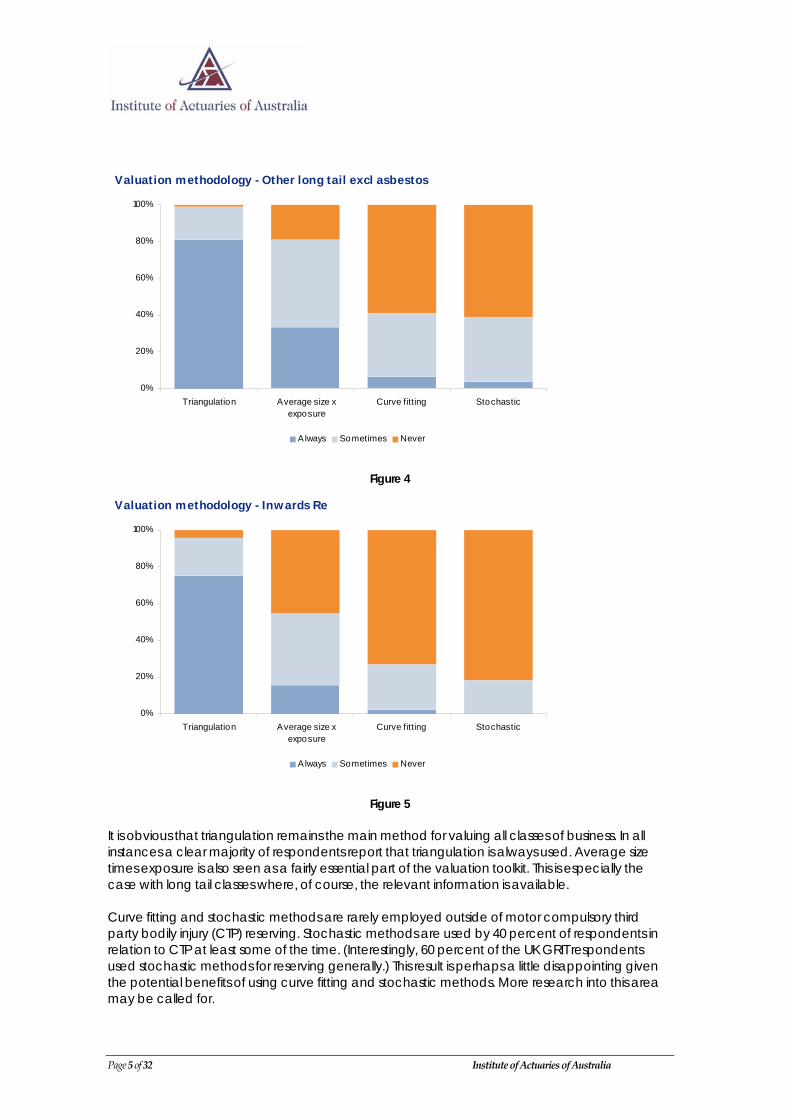
Reserving practices Figures 2 to 5 depict the main reserving methods employed by Australian insurers for different lines of business.
Valuation methodology - Short tail
0%
20%
40%
60%
80%
100%
Triangulation Average size xexposure
Curve fitting Stochastic
Always Sometimes Never
Figure 2
Valuation methodology - CTP
0%
20%
40%
60%
80%
100%
Triangulation Average size xexposure
Curve fitting Stochastic
A lways Sometimes Never
Figure 3
Page 4 of 32 Institute of Actuaries of Australia
Valuation methodology - Other long tail excl asbestos
0%
20%
40%
60%
80%
100%
Triangulation Average size xexposure
Curve fitting Stochastic
A lways Sometimes Never
Figure 4
Valuation methodology - Inwards Re
0%
20%
40%
60%
80%
100%
Triangulation Average size xexposure
Curve fitting Stochastic
A lways Sometimes Never
Figure 5
It is obvious that triangulation remains the main method for valuing all classes of business. In all instances a clear majority of respondents report that triangulation is always used. Average size times exposure is also seen as a fairly essential part of the valuation toolkit. This is especially the case with long tail classes where, of course, the relevant information is available. Curve fitting and stochastic methods are rarely employed outside of motor compulsory third party bodily injury (CTP) reserving. Stochastic methods are used by 40 percent of respondents in relation to CTP at least some of the time. (Interestingly, 60 percent of the UK GRIT respondents used stochastic methods for reserving generally.) This result is perhaps a little disappointing given the potential benefits of using curve fitting and stochastic methods. More research into this area may be called for.
Page 5 of 32 Institute of Actuaries of Australia
Several other valuation methods were noted:
‐ IBNR to outstanding ratio for inwards reinsurance ‐ credibility method ‐ Cape Cod (we note the respondent concerned works in the US) ‐ individual claims generalised linear model reserving ‐ annuity method ‐ exposure based modelling ‐ review of case estimates.
Of course, in the absence of relevant data some actuaries resort to inspired guesswork!
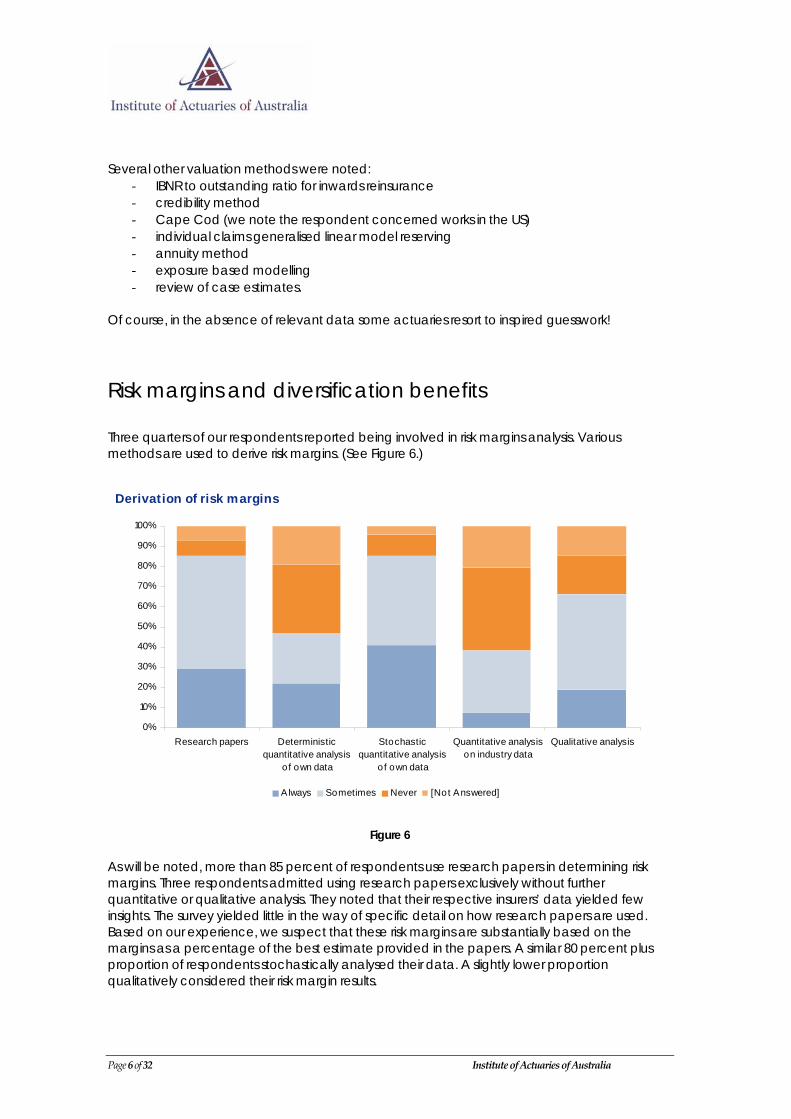
Risk margins and diversification benefits Three quarters of our respondents reported being involved in risk margins analysis. Various methods are used to derive risk margins. (See Figure 6.)
Derivation of risk margins
0%
10%
20%
30%
40%
50%
60%
70%
80%
90%
100%
Research papers Deterministicquantitative analysis
of own data
Stochasticquantitative analysis
of own data
Quantitative analysison industry data
Qualitative analysis
A lways Sometimes Never [Not Answered]
Figure 6
As will be noted, more than 85 percent of respondents use research papers in determining risk margins. Three respondents admitted using research papers exclusively without further quantitative or qualitative analysis. They noted that their respective insurers’ data yielded few insights. The survey yielded little in the way of specific detail on how research papers are used. Based on our experience, we suspect that these risk margins are substantially based on the margins as a percentage of the best estimate provided in the papers. A similar 80 percent plus proportion of respondents stochastically analysed their data. A slightly lower proportion qualitatively considered their risk margin results.
Page 6 of 32 Institute of Actuaries of Australia
Page 7 of 32 Institute of Actuaries of Australia
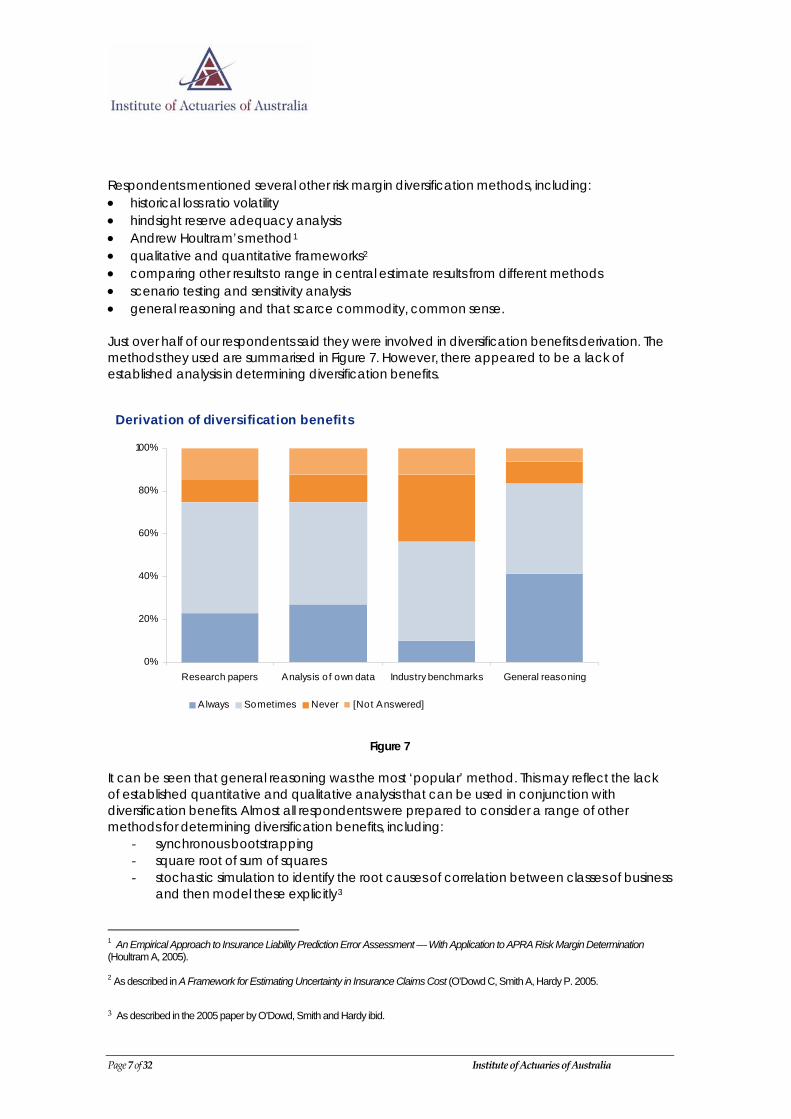
Respondents mentioned several other risk margin diversification methods, including: • historical loss ratio volatility • hindsight reserve adequacy analysis • Andrew Houltram’s method1 • qualitative and quantitative frameworks2 • comparing other results to range in central estimate results from different methods • scenario testing and sensitivity analysis • general reasoning and that scarce commodity, common sense. Just over half of our respondents said they were involved in diversification benefits derivation. The methods they used are summarised in Figure 7. However, there appeared to be a lack of established analysis in determining diversification benefits.
Derivation of diversification benefits
0%
20%
40%
60%
80%
100%
Research papers Analysis o f own data Industry benchmarks General reasoning
Always Sometimes Never [Not Answered]
Figure 7
It can be seen that general reasoning was the most ‘popular’ method. This may reflect the lack of established quantitative and qualitative analysis that can be used in conjunction with diversification benefits. Almost all respondents were prepared to consider a range of other methods for determining diversification benefits, including:
‐ synchronous bootstrapping ‐ square root of sum of squares ‐ stochastic simulation to identify the root causes of correlation between classes of business
and then model these explicitly3
1 An Empirical Approach to Insurance Liability Prediction Error Assessment — With Application to APRA Risk Margin Determination (Houltram A, 2005). 2 As described in A Framework for Estimating Uncertainty in Insurance Claims Cost (O’Dowd C, Smith A, Hardy P. 2005. 3 As described in the 2005 paper by O’Dowd, Smith and Hardy ibid.
‐ tracking over time ‐ ‘guessing’.
Asked if they had data that was sufficiently robust for risk margins analysis, 55 percent answered in the negative. The problem cannot be readily overcome. It helps explain the continuing use of risk management benchmarks from earlier research papers. Respondents cited a number of reasons for their lack of confidence in the data. Insufficient own data, low numbers of claims, the relatively short period the portfolio had
been in existence, or the portfolio was too small. For higher than 75 percent probability of sufficiency (POS) the data was insufficient.
Data was insufficiently robust for diversification benefits and tail dependencies.
Data was too heterogeneous.
Required more industry data, or industry data that was applicable.
Environmental changes that made it difficult to develop underlying distributions.
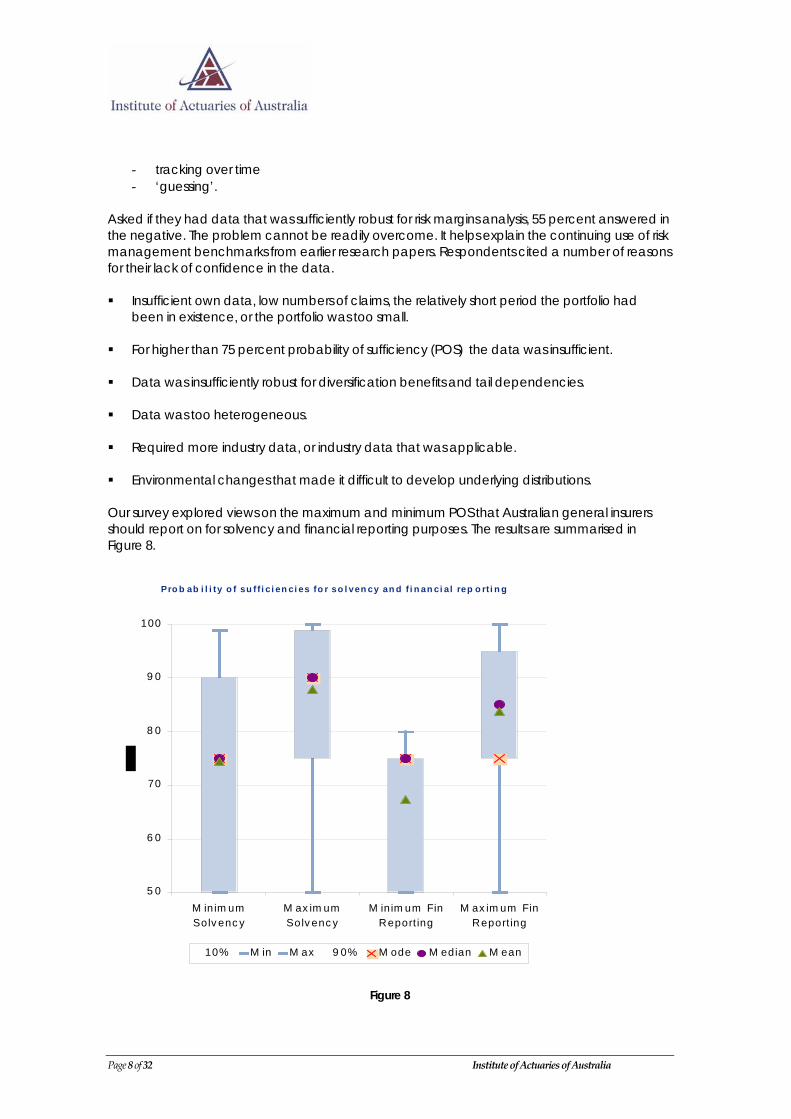
Our survey explored views on the maximum and minimum POS that Australian general insurers should report on for solvency and financial reporting purposes. The results are summarised in Figure 8.
Pro b ab i l i ty o f su f f i c i en ci es fo r so l ven cy an d f i n an ci al rep o rt i n g
5 0
6 0
70
8 0
9 0
100
M in im umSolv enc y
M ax im umSolv enc y
M inim um FinReport ing
M ax im um FinReport ing
10% M in M ax 9 0% M ode M edian M ean
Figure 8
Page 8 of 32 Institute of Actuaries of Australia
Respondents generally thought that insurers should report a higher POS for solvency than for financial reporting. This opinion is somewhat at odds with the current situation in which solvency figures are reported at 75 percent as required by APRA while financial reporting is often at a higher POS. All but one respondent thought insurers should be reporting at or below 95 percent POS for financial reporting purposes. Just over a quarter of respondents thought insurers should report 50 percent POS for financial reporting. However, few of the surveyed actuaries considered that insurers should be reporting below 75 percent POS for solvency purposes. Fifteen percent thought solvency reporting should have an upper boundary of between 99 and 99.99 percent. This is akin to the requirements for runoff insurers. In general, our respondents came up with a wider range of proposed POS values for solvency purposes when compared with financial reporting purposes. For 42 percent of respondents company liabilities were at 75 percent POS as set by the actuary. Thirty-seven percent had their reserves set at a higher level of sufficiency. Three quarters used the same POS for the financial reporting of outstanding claims and the liability adequacy test (LAT) while 26 percent used a lower POS for the LAT required under International Financial Reporting Standards (IFRS). No respondent used a POS for LAT that was higher than for that used in the financial reporting of outstanding claims. Some respondents noted that the LAT was performed at 75 percent as per APRA premium liabilities, but outstanding claims reserves were booked at a higher POS. Again, these results reflected inconsistencies in risk margin levels and reserving. Respondents also flagged additional issues regarding risk margins. The lack of consistency in calculating risk margins led to discrepancies in reported results.
Insurers were given insufficient guidance on risk margins.
For shareholders, a more conservative number was not necessarily a better number.
Risk margins could be linked to reputation risk.
The actuary should focus on getting the central estimates as accurate as possible — risk
margins were a distraction. The level of capital resources was a more significant matter.
Actuaries might be better off if APRA mandated a schedule of margins as a function of class of business and size of liability.
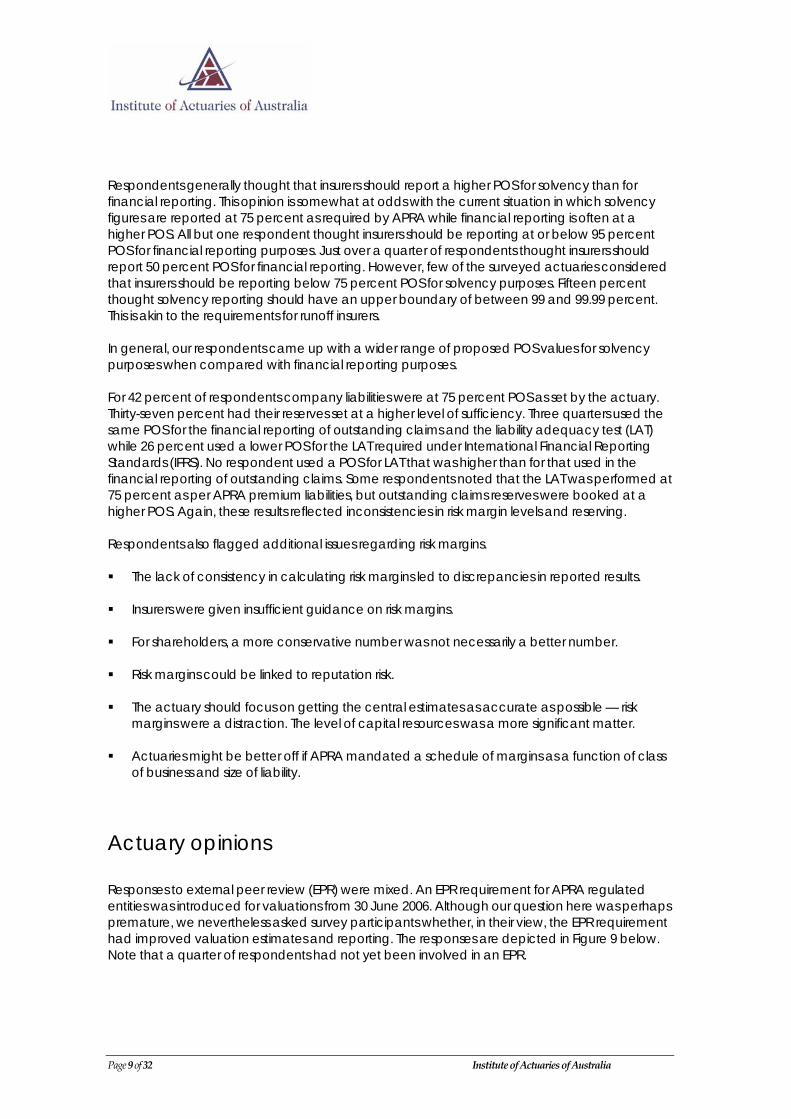
Actuary opinions Responses to external peer review (EPR) were mixed. An EPR requirement for APRA regulated entities was introduced for valuations from 30 June 2006. Although our question here was perhaps premature, we nevertheless asked survey participants whether, in their view, the EPR requirement had improved valuation estimates and reporting. The responses are depicted in Figure 9 below. Note that a quarter of respondents had not yet been involved in an EPR.
Page 9 of 32 Institute of Actuaries of Australia
Page 10 of 32 Institute of Actuaries of Australia
It appears the EPR system is having a positive effect on liability estimation and reporting for at least some insurers. Of those who had been involved in an EPR, 17 percent thought it had improved the quality of liability valuation estimates and 23 percent felt it had improved the quality of liability reporting. Answers to another question regarding pressure on reserving actuaries also suggested that EPR would help reduce management pressure on valuation actuaries’ results. Others came from a different direction, regarding EPR as an onerous obligation that was possibly over applied. Clearly, EPR will take time to develop.
Im prove quality of liability valuat ion est im ates
Yes13%
No45%
No t sure17%
I have no t been invo lved in an
EP R25%
Figure 9 Participants were then asked whether their risk margin and diversification methods were more or less sophisticated than the market generally. The results are depicted in Figure 10. Overall, it appeared respondents were more confident about their central estimate reserving methodologies than their risk margin methodologies.
Im prove quality of liability valuat ion report ing
Yes17%
No41%
No t sure17%
I have no t been invo lved in an
EP R25%

Self perception of methodology used for reserving and risk margins
0%
10%
20%
30%
40%
50%
60%
M arket leader M oresophisticated than
market average
About marketaverage standard
Less sophisticatedthan market
average
Reserving Risk M argin
Figure 10
Not unexpectedly, opinions on claims reserving were mixed. (See Figure 11.) Fifty four respondents (Sixty-three percent) would like to see more research undertaken on this matter, although most also thought the topic was well covered in the literature and at professional meetings. (We note that since the survey the accounting professional has clarified certain aspects of the LAT.) Only 36 respondents (42 percent) felt that the current Institute syllabus adequately prepared actuaries for claims reserving. (Note: Figures 11 and 12 below plot numbers of respondents)
Opinions on claims reserving
0 10 20 30 40 50 60
Current syllabus o f the Institute adequatelyprepares actuaries for this work
There is sufficient guidance on how premiumliabilities should be established for APRA
There is sufficient guidance on how premiumliabilities should be established for AASB1023 LAT
purposes
There is sufficient actuarial literature on thissubject
There are sufficient items on this at pro fessionalmeetings
I would like to see more research on this topic
Not sure Disagree Agree
Figure 11
Page 11 of 32 Institute of Actuaries of Australia
It was a different matter when participants were asked to consider risk margins.
Opinions about risk margins
0 10 20 30 40 50 60 70 80
Current syllabus of the Institute adequatelyprepares actuaries for this work
There is sufficient actuarial literature on thissubject
There are sufficient items on this at professionalmeetings
I would like to see more research on this topic
Not sure Disagree Agree
Figure 12
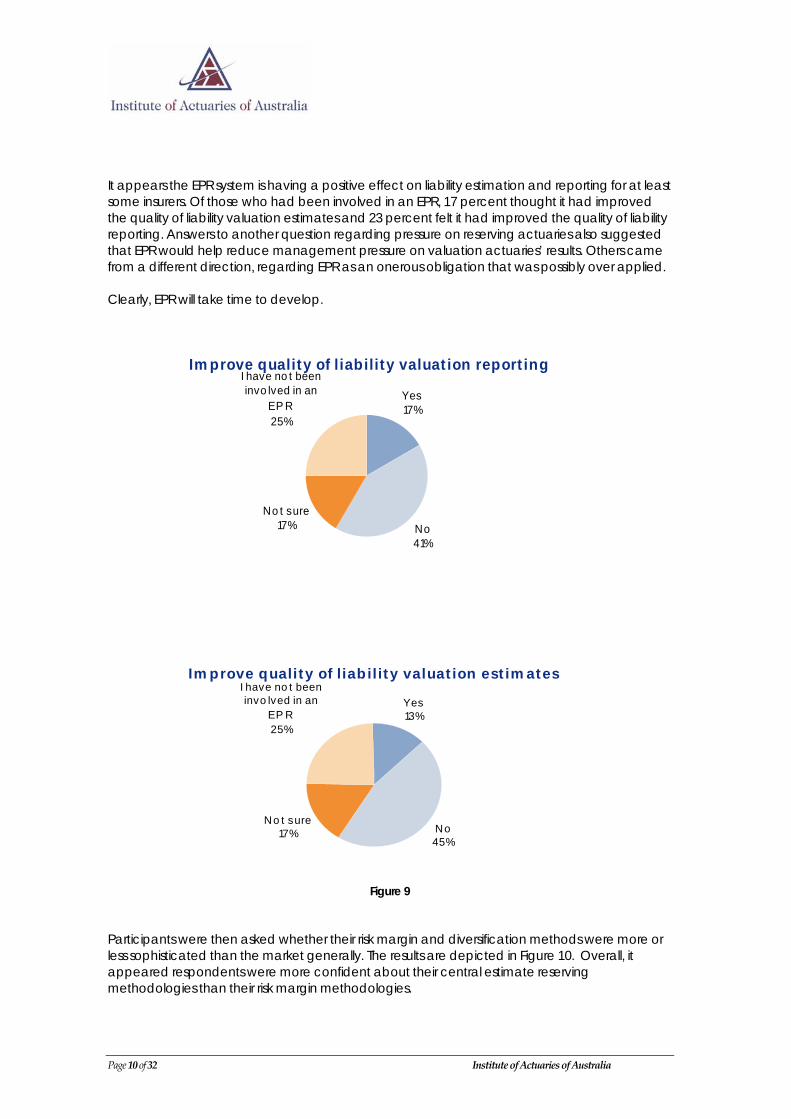
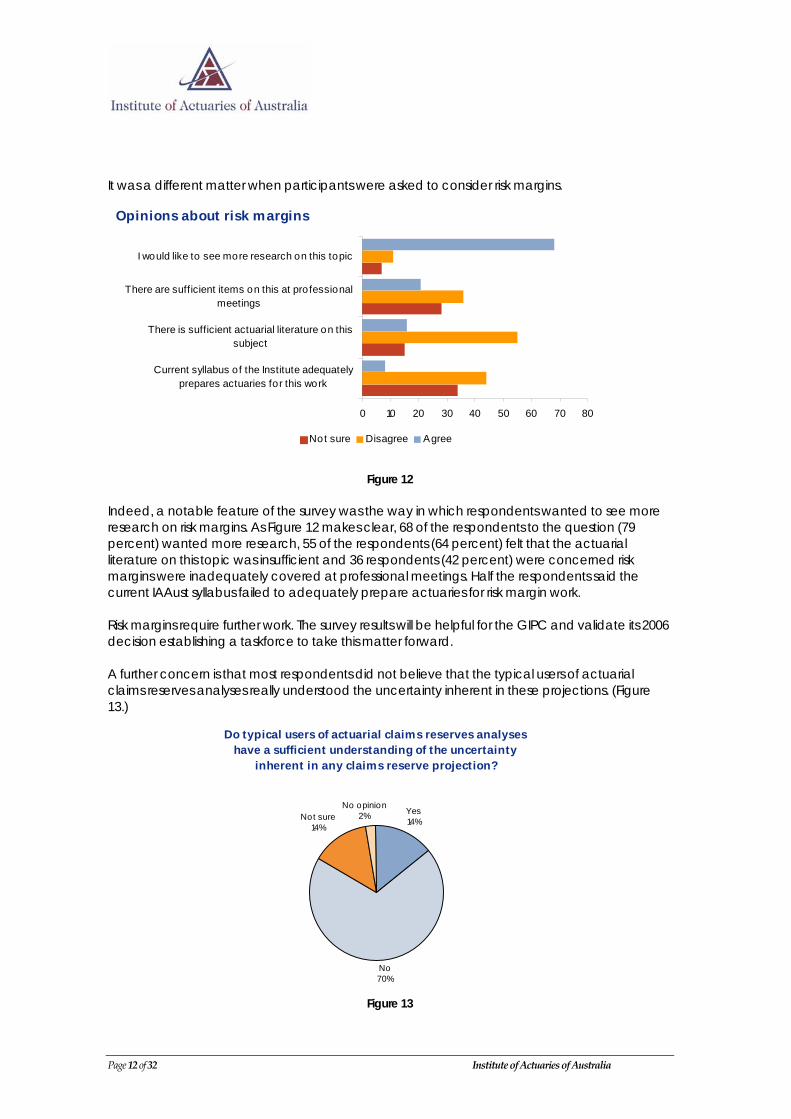
Indeed, a notable feature of the survey was the way in which respondents wanted to see more research on risk margins. As Figure 12 makes clear, 68 of the respondents to the question (79 percent) wanted more research, 55 of the respondents (64 percent) felt that the actuarial literature on this topic was insufficient and 36 respondents (42 percent) were concerned risk margins were inadequately covered at professional meetings. Half the respondents said the current IAAust syllabus failed to adequately prepare actuaries for risk margin work. Risk margins require further work. The survey results will be helpful for the GIPC and validate its 2006 decision establishing a taskforce to take this matter forward. A further concern is that most respondents did not believe that the typical users of actuarial claims reserves analyses really understood the uncertainty inherent in these projections. (Figure 13.)
Do typical users of actuarial claims reserves analyses have a sufficient understanding of the uncertainty
inherent in any claims reserve projection?
No70%
Not sure14%
No opinion2% Yes
14%
Figure 13
Page 12 of 32 Institute of Actuaries of Australia

This response could be a problem. The actuaries’ code of professional conduct explicitly requires an actuary to provide “sufficient information and discussion” so that users “will be able to form a view of the appropriateness and implications of his or her recommendations”. The issue clearly demands further thought by valuation actuaries.
Free form responses Our survey contained certain questions that allowed respondents to answer them in a more flexible and nuanced manner than the balance of the questions in the survey. Participants were asked whether recent reserve estimates produced by actuaries in Australia had been significantly under or overstated relative to the actual outcome, and the probable causes of such distortions. The results are summarised in Figure 14. A majority (94 percent) observed that insurance liabilities had proven in the main to be overstated in recent years. This result matches market commentary on the published results of listed insurers, analyst commentary and the visibly favourable run-off of the accident periods 2000 to 2004. The causes noted the impact of the very material changes from tort reform and the general reluctance of actuaries to respond quickly to potential, but untested, good news. Nevertheless a number of the responses emphasise that we are observing a particular phase of the reserving and underwriting cycle. We note that this contrasts with the APRA requirement for actuaries to produce unbiased central estimates which we believe is well understood by actuaries. We note that the question, did not clarify whether the question related to central estimates or the financial provisions which are set at higher probabilities of adequacy.
6%14%
40%
26%14%
94%
Liabilities understated Natural conservatismReserving cycle Caution for tort reformsFavourable / factual outcome
Reasons for liabilities to be overstated in recent years
Figure 14
Participants were also asked to rate the general performance of actuaries’ claims liability analysis over the past three years as ‘good’, ‘reasonable’, ‘adequate’ or ‘weak’. It was possible some respondents interpreted the question to mean the quality of the actual reserves themselves. Given that reservation, it was notable that 88 percent of respondents thought actuaries were doing an adequate or better job of claims liability analysis. The response also suggested that actuaries were happy to over reserve, whatever the reason.
Page 13 of 32 Institute of Actuaries of Australia

Taking this line of inquiry a step further, survey participants were asked to comment on the pressures faced by reserving actuaries. Nearly half the participants took the trouble to answer this question, with all but one of these conceding that they did, indeed, face pressure. Some respondents noted that management was entitled to its expectations, that a degree of challenge was a useful control in the process and that, even in the absence of external pressures, actuaries may still be inclined to ’anchor’ around previous results. The suggested sources of this pressure are summarised in Figure 15.
Sources of pressure Time / increased compliance
8%
Natural15%
M anagement / market cycle
77%
Figure 15
Management expectations and the market cycle were cited as the main sources of pressure Asked to consider whether in recent years they had been subject to more or less external pressure, responding actuaries were evenly split. Several reasons were given for increased pressure on actuaries. IFRS would force insurers to put more pressure on their management of central estimates.
Managements were taking a conservative stance in the current leg of the insurance cycle.
Insurers were responding to increased compliance pressures.
Cost cutting could affect the quality of actuarial work.
Shorter reporting times had increased pressures all round.
Those who thought they were under less pressure pointed to the independence of the Approved Actuary role, the fact that the industry was in the profitable part of the insurance cycle and the development of improved governance standards including external peer review. .The profession recognises that such pressures exist and are a natural part of the reserving area. The survey highlights an area that is a constant and ongoing challenge for reserving actuaries. Namely, what role, if any, should actuaries play in modifying the reserving cycle? Does the way in which actuaries express reserve uncertainty contribute to the making of suspect adjustments, thereby making actuaries part of the problem rather than its solution? These are not new issues, although the survey results serve to re-emphasise their importance.
Page 14 of 32 Institute of Actuaries of Australia
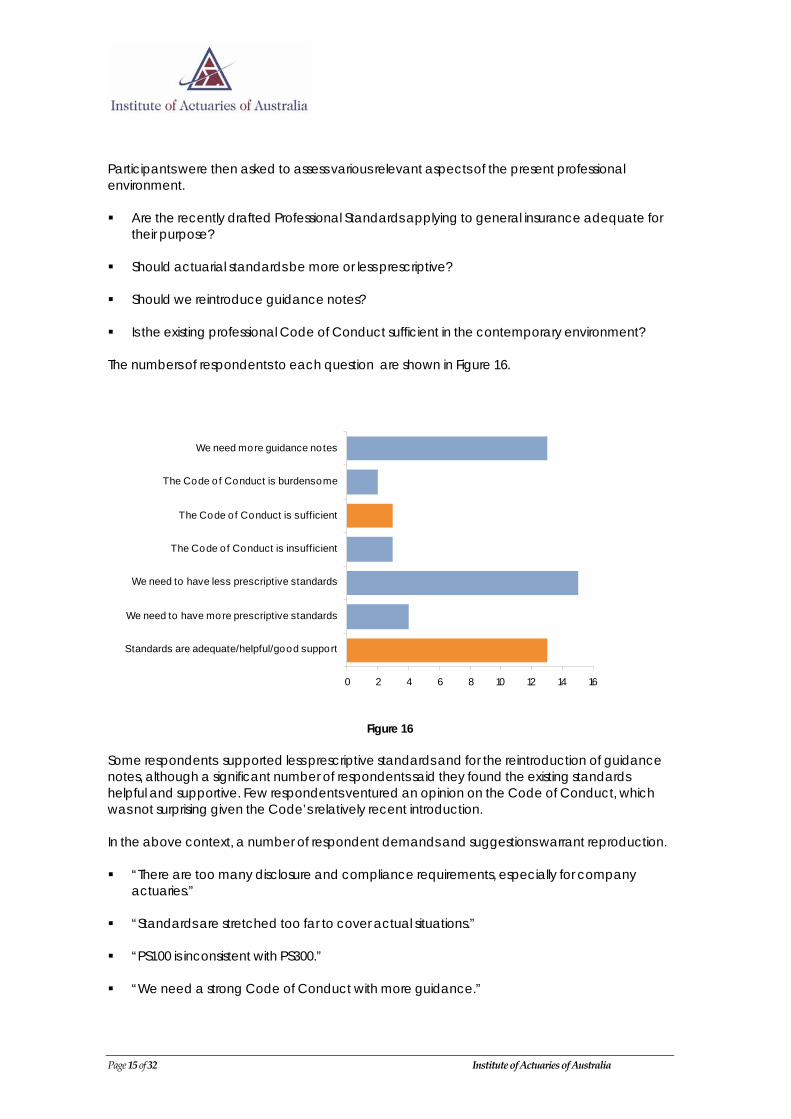
Participants were then asked to assess various relevant aspects of the present professional environment. Are the recently drafted Professional Standards applying to general insurance adequate for
their purpose? Should actuarial standards be more or less prescriptive?
Should we reintroduce guidance notes?
Is the existing professional Code of Conduct sufficient in the contemporary environment?
The numbers of respondents to each question are shown in Figure 16.
0 2 4 6 8 10 12 14 16
Standards are adequate/helpful/good support
We need to have more prescriptive standards
We need to have less prescriptive standards
The Code of Conduct is insufficient
The Code of Conduct is sufficient
The Code o f Conduct is burdensome
We need more guidance notes
Figure 16
Some respondents supported less prescriptive standards and for the reintroduction of guidance notes, although a significant number of respondents said they found the existing standards helpful and supportive. Few respondents ventured an opinion on the Code of Conduct, which was not surprising given the Code’s relatively recent introduction. In the above context, a number of respondent demands and suggestions warrant reproduction. “There are too many disclosure and compliance requirements, especially for company
actuaries.” “Standards are stretched too far to cover actual situations.”
“PS100 is inconsistent with PS300.”
“We need a strong Code of Conduct with more guidance.”
Page 15 of 32 Institute of Actuaries of Australia
“Guidance notes are too formal. Tuition material on the IAAust website would be helpful.”
“Work under all ‘reserved roles’ should be supported by professional standards. Work under non-reserved roles can be supported by guidance notes, which should be reintroduced.”
We asked survey participants to consider how their methodologies and data could be improved. Suggestions included:
‐ changing company culture and attitudes to data quality ‐ introducing sensible diagnostics to better measure the accuracy of actuarial best
estimates ‐ modelling the actual mechanisms that generate claims ‐ developing pricing indices ‐ spending more money to obtain systems that actually work ‐ encouraging greater collaboration between APRA and the industry to deliver more
robust data. We also asked participants to name important issues that were likely to affect liabilities but were hard to factor into actuarial models. Responses to this question covered legislative change, latent claims, the disconnect between the central estimate and 75 percent or higher margins, using peer review to consider what was omitted from actuarial reports and social changes, especially policyholder attitudes to claiming. Finally, we asked participants if they possessed data showing the subsequent accuracy of claims reserve estimates, what it showed and whether they would be willing to share it. Respondents said that where data existed, it generally showed over reserving. Most were unwilling to share this data, in some instances because they did not actually ‘own’ it. Many respondents noted that IFRS and Financial Condition Report requirements were causing this information to be re-examined. Overall, the responses to these final questions again emphasised the need to re-examine risk margin approaches, which is a topic already high on the GIPC agenda through the risk margin task force. Issues involving latent claims were also prominent and, again, a task force is currently examining the matter. Two other matters —legal and social changes — are covered by the superimposed inflation task force.
Conclusion As the American humorist Evan Esar put it, statistics is “the only science that enables different experts using the same figures to draw different conclusions”. Some may contend that this neatly sums up the nature of actuarial work. The uncertainty inherent in much of what we do has informed this account of the Australian Reserving Practices survey. We have tried to avoid drawing conclusions where the data is insufficient. Nonetheless we believe the survey results reinforce the need to better educate the users of actuarial reports about how the information they contain should be used and interpreted.
Page 16 of 32 Institute of Actuaries of Australia
Some specific issues that arose in the survey require the profession’s ongoing attention. One is the important need for more research into risk margin methodologies. Another is achieving that difficult balance between inherent reserve uncertainty, reserve expectations and the need for actuaries to provide unbiased information within an APRA regulatory environment. In an insurance context, decisions about setting reserves for financial statements are finally the province of boards of directors and senior executives guided by the information provided to them by their actuaries (among others). Actuarial information should be clear, unbiased and based on the best available data. The survey acknowledges reserve uncertainty and volatility and the presence of a reserving cycle within the Australian industry. The results place further emphasis on the responsibility of actuaries to not, wittingly or otherwise, contribute to, or ‘go along’ with, decisions perpetuating undesirable reserving cycles. Overall, we believe the Australian Reserving Practices survey is a useful baseline study that will be of use to all actuaries working in general insurance.
Page 17 of 32 Institute of Actuaries of Australia
Appendix: Survey questions and responses We have tabulated the results of all the numerical questions and have presented them here with no further commentary. In order to protect the anonymity of the respondents we have not produced the free form answers in full but where possible have summarised the responses received. Section 1 Background Question 1: Primary employment
Frequency % Insurer 31 34.8
Reinsurer 5 5.6 Runoff insurer/reinsurer 1 1.1
Broker/intermediary - 0.0 Consultancy 47 52.8
Other 5 5.6
Question 2: Experience - years in General Insurance
Frequency % 0-5 21 23.6
6-10 24 27.0 11-15 18 20.2 16-20 15 16.9
21+ 11 12.4
Question 3: Primary practice area
Frequency % General Insurance 83 93.3
Other 6 6.7
Question 4: Involvement with claims reserves
Frequency % The majority of my work is on claims reserves 45 50.6
Claims reserves are only a portion of my work 40 44.9 Not significantly involved in claims reserves 1 1.1
Not at all involved in claims reserves 3 3.4
Page 18 of 32 Institute of Actuaries of Australia
Question 5: Roles within General Insurance - All
Frequency % Approved Actuary 30 33.7
Valuation Actuary supporting Approved Actuary 42 47.2 Pricing Actuary 35 39.3
Reinsurance Actuary 8 9.0 Investment/Capital Management 12 13.5
External peer review Actuary 22 24.7 Audit Assist Actuary 13 14.6
Reserving Actuary - non-APRA regulated entity 39 43.8
Other (please specify) 21 23.6
If ‘other’, please specify.
• M&A • Regulatory supervisory role • Accounting standards • Risk management • Research • DFA • Stockbroking research • Management information • Product management.
Question 6: Roles within General Insurance - primary
Frequency % of Total Sample
Approved Actuary 26 29.2 Valuation Actuary supporting Approved Actuary 26 29.2
Pricing Actuary 2 2.2 Reinsurance Actuary 1 1.1
Investment/Capital Management 3 3.4 External peer review Actuary 3 3.4
Audit Assist Actuary - 0.0 Reserving Actuary - non-APRA regulated entity 17 19.1
Other 10 11.2 [Not Answered] 1 1.1
Page 19 of 32 Institute of Actuaries of Australia

Page 20 of 32 Institute of Actuaries of Australia
Section 2 Reserving current practice
uestion 7: Which methods do you use for claims reserve analysis for short tail?
Q
Always Sometimes Never [Not Answered] Triangulation (including Bornhuetter-Ferguson) 61 13 4 11
Average size x exposure 9 42 27 11 Curve fitting - 19 59 11
Stochastic 1 22 55 11 Notes: a) Adjusted the number of unanswered responses to be consistent for each part by assuming those who answered some parts but did not answer other parts to mean Never for the parts they did not answer
uestion 8: Which methods do you use for claims reserve analysis for CTP? Q
Always Sometimes Never [Not Answered] Triangulation (including Bornhuetter-Ferguson) 32 14 3 40
Average size x exposure 20 20 9 40 Curve fitting 9 22 18 40
Stochastic 10 10 29 40 Notes: a) Adjusted the number of unanswered responses to be consistent for each part by assuming those who answered some parts but did not answer other parts to mean Never for the parts they did not answer
uestion 9: Which methods do you use for claims reserve analysis for other long tail (excluding Qasbestos)?
Always Sometimes Never [Not Answered] Triangulation (including Bornhuetter-Ferguson) 61 13 1 14
Average size x exposure 25 36 14 14 Curve fitting 5 26 44 14
Stochastic 3 26 46 14 Notes: a) Adjusted the number of unanswered responses to be consistent for each part by assuming those who answered some parts but did not answer other parts to mean Never for the parts they did not answer
uestion 10: Which methods do you use for claims reserve analysis for Inwards Reinsurance? Q
Always Sometimes Never [Not Answered] Triangulation (including Bornhuetter-Ferguson) 33 9 2 45
Average size x exposure 7 17 20 45 Curve fitting 1 11 32 45
Stochastic - 8 36 45 Notes: a) Adjusted the number of unanswered responses to be consistent for each part by assuming those who answered some parts but did not answer other parts to mean Never for the parts they did not answer

Page 21 of 32 Institute of Actuaries of Australia
Question 11: Reserving method not mentioned above
IBNR: OS ratio for Inwards Re ed by Neuhaus
ims GLM reserving od for run off portfolios
r smaller or specialist portfolios
uestion 12: If you use the Bornheutter-Ferguson method, what information do you typically used
•• Credibility method as describ• Cape Cod • Individual cla• Decrement based annuity meth• Exposure based modeling • Review of case estimates fo• Inspired guesswork
Qto derive a priori loss ratios?
Frequency % Estim s of more mature years ate 56 62.9
Pricing and claims cost information 58 65.2 Plan loss ratios 33 37.1
Underwriter estimates 29 32.6 Pricing loss ratios 43 48.3
Previous actuarial estimates 39 43.8 I do not use the Bornhuetter-Ferguson method 5 5.6
uestion 13: How do you typically derive net liabilities? Q
Frequency % of Total Sample
% of Sample Answering
Analyse net data 37 41.6 44.0 Analyse gross to ceded data 12 13.5 14.3
Net to gross ratios 16 18.0 19.0 Not applicable 1 1.1 1.2
Other (Please specify) 18 20.2 21.4 [Not Answered] 5 5.6 N/A
’other’, please specify
Explicitly model reinsurance recoveries
s through the actual reinsurance program ry.
If • • Case estimate based • Taking individual claim• Separately model for the event that generate excess of loss recove

Page 22 of 32 Institute of Actuaries of Australia
Question 14: Do you believe that you have data that is sufficiently robust for claims reserve analysis?
Always Sometimes Never [Not Answered] Historical loss development 42 40 1 6
Average size x exposure 17 62 4 6 Curve fitting 10 58 13 8
uestion 15: Do you currently allow for seasonality in establishing premium liabilities? Q
Frequency % of Total Sample % of Sample Answering
Yes 31 34.8 39.7 No, the class(es) of business I value do not experience
seasonal variations 20 22.5 25.6
No, the class(es) of business I value probably experience seasonal variations but I don't currently take it into
account for premium liabilities valuation. 27 30.3 34.6
[Not Answered] 11 12.4 N/A
Section 3 Risk margins current practice Question 16: Are you involved in deriving risk margins?
Frequency % of Total Sample
% of Sample Answering
The organisation I work for does not require risk margin analysis 4 4.5 4.8
The organisation I work for does require risk margin analysis, however I am not involved in deriving risk margins 12 13.5 14.3
I am involved in deriving risk margins 68 76.4 81.0
[Not Answered] 5 5.6 N/A
uestion 17: Which methods do you use for deriving risk margins? Q
Always Sometimes Never [Not Answered] Recommendation from research papers 20 38 5 5
Deterministic quantitative analysis of own data 15 17 23 13 Stochastic quantitative analysis of own data 28 30 7 3
Quantitative analysis on industry data 5 21 28 14 Qualitative analysis 13 32 13 10
Notes: a) Responses from the 68 who are involved in deriving risk margins

Page 23 of 32 Institute of Actuaries of Australia
Question 18: Risk margins methods not mentioned above
Historical loss ratio volatility y analysis
wd, Smith, Hardy (2005) paper i.e. both qualitative and
range in central estimate results from different methods
uestion 19: Are you involved in deriving diversification benefits?
• • Hindsight reserve adequac• Andrew Houltram’s method • Framework described in O’Do
quantitative framework • Compare other results to• General reasoning/common sense • Scenario testing, sensitivity analysis
Q
Frequency % of Total Sample % of Sample Answering
The organisation I work for does not require diversification benefits analysis 13 14.6% 15.9%
The organisation I work for does require diversification benefits analysis, however I am not involved in deriving
diversification benefits 21 23.6% 25.6%
I am involved in deriving diversification benefits 48 53.9% 58.5%
[Not Answered] 7 7.9% N/A
uestion 20: Which methods do you use for deriving diversification benefits? Q
Topic Always Sometimes Never [Not Answered] Recommen from research papers dation 11 25 5 7
Analysis of own data 13 23 6 6 Industry benchmarks 5 22 15 6
General reasoning 20 20 5 3 Notes: a) Responses from the 48 who are involved in deriving diversification benefits
uestion 21: Diversification benefits methods not mentioned above
Synchronous bootstrapping s
simulation to identify the root causes of correlation between classes of business
r
Q
• • Square root of sum of square• Copulas • Stochastic
and then model these explicitly (as described in O’Dowd, Smith and Hardy 2005 paper) • Tracking over time • Plucking from the ai

Page 24 of 32 Institute of Actuaries of Australia
Question 22: Do you consider tail dependencies?
Frequency % For APRA risk ma n purposes (ie. 75% level of rgi
sufficiency) 19 21.3
For the purposes of setting risk margins at a higher level of sufficiency 20 22.5
For reinsurance purposes 8 9.0
For commutation/commercial negotiation purposes 4 4.5
For capital purposes 12 13.5 No, tail dependencies are not considered at all 38 42.7
uestion 23: Do you believe that you have data that is sufficiently robust for risk margins analysis? Q
Frequency % of Total Sample % of Sample Answering
Yes, own data is adequate 13 14.6 17.1 Yes, own data supplemented by industry data is
adequate 21 23.6 27.6
No 42 47.2 55.3 [Not Answered] 13 14.6% N/A
no’, please specify limitations
Data is rarely sufficient at extremes of the distribution e estimates and payments
portfolio has been in existence cient
d tail dependencies
ndustry data is not entirely applicable
ber of data points
If ‘ • • Not enough valuation results data as opposed to cas• Not enough own data or small number of claims • No data • Short time• For higher than 75% POS the data is not suffi• Not sufficiently robust for diversification benefits an• Data too heterogeneous • Need more industry data however i• Environmental changes make it difficult to develop underlying distributions • Absence of good qualitative information • Diversification benefit is limited by the num
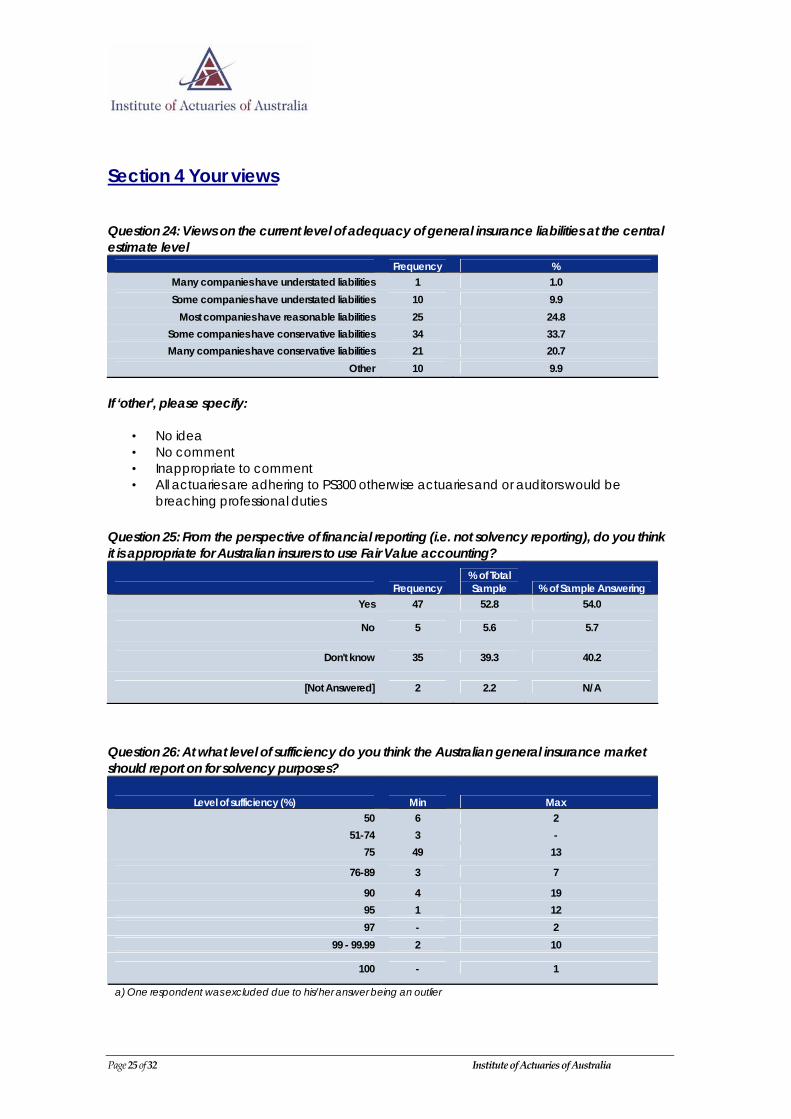
Section 4 Your views Question 24: Views on the current level of adequacy of general insurance liabilities at the central estimate level
Frequency % Many companies have understated liabilities 1 1.0 Some companies have understated liabilities 10 9.9
Most companies have reasonable liabilities 25 24.8 Some companies have conservative liabilities 34 33.7 Many companies have conservative liabilities 21 20.7
Other 10 9.9
If ‘other’, please specify:
• No idea • No comment • Inappropriate to comment • All actuaries are adhering to PS300 otherwise actuaries and or auditors would be
breaching professional duties Question 25: From the perspective of financial reporting (i.e. not solvency reporting), do you think it is appropriate for Australian insurers to use Fair Value accounting?
Frequency % of Total Sample % of Sample Answering
Yes 47 52.8 54.0
No 5 5.6 5.7
Don't know 35 39.3 40.2
[Not Answered] 2 2.2 N/A
Question 26: At what level of sufficiency do you think the Australian general insurance market should report on for solvency purposes?
Level of sufficiency (%) Min Max 50 6 2
51-74 3 - 75 49 13
76-89 3 7
90 4 19 95 1 12 97 - 2
99 - 99.99 2 10
100 - 1
a) One respondent was excluded due to his/her answer being an outlier
Page 25 of 32 Institute of Actuaries of Australia
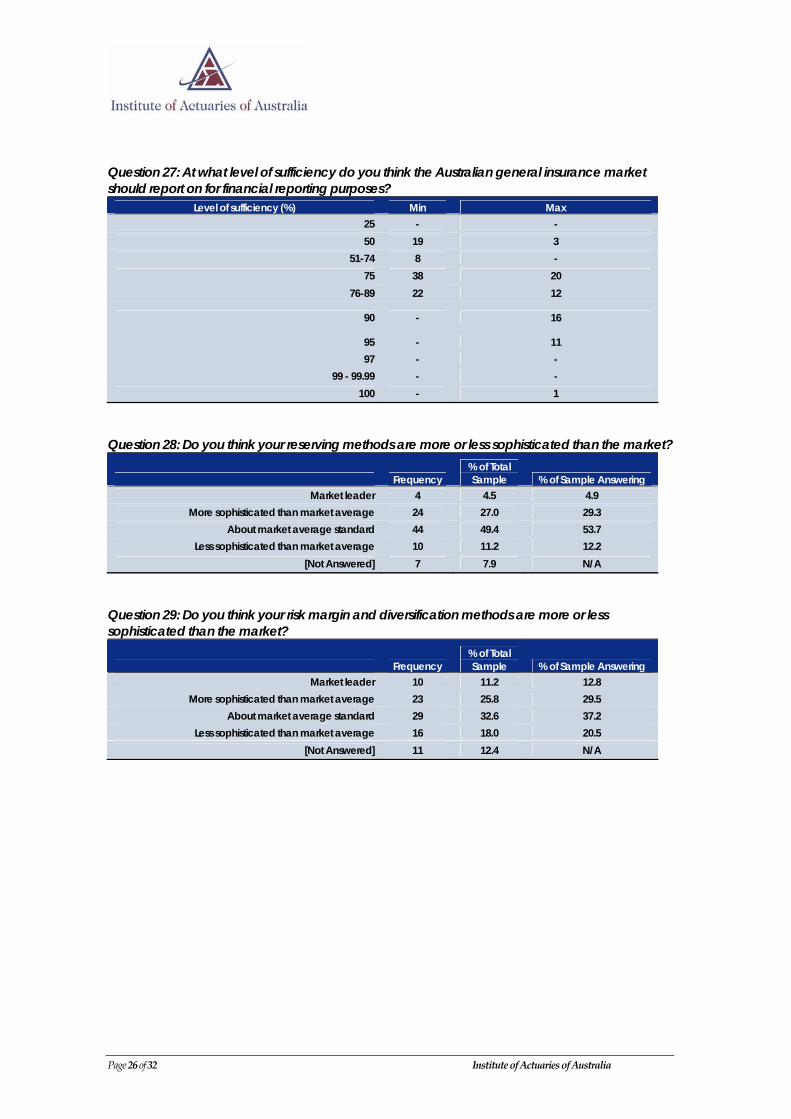
Question 27: At what level of sufficiency do you think the Australian general insurance market should report on for financial reporting purposes?
Level of sufficiency (%) Min Max 25 - - 50 19 3
51-74 8 - 75 38 20
76-89 22 12
90 - 16
95 - 11 97 - -
99 - 99.99 - - 100 - 1
Question 28: Do you think your reserving methods are more or less sophisticated than the market?
Frequency % of Total Sample % of Sample Answering
Market leader 4 4.5 4.9 More sophisticated than market average 24 27.0 29.3
About market average standard 44 49.4 53.7 Less sophisticated than market average 10 11.2 12.2
[Not Answered] 7 7.9 N/A
Question 29: Do you think your risk margin and diversification methods are more or less sophisticated than the market?
Frequency % of Total Sample % of Sample Answering
Market leader 10 11.2 12.8 More sophisticated than market average 23 25.8 29.5
About market average standard 29 32.6 37.2 Less sophisticated than market average 16 18.0 20.5
[Not Answered] 11 12.4 N/A
Page 26 of 32 Institute of Actuaries of Australia
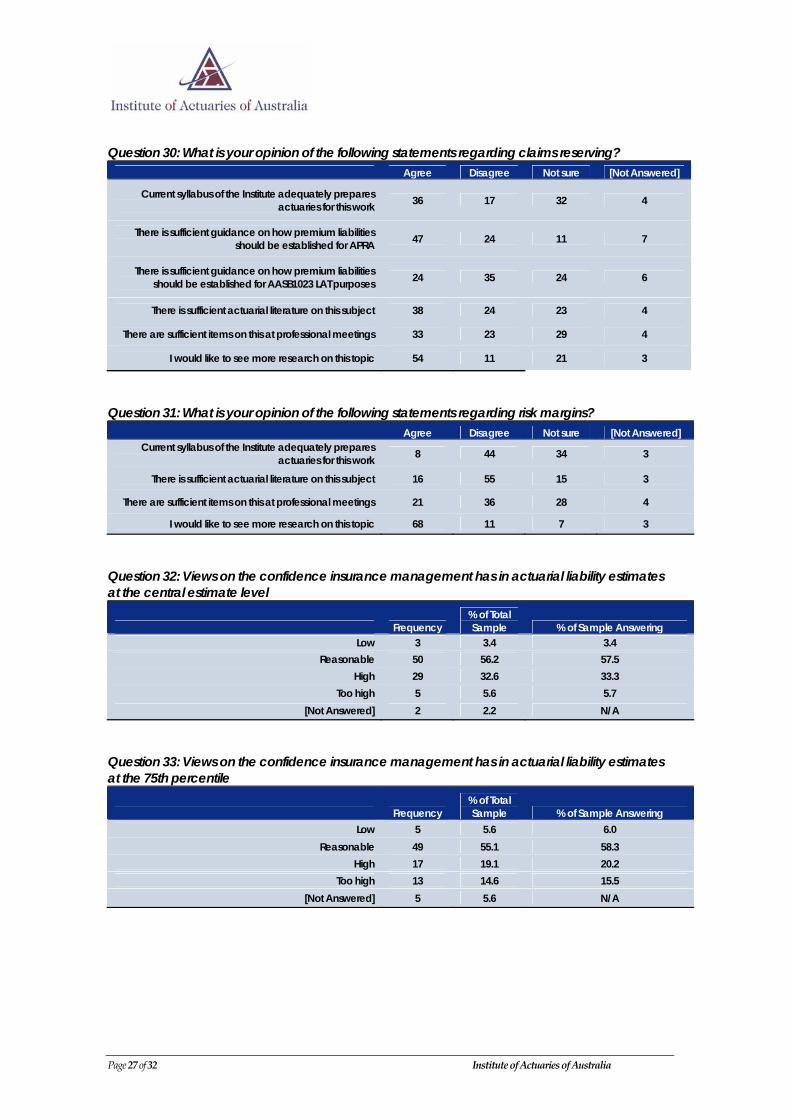
Question 30: What is your opinion of the following statements regarding claims reserving?
Agree Disagree Not sure [Not Answered]
Current syllabus of the Institute adequately prepares actuaries for this work 36 17 32 4
There is sufficient guidance on how premium liabilities should be established for APRA 47 24 11 7
There is sufficient guidance on how premium liabilities should be established for AASB1023 LAT purposes 24 35 24 6
There is sufficient actuarial literature on this subject 38 24 23 4
There are sufficient items on this at professional meetings 33 23 29 4
I would like to see more research on this topic 54 11 21 3
Question 31: What is your opinion of the following statements regarding risk margins?
Agree Disagree Not sure [Not Answered] Current syllabus of the Institute adequately prepares
actuaries for this work 8 44 34 3
There is sufficient actuarial literature on this subject 16 55 15 3
There are sufficient items on this at professional meetings 21 36 28 4
I would like to see more research on this topic 68 11 7 3
Question 32: Views on the confidence insurance management has in actuarial liability estimates at the central estimate level
Frequency % of Total Sample % of Sample Answering
Low 3 3.4 3.4 Reasonable 50 56.2 57.5
High 29 32.6 33.3 Too high 5 5.6 5.7
[Not Answered] 2 2.2 N/A
Question 33: Views on the confidence insurance management has in actuarial liability estimates at the 75th percentile
Frequency % of Total Sample % of Sample Answering
Low 5 5.6 6.0 Reasonable 49 55.1 58.3
High 17 19.1 20.2 Too high 13 14.6 15.5
[Not Answered] 5 5.6 N/A
Page 27 of 32 Institute of Actuaries of Australia
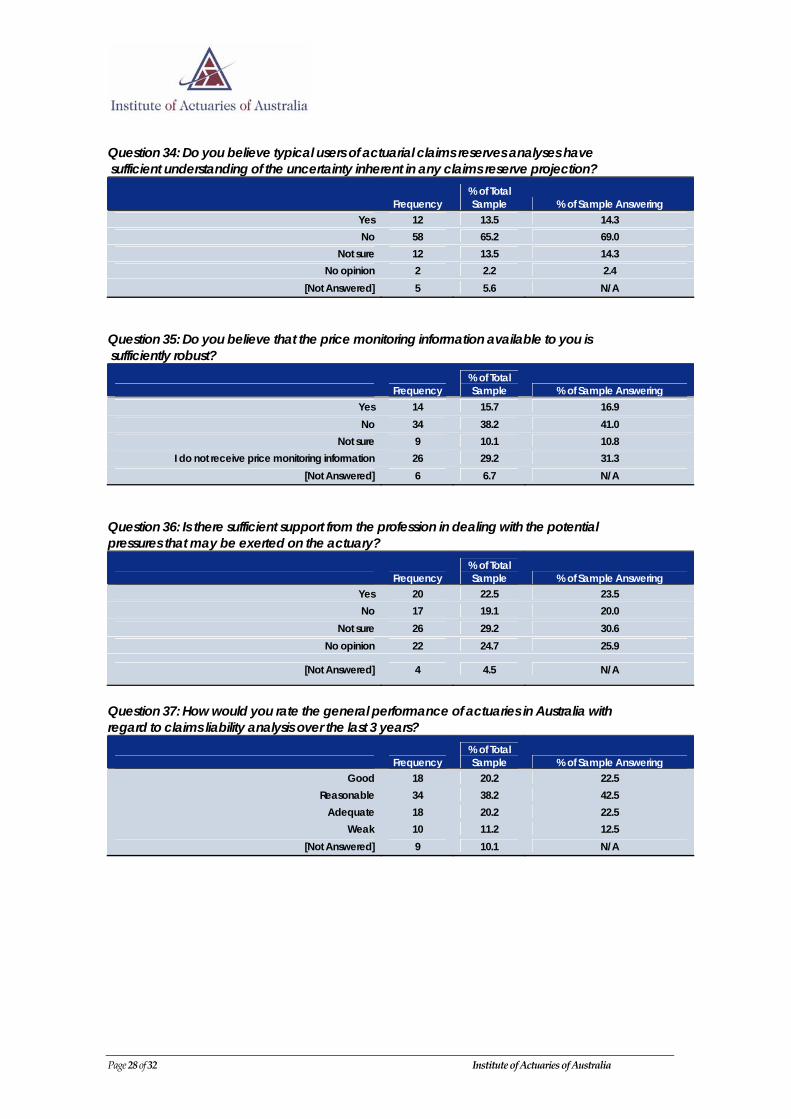
Question 34: Do you believe typical users of actuarial claims reserves analyses have sufficient understanding of the uncertainty inherent in any claims reserve projection?
Frequency % of Total Sample % of Sample Answering
Yes 12 13.5 14.3 No 58 65.2 69.0
Not sure 12 13.5 14.3 No opinion 2 2.2 2.4
[Not Answered] 5 5.6 N/A
Question 35: Do you believe that the price monitoring information available to you is sufficiently robust?
Frequency % of Total Sample % of Sample Answering
Yes 14 15.7 16.9 No 34 38.2 41.0
Not sure 9 10.1 10.8 I do not receive price monitoring information 26 29.2 31.3
[Not Answered] 6 6.7 N/A
Question 36: Is there sufficient support from the profession in dealing with the potential pressures that may be exerted on the actuary?
Frequency % of Total Sample % of Sample Answering
Yes 20 22.5 23.5 No 17 19.1 20.0
Not sure 26 29.2 30.6 No opinion 22 24.7 25.9
[Not Answered] 4 4.5 N/A
Question 37: How would you rate the general performance of actuaries in Australia with regard to claims liability analysis over the last 3 years?
Frequency % of Total Sample % of Sample Answering
Good 18 20.2 22.5 Reasonable 34 38.2 42.5
Adequate 18 20.2 22.5 Weak 10 11.2 12.5
[Not Answered] 9 10.1 N/A
Page 28 of 32 Institute of Actuaries of Australia

Question 38: Does your company book liabilities for financial statement purposes at the 75 percent probability of sufficiency as calculated by the actuary?
Frequency % of Total Sample % of Sample Answering
Yes, most of the time 32 36.0 68.1 No, the company doesn't have a policy of booking
actuarial estimates 1 1.1 2.1
No, it is company policy to hold reserves at a higher level of sufficiency 30 33.7 63.8
No, it is company policy to hold reserves at a lower level of sufficiency 1 1.1 2.1
No, we operate under a different accounting regime 7 7.9 14.9
No, other reasons 8 9.0 17.0 [Not Answered] 10 11.2 N/A
Question 39: Does your company use a different probability of sufficiency for booking outstanding claims liabilities versus performing the Liability Adequacy Test?
Frequency % of Total Sample % of Sample Answering
Yes, LAT POS is lower 18 20.2 27.3 Yes, LAT POS is higher - 0.0 0.0
No, we use the same POS for both 48 53.9 72.7 [Not Answered] 23 25.8 N/A
Question 40: Other comments relating to this section
• No consistency between companies in calculating risk margins leading to discrepancies
in reported results. • Not enough guidance on risk margins. • A more conservative number is not necessarily a better number for shareholders. • Risk margins may be an area of reputation risk for the profession due to too much
confidence shown in theory which we don’t have a robust basis for. • EPR may be going over the top and may be bad for the profession. • It may appear that reserving has become too complicated and the opportunity to
substantially improve the quality of insurance reporting and regulation has been missed • LAT POS has not yet been subject to the same media/analyst scrutiny. • There are no reasons why LAT and outstanding claims should have the same level of
sufficiency. • The profession should focus on getting central estimates as accurate as possible, risk
margins are a distraction. The level of capital resources is a far more significant issue. • We would be better off if APRA mandated a schedule of margins to use as a function of
class of business and size of liability.
Page 29 of 32 Institute of Actuaries of Australia
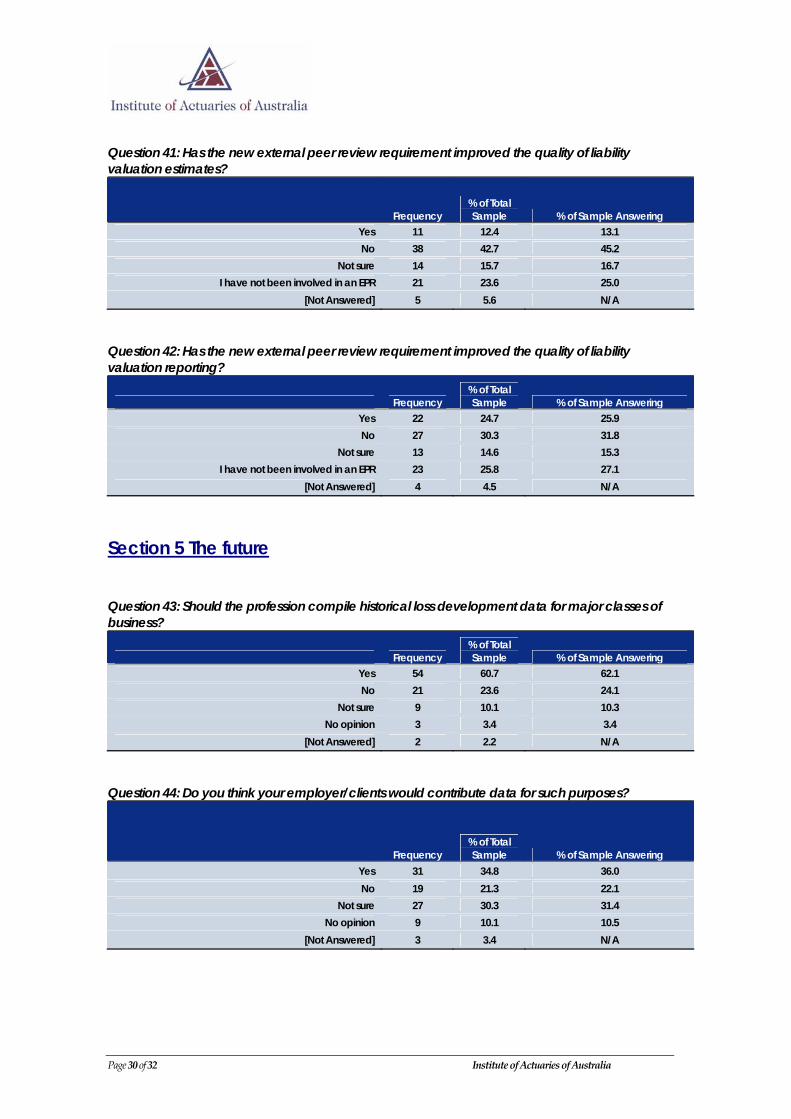
Question 41: Has the new external peer review requirement improved the quality of liability valuation estimates?
Frequency % of Total Sample % of Sample Answering
Yes 11 12.4 13.1 No 38 42.7 45.2
Not sure 14 15.7 16.7 I have not been involved in an EPR 21 23.6 25.0
[Not Answered] 5 5.6 N/A
Question 42: Has the new external peer review requirement improved the quality of liability valuation reporting?
Frequency % of Total Sample % of Sample Answering
Yes 22 24.7 25.9 No 27 30.3 31.8
Not sure 13 14.6 15.3 I have not been involved in an EPR 23 25.8 27.1
[Not Answered] 4 4.5 N/A
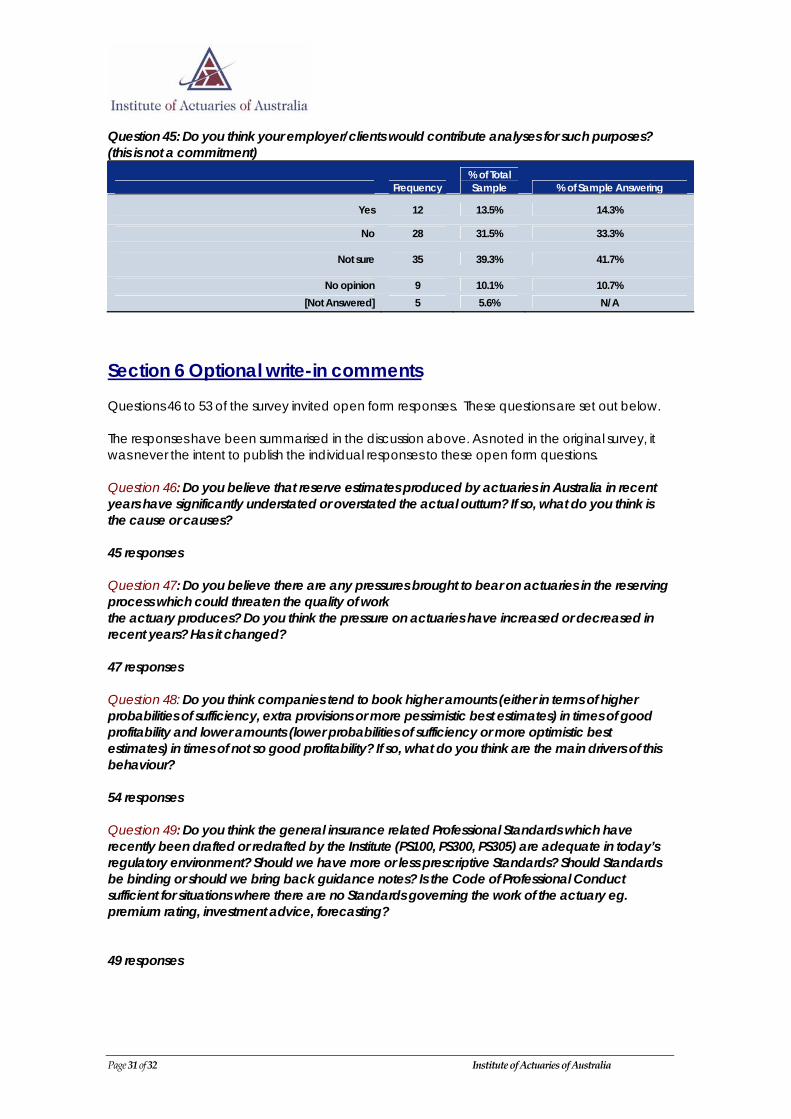
Section 5 The future Question 43: Should the profession compile historical loss development data for major classes of business?
Frequency % of Total Sample % of Sample Answering
Yes 54 60.7 62.1 No 21 23.6 24.1
Not sure 9 10.1 10.3 No opinion 3 3.4 3.4
[Not Answered] 2 2.2 N/A
Question 44: Do you think your employer/clients would contribute data for such purposes?
Frequency % of Total Sample % of Sample Answering
Yes 31 34.8 36.0 No 19 21.3 22.1
Not sure 27 30.3 31.4 No opinion 9 10.1 10.5
[Not Answered] 3 3.4 N/A
Page 30 of 32 Institute of Actuaries of Australia
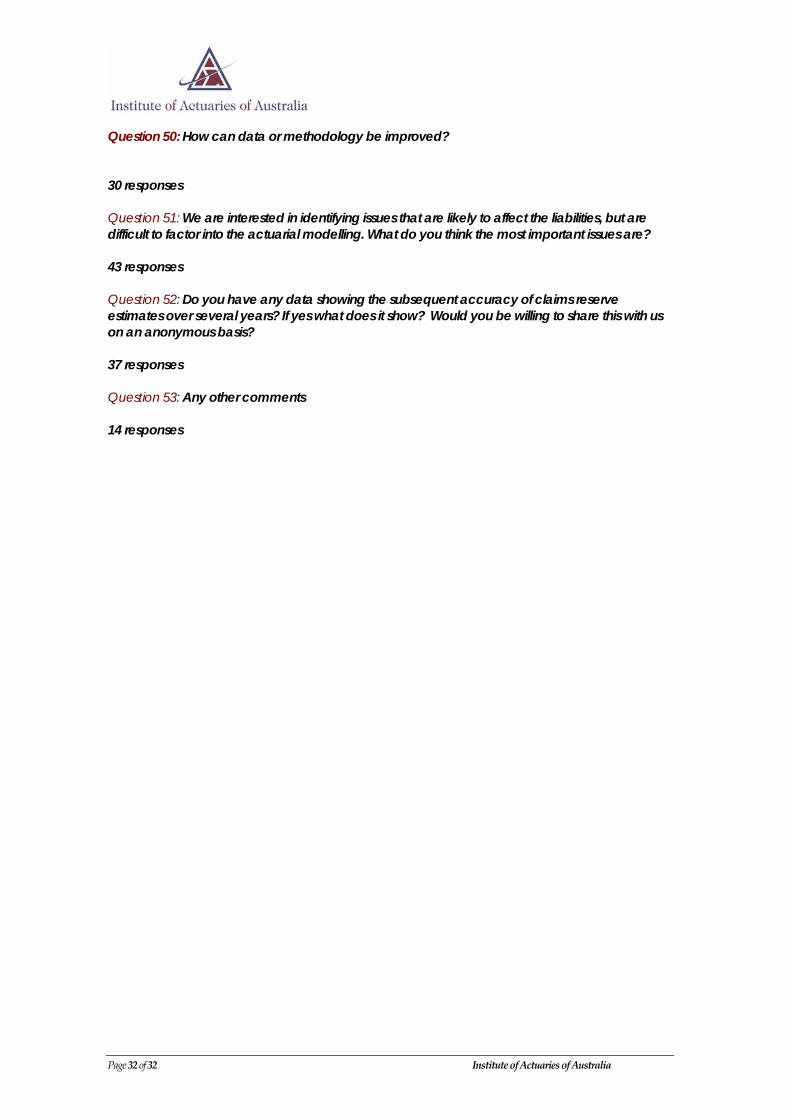
Question 45: Do you think your employer/clients would contribute analyses for such purposes? (this is not a commitment)
Frequency % of Total Sample % of Sample Answering
Yes 12 13.5% 14.3%
No 28 31.5% 33.3%
Not sure 35 39.3% 41.7%
No opinion 9 10.1% 10.7% [Not Answered] 5 5.6% N/A
Section 6 Optional write-in comments Questions 46 to 53 of the survey invited open form responses. These questions are set out below. The responses have been summarised in the discussion above. As noted in the original survey, it was never the intent to publish the individual responses to these open form questions. Question 46: Do you believe that reserve estimates produced by actuaries in Australia in recent years have significantly understated or overstated the actual outturn? If so, what do you think is the cause or causes? 45 responses Question 47: Do you believe there are any pressures brought to bear on actuaries in the reserving process which could threaten the quality of work the actuary produces? Do you think the pressure on actuaries have increased or decreased in recent years? Has it changed? 47 responses Question 48: Do you think companies tend to book higher amounts (either in terms of higher probabilities of sufficiency, extra provisions or more pessimistic best estimates) in times of good profitability and lower amounts (lower probabilities of sufficiency or more optimistic best estimates) in times of not so good profitability? If so, what do you think are the main drivers of this behaviour? 54 responses Question 49: Do you think the general insurance related Professional Standards which have recently been drafted or redrafted by the Institute (PS100, PS300, PS305) are adequate in today’s regulatory environment? Should we have more or less prescriptive Standards? Should Standards be binding or should we bring back guidance notes? Is the Code of Professional Conduct sufficient for situations where there are no Standards governing the work of the actuary eg. premium rating, investment advice, forecasting? 49 responses
Page 31 of 32 Institute of Actuaries of Australia
Question 50: How can data or methodology be improved? 30 responses Question 51: We are interested in identifying issues that are likely to affect the liabilities, but are difficult to factor into the actuarial modelling. What do you think the most important issues are? 43 responses Question 52: Do you have any data showing the subsequent accuracy of claims reserve estimates over several years? If yes what does it show? Would you be willing to share this with us on an anonymous basis? 37 responses Question 53: Any other comments 14 responses
Page 32 of 32 Institute of Actuaries of Australia