Embed Size (px)
Citation preview
stephen hooper, caroline henry, dale ashton and milly lubulwa
october 2007
abare research report 07.18
abare abar
ein
nova
tion
in e
cono
mic
s
australian sugar cane growersfi nancial performance 2005-06
abareconomics.com
ii
© Commonwealth of Australia 2007
This work is copyright. The Copyright Act 1968 permits fair dealing for study, research, news reporting, criticism or review. Selected passages, tables or diagrams may be reproduced for such purposes provided acknowledgment of the source is included. Major extracts or the entire document may not be reproduced by any process without the written permission of the Executive Director, ABARE.
ISSN 1037-8286ISBN 978-1-921448-01-0
Hooper, S., Henry, C., Ashton, D. and Lubulwa, M. 2007, Australian Sugar Cane Growers: Financial Performance 2005-06, ABARE Research Report 07.18 Prepared for the Sugar Industry Oversight Group, Canberra, October.
Australian Bureau of Agricultural and Resource EconomicsGPO Box 1563 Canberra 2601
Telephone +61 2 6272 2000 Facsimile +61 2 6272 2001Internet abareconomics.com
ABARE is a professionally independent government economic research agency.
ABARE project 3174
iii
sugar industry survey » abare research report 07.18
foreword
The Australian sugar cane industry is facing the challenge of enhancing producers’ profi tability during a period of increasing competition in export markets and declining returns. Industry stakeholders, government decision makers and growers need to become better informed about the key factors likely to affect costs of production and fi nancial performance. This information is critical in assessing the risks and challenges facing sugar cane growers and is particularly important for the future development of strategies and R&D programs to improve the long run viability of sugar cane production.
This study profi les sugar cane growers in Australia and was conducted on behalf of the Sugar Industry Oversight Group (IOG), in collaboration with CANEGROWERS and funded by the Australian Government Department of Agriculture, Fisheries and Forestry. The objective of this study was to identify the distinguishing characteristics, in terms of production and fi nancial performance, of farms of varying sizes and the management practices used by farmers that are likely to be critical for the long term viability of these producers.
This report contains a snapshot of farm performance for the 2005-06 fi nancial year based on comprehensive production and fi nancial performance data collected from sugar cane growers in Australia. ABARE and the Sugar IOG are confi dent that the information in this report will provide an insight into the produc-tion and management issues faced by Australian sugar cane growers.
Phillip Glyde Bruce Vaughan AO Executive Director ChairmanABARE Sugar Industry Oversight Group
October 2007
iv
sugar industry survey » abare research report 07.18
acknowledgments
This work was commissioned by the Sugar Industry Oversight Group (IOG) and funded through the Sugar Industry Reform Program 2004, with funding adminis-tered by the Department of Agriculture, Fisheries and Forestry (DAFF). The authors are grateful for the feedback provided by the IOG, Paul Maisey and Noel Benjamin of DAFF and Eric Danzi of CANEGROWERS. The authors also grate-fully acknowledge the constructive comments colleague Thilak Mallawaarachchi of ABARE, the efforts of the ABARE surveys section for collecting the data, and specifi c thanks to the sugar cane producers who participated in the survey.
v
sugar industry survey » abare research report 07.18
contents
summary 1
1 introduction 3
2 physical characteristics of sugar cane farms 5
3 fi nancial performance of sugar cane growers 9
cash receipts from sugar cane production 9cash costs of sugar cane production 13
4 farm management practices 18
farm management plan 18farmer intentions 19irrigation managemant 21information sources 23
appendix
A survey methodology and defi nitions 25
defi nition of terms 29
fi guresA area and production of sugar cane 3B proportion of farms reducing sugar cane area, 2006-07 8C unit cash cost of sugar cane production, by region, 2005-06 15D gross margin of sugar cane production, by region, 2005-06 17E expected level of involvement in current enterprise
in 3 years time, 2005-06 20F sugar cane producers who intend to reduce area sown to
sugar cane in 3 years time, by region, 2005-06 20
vi
sugar industry survey » abare research report 07.18
G impediments to farm expansion, 2005-06 21H source of irrigation water, 2005-06 22I likely changes in the event of a reduction in irrigation
water availability or increased water prices, 2005-06 22J sources of information for farm management, 2005-06 23K proportion of farmers who undertook activities to improve
their management and technical skills, 2005-06 24
map1 Queensland and New South Wales sugar mills 4
tables1 distribution of farms, by quantity of cane produced,
2005-06 52 distribution of farms, by selected estimates, by quartile,
2005-06 53 selected physical estimates, by size groups 64 sugar cane production, by region 75 sugar cane yield, by region, 2005-06 86 fi nancial performance – cash receipts, by size groups,
2005-06 107 selected fi nancial performance, by region and size groups,
2005-06 118 selected estimates, by rate of return, 2005-06 129 fi nancial performance – cash cost, by size groups, 2005-06 1410 gross margin of producers, by region and size group,
2005-06 1611 selected estimates, by unit cost of sugar cane production,
2005-06 1712 farms with a written plan for managing the farm business,
by size group, 2005-06 1813 importance of drought management, 2005-06 19
1
sugar industry survey » abare research report 07.18
summary
» Increased competition from major sugar exporting countries such as Brazil has put pressure on prices in Australia’s export markets, and subsequently on returns for Australian sugar cane growers. In order for the Australian sugar cane industry to remain viable and competitive, producers, millers and the whole sugar value chain need to continue improving productivity.
» The Australian sugar cane growing industry is in transition, with the volume of production relatively stable but with a reduced number of producers, suggesting a trend toward a smaller number of larger farms. A key reason for this transition appears to be some economies of size.
» In 2005-06, there were 4824 sugar cane growers in Australia, who produced, on average, 8250 tonnes of sugar cane per farm. However, there was a wide dispersion of farm sizes and sugar cane production around this average. Nearly two-thirds of growers produced less than 7500 tonnes of sugar cane and accounted for around a quarter of Australia’s sugar cane production in 2005-06. In comparison, an estimated 3 per cent of growers produced more than 30 000 tonnes and accounted for around 22 per cent of national sugar cane production.
» Farm cash income for sugar cane growers averaged $66 600 in 2005-06; however, an estimated 27 per cent of producers reported negative farm cash incomes. Most of the farms reporting negative farm cash incomes were smaller sugar cane growers producing less than 7500 tonnes. Regions with below average incomes included southern Queensland, New South Wales, Bunda-berg and far north Queensland. These regions had a relatively high concentra-tion of small scale sugar cane growers.
» The survey results indicate that fi nancial performance improved as the scale of sugar cane production increased in every region. For example, in the Burdekin, farms producing less than 15 000 tonnes of sugar cane reported a loss of $40 200, compared with a profi t of $22 400 for farms producing 15 000 – 30 000 tonnes of sugar cane and $357 600 for farms producing more than 30 000 tonnes.
» The survey results suggest that there may be some economies of size (whereby average unit cash costs of production decline as fi rms expand production)
2
sugar industry survey » abare research report 07.18
in the Australian sugar cane growing industry. The average unit cash cost of production for the smallest sugar cane growers, by quantity of sugar cane produced, is estimated to have been around $21 a tonne in 2005-06. For the largest sugar cane growers, the average unit cash cost of production in 2005-06 is estimated to have been around $18 a tonne.
» In 2005-06, the average gross margin of sugar cane production is estimated to have been around $8 a tonne. Sugar cane production was most profi table for growers in the Ord River and Herbert regions, and least profi table for growers in New South Wales and far north Queensland.
» Around half of all producers indicated that they expect to maintain or increase sugar cane production over the next three years, compared with 16 per cent of producers who expected to reduce the area sown to sugar.
» The survey results show that sugar cane producers have actively sought infor-mation to better manage their farms. The most common sources of informa-tion on farm management and production used by sugar cane growers were family, friends and other growers. Nearly 80 per cent of sugar cane growers obtained information from industry organisations such as the cane growers associations and over 60 per cent sourced information from the media.
» In 2005-06, an estimated 33 per cent of sugar cane growers had a written farm management plan, with nearly all producers’ plans containing information on production activities, natural resource management, and business activities. However, of the farms with management plans, only 47 per cent contained information on people management and succession planning. The survey results indicate that the proportion of farm plans including people manage-ment and succession planning increased signifi cantly with the volume of sugar cane production, refl ecting the greater reliance of larger producers on hired labour.
3
introduction
In March 2007, ABARE conducted a survey of sugar cane growers on behalf of the Sugar Industry Oversight Group (IOG) and in collaboration with CANE-GROWERS. The survey was funded by the Australian Government Department of Agriculture, Fisheries and Forestry. The aim of the survey was to collect compre-hensive production and fi nancial data for 2005-06 from 291 farms to analyse the fi nancial performance of sugar cane growers in Australia.
This report presents detailed physical and fi nancial performance indicators for sugar cane growers by region. A more detailed set of regional estimates is provided in a separate document presented with this report. Results from the survey are designed to provide information about the key factors likely to affect farm costs of production and fi nancial performance.
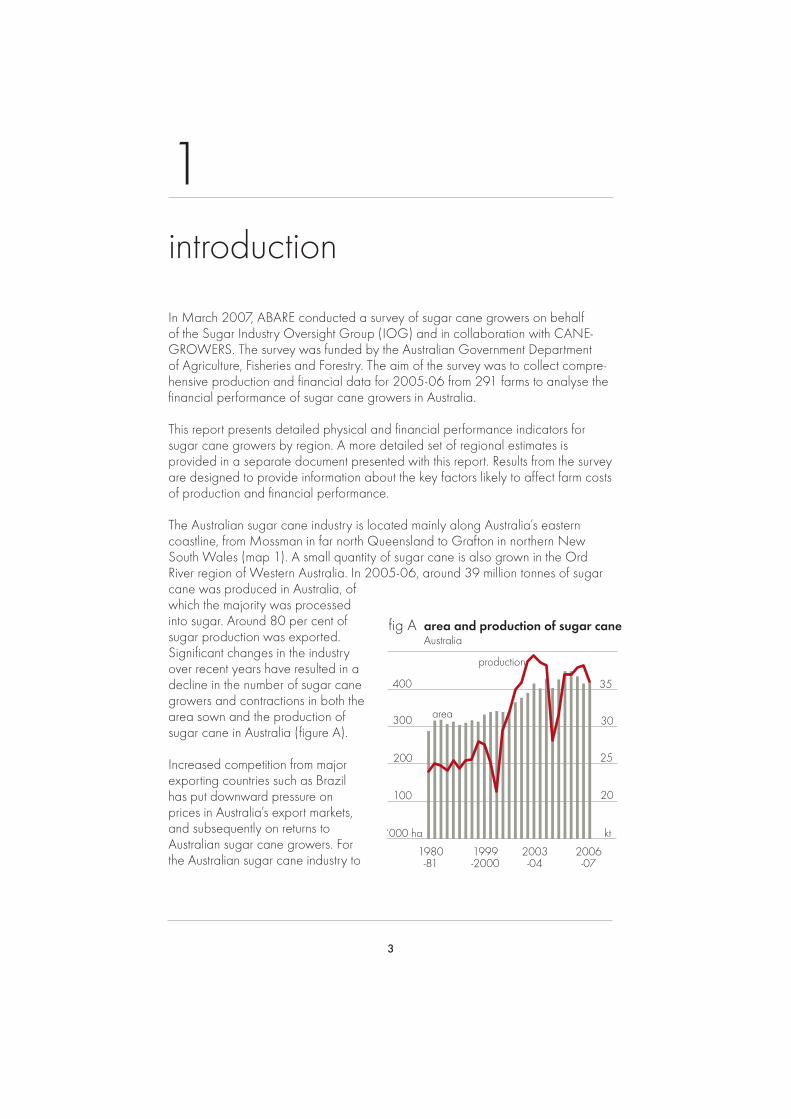
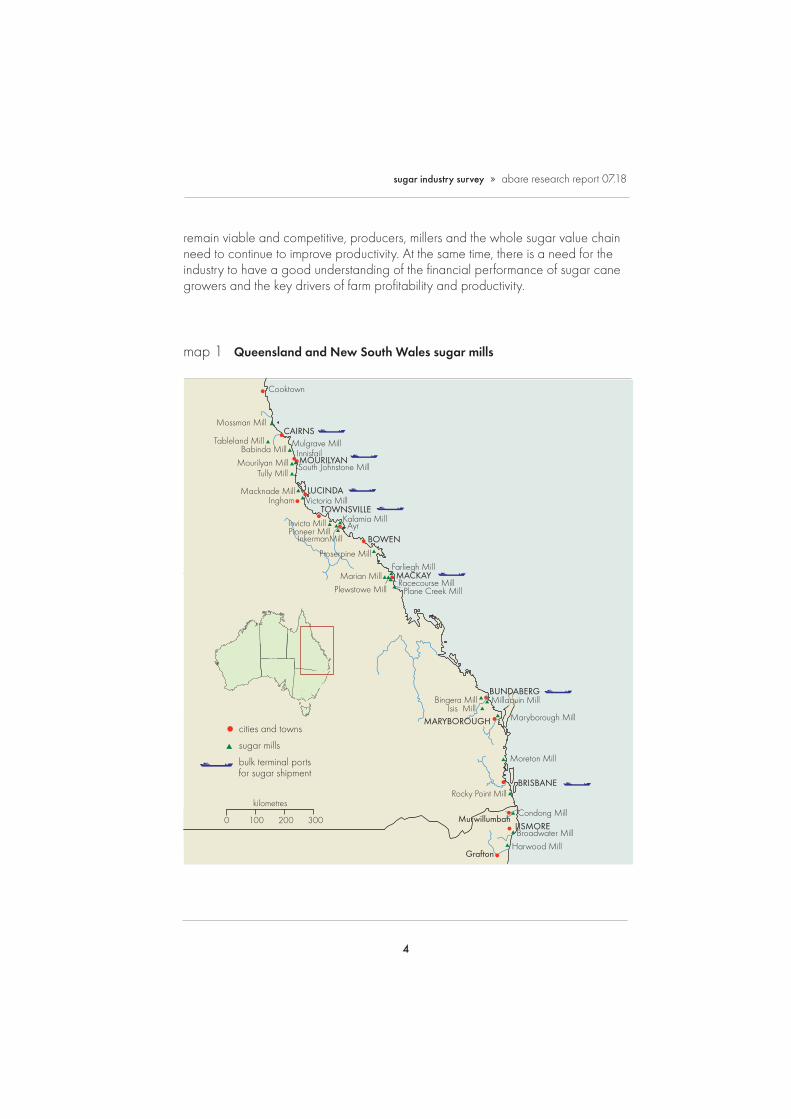
The Australian sugar cane industry is located mainly along Australia’s eastern coastline, from Mossman in far north Queensland to Grafton in northern New South Wales (map 1). A small quantity of sugar cane is also grown in the Ord River region of Western Australia. In 2005-06, around 39 million tonnes of sugar cane was produced in Australia, of which the majority was processed into sugar. Around 80 per cent of sugar production was exported. Signifi cant changes in the industry over recent years have resulted in a decline in the number of sugar cane growers and contractions in both the area sown and the production of sugar cane in Australia (fi gure A).
Increased competition from major exporting countries such as Brazil has put downward pressure on prices in Australia’s export markets, and subsequently on returns to Australian sugar cane growers. For the Australian sugar cane industry to
1
fig A area and production of sugar caneAustralia
1980-81
1999-2000
2003-04
2006-07
20
kt
25
30
35
‘000 ha
300
400
100
200
production
area
4
sugar industry survey » abare research report 07.18
remain viable and competitive, producers, millers and the whole sugar value chain need to continue to improve productivity. At the same time, there is a need for the industry to have a good understanding of the fi nancial performance of sugar cane growers and the key drivers of farm profi tability and productivity.
map 1 Queensland and New South Wales sugar mills
cities and towns
sugar mills
bulk terminal ports for sugar shipment
kilometres
0 100 200 300
Cooktown
CAIRNSMulgrave Mill
Mossman Mill
MOURILYAN
LUCINDA
TOWNSVILLEKalamia Mill
Farliegh Mill
Plane Creek MillRacecourse MillMACKAY
BOWEN
Ayr
South Johnstone Mill
Victoria Mill
Tully MillMourilyan Mill
Babinda MillTableland Mill
Macknade Mill
Proserpine Mill
Marian MillPlewstowe Mill
InkermanMillPioneer MillInvicta Mill
Ingham
Innisfail
MARYBOROUGH
Bingera MillIsis Mill
Maryborough Mill
LISMORE
BRISBANE
Broadwater MillHarwood Mill
Condong Mill
Moreton Mill
Rocky Point Mill
Murwillumbah
Grafton
Millaquin MillBUNDABERG
5
physical characteristics of sugar cane farms
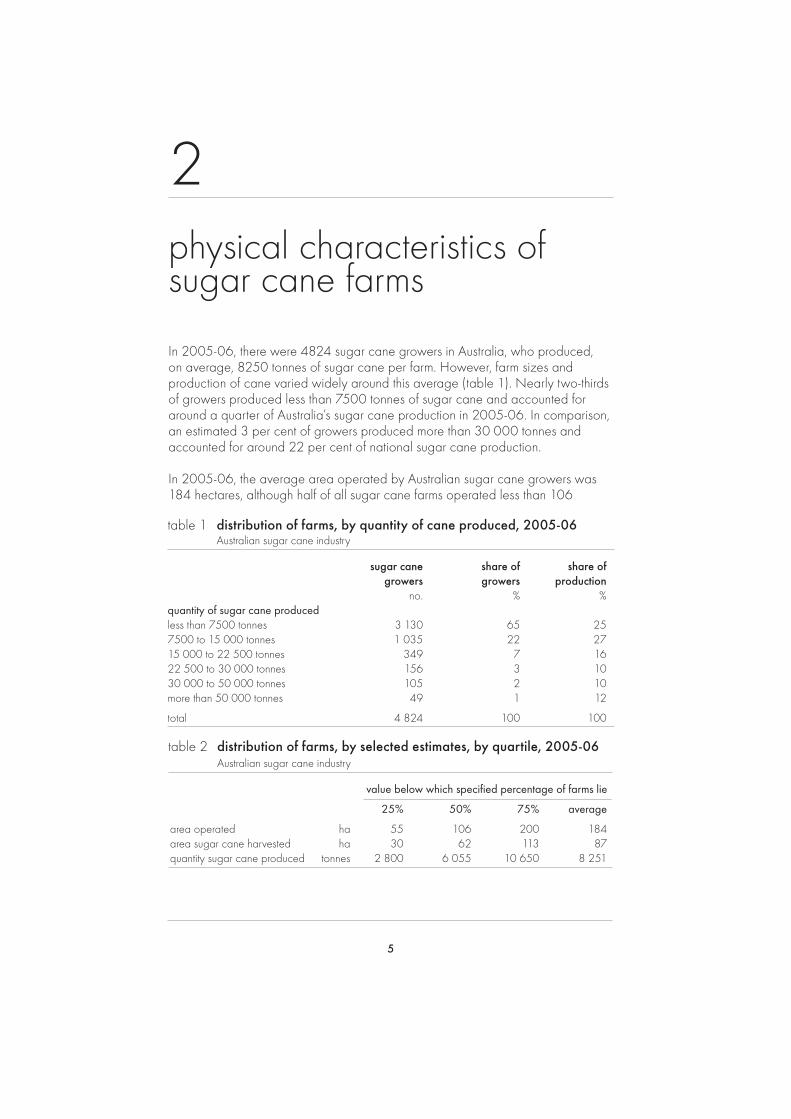
In 2005-06, there were 4824 sugar cane growers in Australia, who produced, on average, 8250 tonnes of sugar cane per farm. However, farm sizes and production of cane varied widely around this average (table 1). Nearly two-thirds of growers produced less than 7500 tonnes of sugar cane and accounted for around a quarter of Australia’s sugar cane production in 2005-06. In comparison, an estimated 3 per cent of growers produced more than 30 000 tonnes and accounted for around 22 per cent of national sugar cane production.
In 2005-06, the average area operated by Australian sugar cane growers was 184 hectares, although half of all sugar cane farms operated less than 106
table 1 distribution of farms, by quantity of cane produced, 2005-06Australian sugar cane industry
sugar cane share of share of growers growers production no. % %quantity of sugar cane produced less than 7500 tonnes 3 130 65 257500 to 15 000 tonnes 1 035 22 2715 000 to 22 500 tonnes 349 7 1622 500 to 30 000 tonnes 156 3 1030 000 to 50 000 tonnes 105 2 10more than 50 000 tonnes 49 1 12
total 4 824 100 100
2
table 2 distribution of farms, by selected estimates, by quartile, 2005-06 Australian sugar cane industry
value below which specifi ed percentage of farms lie
25% 50% 75% average
area operated ha 55 106 200 184area sugar cane harvested ha 30 62 113 87quantity sugar cane produced tonnes 2 800 6 055 10 650 8 251
6
sugar industry survey » abare research report 07.18ta
ble
3 s
elec
ted
phys
ical
est
imat
es, b
y si
ze g
roup
s a
Aus
tralia
n su
gar c
ane
indu
stry
ave
rage
per
farm
or p
erce
ntag
e of
farm
s
qu
antit
y of
sug
ar c
ane
prod
uced
unde
r 7.5
kt
7.
5–15
kt
15–
22.5
kt
22.5
–30
kt
30
–50
kt
ove
r 50
kt
av
erag
e
popu
latio
n no
. 3
130
1 03
5
349
15
6
105
4
9
4 82
4 sa
mpl
e no
. 1
06
8
9
44
2
3
17
1
2
291
2005
-06
area
ope
rate
d at
30
June
ha
88
(15)
2
83
(29)
3
52
(8)
385
(6
) 7
20
(10)
1
293
(1
8)
184
(1
1)
mill
ing
suga
r can
e su
pply
and
disp
osal
ar
ea h
arve
sted
ha
37
(21)
1
09
(4)
193
(3
) 2
52
(4)
417
(8
) 7
90
(14)
8
7 (6
)
area
irrig
ated
ha
1
6 (1
1)
57
(7)
100
(9
) 1
78
(12)
3
14
(11)
6
83
(17)
5
0 (4
)
prod
uctio
n t
3 1
66
(18)
1
0 50
4 (2
) 1
8 32
4 (1
) 2
5 54
4 (1
) 3
8 45
3 (4
) 9
3 09
1 (1
4)
8 2
51
(5)
suga
r can
e yi
eld
t/ha
8
4 (5
) 9
7 (3
) 9
5 (3
) 1
01
(3)
92
(10)
1
18
(4)
95
(2)
quan
tity s
old
t 3
122
(1
8)
10
365
(2)
17
843
(2)
25
161
(1)
38
047
(3)
92
135
(14)
8
126
(5
)
prop
ortio
n of
farm
s gr
owin
g ot
her c
rops
oi
lseed
s %
6
(3
9)
19
(16)
6
(4
5)
19
(35)
4
(2
39)
0
(0)
9
(19)
bana
nas
%
3
(54)
1
(9
3)
0
(0)
0
(0)
0
(0)
8
(80)
2
(4
8)
pean
uts
%
0
(96)
4
(4
9)
1
(90)
0
(0
) 4
(2
39)
13
(69)
1
(3
8)
vege
tabl
es
%
8
(63)
1
(6
5)
0
(0)
3
(141
) 5
(1
80)
3
(101
) 6
(5
8)
othe
r cro
ps
%
11
(42)
1
2 (2
8)
3
(87)
4
(9
4)
6
(185
) 1
3 (8
7)
11
(31)
2006
-07
mill
ing
suga
r can
e su
pply
and
disp
osal
ar
ea h
arve
sted
ha
38
(18)
1
09
(4)
191
(4
) 2
54
(5)
441
(9
) 7
93
(14)
8
8 (6
)
area
irrig
ated
ha
1
6 (1
1)
52
(7)
94
(9)
181
(1
3)
322
(1
3)
686
(1
7)
48
(5)
prod
uctio
n t
3 0
59
(22)
1
1 66
7 (1
3)
16
954
(3)
24
971
(6)
39
840
(6)
88
924
(15)
8
301
(7
)
suga
r can
e yi
eld
t/ha
8
0 (5
) 1
07
(13)
8
9 (3
) 9
8 (2
) 9
0 (5
) 1
12
(4)
95
(4)
quan
tity s
old
t 3
003
(2
2)
10
015
(3)
16
628
(3)
24
704
(6)
39
451
(6)
87
838
(14)
7
858
(6
)
a ba
sed
on q
uant
ity o
f sug
ar c
ane
prod
uced
.N
ote:
Fig
ures
in p
aren
thes
es a
re s
tand
ard
erro
rs, e
xpre
ssed
as
perc
enta
ges
of th
e es
timat
es.
7
sugar industry survey » abare research report 07.18
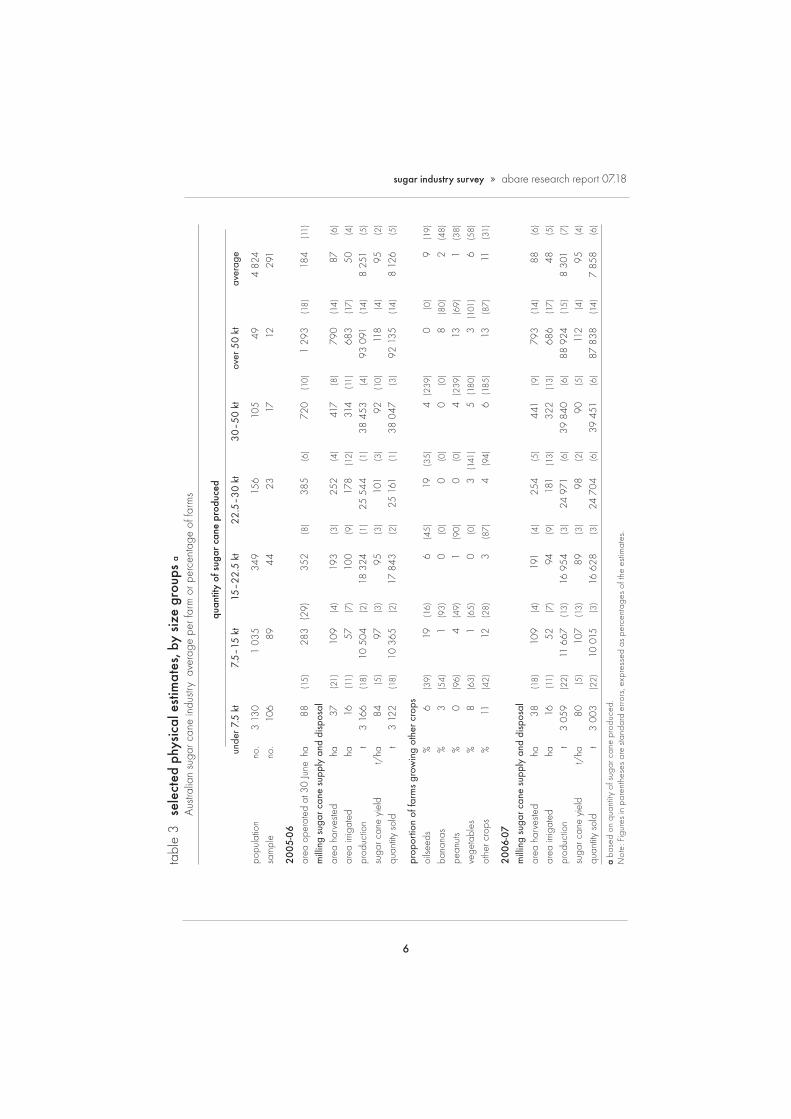
hectares (table 2). Sugar cane in Australia is normally grown on a four to fi ve year rotation, with producers harvesting up to 80 per cent of the crop each year. However, in New South Wales, the growing season is between 18 and 24 months, resulting in a lower proportion of the area under cane being harvested each year.
On average, the area of sugar cane harvested in 2005-06 accounted for nearly half of the farm area operated, with relatively small areas sown to other crops — including soybeans, peanuts, bananas and vegetables — on some farms. The smallest farms (in terms of area operated) produced less than 2800 tonnes of sugar cane, compared with the largest producers who harvested more than 10 600 tonnes of cane (table 2). Sugar cane yields averaged around 95 tonnes a hectare in 2005-06 (table 3).
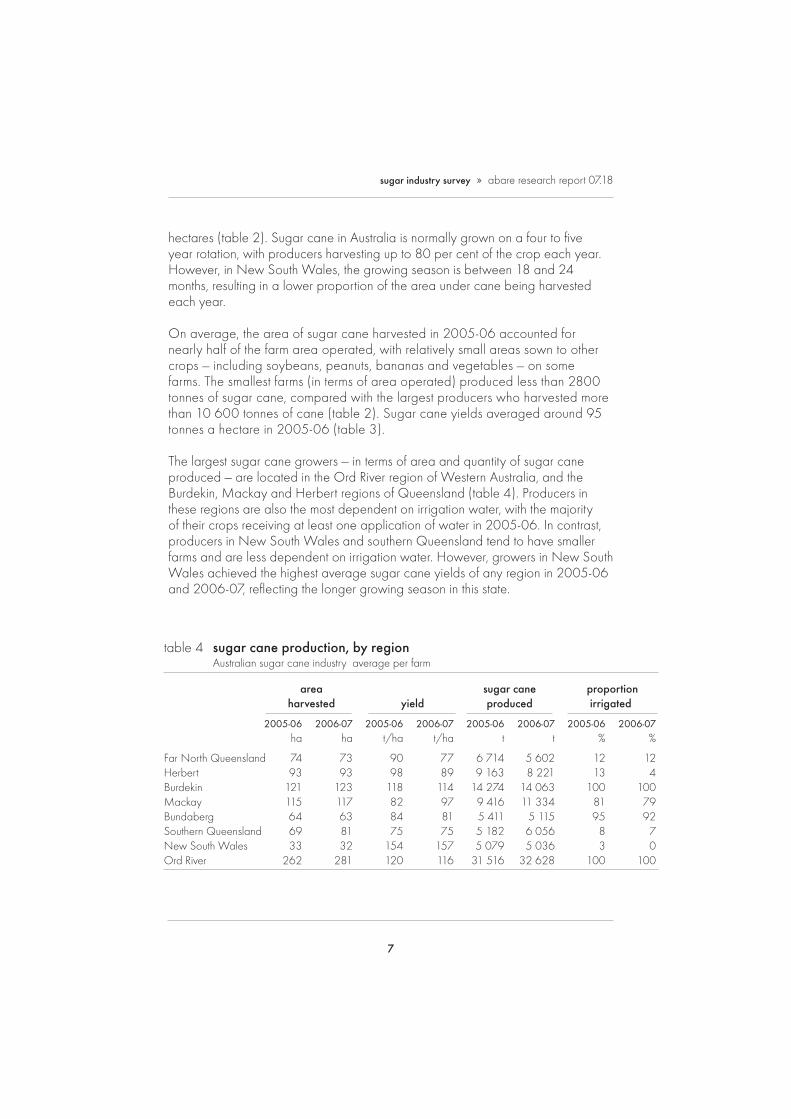
The largest sugar cane growers — in terms of area and quantity of sugar cane produced — are located in the Ord River region of Western Australia, and the Burdekin, Mackay and Herbert regions of Queensland (table 4). Producers in these regions are also the most dependent on irrigation water, with the majority of their crops receiving at least one application of water in 2005-06. In contrast, producers in New South Wales and southern Queensland tend to have smaller farms and are less dependent on irrigation water. However, growers in New South Wales achieved the highest average sugar cane yields of any region in 2005-06 and 2006-07, refl ecting the longer growing season in this state.
table 4 sugar cane production, by region Australian sugar cane industry average per farm
area sugar cane proportion harvested yield produced irrigated
2005-06 2006-07 2005-06 2006-07 2005-06 2006-07 2005-06 2006-07 ha ha t/ha t/ha t t % %
Far North Queensland 74 73 90 77 6 714 5 602 12 12Herbert 93 93 98 89 9 163 8 221 13 4Burdekin 121 123 118 114 14 274 14 063 100 100Mackay 115 117 82 97 9 416 11 334 81 79Bundaberg 64 63 84 81 5 411 5 115 95 92Southern Queensland 69 81 75 75 5 182 6 056 8 7New South Wales 33 32 154 157 5 079 5 036 3 0Ord River 262 281 120 116 31 516 32 628 100 100
8
sugar industry survey » abare research report 07.18
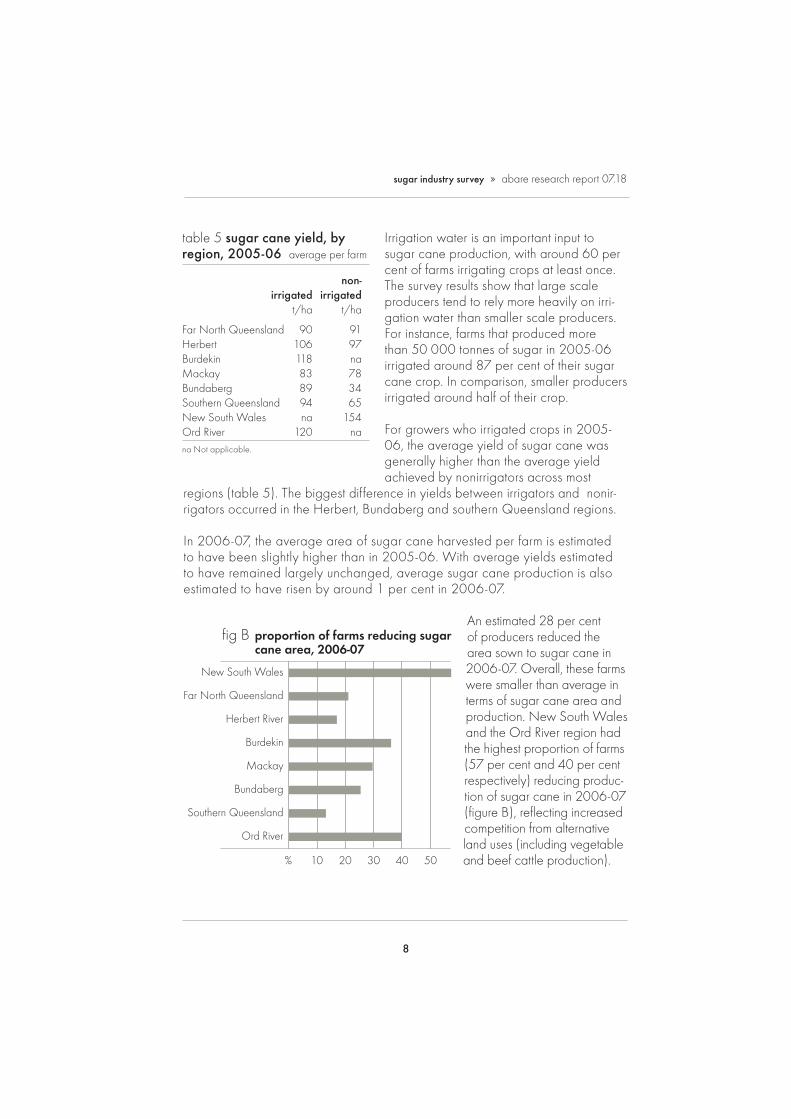
Irrigation water is an important input to sugar cane production, with around 60 per cent of farms irrigating crops at least once. The survey results show that large scale producers tend to rely more heavily on irri-gation water than smaller scale producers. For instance, farms that produced more than 50 000 tonnes of sugar in 2005-06 irrigated around 87 per cent of their sugar cane crop. In comparison, smaller producers irrigated around half of their crop.
For growers who irrigated crops in 2005-06, the average yield of sugar cane was generally higher than the average yield achieved by nonirrigators across most
regions (table 5). The biggest difference in yields between irrigators and nonir-rigators occurred in the Herbert, Bundaberg and southern Queensland regions.
In 2006-07, the average area of sugar cane harvested per farm is estimated to have been slightly higher than in 2005-06. With average yields estimated to have remained largely unchanged, average sugar cane production is also estimated to have risen by around 1 per cent in 2006-07.
An estimated 28 per cent of producers reduced the area sown to sugar cane in 2006-07. Overall, these farms were smaller than average in terms of sugar cane area and production. New South Wales and the Ord River region had the highest proportion of farms (57 per cent and 40 per cent respectively) reducing produc-tion of sugar cane in 2006-07 (fi gure B), refl ecting increased competition from alternative land uses (including vegetable and beef cattle production).
table 5 sugar cane yield, by region, 2005-06 average per farm
non- irrigated irrigated t/ha t/ha
Far North Queensland 90 91Herbert 106 97Burdekin 118 naMackay 83 78Bundaberg 89 34Southern Queensland 94 65New South Wales na 154Ord River 120 nana Not applicable.
fig B proportion of farms reducing sugarcane area, 2006-07
Ord River
Southern Queensland
Bundaberg
Mackay
Burdekin
Herbert River
Far North Queensland
New South Wales
% 40 502010 30
9
fi nancial performance of sugar cane growers
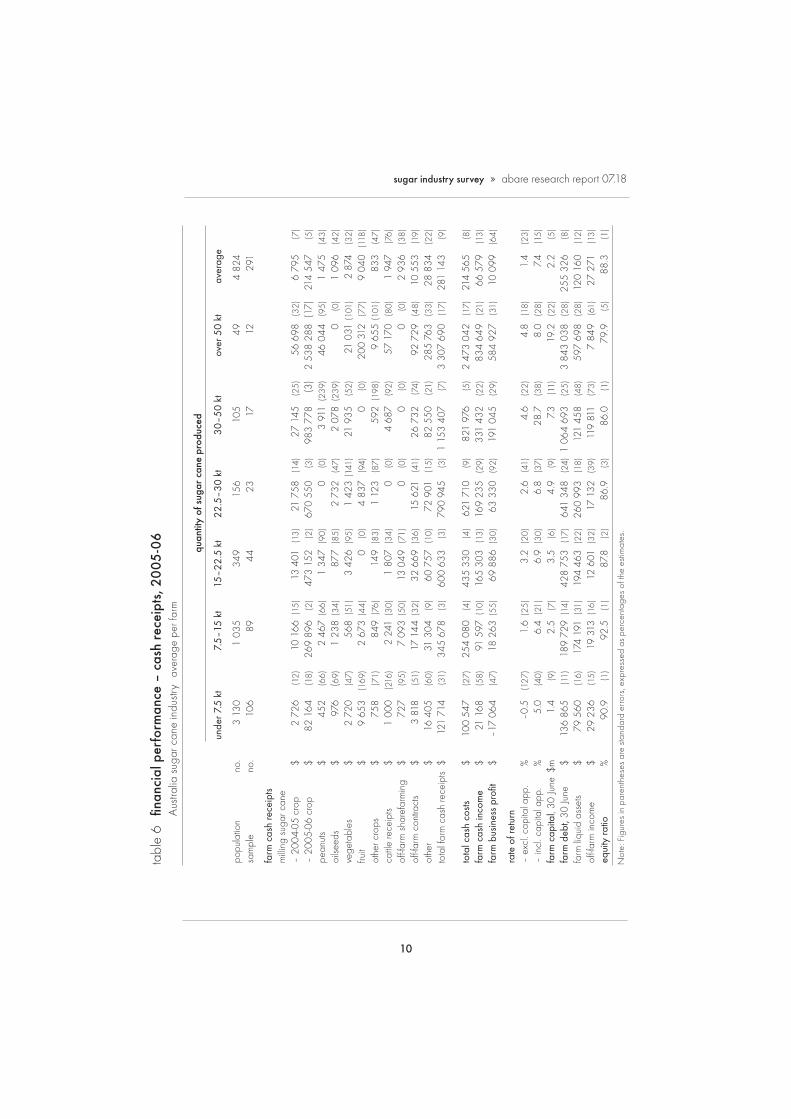
cash receipts from sugar cane productionIn 2005-06, total farm cash receipts for sugar cane growers averaged $281 000, of which almost 80 per cent was from the sale of sugar cane (table 6). Sugar cane growers are paid through a pooling system that results in growers receiving around 90 per cent of their payments during the fi nancial year in which the crop was produced, and the outstanding amount in the following fi nancial year. Pool payments carried over from the 2004-05 crop accounted for around 3 per cent of total sugar cane receipts in 2005-06.
Non sugar related receipts accounted for around 20 per cent of total farm cash receipts, and were largely generated by the sale of beef cattle and crops such as peanuts, oilseeds (principally soybeans), vegetables and fruit. Producers in the Ord River are particularly dependent on the production of vegetables, which accounted for 32 per cent of total farm cash receipts.
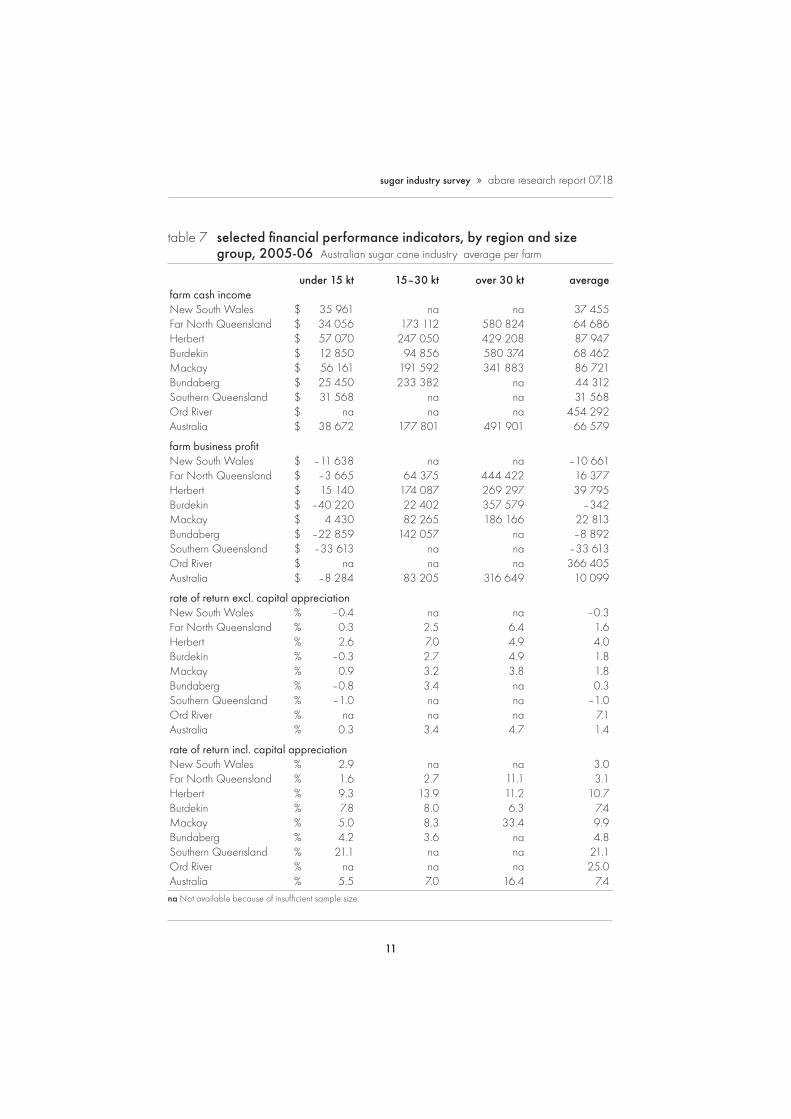
Farm cash income for sugar cane growers averaged around $66 600 in 2005-06 (table 7); however, an estimated 27 per cent of producers reported negative farm cash incomes. Most of the farms reporting negative farm cash incomes were smaller sugar cane growers producing less than 7500 tonnes. Average farm cash incomes were highest for sugar cane growers in the Ord River, averaging around $454 000 a farm in 2005-06 (table 7). The lowest average farm cash income was recorded for the Southern Queensland region, estimated to be around $31 600. Other regions with below average incomes included New South Wales and the Bundaberg and Far North Queens-
Farm cash income is a measure of the cash funds available for farm investment and consumption after paying all costs incurred in produc-tion, including interest payments, but excluding capital payments and payments to family workers.
Farm business profi t is a longer term measure of profi tability that takes account of capital depreciation and changes in inventories.
3
10
sugar industry survey » abare research report 07.18
tabl
e 6
fi n
anci
al p
erfo
rman
ce –
cas
h re
ceip
ts, 2
005
-06
Aus
tralia
sug
ar c
ane
indu
stry
ave
rage
per
farm
qua
ntity
of s
ugar
can
e pr
oduc
ed
unde
r 7.5
kt
7.
5–15
kt
15
–22.
5 kt
22.5
–30
kt
30
–50
kt
ov
er 5
0 kt
aver
age
popu
latio
n no
. 3
130
1 03
5
349
15
6
105
49
4 82
4 sa
mpl
e no
. 1
06
89
44
23
17
12
291
farm
cas
h re
ceip
ts
milli
ng s
ugar
can
e –
2004
-05
crop
$
2 7
26
(12)
1
0 16
6 (1
5)
13
401
(13)
2
1 75
8 (1
4)
27
145
(25)
5
6 69
8 (3
2)
6 7
95
(7)
– 20
05-0
6 cr
op
$ 8
2 16
4 (1
8)
269
896
(2
) 4
73 1
52
(2)
670
550
(3
) 9
83 7
78
(3)
2 53
8 28
8 (1
7)
214
547
(5
)pe
anut
s $
452
(6
6)
2 4
67 (
66)
1 3
47
(90)
0
(0
) 3
911
(23
9)
46
044
(95)
1
475
(4
3)oi
lseed
s $
976
(6
9)
1 2
38 (
34)
877
(85
) 2
732
(4
7)
2 0
78 (
239)
0
(0
) 1
096
(4
2)ve
geta
bles
$
2 7
20
(47)
5
68 (
51)
3 4
26 (
95)
1 4
23 (
141)
2
1 93
5 (5
2)
21
031
(101
) 2
874
(3
2)fru
it $
9 6
53
(169
) 2
673
(44
) 0
(0
) 4
837
(9
4)
0
(0)
200
312
(7
7)
9 0
40
(118
)ot
her c
rops
$
758
(7
1)
849
(76
) 1
49 (
83)
1 1
23
(87)
5
92 (
198)
9
655
(101
) 8
33
(47)
cattle
rece
ipts
$ 1
000
(2
16)
2 2
41 (
30)
1 8
07 (
34)
0
(0)
4 6
87
(92)
5
7 17
0 (8
0)
1 9
47
(76)
off-f
arm
sha
refa
rmin
g $
727
(9
5)
7 0
93 (
50)
13
049
(71)
0
(0
) 0
(0
) 0
(0
) 2
936
(3
8)of
f-far
m c
ontra
cts
$ 3
818
(5
1)
17
144
(32)
3
2 66
9 (3
6)
15
621
(41)
2
6 73
2 (7
4)
92
729
(48)
1
0 55
3 (1
9)ot
her
$ 1
6 40
5 (6
0)
31
304
(9)
60
757
(10)
7
2 90
1 (1
5)
82
550
(21)
2
85 7
63
(33)
2
8 83
4 (2
2)to
tal f
arm
cas
h re
ceip
ts $
121
714
(3
1)
345
678
(3
) 6
00 6
33
(3)
790
945
(3
) 1
153
407
(7)
3 30
7 69
0 (1
7)
281
143
(9
)
tota
l cas
h co
sts
$ 1
00 5
47
(27)
2
54 0
80
(4)
435
330
(4
) 6
21 7
10
(9)
821
976
(5
) 2
473
042
(17)
2
14 5
65
(8)
farm
cas
h in
com
e $
21
168
(58)
9
1 59
7 (1
0)
165
303
(1
3)
169
235
(2
9)
331
432
(2
2)
834
649
(2
1)
66
579
(13)
farm
bus
ines
s pr
ofi t
$ –1
7 06
4 (4
7)
18
263
(55)
6
9 88
6 (3
0)
63
330
(92)
1
91 0
45
(29)
5
84 9
27
(31)
1
0 09
9 (6
4)
rate
of r
etur
n –
excl
. cap
ital a
pp.
%
–0.5
(1
27)
1.6
(25)
3.
2 (2
0)
2.6
(41)
4.
6 (2
2)
4.8
(18)
1.
4 (2
3)–
incl
. cap
ital a
pp.
%
5.0
(40)
6.
4 (2
1)
6.9
(30)
6.
8 (3
7)
28.7
(3
8)
8.0
(28)
7.
4 (1
5)fa
rm c
apita
l, 30
June
$m
1.
4 (9
) 2.
5 (7
) 3.
5 (6
) 4.
9 (9
) 7.
3 (1
1)
19.2
(2
2)
2.2
(5)
farm
deb
t, 30
June
$
136
865
(1
1)
189
729
(1
4)
428
753
(1
7)
641
348
(2
4)
1 06
4 69
3 (2
5)
3 84
3 03
8 (2
8)
255
326
(8
)fa
rm li
quid
ass
ets
$ 7
9 56
0 (1
6)
174
191
(3
1)
194
463
(2
2)
260
993
(1
8)
121
458
(4
8)
597
698
(2
8)
120
160
(1
2)of
f-far
m in
com
e $
29
236
(15)
1
9 31
3 (1
6)
12
601
(32)
1
7 13
2 (3
9)
119
811
(7
3)
7 8
49
(61)
2
7 27
1 (1
3)eq
uity
ratio
%
90
.9
(1)
92.5
(1
) 87
.8
(2)
86.9
(3
) 86
.0
(1)
79.9
(5
) 88
.3
(1)
Not
e: F
igur
es in
par
enth
eses
are
sta
ndar
d er
rors
, exp
ress
ed a
s pe
rcen
tage
s of
the
estim
ates
.
11
sugar industry survey » abare research report 07.18
table 7 selected fi nancial performance indicators, by region and size group, 2005-06 Australian sugar cane industry average per farm
under 15 kt 15–30 kt over 30 kt averagefarm cash income New South Wales $ 35 961 na na 37 455Far North Queensland $ 34 056 173 112 580 824 64 686Herbert $ 57 070 247 050 429 208 87 947Burdekin $ 12 850 94 856 580 374 68 462Mackay $ 56 161 191 592 341 883 86 721Bundaberg $ 25 450 233 382 na 44 312Southern Queensland $ 31 568 na na 31 568Ord River $ na na na 454 292Australia $ 38 672 177 801 491 901 66 579
farm business profi t New South Wales $ –11 638 na na –10 661Far North Queensland $ –3 665 64 375 444 422 16 377Herbert $ 15 140 174 087 269 297 39 795Burdekin $ –40 220 22 402 357 579 –342Mackay $ 4 430 82 265 186 166 22 813Bundaberg $ –22 859 142 057 na –8 892Southern Queensland $ –33 613 na na –33 613Ord River $ na na na 366 405Australia $ –8 284 83 205 316 649 10 099
rate of return excl. capital appreciation New South Wales % –0.4 na na –0.3Far North Queensland % 0.3 2.5 6.4 1.6Herbert % 2.6 7.0 4.9 4.0Burdekin % –0.3 2.7 4.9 1.8Mackay % 0.9 3.2 3.8 1.8Bundaberg % –0.8 3.4 na 0.3Southern Queensland % –1.0 na na –1.0Ord River % na na na 7.1Australia % 0.3 3.4 4.7 1.4
rate of return incl. capital appreciation New South Wales % 2.9 na na 3.0Far North Queensland % 1.6 2.7 11.1 3.1Herbert % 9.3 13.9 11.2 10.7Burdekin % 7.8 8.0 6.3 7.4Mackay % 5.0 8.3 33.4 9.9Bundaberg % 4.2 3.6 na 4.8Southern Queensland % 21.1 na na 21.1Ord River % na na na 25.0Australia % 5.5 7.0 16.4 7.4na Not available because of insuffi cient sample size.
12
sugar industry survey » abare research report 07.18
land regions. These regions had a relatively high concentration of small scale sugar cane growers. In the case of New South Wales, the longer growing season helps to boost sugar cane yields but it also restricts the proportion of sugar cane area that can be harvested in each year, and hence producers’ incomes.
Nearly two-thirds of sugar cane growers across all regions reported farm business losses in 2005-06 (table 7). However, in 2005-06, the survey results indicate that fi nancial performance improved as the scale of sugar cane production increased in every region. For example, in the Burdekin, farms producing less than 15 000 tonnes of sugar cane reported a loss of around $40 200, compared with a profi t of around $22 400 for farms producing 15 000 – 30 000 tonnes of sugar cane and $358 000 for farms producing more than 30 000 tonnes (table 7).
In 2005-06, the average return on capital (excluding capital appreciation) for sugar cane growers is estimated to have been 1.4 per cent. When capital appre-ciation is taken into account — primarily increases in land values — the average rate of return is estimated to have been around 7.4 per cent. Large farms had the
table 8 selected estimates, by rate of return, 2005-06 Australian sugar cane industry average per farm
bottom top 25 per cent 25 per cent of farms of farms
number of farms no. 951 1 312
area operated ha 175 (41) 226 (12)
area of sugar cane harvested ha 54 (17) 140 (11)
– irrigated area ha 19 (40) 87 (17)
production of sugar cane t 4 907 (20) 13 786 (10)
sugar cane yield t/ha 90 (4) 98 (4)
average sugar cane price received $/t 27 (3) 29 (1)
unit sugar cane production cost $/t 23 (6) 17 (3)
total cash receipts $ 159 380 (18) 502 903 (9)
total cash costs $ 181 502 (18) 315 616 (11)
farm cash income $ –22 122 (43) 187 287 (7)
farm business profi t $ –73 952 (16) 116 153 (10)
rate of return – excl. capital appreciation % –4.8 (10) 5.9 (7)
– incl. capital appreciation % –0.7 (327) 14.0 (21)
farm equity ratio % 83 (7) 85 (2)
Note: farms ranked by rate of return, excluding capital appreciation.
13
sugar industry survey » abare research report 07.18
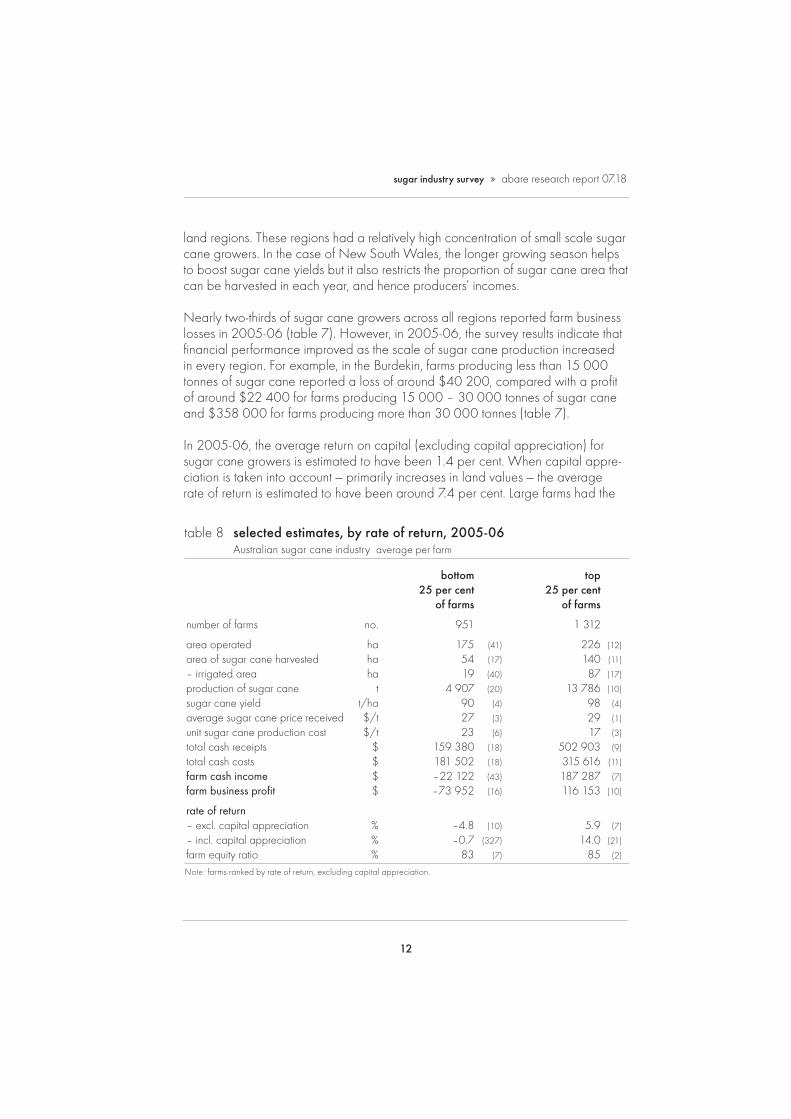
highest average rate of return on capital (excluding capital appreciation), aver-aging 4.7 per cent for growers who produced more than 30 000 tonnes of sugar cane, refl ecting their ability to generate higher profi ts per dollar of capital invested than smaller farms.
By ranking the farms surveyed according to their rate of return, excluding capital appreciation, it is possible to estimate the physical and fi nancial characteristics of the bottom and top performing farms. In general, the top performing farms (top 25 per cent of farms when ranked by rate of return excluding capital apprecia-tion) grew larger areas of sugar cane, had higher sugar cane yields and signifi -cantly lower unit sugar cane production costs than the bottom performing farms in 2005-06 (table 8).
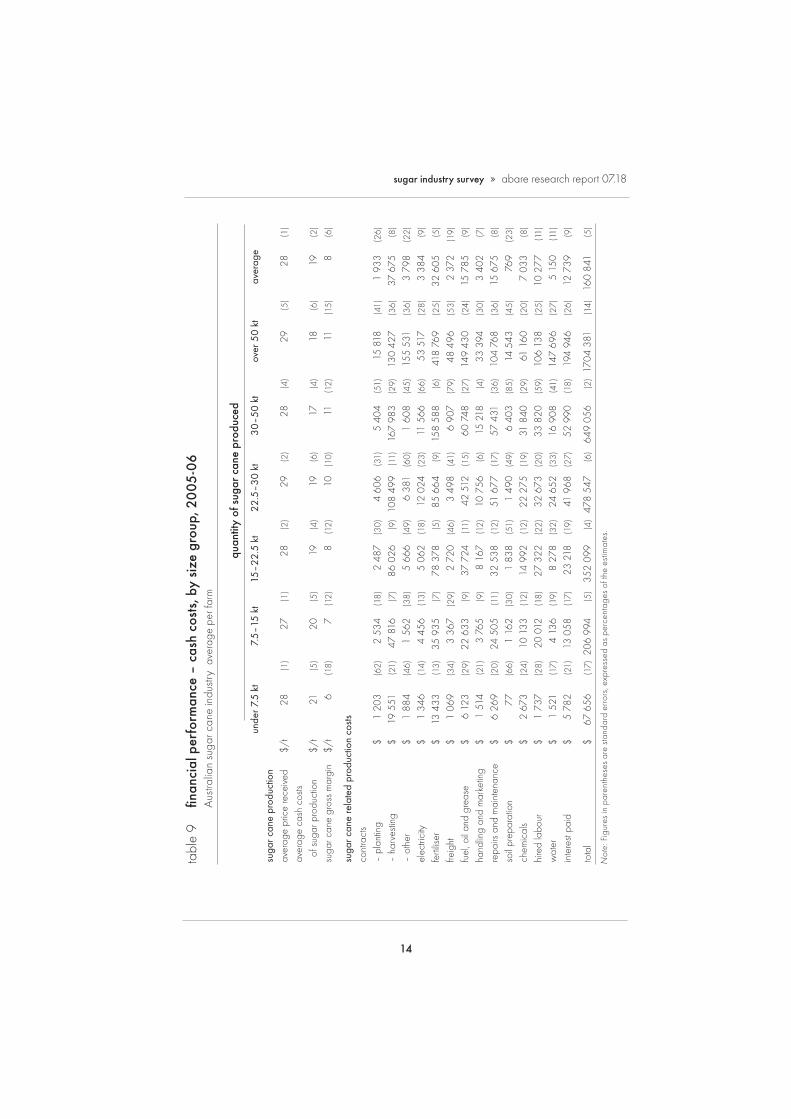
sugar cane cash costs of productionThe survey sought information on the cash costs of producing sugar cane. In 2005-06, sugar cane related production cash costs averaged around $160 800 a farm, ranging from $67 700 a farm for small scale farms (those producing less than 7500 tonnes of sugar cane) to around $1.7 million a farm for large farms producing more than 50 000 tonnes of sugar cane (table 9). Across all farms,
sugar cane unit receipts and costs defi nitions
Average sugar cane price is a measure of the total cash funds generated from the sale of the 2005-06 sugar cane crop, irrespective of when producers received these funds. Under the pooling system, producers will have received the bulk of these payments in 2005-06; however, some will have been received in 2006-07.
Average sugar cane production cash cost is an estimate of the total cash costs attribut-able to the production of the 2005-06 crop. These include all cash costs relating to planting, harvesting and marketing this crop. In addition, the interest paid that is attribut-able to all debts associated with sugar cane production (principally debt related to land and machinery purchases and short term crop fi nancing). Depreciation and imputed family labour allowances are not included as these are not cash costs.
Sugar cane gross margin is a measure of the cash surplus generated from the production of sugar cane. It is calculated by deducting the sugar cane production cash costs from the sugar cane price. These are funds available to pay the operator and family for their labour and to invest in additional capital to expand the farm business.
14
sugar industry survey » abare research report 07.18ta
ble
9
fi nan
cial
per
form
ance
– c
ash
cost
s, b
y si
ze g
roup
, 20
05-0
6 A
ustra
lian
suga
r can
e in
dustr
y a
vera
ge p
er fa
rm
qu
antit
y of
sug
ar c
ane
prod
uced
u
nder
7.5
kt
7.
5–15
kt
15
–22.
5 kt
22.5
–30
kt
30
–50
kt
ov
er 5
0 kt
aver
age
suga
r can
e pr
oduc
tion
aver
age
pric
e re
ceive
d $/
t 2
8 (1
) 2
7 (1
) 2
8 (2
) 2
9 (2
) 2
8 (4
) 2
9 (5
) 2
8 (1
)
aver
age
cash
cos
ts o
f sug
ar p
rodu
ctio
n
$/t
21
(5)
20
(5)
19
(4)
19
(6)
17
(4)
18
(6)
19
(2)
suga
r can
e gr
oss
mar
gin
$/t
6
(18)
7
(1
2)
8
(12)
1
0 (1
0)
11
(12)
1
1 (1
5)
8
(6)
suga
r can
e re
late
d pr
oduc
tion
costs
co
ntra
cts
– pl
antin
g $
1 20
3 (6
2)
2 53
4 (1
8)
2 48
7 (3
0)
4 60
6 (3
1)
5 40
4 (5
1)
15 8
18
(41)
1
933
(26)
– ha
rves
ting
$ 19
551
(2
1)
47 8
16
(7)
86 0
26
(9)
108
499
(11)
16
7 98
3 (2
9)
130
427
(36)
37
675
(8
)
– ot
her
$ 1
884
(46)
1
562
(38)
5
666
(49)
6
381
(60)
1
608
(45)
15
5 53
1 (3
6)
3 79
8 (2
2)
elec
trici
ty
$ 1
346
(14)
4
456
(13)
5
062
(18)
12
024
(2
3)
11 5
66
(66)
53
517
(2
8)
3 38
4 (9
)
ferti
liser
$
13 4
33
(13)
35
935
(7
) 78
378
(5
) 85
664
(9
) 15
8 58
8 (6
) 41
8 76
9 (2
5)
32 6
05
(5)
freig
ht
$ 1
069
(34)
3
367
(29)
2
720
(46)
3
498
(41)
6
907
(79)
48
496
(5
3)
2 37
2 (1
9)
fuel
, oil
and
grea
se
$ 6
123
(29)
22
633
(9
) 37
724
(1
1)
42 5
12
(15)
60
748
(2
7)
149
430
(24)
15
785
(9
)
hand
ling
and
mar
ketin
g $
1 51
4 (2
1)
3 76
5 (9
) 8
167
(12)
10
756
(6
) 15
218
(4
) 33
394
(3
0)
3 40
2 (7
)
repa
irs a
nd m
aint
enan
ce
$ 6
269
(20)
24
505
(1
1)
32 5
38
(12)
51
677
(1
7)
57 4
31
(36)
10
4 76
8 (3
6)
15 6
75
(8)
soil
prep
arat
ion
$ 7
7 (6
6)
1 16
2 (3
0)
1 83
8 (5
1)
1 49
0 (4
9)
6 40
3 (8
5)
14 5
43
(45)
7
69
(23)
chem
ical
s $
2 67
3 (2
4)
10 1
33
(12)
14
992
(1
2)
22 2
75
(19)
31
840
(2
9)
61 1
60
(20)
7
033
(8)
hire
d la
bour
$
1 73
7 (2
8)
20 0
12
(18)
27
322
(2
2)
32 6
73
(20)
33
820
(5
9)
106
138
(25)
10
277
(1
1)
wat
er
$ 1
521
(17)
4
136
(19)
8
278
(32)
24
652
(3
3)
16 9
08
(41)
14
7 69
6 (2
7)
5 15
0 (1
1)
inte
rest
paid
$
5 78
2 (2
1)
13 0
58
(17)
23
218
(1
9)
41 9
68
(27)
52
990
(1
8)
194
946
(26)
12
739
(9
)
tota
l $
67 6
56
(17)
206
994
(5
) 35
2 09
9 (4
) 47
8 54
7 (6
) 64
9 05
6 (2
) 17
04 3
81
(14)
16
0 84
1 (5
)
Not
e: F
igur
es in
par
enth
eses
are
sta
ndar
d er
rors
, exp
ress
ed a
s pe
rcen
tage
s of
the
estim
ates
.
15
sugar industry survey » abare research report 07.18
harvesting and fertilisers were the largest cost items, accounting for nearly half of total sugar cane related production costs in 2005-06. Other major cost items included fuel, repairs and maintenance, interest payments, and hired labour.
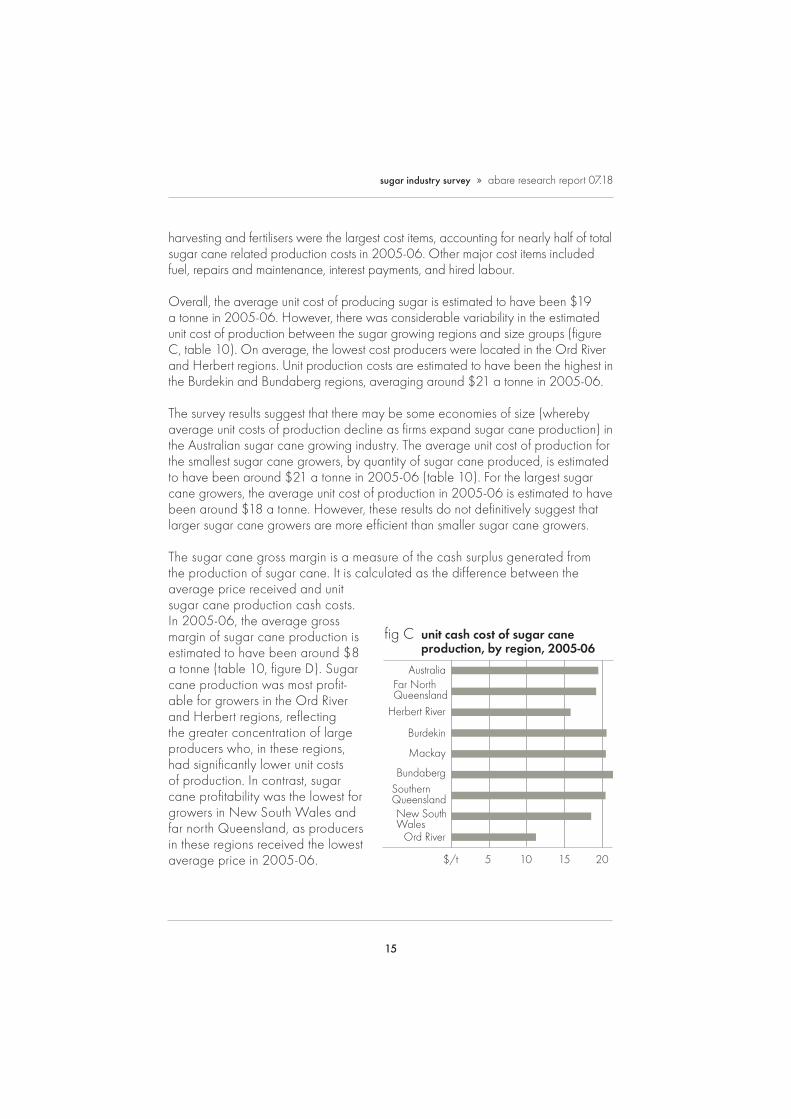
Overall, the average unit cost of producing sugar is estimated to have been $19 a tonne in 2005-06. However, there was considerable variability in the estimated unit cost of production between the sugar growing regions and size groups (fi gure C, table 10). On average, the lowest cost producers were located in the Ord River and Herbert regions. Unit production costs are estimated to have been the highest in the Burdekin and Bundaberg regions, averaging around $21 a tonne in 2005-06.
The survey results suggest that there may be some economies of size (whereby average unit costs of production decline as fi rms expand sugar cane production) in the Australian sugar cane growing industry. The average unit cost of production for the smallest sugar cane growers, by quantity of sugar cane produced, is estimated to have been around $21 a tonne in 2005-06 (table 10). For the largest sugar cane growers, the average unit cost of production in 2005-06 is estimated to have been around $18 a tonne. However, these results do not defi nitively suggest that larger sugar cane growers are more effi cient than smaller sugar cane growers.
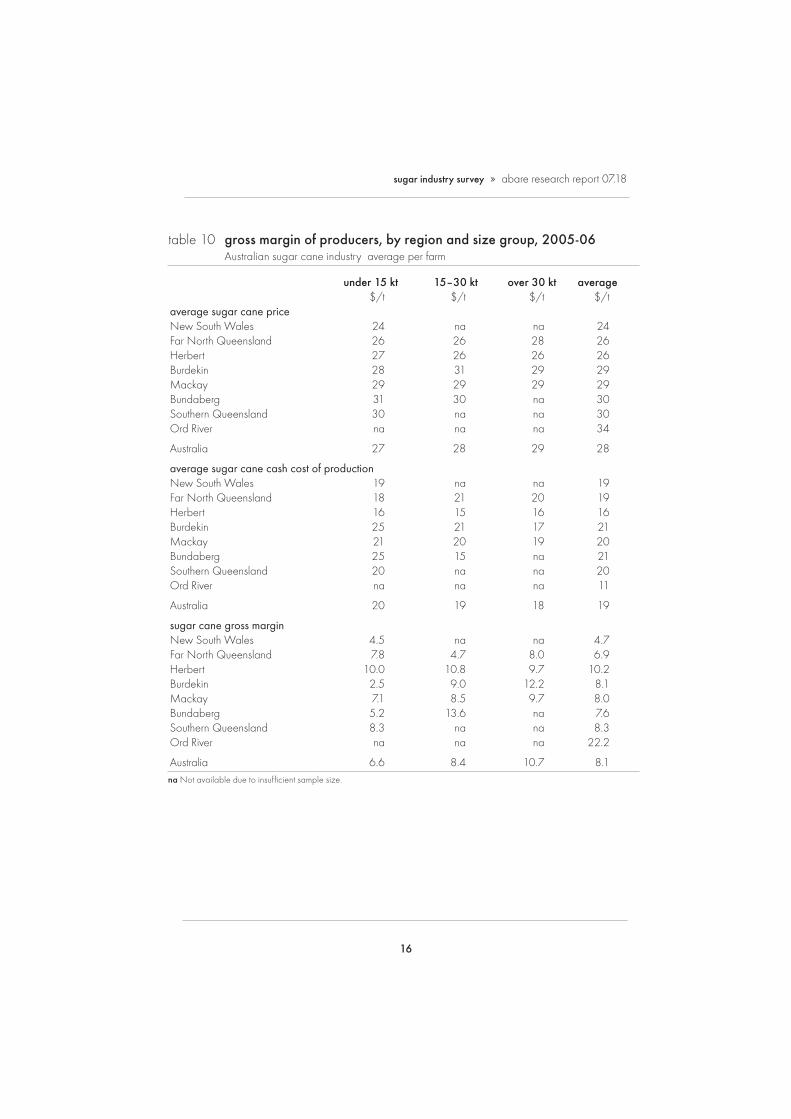
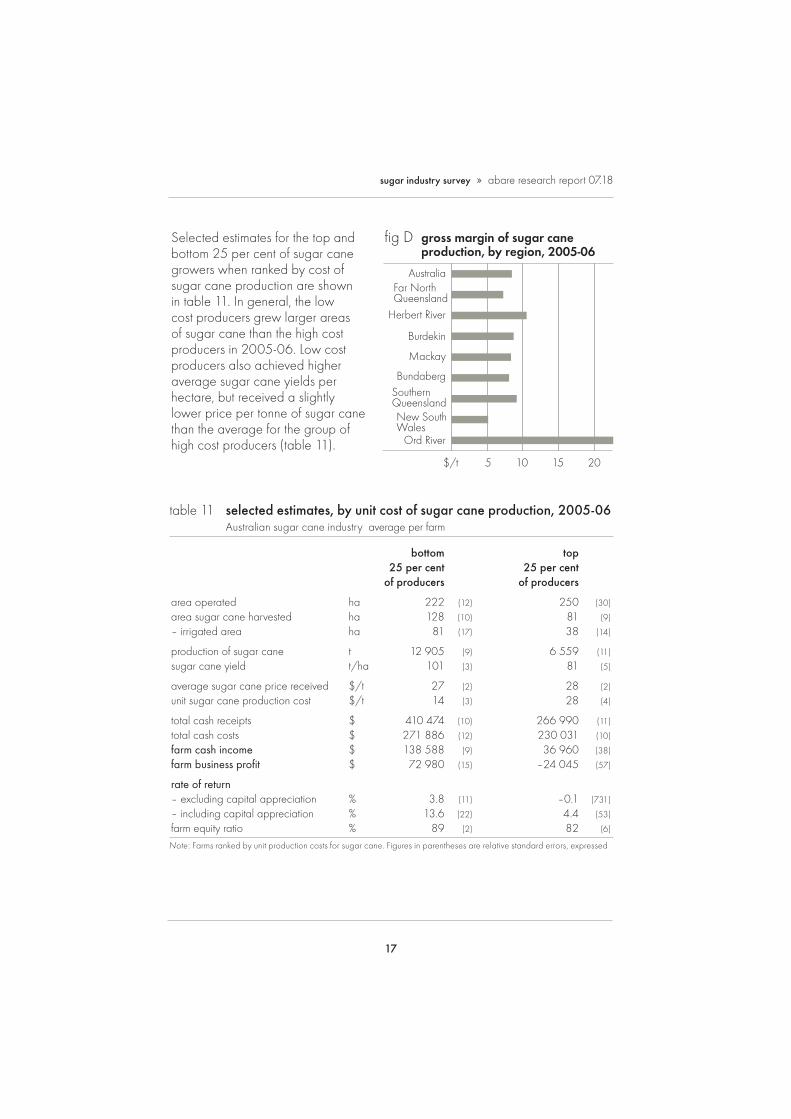
The sugar cane gross margin is a measure of the cash surplus generated from the production of sugar cane. It is calculated as the difference between the average price received and unit sugar cane production cash costs. In 2005-06, the average gross margin of sugar cane production is estimated to have been around $8 a tonne (table 10, fi gure D). Sugar cane production was most profi t-able for growers in the Ord River and Herbert regions, refl ecting the greater concentration of large producers who, in these regions, had signifi cantly lower unit costs of production. In contrast, sugar cane profi tability was the lowest for growers in New South Wales and far north Queensland, as producers in these regions received the lowest average price in 2005-06.
fig C unit cash cost of sugar cane production, by region, 2005-06
Ord River
Southern Queensland
Bundaberg
Mackay
Burdekin
Herbert River
Far North Queensland
New South Wales
Australia
$/t 15 20105
16
sugar industry survey » abare research report 07.18
table 10 gross margin of producers, by region and size group, 2005-06 Australian sugar cane industry average per farm
under 15 kt 15–30 kt over 30 kt average $/t $/t $/t $/taverage sugar cane price New South Wales 24 na na 24Far North Queensland 26 26 28 26Herbert 27 26 26 26Burdekin 28 31 29 29Mackay 29 29 29 29Bundaberg 31 30 na 30Southern Queensland 30 na na 30Ord River na na na 34
Australia 27 28 29 28
average sugar cane cash cost of production New South Wales 19 na na 19Far North Queensland 18 21 20 19Herbert 16 15 16 16Burdekin 25 21 17 21Mackay 21 20 19 20Bundaberg 25 15 na 21Southern Queensland 20 na na 20Ord River na na na 11
Australia 20 19 18 19
sugar cane gross margin New South Wales 4.5 na na 4.7Far North Queensland 7.8 4.7 8.0 6.9Herbert 10.0 10.8 9.7 10.2Burdekin 2.5 9.0 12.2 8.1Mackay 7.1 8.5 9.7 8.0Bundaberg 5.2 13.6 na 7.6Southern Queensland 8.3 na na 8.3Ord River na na na 22.2
Australia 6.6 8.4 10.7 8.1na Not available due to insuffi cient sample size.
17
sugar industry survey » abare research report 07.18
Selected estimates for the top and bottom 25 per cent of sugar cane growers when ranked by cost of sugar cane production are shown in table 11. In general, the low cost producers grew larger areas of sugar cane than the high cost producers in 2005-06. Low cost producers also achieved higher average sugar cane yields per hectare, but received a slightly lower price per tonne of sugar cane than the average for the group of high cost producers (table 11).
table 11 selected estimates, by unit cost of sugar cane production, 2005-06 Australian sugar cane industry average per farm
bottom top 25 per cent 25 per cent of producers of producers
area operated ha 222 (12) 250 (30)
area sugar cane harvested ha 128 (10) 81 (9)
– irrigated area ha 81 (17) 38 (14)
production of sugar cane t 12 905 (9) 6 559 (11)
sugar cane yield t/ha 101 (3) 81 (5)
average sugar cane price received $/t 27 (2) 28 (2)
unit sugar cane production cost $/t 14 (3) 28 (4)
total cash receipts $ 410 474 (10) 266 990 (11)
total cash costs $ 271 886 (12) 230 031 (10)
farm cash income $ 138 588 (9) 36 960 (38)
farm business profi t $ 72 980 (15) –24 045 (57)
rate of return – excluding capital appreciation % 3.8 (11) –0.1 (731)
– including capital appreciation % 13.6 (22) 4.4 (53)
farm equity ratio % 89 (2) 82 (6)
Note: Farms ranked by unit production costs for sugar cane. Figures in parentheses are relative standard errors, expressed
fig D gross margin of sugar cane production, by region, 2005-06
Ord River
Southern Queensland
Bundaberg
Mackay
Burdekin
Herbert River
Far North Queensland
New South Wales
Australia
$/t 15 20105
18
farm management practices
As part of the sugar cane producers survey, ABARE asked a range of supplemen-tary questions to gather detailed information on sugar cane management practices and producers’ production intentions and information sources. Some of the key results are highlighted in this section.
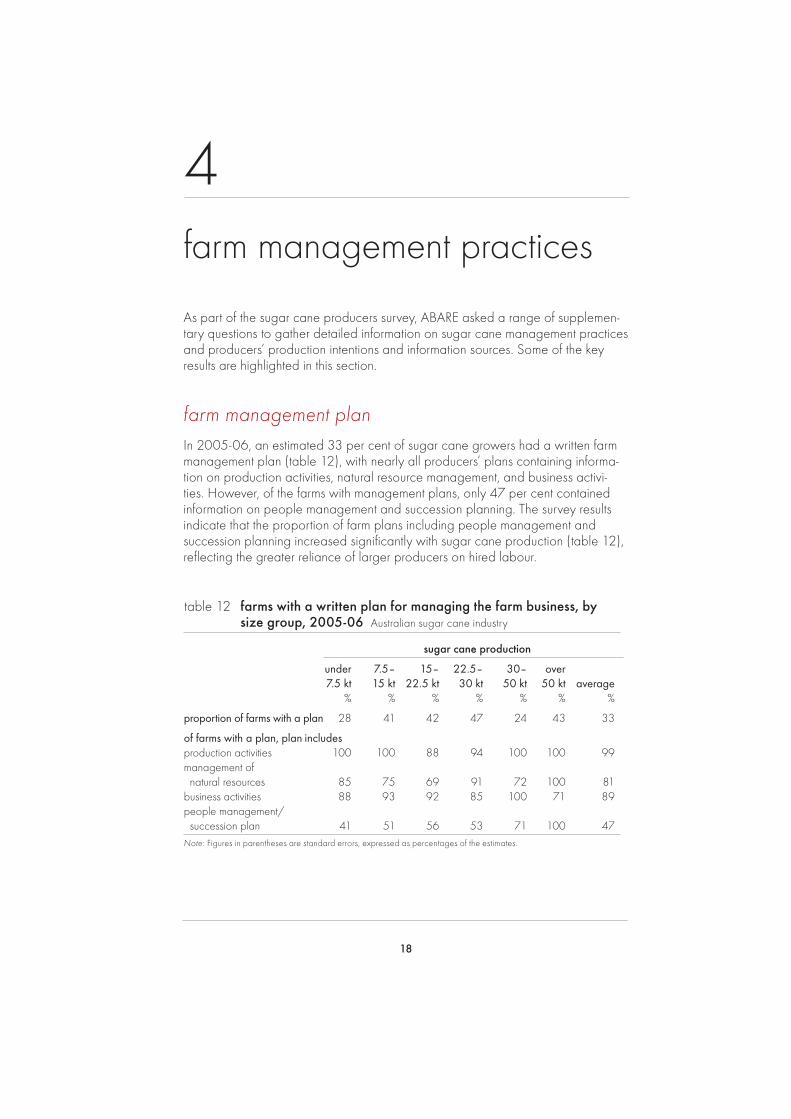
farm management planIn 2005-06, an estimated 33 per cent of sugar cane growers had a written farm management plan (table 12), with nearly all producers’ plans containing informa-tion on production activities, natural resource management, and business activi-ties. However, of the farms with management plans, only 47 per cent contained information on people management and succession planning. The survey results indicate that the proportion of farm plans including people management and succession planning increased signifi cantly with sugar cane production (table 12), refl ecting the greater reliance of larger producers on hired labour.
table 12 farms with a written plan for managing the farm business, by size group, 2005-06 Australian sugar cane industry
sugar cane production
under 7.5– 15– 22.5– 30– over 7.5 kt 15 kt 22.5 kt 30 kt 50 kt 50 kt average % % % % % % %
proportion of farms with a plan 28 41 42 47 24 43 33
of farms with a plan, plan includes production activities 100 100 88 94 100 100 99management of natural resources 85 75 69 91 72 100 81business activities 88 93 92 85 100 71 89people management/ succession plan 41 51 56 53 71 100 47Note: Figures in parentheses are standard errors, expressed as percentages of the estimates.
4
19
sugar industry survey » abare research report 07.18
Sugar cane growers that had a written farm management plan are generally younger and likely to have a higher proportion of land planted to sugar cane than those without a farm management plan.
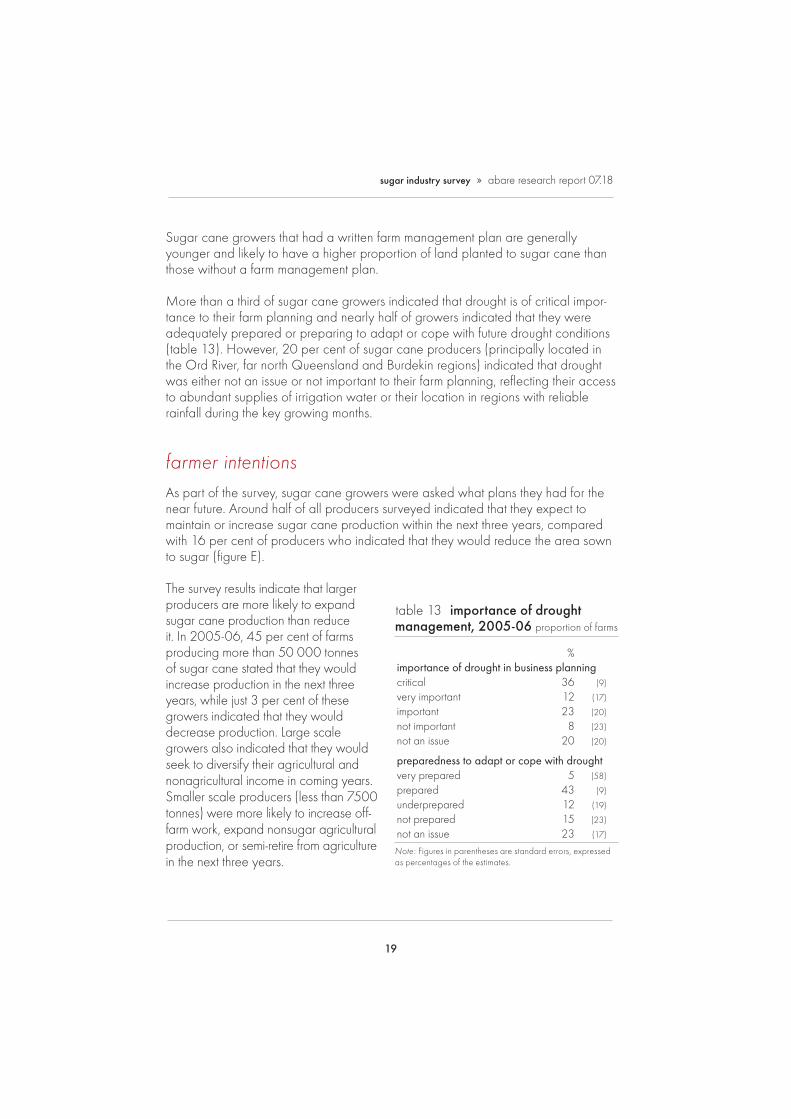
More than a third of sugar cane growers indicated that drought is of critical impor-tance to their farm planning and nearly half of growers indicated that they were adequately prepared or preparing to adapt or cope with future drought conditions (table 13). However, 20 per cent of sugar cane producers (principally located in the Ord River, far north Queensland and Burdekin regions) indicated that drought was either not an issue or not important to their farm planning, refl ecting their access to abundant supplies of irrigation water or their location in regions with reliable rainfall during the key growing months.
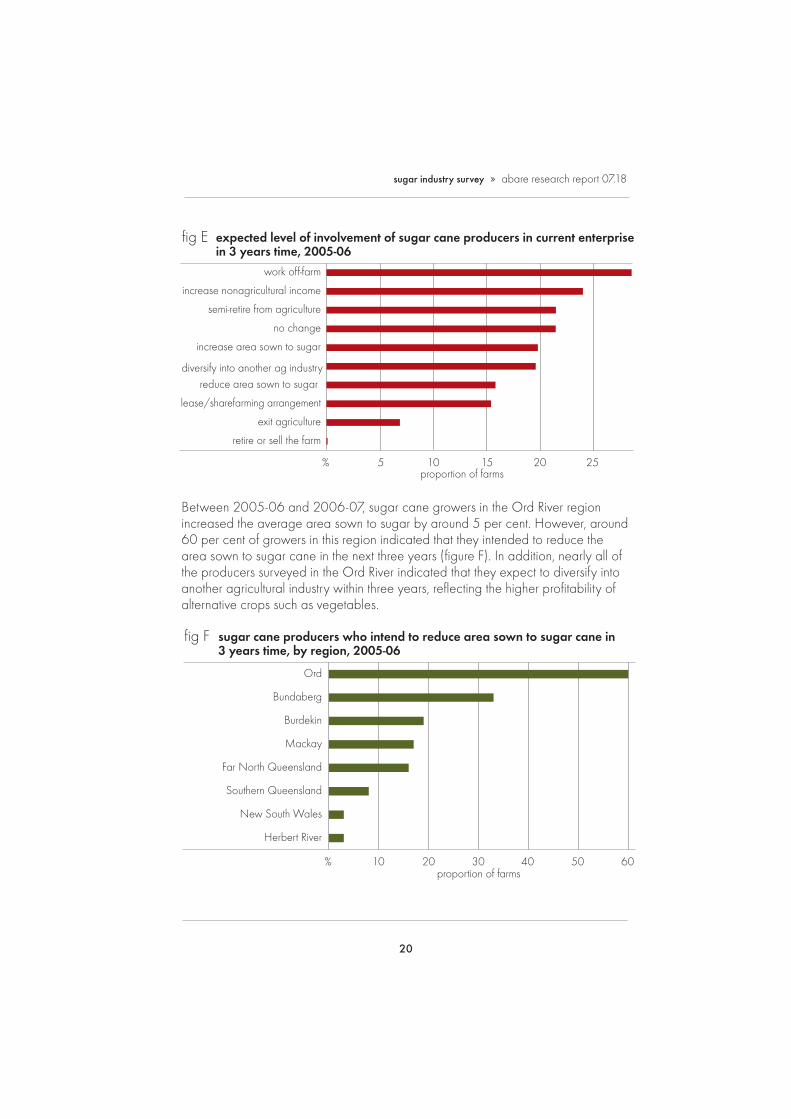
farmer intentionsAs part of the survey, sugar cane growers were asked what plans they had for the near future. Around half of all producers surveyed indicated that they expect to maintain or increase sugar cane production within the next three years, compared with 16 per cent of producers who indicated that they would reduce the area sown to sugar (fi gure E).
The survey results indicate that larger producers are more likely to expand sugar cane production than reduce it. In 2005-06, 45 per cent of farms producing more than 50 000 tonnes of sugar cane stated that they would increase production in the next three years, while just 3 per cent of these growers indicated that they would decrease production. Large scale growers also indicated that they would seek to diversify their agricultural and nonagricultural income in coming years. Smaller scale producers (less than 7500 tonnes) were more likely to increase off-farm work, expand nonsugar agricultural production, or semi-retire from agriculture in the next three years.
table 13 importance of drought management, 2005-06 proportion of farms
%importance of drought in business planning critical 36 (9)
very important 12 (17)
important 23 (20)
not important 8 (23)
not an issue 20 (20)
preparedness to adapt or cope with drought very prepared 5 (58)
prepared 43 (9)
underprepared 12 (19)
not prepared 15 (23)
not an issue 23 (17)
Note: Figures in parentheses are standard errors, expressed as percentages of the estimates.
20
sugar industry survey » abare research report 07.18
Between 2005-06 and 2006-07, sugar cane growers in the Ord River region increased the average area sown to sugar by around 5 per cent. However, around 60 per cent of growers in this region indicated that they intended to reduce the area sown to sugar cane in the next three years (fi gure F). In addition, nearly all of the producers surveyed in the Ord River indicated that they expect to diversify into another agricultural industry within three years, refl ecting the higher profi tability of alternative crops such as vegetables.
fig E expected level of involvement of sugar cane producers in current enterprise in 3 years time, 2005-06
work off-farm
increase nonagricultural income
semi-retire from agriculture
no change
increase area sown to sugar
diversify into another ag industryreduce area sown to sugar
lease/sharefarming arrangement
exit agriculture
retire or sell the farm
% 15 20 25105proportion of farms
fig F sugar cane producers who intend to reduce area sown to sugar cane in 3 years time, by region, 2005-06
Ord
Bundaberg
Burdekin
Mackay
Far North Queensland
Southern Queensland
New South Wales
Herbert River
% 3020proportion of farms
40 50 6010
21
sugar industry survey » abare research report 07.18
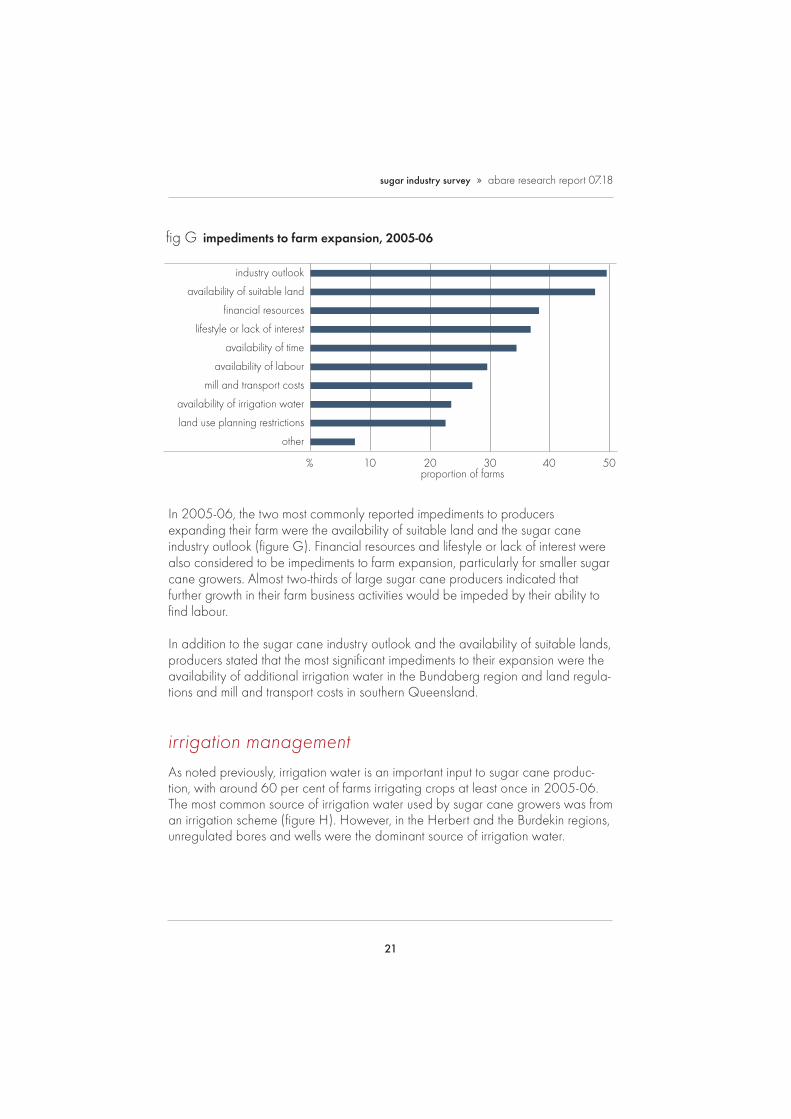
In 2005-06, the two most commonly reported impediments to producers expanding their farm were the availability of suitable land and the sugar cane industry outlook (fi gure G). Financial resources and lifestyle or lack of interest were also considered to be impediments to farm expansion, particularly for smaller sugar cane growers. Almost two-thirds of large sugar cane producers indicated that further growth in their farm business activities would be impeded by their ability to fi nd labour.
In addition to the sugar cane industry outlook and the availability of suitable lands, producers stated that the most signifi cant impediments to their expansion were the availability of additional irrigation water in the Bundaberg region and land regula-tions and mill and transport costs in southern Queensland.
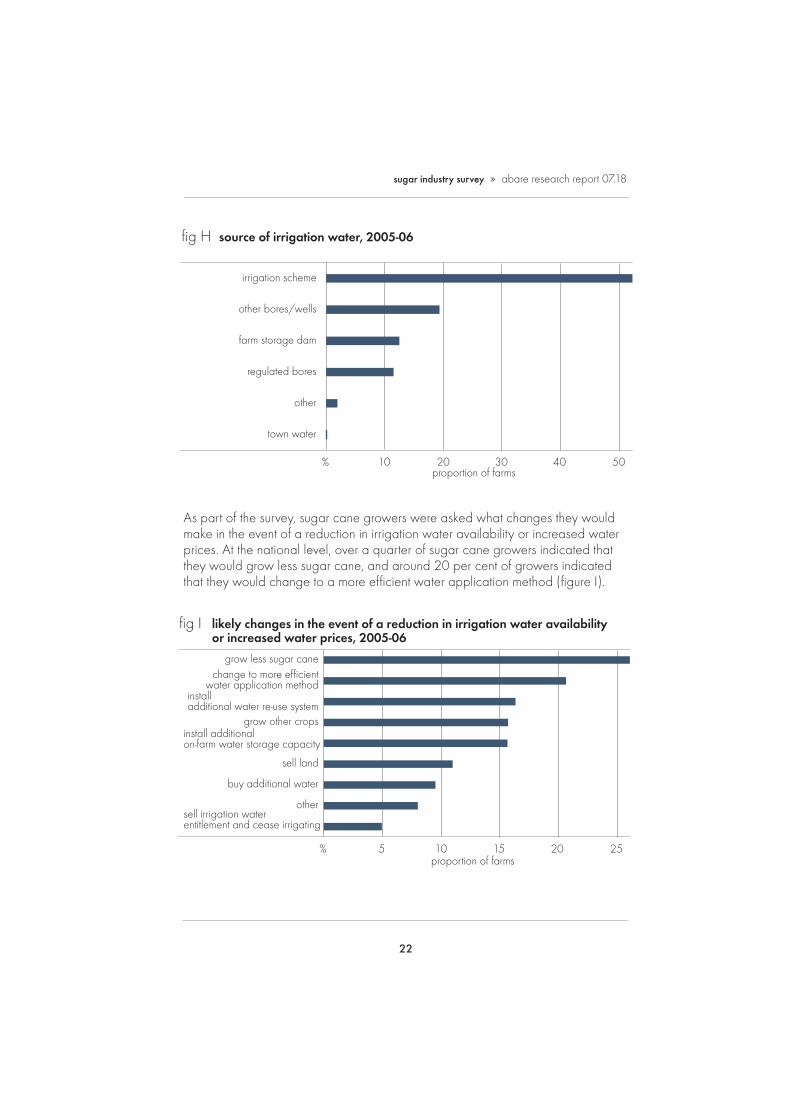
irrigation managementAs noted previously, irrigation water is an important input to sugar cane produc-tion, with around 60 per cent of farms irrigating crops at least once in 2005-06. The most common source of irrigation water used by sugar cane growers was from an irrigation scheme (fi gure H). However, in the Herbert and the Burdekin regions, unregulated bores and wells were the dominant source of irrigation water.
fig G impediments to farm expansion, 2005-06
industry outlook
availability of suitable land
financial resources
lifestyle or lack of interest
availability of time
availability of labour
mill and transport costs
availability of irrigation water
land use planning restrictions
other
% 3020 40 5010proportion of farms
22
sugar industry survey » abare research report 07.18
As part of the survey, sugar cane growers were asked what changes they would make in the event of a reduction in irrigation water availability or increased water prices. At the national level, over a quarter of sugar cane growers indicated that they would grow less sugar cane, and around 20 per cent of growers indicated that they would change to a more effi cient water application method (fi gure I).
fig H source of irrigation water, 2005-06
irrigation scheme
other bores/wells
farm storage dam
regulated bores
other
town water
% 3020 40 5010proportion of farms
fig I likely changes in the event of a reduction in irrigation water availability or increased water prices, 2005-06
grow less sugar canechange to more efficient
water application methodinstall additional water re-use system
grow other cropsinstall additional on-farm water storage capacity
sell land
buy additional water
othersell irrigation water entitlement and cease irrigating
% 1510proportion of farms
20 255
23
sugar industry survey » abare research report 07.18
The most intensive use of irrigation occurs in the Bundaberg, Burdekin, Mackay, and Ord River regions, where more than 80 per cent of sugar cane crops are irrigated at least once. With the exception of growers in the Mackay region, more than 70 per cent of growers in these regions indicated that they would grow less sugar cane if the availability of irrigation water decreased or if the price of irrigation water rose signifi cantly. One possible reason why producers in the Mackay region are less likely to reduce sugar cane production is because a large proportion of growers in this region source their irrigation water from on-farm dams and unregulated bores and wells. As a result, farmers in these regions are not as exposed to regulatory changes that affect water availability and price.
Around half of the growers in the intensive irrigation regions also indicated that they would respond to reduced water availability or increased prices by investing in more effi cient water application methods and water recycling systems and by increasing on-farm water storage capacity.
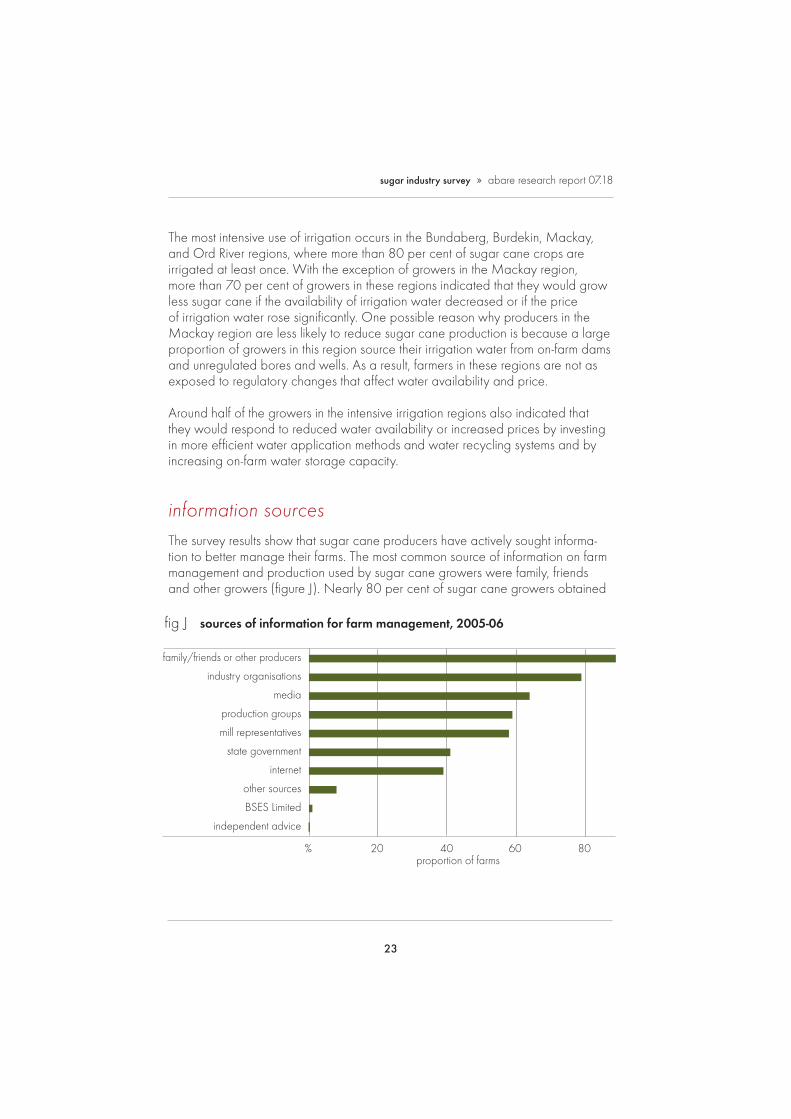
information sourcesThe survey results show that sugar cane producers have actively sought informa-tion to better manage their farms. The most common source of information on farm management and production used by sugar cane growers were family, friends and other growers (fi gure J). Nearly 80 per cent of sugar cane growers obtained
fig J sources of information for farm management, 2005-06
family/friends or other producers
industry organisations
media
production groups
mill representatives
state government
internet
other sources
BSES Limited
independent advice
% 40proportion of farms
60 8020
24
sugar industry survey » abare research report 07.18
information from industry organisations such as cane growers associations and more than 60 per cent sourced information from the media.
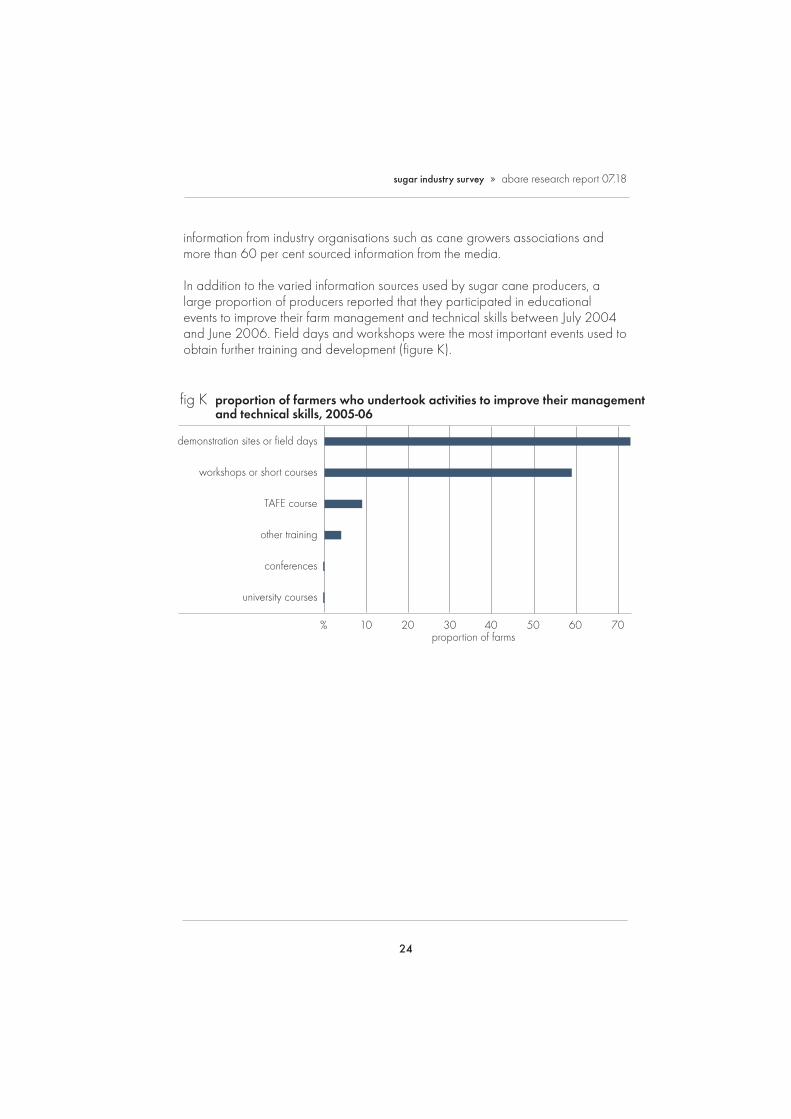
In addition to the varied information sources used by sugar cane producers, a large proportion of producers reported that they participated in educational events to improve their farm management and technical skills between July 2004 and June 2006. Field days and workshops were the most important events used to obtain further training and development (fi gure K).
fig K proportion of farmers who undertook activities to improve their management and technical skills, 2005-06
demonstration sites or field days
workshops or short courses
TAFE course
other training
conferences
university courses
% 30proportion of farms
605040 702010
25
appendix
survey methodology and defi nitions
target populationsABARE surveys are designed and samples selected on the basis of a framework drawn from the Business Register maintained by the Australian Bureau of Statistics (ABS). This framework includes agricultural establishments in each statistical local area classifi ed by size and major industry. The estimates published in this report cover establishments with an estimated value of agricultural operations of $5000 or more. A defi nition of the estimated value of agricultural operations is given in Australian Standard Industrial Classifi cation (ABS 1983, cat. no. 1201.0).
defi nition of the sugar growing industryThe sugar cane growing industry defi nition is based on the Australian and New Zealand Standard Industrial Classifi cation (ANZSIC). This classifi cation is consistent with an international standard that is applied comprehensively across Australian industry, permitting comparisons between industries, both within Australia and internationally. Farms assigned to a particular ANZSIC class have a high proportion of their total output characterised by that class. Further information on ANZSIC and on the sugar cane growing industry is provided in Australian and New Zealand Standard Industrial Classifi cation (ABS 2006, cat. no. 1292.0).
For the purpose of this survey, farms in the sample were selected from units classi-fi ed in ANZSIC 0151. This class consists of units mainly engaged in growing sugar cane. Primary activities include sugar cane growing.
survey design and sample weighting The population was stratifi ed by operation size using the estimated value of agricultural operations (EVAO). The size of each stratum was determined using
A
26
sugar industry survey » abare research report 07.18
the Dalenius-Hodges method*. The sample allocation to each stratum was done using a mixture of the Neyman allocation, which takes into account variability within strata of the auxiliary variable, in this case EVAO, and proportional alloca-tion, which only considers the population number in each stratum. The Neyman allocation allocates large proportions of sample to strata with large variability, in the case of this survey, strata of larger farms (Lehtonen and Pahkinen 2004).
The estimates presented in this report are calculated by appropriately weighting the data collected from each sample farm and then using the weighted data to calculate population estimates. Generally, larger farms have smaller weights and smaller farms have larger weights, refl ecting the strategy of sampling a higher fraction of larger farms than of smaller farms (the former having a wider range of variability of key characteristics).
reliability of estimates The reliability of the estimates of population characteristics presented in this report depends on the design of the sample and the accuracy of the measurement of characteristics for the individual sample farms.
sampling errors
Only a small number of farms out of the total number of farms in a particular industry are surveyed. The data collected from each sample farm are weighted to calculate population estimates. Estimates derived from these farms are likely to be different from those that would have been obtained if information had been collected from a census of all farms. Any such differences are called ‘sampling errors’.
The size of the sampling error is most infl uenced by the survey design and the estimation procedures, as well as the sample size and the variability of farms in the population. The larger the sample size, the lower the sampling error is likely to be. Hence, national estimates are likely to have smaller sampling errors than industry and state estimates.
To give a guide to the reliability of the survey estimates, sampling errors have been calculated for all estimates in this report. These estimated errors, expressed as percentages of the survey estimates and termed ‘relative standard errors’, are given next to each estimate in parentheses.
* Lehtonen, R. and Pahkinen, E. 2004, Practical Methods for Design and Analysis of Complex Surveys. John Wiley and Sons, 2nd edition, Finland.
27
sugar industry survey » abare research report 07.18
calculating confi dence intervals using relative standard errors
Relative standard errors (RSE) can be used to calculate ‘confi dence intervals’ that give an indication of how close the actual population value is likely to be to the survey estimate. To obtain the standard error, multiply the relative standard error by the survey estimate and divide by 100. For example, if average total cash receipts are estimated to be $100 000 with a relative standard error of 6 per cent, the standard error for this estimate is $6000. This is one standard error. Two standard errors is $12 000.
For a 66 per cent confi dence interval, there is roughly a two in three chance that the ‘census value’ (the value that would have been obtained if all farms in the target population had been surveyed) is within one standard error of the survey estimate. This range of one standard error is described as the 66 per cent confi -dence interval. In this example, there is an approximately two in three chance that the census value is between $94 000 and $106 000 {$100 000 +/– $6000}
For a 95 per cent confi dence interval, there is roughly a nineteen in twenty chance that the census value is within two standard errors of the survey estimates (the 95 per cent confi dence interval). In this example, there is an approximately nineteen in twenty chance that the census value lies between $88 000 and $112 000, {$100 000 +/– $12 000}
The size of the RSE is mainly infl uenced by the design of the survey, the sample size and the variability in the population. For example; the larger the sample size, the lower the RSE is likely to be.
comparing estimates
When comparing estimates between two groups, it is important to recognise that the differences are subject to sampling error. As a rough rule of thumb, a conserva-tive estimate (an overestimate) of the standard error of the difference can be constructed by adding the squares of the estimated standard errors of the compo-nent estimates and taking the square root of the result.
For example, if the estimates of farm cash income are $59 334 for sugar cane growers in region 1 and $51 664 for sugar cane growers in region 2, with the relative standard errors given as 38 and 42 per cent respectively, then the differ-ence between these two estimates is $7670. The standard error of the difference can be estimated as:
(38 x $59 334 /100 ) +( 42 x $51 664 /100 ) = $31 292
28
sugar industry survey » abare research report 07.18
A 95 per cent confi dence interval for the difference is:
$7670 ± 1.96 x $31 292 = (–$53 662, $69 002)
Hence, if 100 different samples are taken, in 95 of them, the difference between these two estimates is between –$53 662 and $69 002. Also, since zero is in this confi dence interval, it is possible to say that the difference between the estimates is not statistically signifi cantly different from zero at the 95 per cent confi dence level.
29
sugar industry survey » abare research report 07.18
defi nition of termsowner manager The primary decision maker for the business. This person is iden- tifi ed by discussion between interviewer and interviewee as (one of) the key decision maker(s). This person is usually respon- sible for the day to day operation of the business and may own or have a share in the business.
area of land Includes all land operated by the business, whether owned orat business rented by the business.premises
labour Measured in work-weeks, as estimated by the owner manager. It includes all work on the business by the owner manager, partners, family, hired permanent and casual workers, but excludes work done by contractors.
hired labour Excludes the owner manager, partners and family labour, and work undertaken by contractors. Expenditure on contract services appears as a cash cost.
capital The value of capital employed by the business is the market value of all the assets used including leased items but excluding machinery and equipment either hired or used by contractors. Market valuations are provided by the owner manager of surveyed businesses and include the market value of land and fi xed improvements used by the business, excluding the value of the owner manager’s house. The house value deducted from the total value of land and fi xed improvements is the present day replacement cost, depreciated for age.
debt Estimated as business debt. It includes all debts attributable to the business, excluding personal debt and underwritten loans. Information collected at the survey interview is supplemented by information in the business accounts.
total cash Total of revenues received by the business during the fi nancialreceipts year, including revenues from the sale of sugar cane, other crops, livestock and livestock products. It includes revenue received from royalties, rebates, refunds, plant hire, contracts, insurance claims and compensation, and government assistance payments.
total cash costs Payments made by the business for materials and services and for permanent and casual hired labour (excluding partner and other family labour). It includes the value of any lease
30
sugar industry survey » abare research report 07.18
payments on capital, produce purchased for resale, rent, interest, cropping and livestock related purchases. Capital and household expenditures are excluded from total cash costs. Handling and marketing expenses include commission, levies etc. for business produce sold. Administration costs include accountancy fees, banking and legal expenses, postage, stationery, subscriptions and telephone. Other cash costs include relatively small cost items such as stores, advisory services and travelling expenses.
depreciation Estimated by applying the diminishing value depreciation method to the market value of capital items at 30 June 2006. Capital items are categorised into several groups and relevant depreciation rates are applied. The capital groups include vehicles; handling, harvesting and packing equipment; cultivation and sowing equipment; computers, electronic and communications equipment; other plant and equipment; and buildings on the busi- ness premises.
imputed labour Payments for owner manager and family labour may bear littlecost relationship to the actual work input. An estimate of the labour input of the owner manager, partners and their families is calculated in work-weeks and a value is imputed at the relevant Federal Pastoral Industry Award rates.
farm business Cash operating surplus plus buildup in trading stocks, lessprofi t depreciation, less the imputed value of the owner manager, partner(s) and family labour.
profi t at full Return to capital and management plus interest, rent and fi nanceequity lease payments. It is the return produced by all the resources used in the business.
rate of return The return to all capital used. It is computed by expressing farm business profi t as a percentage of the total opening capital of the business.
equity ratio Calculated as business equity as a percentage of owned capital at 30 June.
off-farm income Income not derived from the surveyed farm business. It includes all off-farm income from wages and salaries, other businesses, other investments and Commonwealth social support payments. It is estimated for the owner manager and spouse only.
31
07.07
Asia Pacifi c Economic Cooperation Secretariat
Association of Southeast Asian Nations – secretariat
AusAid
Australian Centre for Excellence in Risk Analysis
Australian Centre for International Agricultural Research
Australian Fisheries Management Authority
Australian Greenhouse Offi ce
Australian Government Department of the Environment and Water Resources
Australian Government Department of Industry, Tour-ism and Resources
Australian Government Department of Prime Minister and Cabinet
Australian Government Department of Transport and Regional Services
CRC – Plant Biosecurity
CSIRO (Commonwealth Scientifi c and Industrial Research Organisation)
Dairy Australia
Department of Business, Economic and RegionalDevelopment, Northern Territory
Department of Primary Industries, Victoria
Fisheries Research and Development Corporation
Fisheries Resources Research Fund
Forest and Wood Products Research and Development Corporation
Grains Research and Development Corporation
Grape and Wine Research and Development Corporation
Independent Pricing and Regulatory Tribunal
International Food Policy Research Institute
Meat and Livestock Australia
Murray Darling Basin Commission
National Australia Bank
NSW Sugar
Rural Industries Research and Development Corporation
University of Queensland
Wheat Export Authority
RESEARCH FUNDING ABARE relies on fi nancial support from external organ isations to complete its research program. As at the date of this publication, the following organisations had provided fi nancial support for ABARE’s research program in 2006-07 and 2007-08. We gratefully acknowledge this assistance.