Embed Size (px)
Citation preview

Australia'sIdentified
Mineral Resources
1994
BUREAU OF RESOURCE SCIENCES EI
© Commonwealth of Australia 1995
ISBN 0644335238
This work is copyright. Apart from any use as permitted under the Copyright Act 1968, no partmay be reproduced by any process without prior written permission from the AustralianGovernment Publishing Service. Requests and enquiries concerning reproduction and rightsshould be addressed to the Manager, Commonwealth Information Service, Australian GovernmentPublishing Service, GPO Box 84, Canberra ACT 2601.
Bureau of Resource Scienc.esPO Box EllQueen Victoria TerraceParkes ACT 2600
The Bureau of Resource Sciences is a professionally independent Bureau established in October1992 in the Department of Primary Industries and Energy. Its role is to enhance the sustainabledevelopment of Australia's agricultural, mineral, petroleum, forestry and fisheries resourcesand their industries by providing high quality scientific and technical advice to government,industry and the community.
Cover photographs courtesy of Argyle Diamonds.
Design and typesetting by Barbara van der Linden,Bureau of Resource Sciences Design Studio

The Bureau of Resource Sciences (BRS) is a professionally independent scientific
Bureau in the Commonwealth Department of Primary Industries and Energy. Its role is
to enhance the sustainable development of Australia's agricultural, mineral, petroleum,
forestry and fisheries resources and their industries by providing high quality scientific
and technical advice to government, industry and the community. It was established in
1992 by combining the Bureau of Rural Resources with the Mineral and Petroleum
Resource Assessment Branches of the former Bureau of Mineral Resources.
The Mineral Resources Branch of BRS is responsible for providing independent
advice and analysis on Australia's inventory of identified mineral resources, their rate
of development and exploration activity. To ensure that policy makers, the mining
industry, the investment sector and the general community are well informed on these
matters, the Mineral Resources Branch produces Australia's Identified Mineral
Resources annually, drawing on current and historical data from mining and exploration
companies.
To facilitate this function, the Mineral Resources Branch maintains two large databases
on Australia's mineral resources: MINRES, which contains information on the quantity,
quality, type, location and ownership of about 2000 mineral deposits; and MINLOC which
contains detailed locations for over 40 000 Australian mineral occurrences. These are
being linked to OZMIN, an Australian Geological Survey Organisation database listing
the geological features of mineral deposits.
The Mineral Resources Branch also underpins government policy and management
decisions by appraising the mineral resource potential of areas being considered for
restricted land use, advising on environmental issues in the context of resource
assessment and providing advice on offshore exploration and mining technologies.
To achieve partial cost recovery, the Mineral Resources Branch:
has released MINLOC and is soon to release MINRES commercially; and
undertakes independent work for external clients, including:
appraisals of mineral resource potential in Australia and overseas;
integrated analyses of physical, chemical and biological data in the context of
environment protection and sustainability of mining; and audits of mineral
resource estimates and mining operations for government agencies.
':-;-1
~

ContentsList of Plates
List of Figures
List of Tables
List of Abbreviations and Acronyms
Terminology and Definitions
Commodity Review
Summary
Introduction
Mineral Industry Performance
Bauxite
Black Coal
Brown Coal
Chromium
Cobalt
Copper
Diamond
Gold
Iron Ore
Manganese Ore
Mineral Sands
Molybdenum
Nickel
Platinum-Group Metals
Shale Oil
Tantalum
Tin
Tungsten
Vanadium
Zinc, Lead and Silver
Uranium
References
Exploration
Exploration Expenditu re
Exploration Drilling
References
Offshore Mineral Exploration in Commonwealth Waters
Reference
Mineral Resources Branch
page2
2
2
2
4
6
6
6
8
9
9
12
12
13
13
15
15
16
18
18
19
19
20
21
21
21
22
22
23
24
27
28
28
28
30
32
34
35
BUREAU OF RESOURCE SCIENCES

Australia's Identified Mineral Resources
List of Plates PagePlate 1
Plate 2
Plate 3
Processing plant at the Argyle diamond mine, Western
Australia. Photo: Lloyd David, BRS
Hamersley Iron's Brockman No.2 Detritals mine 65 km
northwest of Tom Price, Western Australia.
Photo: Roger Pratt, BRS
Mount Newman Mining's iron ore crushing and stockpiling
facilities at Mount Whaleback (foreground) and
Orebody 29 mine (background) at Newman, Western Australia.
Photo: Roger Pratt, BRS
14
17
17
Figure 2
Figure 3
List of FiguresFigure 1 Trends in economic demonstrated resources (EDR) for
major commodities since 1975
Annual exploration expenditure since 1990-91
Annual exploration expenditure since 1969-70 expressed in
1993-94 dollars
10
29
29
Figure 4
Figure 5
Figure 6
Figure 7
Proportion of exploration expenditure spent on drilling, by
State, 1993-94
Exploration drilling, by State, 1993-94
Exploration drilling, by drilling method, and by area, 1993-94
Offshore mineral exploration in Commonwealth Waters
31
31
31
33
List of Tables
2
Table 1
Table 2
Table 3
Table 4
Table 5
Australian production and exports of selected mineral
products, 1993-94
Australia's identified resources of major minerals and fuels,
1994, and world figures for 1993
Estimated recoverable resources of uranium, 1994 (tonnes U)
Exploration expenditure and exploration drilling, 1993-94
Methods of exploration drilling in Australia, by type
of area, 1993-94
8
11
25
30
30

List of Abbreviations and AcronylnsABARE Australian Bureau of Agricultural and Resource Economics
ABS Australian Bureau of Statistics
AGSO Australian Geological Survey Organisation
A$ Australian dollar
BMR Bureau of Mineral Resources, Geology and Geophysics
BRS Bureau of Resource Sciences
c
EAR-I
EDRGISGL
Gt
IAEAkckg
km
kt
L
Ib
LCSm
nTJ
MELMPJV
Mt
Mtpa
naNSW
NTOECD/NEA
PGM
OLD
RABRAR
RC$SA
t
TAS
U
U30
S
USAUSBMUS$USSRVIC
WA
carat
estimated additional resources - category I
economic demonstrated resources
geographic information system
gigalitre
gigatonne
International Atomic Energy Agency
kilocarat
kilogram
kilometre
kilotonne
litre
pound
Legal Continental Shelf
metre
cubic metre
mineral exploration licence
Mitchell Plateau Joint Venture
million tonnes
million tonnes per annum
not available
New South Wales
Northern Territory
Organisation for Economic Cooperation and Development/Nuclear
Energy Agency
platinum-group metals
Queensland
rotary air blast
reasonably assured resources
reverse ci rcu lation
dollar
South Australia
tonne
Tasmania
uranium
uranium oxide
United States of America
United States Bureau of Mines
United States dollar
Union of Soviet Socialist Republics
Victoria
Western Australia
3BUREAU OF RESOURCE SCIENCES
4
I\ustralia', Identified t\lineral Resources
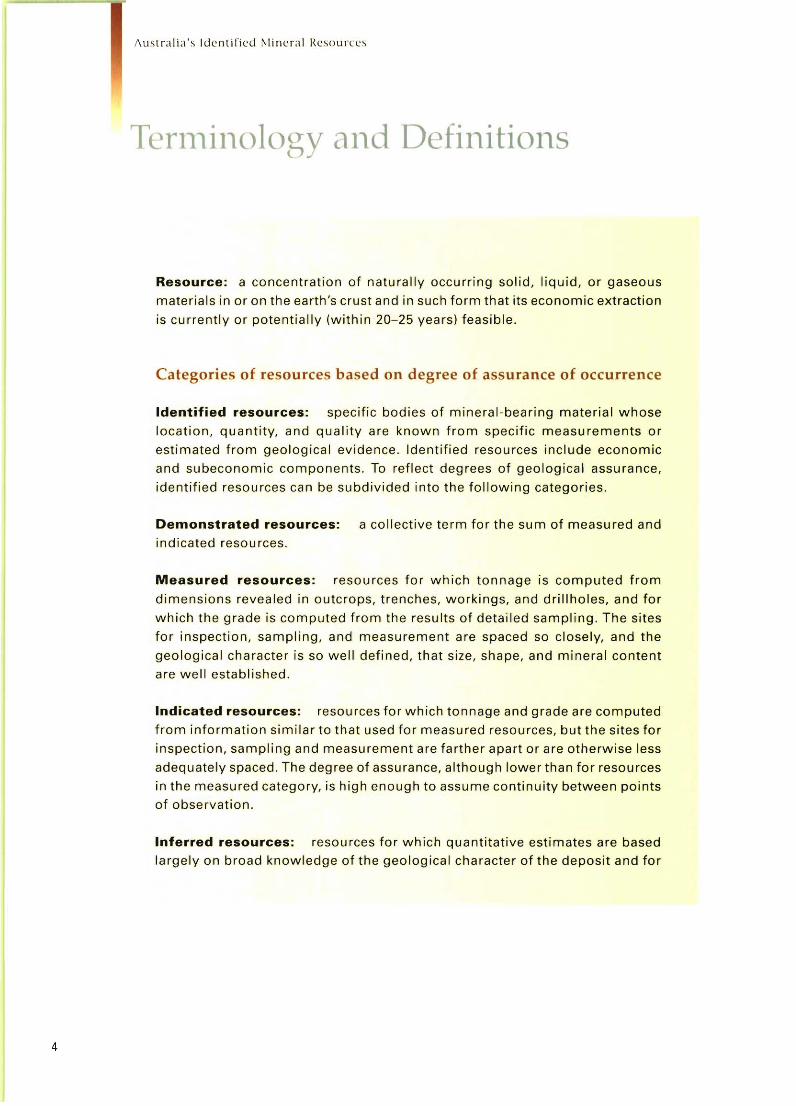
Terminology and Definitions
Resource: a concentration of naturally occurring solid, liquid, or gaseous
materials in or on the earth's crust and in such form that its economic extraction
is currently or potentially (within 20-25 years) feasible.
Categories of resources based on degree of assurance of occurrence
Identified resources: specific bodies of mineral-bearing material whose
location, quantity, and quality are known from specific measurements or
estimated from geological evidence. Identified resources include economic
and subeconomic components. To reflect degrees of geological assurance,
identified resources can be subdivided into the following categories.
Demonstrated resources: a collective term for the sum of measured and
indicated resources.
Measured resources: resources for which tonnage is computed from
dimensions revealed in outcrops, trenches, workings, and drillholes, and for
which the grade is computed from the results of detailed sampling. The sites
for inspection, sampling, and measurement are spaced so closely, and the
geological character is so well defined, that size, shape, and mineral content
are well established.
Indicated resources: resources for which tonnage and grade are computed
from information similar to that used for measured resources, but the sites for
inspection, sampling and measurement are farther apart or are otherwise less
adequately spaced. The degree of assurance, although lower than for resources
in the measured category, is high enough to assume continuity between pointsof observation.
Inferred resources: resources for which quantitative estimates are based
largely on broad knowledge of the geological character of the deposit and for

which there are few, if any, samples or measurements. The estimates are based
on an assumed continuity or repetition, of which there is geological evidence.
This evidence may include comparison with deposits of similar type. Bodies
that are completely concealed may be included if there is specific geological
evidence of their presence. Estimates of inferred resources should be stated
separately and not combined in a single total with measured or indicated
resources.
Categories of resources based on economic considerations
Economic resources: resources for which, at the time of determination,
profitable extraction or production under defined investment assumptions has
been established, analytically demonstrated or assumed with reasonable
certainty.
Subeconomic resources: resources that do not meet the criteria of economic
resources. Subeconomic resources include paramarginal and submarginalcategories.
Paramarginal resources: subeconomic resources that, at the time of
determination, almost satisfy the criteria for economic resources. The main
characteristics of this category are economic uncertainty and/or failure (albeit
just) to meet the criteria that define economic resources. Included are resources
that would be producible given postulated changes in economic or
technological factors.
Submarginal resources: subeconomic resources that would require a
substantially higher commodity price or some major cost-reducing advance in
technology to render them economic.
5BUREAU OF RESOURCE SCIENCES

6
Australia's Identified f\lineral Resources
CommodityReviewSummary
The mineral industry is an integral part of the Australian economy, generating $29 785
million in export revenue in the 1993-94 financial year. This was over 60% of all
commodity exports for the year. Such an important contribution was possible because
of the large and diverse resources that sustain the industry.
Economic demonstrated resources (EDR) of several commodities, including gold,
ilmenite, manganese, magnesite, zinc, tin and silver, rose substantially in 1994. EDR for
cadmium, diamond and vanadium fell significantly, and for other commodities remained
steady or showed minor variation over the year.
Exploration expenditure continued to be dominated by the search for gold. Figures
published by the Australian Bureau of Statistics (ABS) show that in 1993-94, $793 million
was spent on mineral exploration of which 57% was on gold. Expenditure on diamond
exploration rose by 54% to $58 million.
Successful exploration programs have maintained Australia's position as one of the
world's premier resource nations despite continued high rates of production. Australia
is one of the world's top six countries for resources of commodities as diverse as bauxite,
bismuth, gold, mineral sands, lithium, iron ore, lead, silver, manganese, zinc, tantalum
and uranium.
Introduction
This report presents the third annual assessment of Australia's identified mineral
resources by the Bureau of Resource Sciences (BRS). It continues and is consistent
with the resource assessment series published annually by the former Bureau of Mineral
Resources, Geology and Geophysics (BMR).
The assessment is undertaken as an input into government policy decisions relating to
resource and environment management for sustainable development. The report also
examines trends in Economic Demonstrated Resources (EDR) of all major and some
minor mineral commodities, and comments on Australia's position in the world. It
reports on changes in exploration expenditure (expressed in current dollars) over the

past four years. Further, it provides a perspective on mineral exploration expenditure,
expressed in real terms, over the last 24 years.
Estimates of Australia's identified resources of all major and some minor mineral
commodities are reported for 1994. The estimates were prepared by the Mineral
Resources Branch of BRS, and are based on published and unpublished data available
to the Branch up to mid-October 1994. Mine production data for Australia reported in
Table 2 were provided by the Australian Bureau of Agricultural and Resource Economics
(ABARE). Data on petroleum were provided by the Petroleum Resources Branch of
BRS. World data have been obtained or calculated from various sources, mainly
publications of the United States Bureau of Mines (USBM). Data on 1993-94 production,
exports and value of exports are from ABARE (1994) unless indicated otherwise.
The mineral resource classification used in this report was adopted by the former BMR
in 1975 (BMR 1976) and refined in 1983 (BMR 1983). It reflects both the geological
certainty of occurrence of the mineral resources and the economic feasibility of their
extraction (see Terminology and Definitions). EDR is used instead of 'reserves' for
national totals of economic resources in Australia because the term 'reserve' has various
meanings which are not always consistent. EDR also provides a basis for meaningful
international comparisons of the economic resources of nations. With few exceptions,
ore is mined from resources in the economic demonstrated category. The size of EDR
of a commodity in relation to its rate of production is an indicator of the sustainability
of that commodity. EDR are reduced by mining and increased by new discoveries and
by technical and economic changes which turn hitherto uneconomic deposits into
economic ones. 'Paramarginal' and 'submarginal' are two categories of subeconomic
resources which refer to economic feasibility of extraction at current prices using existing
technology (see Terminology and Definitions).
During 1994, the Mineral Resources Branch began a review of the BRS Mineral Resource
Classification system. This review aims to ensure that the BRS system remains
compatible with the revised Australasian Institute of Mining and Metallurgy/Australian
Mining Industry Council/Australian Institute of Geoscientists industry code ( 'Australasian
Code for Reporting of Identified Mineral Resources and Ore Reserves', The review is
scheduled to be completed in 1995 and a revised system, compatible with the industry
codes, published afterwards.
Uranium resources (Table 3) are classified by BRS in categories used by the Organisation
for Economic Cooperation and Development/Nuclear Energy Agency (OECD/NEA) and
the International Atomic Energy Agency (IAEA). 'Reasonably Assured Resources' of
the OECD/NEA and IAEA classification can be equated with 'demonstrated resources'
of the BRS classification, and 'Estimated Additional Resources - Category I' with 'inferred
resources'. In previous years, uranium resources recoverable at a cost of less than US$80
per kilogram of uranium (U) were equated with EDR and those recoverable at a cost of
US$80-130/kg U with 'paramarginal resources'. In 1994, most uranium was sold at prices
below US$80/kg. Consequently, the less than US$80/kg category includes all economic
resources and some that are currently uneconomic.
7BUREAU OF RESOURCE SCIENCES

Australia's Identified Mineral Resources
Mineral Industry Performance
Preliminary statistics published by ABARE (1994) show that mineral exports for
1993-94 were valued at $29 785 million, an increase of $27 million over the revised
1992-93 figure. Details of production and exports of selected minerals are reported in
Table 1.
TABLE 1 Australian production and exports of selected mineral products, 1993-94
Commodity Production Export
8
AluminiumBauxite (Mt) 42.9 na 87Alumina (Mt) 12.76 10.2 2292Aluminium (Mt) 1.38 1.05 1814CopperOres and concentrates (kt) (a) 410 430 295Refined (kt) 325 178 475Diamond (kc) 39909 31 715 542GoldMine production (t) (a) 256Refined (t) 295.5(b) 306.2(b) 5418(blIron and SteelOre and pellets (Mt) 123.9 114.4 2776Iron and steel (Mt) 15.4(cl 2.92 1311LeadOres and concentrates (kt) (a) 530 165 60Refined (kt) 220 165 120Bullion (kt) 213 196 175NickelMine production (kt) (a) 71Refined (kt) 97 na 585Mineral sands
Ilmenite concentrates (kt) 1740 1054 88Rutile concentrates (kt) 205 208 111Synthetic rutile (kt) 420 259 111Titanium dioxide pigment (kt) 147 114 255Zircon concentrates (kt) 460 454 94ZincOres and concentrates (kt) (a) 1080 1516 429Refined (kt) 289 240 366Black coalRaw (Mt) 222.0Saleable (Mt) 178.3 129.1 7166
na = not available; t = tonne; kt = 103 t; Mt = 106 t; kc = 103 carats;Source: Australian Commodites Forecasts and Issues ABARE September Quarter 1994.
lal Total metal content.Ib) Includes gold of Australian and overseas origin.lei Includes 7.2 Mt pig iron and 8.2 Mt raw steel.
•

Long-term trends in EDR for bauxite, black coal, iron ore, gold, copper, lead, zinc, nickel
and mineral sands are shown in Figure 1. The 1994 assessment of Australia's resources
of minerals and fuels is reported in Table 2.
Bauxite
In 1993, Australia maintained its pre-eminent position as the world's largest producer
of bauxite (just over 40%) most of which was refined to alumina (about 34% of world
production). In early 1994, Australia and other countries that accounted for about two
thirds of world production of aluminium in 1993 acknowledged (via a memorandum of
understanding) an excess of 1.5-2 million tonnes per annum (Mtpa) in world primary
aluminium production. A succession of significant cuts in production has since been
instituted by several of the world's major producers of primary aluminium. In response
to lower international demand for alumina stemming from these cuts in production of
aluminium, Australian production of alumina and bauxite is forecast to fall by 7% and
3% to 11.9 Mt and 41.5 Mt respectively in 1994-95 (ABAR E 1994). Based on its wea Ith of
bauxite resources and competitive mining costs, however, Australia is expected to
maintain its dominant position as a producer and exporter of bauxite and alumina.
Australia's bauxite EDR and the ratio of EDR to identified resources (demonstrated and
inferred) remained virtually the same as for the 1993 assessment. Major bauxite
resou rces contin ue to be mined in the north on both sides of the Gulf of Carpenta ria
(Gove, Northern Territory and Weipa, Queensland) and in the southwest along the Darling
Range in Western Australia.
Bauxite resources in the Admiralty Gulf region of northern Western Australia are
extensive and cover an area of over 440 square kilometres. A reappraisal of part of this
region, the Mitchell Plateau, was scheduled to be completed by the Mitchell Plateau
Joint Venture (MPJV) at the end of 1994. Although currently considered as uneconomic,
the Mitchell Plateau deposit is a significant bauxite resource with potential for successful
future development using current mining and beneficiation techniques. An extension
to the lease period was granted by the Western Australian Government in 1993 to MPJV
(Mitchell Plateau Bauxite Co Pty Ltd, 58.3%; Alcoa of Australia Ltd, 19.4%; Billiton
Aluminium Australia, 11.1%; and Sumitomo and Marubeni Corporations, 5.6% each).
Black Coal
In 1993, Australia had about 8% of the world's recoverable EDR of black coal, and was
ranked fifth behind the USA, former USSR, China and South Africa. In 1994, New South
Wales and Queensland accounted for 97% of Australia's in-situ black coal EDR, with
44% of total EDR in the Sydney Basin and 35% in the Bowen Basin. Black coal amenable
to open-cut mining represents 41% of Ausralia's in-situ black coal EDR. Relatively small
but locally important EDR of black coal occur in South Australia, Western Australia and
Tasmania. The overall reduction of just under 6% in recoverable EDR in 1994 compared
to 1993 resulted principally from a reassessment of the amount of in-situ coal that is
considered recoverable.
9BUREAU OF RESOURCE SCIENCES

10
Australia's Identified lineral Resources
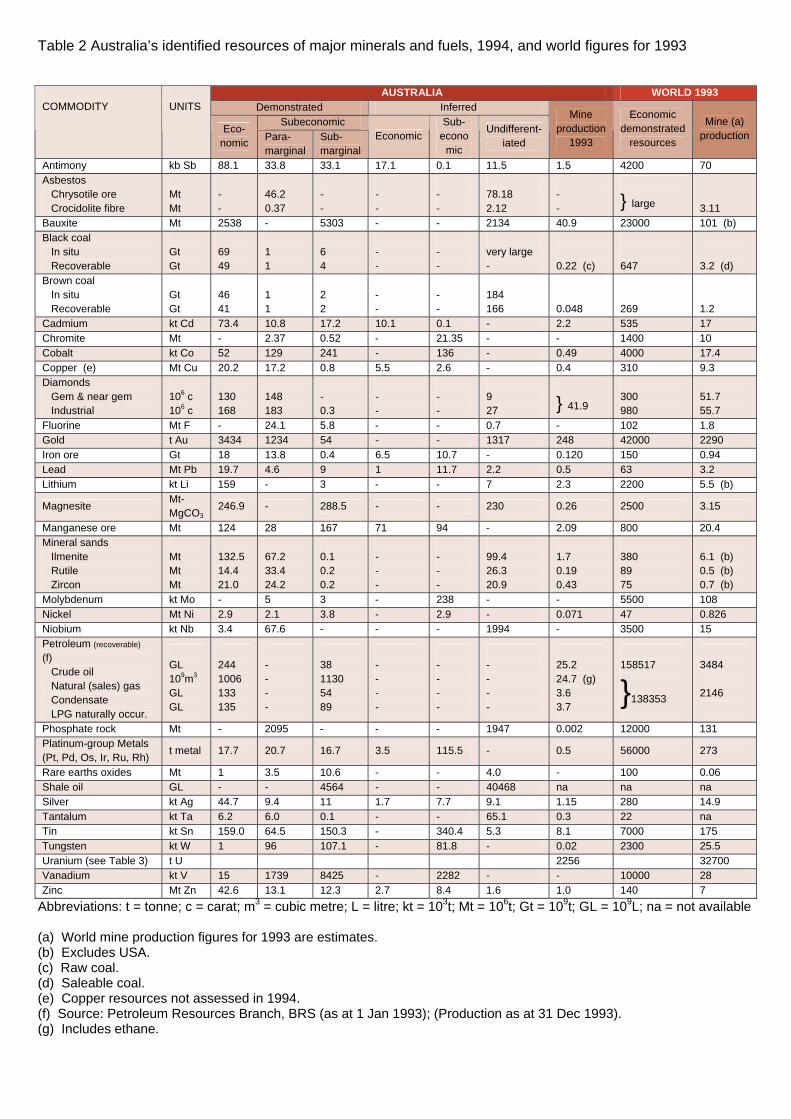
Table 2 Australia’s identified resources of major minerals and fuels, 1994, and world figures for 1993
Abbreviations: t = tonne; c = carat; m3 = cubic metre; L = litre; kt = 103t; Mt = 106t; Gt = 109t; GL = 109L; na = not available (a) World mine production figures for 1993 are estimates. (b) Excludes USA. (c) Raw coal. (d) Saleable coal. (e) Copper resources not assessed in 1994. (f) Source: Petroleum Resources Branch, BRS (as at 1 Jan 1993); (Production as at 31 Dec 1993). (g) Includes ethane.
AUSTRALIA WORLD 1993 Demonstrated Inferred
Subeconomic
COMMODITY
UNITS
Eco-nomic Para-
marginal Sub-marginal
Economic Sub-
economic
Undifferent-iated
Mine production
1993
Economic demonstrated
resources
Mine (a) production
Antimony kb Sb 88.1 33.8 33.1 17.1 0.1 11.5 1.5 4200 70 Asbestos Chrysotile ore Crocidolite fibre
Mt Mt
- -
46.2 0.37
- -
- -
- -
78.18 2.12
- -
} large
3.11
Bauxite Mt 2538 - 5303 - - 2134 40.9 23000 101 (b) Black coal In situ Recoverable
Gt Gt
69 49
1 1
6 4
- -
- -
very large -
0.22 (c)
647
3.2 (d)
Brown coal In situ Recoverable
Gt Gt
46 41
1 1
2 2
- -
- -
184 166
0.048
269
1.2
Cadmium kt Cd 73.4 10.8 17.2 10.1 0.1 - 2.2 535 17 Chromite Mt - 2.37 0.52 - 21.35 - - 1400 10 Cobalt kt Co 52 129 241 - 136 - 0.49 4000 17.4 Copper (e) Mt Cu 20.2 17.2 0.8 5.5 2.6 - 0.4 310 9.3 Diamonds Gem & near gem Industrial
106 c 106 c
130 168
148 183
- 0.3
- -
- -
9 27
} 41.9
300 980
51.7 55.7
Fluorine Mt F - 24.1 5.8 - - 0.7 - 102 1.8 Gold t Au 3434 1234 54 - - 1317 248 42000 2290 Iron ore Gt 18 13.8 0.4 6.5 10.7 - 0.120 150 0.94 Lead Mt Pb 19.7 4.6 9 1 11.7 2.2 0.5 63 3.2 Lithium kt Li 159 - 3 - - 7 2.3 2200 5.5 (b)
Magnesite Mt-MgCO3
246.9 - 288.5 - - 230 0.26 2500 3.15
Manganese ore Mt 124 28 167 71 94 - 2.09 800 20.4 Mineral sands Ilmenite Rutile Zircon
Mt Mt Mt
132.5 14.4 21.0
67.2 33.4 24.2
0.1 0.2 0.2
- - -
- - -
99.4 26.3 20.9
1.7 0.19 0.43
380 89 75
6.1 (b) 0.5 (b) 0.7 (b)
Molybdenum kt Mo - 5 3 - 238 - - 5500 108 Nickel Mt Ni 2.9 2.1 3.8 - 2.9 - 0.071 47 0.826 Niobium kt Nb 3.4 67.6 - - - 1994 - 3500 15 Petroleum (recoverable)
(f) Crude oil Natural (sales) gas Condensate LPG naturally occur.
GL 109m3 GL GL
244 1006 133 135
- - - -
38 1130 54 89
- - - -
- - - -
- - - -
25.2 24.7 (g) 3.6 3.7
158517
}138353
3484 2146
Phosphate rock Mt - 2095 - - - 1947 0.002 12000 131 Platinum-group Metals (Pt, Pd, Os, Ir, Ru, Rh) t metal 17.7 20.7 16.7 3.5 115.5 - 0.5 56000 273
Rare earths oxides Mt 1 3.5 10.6 - - 4.0 - 100 0.06 Shale oil GL - - 4564 - - 40468 na na na Silver kt Ag 44.7 9.4 11 1.7 7.7 9.1 1.15 280 14.9 Tantalum kt Ta 6.2 6.0 0.1 - - 65.1 0.3 22 na Tin kt Sn 159.0 64.5 150.3 - 340.4 5.3 8.1 7000 175 Tungsten kt W 1 96 107.1 - 81.8 - 0.02 2300 25.5 Uranium (see Table 3) t U 2256 32700 Vanadium kt V 15 1739 8425 - 2282 - - 10000 28 Zinc Mt Zn 42.6 13.1 12.3 2.7 8.4 1.6 1.0 140 7

TABLE 2 Australia's identified resources of major minerals and fuels, 1994, and world figures for 1993
AUSTRAUA WORLD 1993
Subeconomic Mine Economic Minell
'Economic Para- Sub- Economic Subeconomic Undifferent production demonstrated production
marginal marginal -iated 1993 resources
Antimony (kt Sb) 88.1 33.8 33.1 17.1 0.1 11.5 1.5 4200 70
Asbestos
Chrysotlle ore (Mt) 46.2 78.18 }Crocldolite fibre (Mt) 0.37 2.12large 3.11
BaUXite (Mt) 2538 5303 2134 40.9 23000 101 lbl
Black coal (Gt)
In SitU 69 6 very large
Recoverable 49 4 0.22 (e) 647 3.2 (d)
Brown coal (Gt)
In Situ 46 1 2 184
Recoverable 41 1 2 166 0.048 269 1.2
Cadmium (kt Cd) 73.4 10.8 17.2 10.1 0.1 2.2 535 17
Chromlte (Mt) 2.37 0.52 21.35 1400 10
Cobalt (kt Co) 52 129 241 136 0.49 4000 17.4
Copperlel (MtCu) 20.2 17.2 0.8 5.5 2.6 0.4 310 9.3
Diamonds (l06 c)
Gem & cheap gem 130 148 9 } 300 51.741.9
Industrial 168 183 0.3 27 980 55.7
FlUOrine (MtF) 24.1 5.8 0.7 102 1.8
Gold (tAu) 3434 1234 54 1317 248 42000 2290
Iron ore (Gt) 18 13.8 0.4 6.5 10.7 0.120 150 0.94
Lead (MtPb) 19.7 4.6 9 1 11.7 2.2 0.5 63 3.2
Lithium (kt Li) 159 3 7 2.3 2200 5.5 (b)
MagneSite (MtMgC03
) 246.9 288.5 230 0.26 2500 3.15
Manganese ore (Mt) 124 28 167 71 94 2.09 800 20.4
Minerai sands
ilmenite (Mt) 132.5 67.2 0.1 99.4 1.7 380 6.1 (b)
Rutile (Mt) 14.4 33.4 0.2 26.3 0.19 89 0.5 (b)
Zircon (Mt) 21.0 24.2 0.2 20.9 0.43 75 0.7 (b)
Molybdenum (kt Mo) 5 3 238 5500 108
Nickel (MtNi) 2.9 2.1 3.8 2.9 0.071 47 0.826
Niobium (kt Nb) 3.4 67.6 1994 3500 15
Petroleum (recoverable) If)
Crude 011 (GU 244 38 25.2 158517 3484
Natural (sales) gas (109m3) 1006 1130 24.7 (g)
Condensate (GL) 133 54 3.6 } 138353 2146
LPG naturally occur (GL) 135 89 3.7
Phosphate rock (Mt) 2095 1947 0.002 12000 131
Platinum-group metals (t metal) 17.7 20.7 16.7 3.5 115.5 0.5 56000 273
(Pt,Pd,Os,lr,Ru,Rh)
Rare earth oXides (Mt) 3.5 10.6 4.0 100 0.06
Shale 011 (GU 4564 40468 na na na
Sliver (ktAg) 44.7 9.4 11 1.7 7.7 9.1 1.15 280 14.9
Tantalum (ktTa) 6.2 6.0 0.1 65.1 0.3 22 na
Tin (kt Sn) 159.0 64.5 150.3 340.4 5.3 8.1 7000 175
Tungsten (ktW) 1 96 107.1 81.8 0.02 2300 25.5
Uranium (see Table 3) (tU) 2256 32700Vanadium (kt V) 15 1739 8425 2282 10000 28
Zinc (MtZn) 42.6 13.1 12.3 2.7 8.4 1.6 1.0 140 7
AbbreViations: t = tonne; c = carat. m3 = cubiC metre; L = litre; kt = 103 I; Mt = 1061; Gt = 109 t; GL = 109 L; na = not available.
(a) World mine production figures for 1993 are estimates.
(bl Excludes USA.
(el Raw coal.
(d) Saleable coal
lei Copper resources not assessed In 1994.
If) Source: Petroleum Resources Branch, BRS (as at 1 January 1993); (Production as at 31 December 1993).
Ig) Includes ethane.
11BUREAU OF RESOURCE SCIENCES
12
Australia's Identified f\lineral Resources
Australian black coal resources are mined for both domestic and export markets. In
1993, Australia produced 6% of the world's saleable coal output and as a producer was
ranked sixth after China, USA, former USSR, India and South Africa. In 1993-94,
221.8 Mt of raw coal was produced, a decrease of 0.8 Mt over the previous financial
year. In 1993-94,72% of Australia's raw coal production came from open-cut operations.
Saleable coal production in 1993-94 was 178.3 Mt, of which 129.9 Mt (73%) was exported.
Coki ng coal contributed 53% of export ton nages.
Exploration expenditure for coal in 1993-94 totalled $27.7 million. In Queensland,
exploration received a major boost in 1993 and 1994 when the State Government lifted
restrictions on prospective coal areas in the Bowen Basin. This resulted in the new
permit holders committing about $20 million over five years for exploration and
evaluation. A report entitled 'Effects of Land Use on Coal Resources' was released by
the New South Wales Government in early 1994. It shows that 48% of the total coal
resources in the Sydney and Gunnedah Basins are affected by various land uses including
National Parks, urban development, prime agricultural land, infrastructure, natural
features, stored bodies of water and Commonwealth land.
With over 70% of Australia's annual saleable coal production exported, the loading
capacity of Australia's eight major coal ports is an important logistical factor. Existing
capacity is 152 Mtpa which will rise to 190 Mtpa as infrastructure projects are completed.
This will ensure that Australian port capacity is adequate to meet the projected rise in
Australian exports, which ABARE forecasts will reach 174.4 Mt in 2000.
Brown Coal
Australia's substantial resources of brown coal are mainly in Victoria which has 94% of
EDR. About 86% of EDR is in the Latrobe Valley. The slight increase in recoverable inferred
resources is due mainly to minor reassessment of recoverable resources in some
deposits. Brown coal is only mined in Victoria and is used mainly for electricity
generation. In 1993, Australia produced 4% of the world's brown coal output and was
the ninth largest producer in the world.
Undeveloped brown coal resources occur in South Australia, Tasmania, Western
Australia and Victoria. In Western Australia, Trans Global Resources N.L. has identified
an inferred resource of lignite near Norseman and is continuing its evaluation.
Chromium
Chromite is the principal commercial source of chromium. Almost all of the chromite
used in Australia, principally in refractory and foundry applications, is imported. Most
of the country's chromium alloy and chemical product needs are also sourced from
overseas. Chromite was last produced in Australia in the Marlborough district of
Queensland in 1988.

..
Australia's identified chromite resources constitute less than 0.2% of world resources
which exceed 11 000 Mt. More than 90% of Australia's identified resources occur in
stratiform deposits in Western Australia - at Lamboo in the Kimberley district and
Coobina in the Pilbara. These deposits have a high iron content but have potential for
use in the production of low-grade ferrochromium and in chromium chemicals.
Chromiferous laterite resources at Range Well, 67 km north-northwest of Cue, Western
Australia, have potential for development as a source of chromium for iron chromium
alloys used in grinding mills. The resources are being fu rther assessed by Dragon Mining
N.L., and additional investigations into the recoverability of the chromium and marketing
of the products are proceeding.
Cobalt
Australia produces more than 7% of world mine output of cobalt, and in 1993 was the
sixth largest producer after Zambia, Canada, Russia, Zaire and Cuba. Australia's ranking
as a cobalt producer declined in 1993 after depletion of resources at the Greenvale
mine in Queensland. Cobalt is principally a by-product of nickel mining and processing
in Australia. Most output is exported.
Cobalt products from the Yabulu nickel refinery in Queensland are derived mainly from
the processi ng of lateritic nickel ores imported from New Caledonia and Indonesia.
Queensland lateritic nickel ore is supplied to the refinery from Marlborough. Cobalt (in
nickel cobalt sulphide) is produced at the Kwinana nickel refinery in Western Australia
from the treatment of nickel matte derived from sulphide concentrates produced at
Kambalda and Leinster, also in Western Australia. A small quantity of cobalt oxide is
produced during zinc refining at Risdon, Tasmania.
Australia's EDR of cobalt rank sixth after Zaire, Cuba, Zambia, New Caledonia and Russia,
but represent only 1% of the world total. In 1990, reclassification of resources associated
with nickel sulphide mineralisation reversed the decreasing trend in EDR that resulted
from mining the Greenvale deposit in Queensland. EDR again decreased after 1990 but
to a lesser extent with the transfer of some sulphide resources into subeconomic
categories and the exhaustion of resources at Greenvale. EDR were unchanged in 1994.
Paramarginal demonstrated resources more than doubled after substantial laterite
resources were delineated at Fifield, New South Wales .
Copper
Resource developments at mines around Australia indicate an optimistic outlook for
copper. Australia's mine production of copper is the sixth largest in the world. The
main producers are mines at Mt Isa, Queensland, and Olympic Dam, South Australia.
13BUREAU OF RESOURCE SCIENCES

Australia's Identified Mineral Resources
At Olympic Dam, the WS Robinson Shaft is scheduled to be completed for
commissioning in February 1995. Drilling has located lanes of higher grade ore
and better defined existing lones, resu Iting in increased reserves.
The Mt Isa Deep Copper Mine (3000 orebody) achieved its first full year of production
du ring 1994. To the north, additional copper resou rces were discovered at theMammoth mine, where bacterial copper-leach extraction technology is used. Tothe east, near Cloncurry, a feasibility study of open-cut mining is underway at the
Ernest Henry copper-gold deposit. To the south-east, at Selwyn, mine development
and resource delineation continues at the Mt Elliott copper-gold deposit, which
should become the main source of ore for the Selwyn operations in the future. To
the south, mine development commenced du ring 1994 at the Osborne copper-gold
deposit where an 11-year mine life is anticipated from open-pit and undergroundmining.
Copper concentrate production at the large copper-gold Northparkes project, incentral New South Wales, is to start in 1995. Additional resources at the CSA Mine
near Cobar were discovered below existing workings and the feasibility of
deepening the mine and increasing output is being assessed. Significant additional
resources have been discovered recently near the Girilambone mine (Nyngan
region, NSW) and their potential as feed to the existing bacterial, heap-leach copper
extraction plant is being evaluated.
Remaining copper-gold resources at the Mt Lyell mine, in Tasmania, are beingassessed with a view to re-sta rti ng min ing operatio ns. Based on data from previousoperations, the resource has been reported as 17.5 Mt of ore with a grade of 1.5%
copper and 0.5 grams of gold per tonne. New drilling at the Prince Lyell deposit
has confirmed extension of mineralisation to about 250 m below existing workings.
PLATE 1 Processing plant at the Argyle diamond mine, Western Australia. Photo: Lloyd David, BRS.
14

•
•
Diamond
Australia has over 40% of the world's EDR of gem and near-gem diamond, and more
than three times the EDR of any other country's resources of industrial quality diamond.
Australia produced over 40 million carats of diamond in 1993, more than twice that of
any other country, but the low proportion of gem quality stones (5%) resulted in the
total value of production being less than that of many other diamond producing
countries.
Over 90% of Australia's resources are in the Argyle deposit in the Kimberley region,
Western Australia. Argyle's mine output accounts for about 90% of Australia's diamond
production. Open-pit mining has been in the southern, richer part of the orebody and is
scheduled to progress to the northern part in the near future. Relatively small resources
of alluvial diamond, derived from the Argyle deposit, are worked nearby at the Argyle
Alluvials operation and about 30 km downstream at Bow River. Comprehensive
environmental rehabilitation is an integral part of the alluvial operations. The feasibility
of underground mining after open-pit resources are exhausted at Argyle, in about eight
to ten years, is being examined.
Australia's EDR of gem and industrial quality diamond fell by 11%, mainly as the result
of mine production at Argyle. Small subeconomic hard rock resources occur in Ellendale
Pipes 4 and 9 east of Broome, Western Australia, and limited subeconomic alluvial
resources are known at Copeton in northeastern New South Wales.
Two more small kimberlite pipes have been discovered by Australian Diamond
Exploration Joint Venture (Ashton Mining Limited, 67.5%; Aberfoyle Limited, 22.5%;
and others 10%) at the diamondiferous Merlin prospect, about midway between Tennant
Creek and the Northern Territory-Queensland border. Bulk sampling of the 11 pipes
discovered to date has commenced. Three 50-tonne samples of diamondiferous rock
from the Coanjula prospect 140 km to the north are also being evaluated.
Two wide-diameter (1.2-metre) drillholes were used to take bulk samples from the
northern lobe of the Aries kimberlite pipe in the central Kimberleys. The diamond content
of these samples was relatively low and bulk sampling has ceased. Work on the
delineation of the central and southern lobes is continuing.
At Copeton, several prospects are to be tested by a 2000-metre drilling program.
Technological advances in rolls crusher design at Argyle has resulted in the world's
largest rolls crushers being installed at this mine. This and other measures have boosted
mill processing capacity from 6 Mtpa to over 8 Mtpa of ore per year. Successful research
and development resulted in development of a high-capacity radial X-ray diamond sorter
to handle the exceptionally high diamond content of Argyle ore.
Gold
Australia's gold EDR grew by just over 14% in 1994 to a record 3434 t. This growth was
the result of successful exploration programs funded by high levels of exploration
15BUREAU OF RESOURCE SCIENCES

16
Australia's Identified f\lineral Resources
expenditure in recent years, and reassessments based on the continuing higher gold
prices. It is reasonable to expect that the high level of exploration expenditure will start
to translate into additional resources in 1995. If the price of gold is sustained at or
above present levels, exploration expenditure is expected to be maintained at high
levels.
Australia's mine production of gold was reported by ABARE to be a record 256 t in
1993-94. ABARE have forecast a further increase to 270 t in 1994-95. The expected
continued high level of exploration expenditure is essential for ensuring that such growth
is sustainable. Only a small quantity of gold output is a by-product of the production of
other metals.
Identified resources rose by just under 15% to 6039 t. This was achieved in a year in
which production also reached record levels. EDR's share of identified resources
remained unchanged at 57%. Demonstrated resources rose by 10.5% to 4722 t and
inferred resources rose by 33% to 1317 t.
While EDR rose by 431 t, subeconomic resources rose by only 17 t. Given the higher
gold prices over the last few years, the relatively small growth in subeconomic resources
was not unexpected.
Gold resources are mined in all States and the Northern Territory. Western Australia
had just over 62% of Australia's EDR, a small reduction from its 66% share in 1993.
Western Australia also dominates production. Preliminary statistics published by ABARE
show that Western Australia's mine production of gold was 193.8 t, 76% of the Australian
tota I.
In 1993-94, exploration expenditure for gold rose by 42% to $453.8 million. This was
57% of total expenditure on mineral exploration. Of the total, 68% was spent in Western
Australia.
Australia is the world's th i rd largest gold prod ucer after South Africa and the USA,
accounting for about 11% of 1993 world output, the same share as in 1992.
Australia's share of world EDR fell slightly to 7% in 1993. It had the world's fourth largest
EDR in that year. Successful exploration in 1993-94 may see Australia overtake Russia
to become the world's third largest holder of EDR after South Africa and the USA.
Iron Ore
Australia's iron ore resources provide the foundation for one of its major export
industries. Australia currently produces about 13% of world iron ore output and its
exports are exceeded only by those of Brazil. As a producer, Australia ranks fourth in
the world after the former USSR, Ch ina and Brazil. Australia's EDR of iron ore rank
second after the former USSR.
Australia's identified iron ore resources are very large with about 90% in the Pilbara
region of Western Australia, mostly in the Hamersley Basin, one of the world's major
iron ore provinces.

World identified iron ore resources are estimated at 800 000 Mt. These are spread
throughout many countries but most (possibly as much as 85%) occur in the former
USSR, Australia, Canada, USA, Brazil, India, South Africa, China, Sweden and Venezuela.
Australia's EDR is slightly more than 35% of total domestic identified resources. A
reduction in EDR between 1975 and 1976 resulted from the reclassification of some
phosphorus-bearing resources. Since then, EDR has gradually risen. A jump in EDR
between 1990 and 1991 followed additional exploration that resulted in upgrading
inferred resources to EDR. A marginal increase in EDR from 1992 to 1994 reflects minor
reclassification and revisions.
In response to a substantial rise in export demand for Australian iron ores since the
mid 1980s (particularly from China, South Korea and Taiwan), more than a dozen new
iron ore projects have been proposed or commissioned, mainly in the Pilbara.
Expansions at Deepdale and Channar, and new mines established at Yandi (Marillana
Creek) and Marandoo, will playa major role in meeting increased export demand in the
next decade.
Despite three decades of falling prices in real terms, Pilbara iron ore remains competitive
on export markets, and the industry is a leader in adopting advanced technology and
mining methods. Recent large-scale investment in new mining capacity and ore handling
equipment, optimisation of deposit development, and the adoption of other cost-efficient
mining strategies are expected to lead to further increases in productivity and efficiency.
Given its raw material base and the needs of expanding steel industries in Asia, Australia
is well placed to maintain its role as a leading supplier of relatively unprocessed iron
ore. However, value adding is being vigorously pursued, and the industry is in the
forefront of investigations into new iron and steel making technology that is anticipated
to become important during the early decades of the 21st century.
PLATE 2 Hamersley Iron's Brockman No.2Detritals mine 65 km northwest of TomPrice, Western Australia.Photo: Roger Pratt, BRS.
PLATE 3 Mount Newman Mining's iron ore crushing andstockpiling facilities at Mount Whaleback(foreground) and Orebody 29 mine (background) atNewman, Western Australia.Photo: Roger Pratt, BRS.
17BUREAU OF RESOURCE SCIENCES
18
Australia's Identified lincral Resources
Manganese Ore
Australia produced 9% of world manganese ore output in 1993 and was the second
largest exporter after Gabon, displacing South Africa for the first time. The principal
mines and resources are on Groote Eylandt, Northern Territory, and at Woodie Woodie
in the Pilbara, Western Australia. Most manganese mining at Woodie Woodie became
uneconomic in 1994, and was suspended after prices fell and mining costs rose as a
consequence of pit dewatering requirements. However, the new Mike mine at Woodie
Woodie, operated by Valiant Consolidated Limited, began production during 1994 on
the basis of the ore's high manganese grade, low impurities and relatively low
development cost.
Based on contained manganese, Australia has about 6% of world EDR and ranks third
after South Africa (44%) and the former USSR (36%). Australia's EDR increased by more
than 15% in 1994 compared with 1993. This reflected an increase in resources at Groote
Eylandt which more than offset the reclassification of some relatively small Woodie
Woodie resources. The decline in Australia's EDR since 1975 mainly reflects the
reclassification of resources in the early 1980s when more detailed information became
available; a re-evaluation of resources after more intensive exploration in the mid-1980s;
and depletion as a result of mining.
Australia's resources of manganese ore support a significant export industry and
significant domestic ferromanganese, silicomanganese and manganese dioxide
processi ng.
Mineral Sands
Australia has 35 % of the world's EDR of alluvial ilmenite, 16 % of rutile and 35 % of
zircon. It ranks first in EDR for all three minerals, and is the world's largest producer
and exporter of alluvial ilmenite, rutile and zircon. South Africa and Canada mine more
ilmenite than Australia; the latter from a hard rock deposit and the former from dune
sands. Both countries upgrade their ilmenite to titanium slag before export. Most of
Australia's currently mined resources are located along the east and west coasts in
both modern and ancient coastal sand systems.
EDR of ilmenite, rutile and zircon increased by 12%,3% and 1% respectively in 1994.
Western Australia has about 50% of rutile and zircon and over 70% of ilmenite EDR.
Significant increases in demonstrated resources, particularly ilmenite, occurred in the
southwest of Western Australia, where exploration at several deposits extended existing
resources and defined resources in new areas.
About 75 % of rutile and zircon EDR are unavailable for mining. These resources are
mainly in Queensland and New South Wales. Areas quarantined from mining are largely
included in national parks. They include Moreton and Fraser Islands, the Cooloola sand
mass north of Noosa and the Shoalwater Bay area in Queensland, and the Yuraygir,
Bundjalung and Myall Lakes areas in New South Wales.
•
Australia's mineral sands industry is currently expanding in expectation of forecast
growth in demand for titanium dioxide pigment, the principal end use for ilmenite and
rutile. Cable Sand (WA) Pty Ltd's Jangardup mine in the southwest of Western Australia
commenced production in early 1994. In anticipation of forecast market growth and
increased prices, other mines have returned to full capacity. Several additional mineral
sand projects such as Beenup near Augusta in Western Australia and Byfield near
Rockhampton in Queensland are under investigation. Value adding is expected to
increase, especially for synthetic rutile and titanium dioxide pigment. Australia is the
world's largest producer of synthetic rutile. Up to half of the ilmenite mined in Western
Australia is upgraded to synthetic rutile (containing in excess of 92% titanium dioxide)
in four synthetic rutile plants located in Western Australia.
Molybdenum
Molybdenum (as molybdenum trisulphide) was last produced in Australia at King Island,
Tasmania, in 1990 in conjunction with scheelite (a tungsten mineral) mining. Production
of molybdenum concentrates commenced at King Island in small quantity in 1980.
Chemical treatment of scheelite fines at that time was required to reduce their
molybdenum content. This was necessary because the contained molybdenum attracted
a penalty which reduced the price received. Treatment of the scheelite resulted in the
production of high-grade calcium tungstate (artificial scheelite) as well as molybdenum
trisu Iphide.
Australia's identified resources of molybdenum constitute about 2% of the world total
of 12 Mt. All of Australia's resources are subeconomic. The largest resources are in the
inferred category, and occur with tungsten (scheelite) mineralisation at Mount Mulgine,
95 km east of Morawa in Western Australia. In Queensland, resources occur at Wombah
(65 km southwest of Bundaberg), Ben Lomond (60 km southwest of Townsville) and
Maureen (40 km northwest of Georgetown) the latter two being in association with
uranium. Molybdenum resources in the Molyhill deposit, in the Jervois Ranges, Northern
Territory, are associated with tungsten (scheelite) mineralisation. Resources also occur
at Yetholme (20 km east of Bathurst) in New South Wales.
World oversupply and low prices have deterred interest in exploration for molybdenum
in Australia since the early 1980s. The potential for future production in Australia is
therefore expected to depend largely on the economics of recovering the metal as a by
product from polymetallic deposits.
Nickel
Most nickel mined in Australia is processed to smelted and refined forms, making it a
substantial domestic value adding industry. The industry also produces significant
copper, cobalt and platinum group metals as by-products.
19BUREAU OF RESOURCE SCIENCES

20
Australia's Identified t'>lincral Resources
Australia produces about 8% of the world's annual mine output of nickel and in 1993
was ranked fourth (fiHh in 1992) behind Russia, Canada and New Caledonia. The main
Australian mines are at Kambalda, Leinster and Forrestania in Western Australia, and
Marlborough in Queensland. Smelting operations are located at Kalgoorlie, Western
Australia, and refineries at Kwinana, Western Australia, and Yabulu, Queensland.
Australia's EDR rank sixth in the world after Cuba, Russia, Canada, New Caledonia and
Indonesia. Almost all EDR (97%) are in sulphide deposits in Western Australia.
Changes in EDR after 1975 partly reflect the impact of nickel price fluctuations on the
economics of mining. Several mines closed in the late 1970s and again in the mid 1980s
as a result of depressed prices; EDR decreased on both occasions. An increase in EDR
to record levels in 1990 and 1991 resulted from the reclassification of resources at a
reopened mine and at projects where open-cut mining was assessed to be economically
viable. EDR were unchanged in 1994.
The Australian nickel industry is undergoing major expansion and revitalisation in
expectation of market growth. The programs are expected to result in an expansion of
Australia's world market share and further improvement in Australia's competitive
position, which is based mainly on the mining of relatively shallow sulphide deposits.
Smelting and refining capacity have increased, mine production capacity at Leinster
has doubled and a major $450 million open-cut mining project (based on disseminated
nickel sulphides) at Mount Keith, Western Australia, was scheduled to begin
commissioning operations in late 1994. Additional nickel mining projects are also under
investigation in Western Australia.
Platinum-Group Metals
Minor production of platinum-group metals (PGM: platinum, palladium, osmium,
iridium, rhodium and ruthenium) occurs in Western Australia as a by-product of nickel
mining at Kambalda. Nickel concentrates containing PGM are smelted at Kalgoorlie
and PGM are retained in the matte, which is either refined at Kwinana or exported.
PGM (mainly platinum and palladium) are recovered at Port Kembla from the processing
of by-product copper sulphide residue produced at the Kwinana nickel refinery.
Australian mine production of PGM is about 2% of world output. Variations in EDR,
which are mostly contained in nickel sulphide deposits of the Kambalda field, largely
reflect changes in nickel resources at this location. EDR decreased from 1990 to 1992
but increased slightly in 1993 and were unchanged in 1994. EDR comprise platinum
(26%), palladium (47%) and other PGM (27%).
Exploration in recent years has resulted in the discovery of substantial resources of
PGM in Australia, mostly in Western Australia, but these resources are not commercially
viable. Substantial inferred resources occur at Munni Munni in the Pilbara. Resources
in a similar setting to those at Munni Munni occur at nearby Mount Sholl and at Panton
near Halls Creek in the Kimberley region. Relatively large resources were discovered in
1993 at Range Well and Weld Range in the Murchison region, 370 km northeast of
Geraldton. The extraction of PGM from these resources is being evaluated by Dragon
Mining N.L. and Austmin Gold N.L.
Shale Oil
Australia's in situ shale oil resources were unchanged in 1994. Virtually all demonstrated
and inferred resources are in Queensland but small resources occur in New South Wales
and Tasmania. Shale oil is not currently produced in Australia.
Research is currently directed predominantly toward characterisation studies, processing
technologies and shale oil upgrading. The most advanced project is that based on the
Stuart deposit near Gladstone. A three stage development is proposed in which stage
one will be a commercial demonstration plant that may be used as a module in
subsequent stages. Stage two would be a full commercial plant module and stage three
a full commercial plant. To assist this project, the Commonwealth Government has
exempted from excise duty any petrol produced by the project for sale in Australia for
up to 600 000 barrels per year until 2005.
Spent shale from processing of oil shale would normally be used as mine fill or
stockpiled. Investigations into possible other uses for residues from spent torbanite
from the Alpha deposit in Queensland, indicate that it has potential for use in production
of activated carbon. Research into this possibility is continuing.
Tantalum
Australia has the world's largest EDR of tantalum, with about 20% of the world total.
The world's largest tantalum resource occurs in the Greenbushes deposit in the
southwest of Western Australia. Important resources also occur in deposits that form
the basis of the Wodgina project in the Pilbara district of Western Australia.
Gwalia Consolidated Ltd's Greenbushes operation produced 337 442 pounds of tantalum
products in 1993-94. The Wodgina project of Pancontinental Mining Ltd and Goldrim
Mining Australia Ltd produced 132 573 pounds in 1993-94. Small quantities are also
produced in the Pilbara from the Pilgangoora project.
Tin
Australia is the world's fourth largest tin producer after China, Brazil and Indonesia.
However, in terms of EDR, Austral ia is ranked seventh after China, Brazil, Malaysia,
Thailand, Indonesia and Zaire.
21BUREAU OF RESOURCE SCIENCES

22
Australia's Identified lineral Resources
Australia's demonstrated resources of tin totalled 373 380 tonnes in 1994. This was an
increase of 10% over 1993, which resulted largely from further definition of the Rendeep
reserves and resources at the Renison Mine in Tasmania. Revised estimates for resources
at Ringarooma Bay, also in Tasmania, contributed significantly to the increase.
EDR increased by 30% in 1994. The increase in Australia's EDR reflects the announcement
by Renison Goldfields Consolidated Ltd of plans to develop the Rendeep resources.
Initial development commenced in July 1994 and production of ore is scheduled to
commence in late 1996.
A significant tin resource occurs in the Greenbushes deposit in Western Australia where
it is recovered as a by-product of tantalite and spodumene mining. Mount Carrington
Mines Ltd has acq u i red a series of tenements in the Mou nt Ga rnet area of north
Queensland, where it hopes to commence production before the end of 1995.
Tungsten
Small quantities of tungsten, in scheelite concentrates, continue to be produced at the
Kara mine at Hampshire, south of Burnie, Tasmania. Production in 1993 was less than
0.1% of world production. Australia was once an important world tungsten producer
but since the early 1980s more than six mines have closed because of depressed prices
and world oversupply.
Australia's demonstrated resources of tungsten constitute about 6% of the world's total.
Most identified resources occur at Mount Mulgine and Mount Alexander, Western
Australia; King Island, Cleveland, Oakleigh Creek and Kara, Tasmania; Torrington, New
South Wales; Wolfram Camp, and Mount Carbine, Queensland; and Molyhill, Northern
Territory. Apart from the EDR at Kara, all resources are classified as subeconomic.
Prospects for future tungsten mining in Australia depend upon an increase in price and
a closer balance between world tungsten supply and demand.
Vanadium
Numerous occurrences of vanadium minerals have been recorded in Australia. A deposit
at Coates, Western Australia, was mined in 1980 and 1981 before mining was suspended
because of falling prices and plant processing difficulties. Several other Australian
deposits have been explored as possible vanadium sources.
Australia's demonstrated resources are very large on a world scale. However, virtually
all resources are subeconomic. The only resources classified as economic occur in the
Savage River iron ore deposit in Tasmania, and the Yeelirrie uranium deposit in Western
Australia.

Of Australia's demonstrated resources of vanadium, 83% are contained in the Julia Creek
oil shale deposit in Queensland, 12% in the Mitchell Plateau and Cape Bougainville bauxite
deposits in Western Australia and the remaining 5% in the Yeelirrie uranium deposit,
Windimurra, Coates, Barrambie, and Gabanintha titaniferous magnetite deposits inWestern Australia, and the Savage River iron ore deposit in Tasmania.
Vanadium resources contained in or associated with titaniferous magnetite deposits are
considered to have the best potential for economic development in Australia. Thefeasibility of developing vanadium bearing deposits at Windimurra and Coates is being
investigated by Precious Metals Australia Limited and Clough Resources respectively.
Recovery of vanadium contained in oil shale at Julia Creek depends mainly on the
economics and technology of oil shale extraction, and is unlikely to become commerciallyviable in the medium term.
Zinc, Lead and Silver
Australia has the world's largest EDR of both zinc (30%) and lead (31%1 and lies third
behind Canada and Mexico for silver (16%). Australia is the world's largest producer oflead, second largest of zinc and fourth largest of silver. Production is mainly from mines
at Mount Isa in Queensland, Broken Hill in New South Wales and Hellyer and Rosebery
in Tasmania.
In 1994, EDR rose significantly for zinc (up 13%) and silver (up 33%), and lead increased
slightly. Reassessment of resources at major deposits resulted in large increases in zinc,
lead and silver EDR at some which were partially offset by production and reclassification
of resources at others.
Exploration and evaluation of deposits continues in the Carpentaria-Mt lsa MineralsProvince (northwest Queensland and northeast Northern Territory) where mine
production is due to commence at the McArthur River deposit in 1995. Bulk sampling formetallurgical testing is underway at the Century deposit and preliminary metallurgical
tests on the Cannington mineralisation were completed successfully at Mt lsa.
Development decisions are scheduled to be made for both these deposits in the first
half of 1995. Studies continue into possible development of the Dugald River zinc-rich
deposit northeast of Mt lsa.
Deep exploration drilling from the surface at Rosebery has intersected significant new
high-grade resources beneath the existing mine. A detailed evaluation and development
program, to be implemented from the existing deeper underground workings, is to takeplace over the next few years.
Exploration continues for base metals in the Pilbara region of Western Australia. Two
new small to medium deposits at Salt Creek and Sulphur Springs have been delineated.
23BUREAU OF RESOURCE SCIENCES
24
Australia's Identified Mineral Resources
Together with the known deposits such as Mons Cupri and Whim Creek, these deposits
enhance the prospectivity of the region.
Zinc-rich resources at Blendevale, in the Kimberley region of Western Australia, have
been reassessed and upgraded by new owners. These, together with similar resources
at the Kapok and Goongewa (formerly called Twelve Mile Bore) deposits, may augment
economic resources at the nearby Cadjebut mine. Exploration potential exists for further
resources in the region.
At Broken Hill, open-pit economic resources were delineated at the Potosi Prospect to
the near north of the Broken Hill deposit. Encouraging drillhole intersections were made
at the Consols Prospect (formerly Pinnacles) southwest of Broken Hill.
Research and development on the MM130 continuous hard rock mining machine
continued at Broken Hill. This technology may contribute to making low-grade resources
at Broken Hill and in other deposits economic in the future.
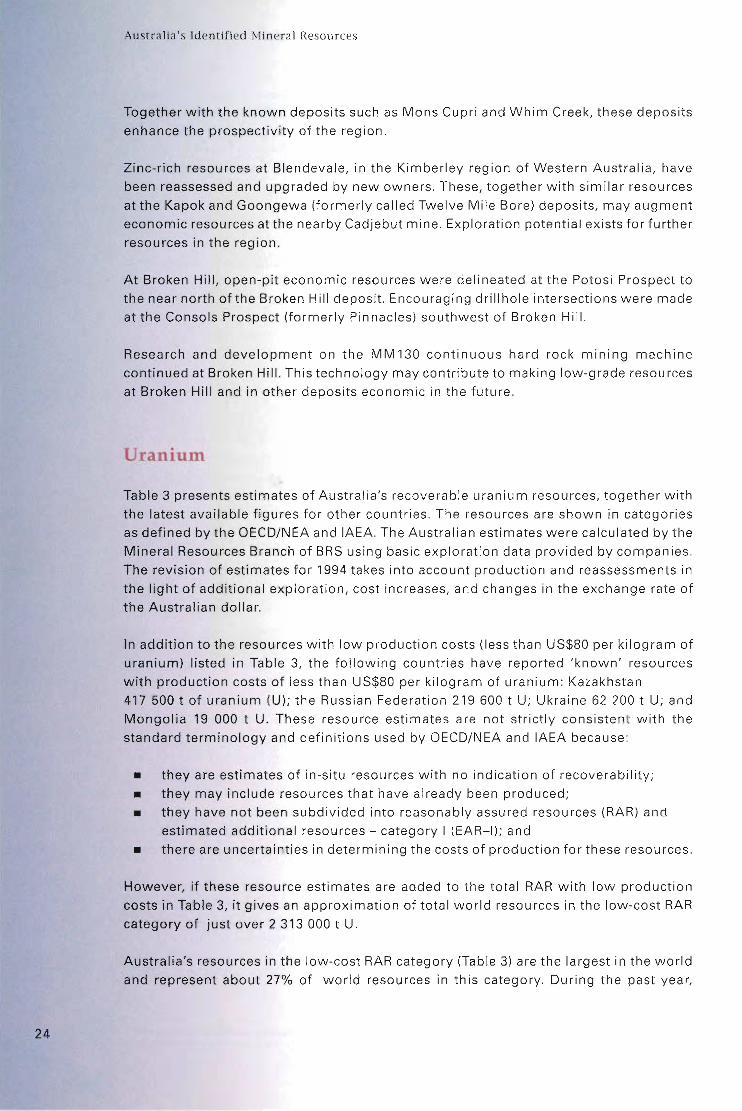
Uranium
Table 3 presents estimates of Australia's recoverable uranium resources, together with
the latest available figures for other countries. The resources are shown in categories
as defined by the OECD/NEA and IAEA. The Australian estimates were calculated by the
Mineral Resources Branch of BRS using basic exploration data provided by companies.
The revision of estimates for 1994 takes into account production and reassessments in
the light of additional exploration, cost increases, and changes in the exchange rate of
the Australian dollar.
In addition to the resources with low production costs (less than US$80 per kilogram of
uranium) listed in Table 3, the following countries have reported 'known' resources
with production costs of less than US$80 per kilogram of uranium: Kazakhstan
417 500 t of uranium (U); the Russian Federation 219 600 t U; Ukraine 62 200 t U; and
Mongolia 19 000 t U. These resource estimates are not strictly consistent with the
standard terminology and definitions used by OECD/NEA and IAEA because:
• they are estimates of in-situ resources with no indication of recoverability;
• they may include resources that have already been produced;• they have not been subdivided into reasonably assured resources (RAR) and
estimated additional resources - category I (EAR-I); and
• there are uncertainties in determining the costs of production for these resources.
However, if these resource estimates are added to the total RAR with low production
costs in Table 3, it gives an approximation of total world resources in the low-cost RAR
category of just over 2 313 000 t U.
Australia's resources in the low-cost RAR category (Table 3) are the largest in the world
and represent about 27% of world resources in this category. During the past year,
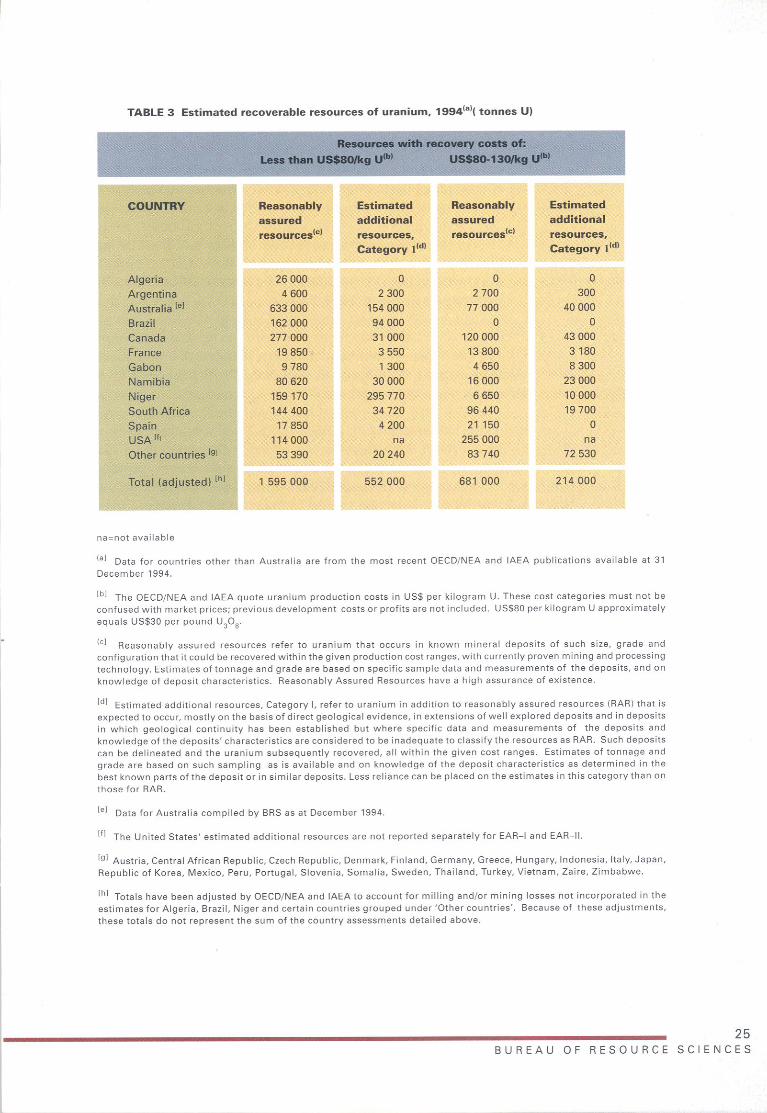
TABLE 3 Estimated recoverable resources of uranium. 19941al( tonnes U)
Resources with recovery costs of:
Less than US$8QIkg U'" US$8G-13l1/kg U'b'
COUNTRY Reasonably Estimated Reasonably Estimatedassured additional assured additionalresourceslcl resources, resources1c) resources,
Category Ildl Category lldl
Algeria 26000 0 0 0Argentina 4600 2300 2700 300Australia le) 633000 154000 77 000 40000Brazil 162000 94000 0 0Canada 277 000 31000 120000 43000France 19850 3550 13800 3180Gabon 9780 1300 4650 8300Namibia 80620 30000 16000 23000Niger 159170 295770 6650 10000South Africa 144400 34720 96440 19700Spain 17 850 4200 21150 0USA If, 114000 na 255000 naOther countries 191 53390 20240 83740 72 530
Total (adjusted) [hI 1 595000 552000 681 000 214000
na",not available
(al Data for countries other than Australia are from the most recent OECD/NEA and IAEA publications available at 31December 1994.
[bl The OECD/NEA and IAEA quote uranium production costs in US$ per kilogram U. These cost calegories must not beconfused with market prices; previous development costs or profits are not included. USS80 per kilogram U approximatelyequals USS30 per pound U30 S.
(e] Reasonably assured resources refer to uranium that occurs in known mineral deposits of such size, grade andconfiguration that it could be recovered within the given production cost ranges, with currently proven mining and processingtechnology. Estimates of tonnage and grade are based on specific sample data and measurements of the deposits, and onknowledge of deposit characteristics. Reasonably Assured Resources have a high assurance of existence.
Id] Estimated additional resources, Category I, refer to uranium in addition to reasonably assured resources (RAR) that isexpected to occur, mostly on the basis of direct geological evidence, in extensions of well explored deposits and in depositsin which geological continuity has been established but where specific data and measurements of the deposits andknowledge of the deposits' characteristics are considered to be inadequate to classify the resources as RAR. Such depositscan be delineated and the uranium subsequently recovered, all within the given cost ranges. Estimates of tonnage andgrade are based on such sampling as is available and on knowledge of the deposit characteristics as determined in thebest known parts of the deposit or in similar deposits. Less reliance can be placed on the estimates in this category than onthose for RAR.
[el Data for Australia compiled by SRS as at December 1994.
If! The United States' estimated additional resources are not reported separately for EAR-I and EAR-H.
19] Austria, Central African Republic, Czech Republic, Denmark, Finland, Germany, Greece, Hungary, Indonesia, Italy, Japan,Republic of Korea, Mexico, Peru, Portugal, Slovenia, Somalia, Sweden, Thailand. Turkey, Vietnam, Zaire, Zimbabwe.
Ih] Totals have been adjusted by OECD/NEA and IAEA to account for milling and/or mining losses not incorporated in theestimates for Algeria, Brazil, Niger and certain countries grouped under 'Other countries'. Because of these adjustments,these totals do not represent the sum of the country assessments detailed above.
25BUREAU OF RESOURCE SCIENCES

26
Australia's Identified f\[ineral Resources
Australia's RAR in the low-cost category increased by 2000 t U, and EAR-I in this cost
category increased by 5000 t U.
Australia's RAR in the cost category of US$80-US$130 per kilogram U increased by
1000 t U during the year, whereas EAR-I in this cost category remained unchanged from
the previous year's estimates.
In addition to the RAR and EAR-I categories of resources shown in Table 3, BRS estimates
there is a 75% probability that Australia has undiscovered potential resources
(Undiscovered Resources) amounting to more than 2 600000 t U and a 50% probability
that the Undiscovered Resources may exceed 3 900 000 t U.
The uranium policy of the Australian Government has permitted the mining and export
of Australia's uranium from three mines - Nabarlek and Ranger in the Northern Territory
and Olympic Dam in South Australia. With the closure of Nabarlek in mid 1988, only
Ranger and Olympic Dam now mine and export uranium.
Australia's total production for 1993 was 2256 t U (2660 t U30
S)' 7% of world production.
Mining at the Ranger open cut (No.1 Orebody) was completed in December 1994. On
completion of open-cut operations, surface stockpiles of ore will be sufficient to maintain
production at projected levels through to the year 2000. Energy Resources of Australia
Limited has stated that it will need to develop a second orebody for initial production in
1998. The company has two undeveloped orebodies, Ranger No.3 and North Ranger
(Jabil uka) NO.2. Ra nger No.3 is adjacent to the existing Ranger mi II, and North Ranger
No.2 is 20 km to the north of Ranger on an adjoining lease. Development of North
Ranger No.2 requires a change in the Australian Government's uranium policy.
The Olympic Dam deposit is mined for copper, uranium, gold and silver. It is one of the
world's largest deposits of low-cost uranium. Western Mining Corporation reported that
annual production capacity at the Olympic Dam operation will be increased to 84000 t
of copper and 1500 t of U30
Sin 1995.
In 1993-94, the 3384 t of U (3990 t U30
S) exported in concentrates was valued at A$193
million. The average export price was A$45.74 per kilogram of U30
S(ABARE 1994).
Exports were significantly higher in 1993-94 due to shipments from the Commonwealth
uranium stockpile.
Australia applies stringent conditions to the export of uranium to ensure it is used only
for peaceful purposes. These conditions, referred to as nuclear safeguards, require
customer countries to allow inspectors from the International Atomic Energy Agency to
verify that the uranium is not directed into weapons programs. In addition, the countries
to which Australia exports uranium must comply with parallel safeguards agreements
under treaties between Australia and each of these countries. Compliance with these
bilateral safeguards agreements is monitored by the Australian Safeguards Office.

In August 1994, the Minister for Finance announced that contracts had been signed tosell the last remaining portions of the Commonwealth uranium stockpile. The total
stockpile was 2052 t of U30
S' The stockpile material was stored at Lucas Heights, New
South Wales, and at Ranger, Northern Territory. The Minister reported that the Lucas
Heights material had already been shipped, and it was expected that the remainder of
the material would have left Australia by the end of 1994.
References
ABARE (1994) Statistical tables. Australian Commodities 1(3): 381-415.
BMR (1976) BMR adopts new system of resource classification. Australian Mineral
Industry Quarterly 28(1): 11-13.
BMR (1983) BMR refines its mineral resource classification system. Australian Mineral
Industry Quarterly 36(3): 73-82.
27BUREAU OF RESOURCE SCIENCES

28
Australia's Identified lineral Resources
ExplorationExploration Expenditure
The following discussion and statistics are based on mineral exploration expenditure
for commodity groups monitored by ABS. The differentiation of commodity groups
before 1980 is based largely on a breakdown of ABS totals by BRS.
Exploration expenditure in 1993-94 totalled $792.6 million (ABS 1994). This was an
increase of 25% over the previous year. Figure 2 shows trends in actual expenditure
over the last four years. The most striking feature is the sharp rise in 1993-94 expenditure
on gold exploration which grew by 42% over the previous year to $453.8 million.
Diamond expenditure also rose sharply, up 54%, to $58.7 million
Western Australia's dominance of exploration expenditure continued in 1993-94, with
57% of total expenditure being spent in that State compared to 55% in 1992-93.
Queensland was ranked second, achieving 18% of total expenditure, followed by New
South Wales and the Northern Territory with 9.3% and 8.8% respectively.
Gold accounted for 57% of all exploration expenditure in 1993-94 (Figure 2). This
compares to a 4.6% share two decades earlier but is still well below the peak share of
72% achieved in 1987-88. At $191.6 million, expenditure on base metals exploration
(copper, lead, zinc, silver, nickel and cobalt) was the highest in current dollar terms
since 1981-82, and was 4.5% higher than in 1992-93. However, as a consequence of the
large increases in gold and diamond expenditure, the share of expenditure on base
metals rose only slightly from 24.0% in 1992-93 to 24.2% in the current year
In constant dollar terms (1993-94 dollars), the recovery in mineral exploration
commenced in 1992-93 and accelerated in 1993-94 (Figure 3). Despite this strong
recovery, expenditure remained below the peak years of 1970-71,1981-82 and
1987-88.
Exploration Drilling
In 1994, BRS commissioned ABS to undertake a survey of exploration and mining
companies to ascertain the amount and type of exploration drilling carried out in
1993-94. Data were also collected on exploration drilling expenditure. The data were
released by ABS in November 1994 and a preliminary analysis follows.
Of the $792.6 million expended on exploration in 1993-94, $283.6 million, or 36%, was
spent on drilling. A State-by-State breakdown of drilling expenditure is incorporated
into Table 4. Over 40% of exploration expenditure in Tasmania and Western Australia
was directed to drilling in 1993-94 (Figure 4), compared to just under 15% for South
Australia.

FIGURE 2 Annual exploration expenditure since1990-91
800 -r----------------------,
700
600
........~a>~ 500c:~§.~::>~
"0 400~~w
300
200
100
1990/91 1991/92 1992/93 1993/94
• Coal
DOther
DGoid
Year(Australian financial year ended 30 June)
Source: ABS
• Copper, Lead, Zinc, Silver, Nickel Cobalt
Diamond
Iron ore
D Tin, Tungsten, Mineral Sands, Uranium, Construction materials
FIGURE 3 Australian exploration expenditure since1969-70 expressed in 1993-94 dollars
D Gold
1200........ 1000
~c: 800~§. 600l!!.a'is 400c:Q>
~w 200
a1970 1975 1980 1985
• Others
1990 1994Year
(Australian financial year ended 30 June)Source: ABS (Current dollars deflated by Consumer Price Index 1993-94 =100 provided by ABARE)
29BUREAU OF RESOURCE SCIENCES

30
Australia's Identified f\lineral Resources
TABLE 4 Exploration expenditure and exploration drilling, 1993-94
Total expIondion Exploration drillingexpendituN
'000 metres(a) $ mill ionIa)
New South Wales 73.7 406.6 21.3Victoria 20.7 101.7 4.2Queensland 139.9 1015.3 40.8South Australia 24.7 124.0 3.6Western Australia 453.7 7764.8 192.1Tasmania 10.1 55.5 4.9Northern Territory 69.8 614.2 16.6
Australia 79Z.6 10082.2 283.6
(a) Statistics collected by Australian Bureau of Statistics for Bureau of Resource Sciences.Note: totals and sums of components may vary because of rounding.
TABLE 5 Methods of exploration drilling in Australia, by type of area, 1993-94
Production...... Otherareas
'000 metres(a) '000 $(a) Average $/m '000 metresla) '000 $Ia) Average $/m
Diamond 749.0 73041 97.52 561.7 58866 104.80Reverse circulation 1617.9 42454 26.24 1817.8 48888 26.89Percussion 141.4 4522 31.98 203.6 6823 33.51Rotary air blast 1214.4 10251 8.44 3208.0 29704 9.26Others 81.9 1130 13.80 486.5 7872 16.18
(a) Statistics collected by Australian Bureau of Statistics for Bureau of Resource Sciences.
Almost 10.1 million metres of exploration drilling was undertaken in 1993-94, of which
38% was in production areas (Table 5). Western Australia dominated with 77% of total
drilling (Figure 5). In terms of drilling expenditure, Western Australia was dominant,
with 60% of the total. This lower share of expenditure compared to actual drilling is
attributed, at least in part, to the lower proportion of diamond drilling in the Western
Australian total compared to other States.
Exploration drilling outside of production areas (62% of all exploration drilling) totalled
6.3 million metres at a cost of $152.2 million. Table 5 and Figure 6 summarise exploration
drilling statistics for 1993-94. In all categories, the average cost per metre drilled was
higher in non-production areas.
FIGURE 4 Proportion of exploration expenditurespent on drilling, by state, 1993-94
50-,--------------:=-----,
10
oNSW VIC Old SA WA
StlleTas "'
FIGURE 5 Exploration drilling, by State, 1993-94
8000
7000
6000~ 5000"E 4000~
3000
2000
1000
0NSW VIC Qld SA WA
StaleTas "'
FIGURE 6 Exploration drilling, by drilling methodand by area, 1993-94 (Re, reverse circulation; RAB,rotary air blast)
3500
3000
I'500
2000
§ 1500
1000
500
0
Drilling method
• P"'- 0 0Iher areas
Reference
ABS (1994) Actual and expected private mineral exploration, Australia, June Quarter 1994.
Catalogue No. 8412.0. Australian Bureau of Statistics, Canberra.
31BUREAU OF RESOURCE SCIENCES

32
ustralia's Identified t\lineral Resources
Offshore MineralExploration inCommonwealthWatersThe area of Australia's geomorphological continental shelf is of the order of 2 million
square kilometres, about one-quarter the size of its land mass of about 7.8 million square
kilometres.
The geomorphological continental shelf is part of Australia's Legal Continental Shelf(LCS) which is defined under Article 76 of the United Nations Law of the Sea Convention.
The area of the LCS around Australia and its island territories is about 11.9 million
square kilometres or about 14.8 million square kilometres if the Australian Antarctic
Territory is included (Symonds and Willcox 1989).
The Law of the Sea Convention took effect internationally on 16 November 1994, and
Australia has 10 years to define the outer boundaries of its LCS. Australia has sovereign
rights over its LCS for the purposes of exploring and exploiting the natural resources of
the seabed and subsoil.
The potential for minerals other than petro leu mover th is large offshore area is mostly
unknown. Widespread and detailed studies as well as ongoing exploration are needed
to build up a geoscientific database to develop knowledge of Australia's offshore mineral
resources. Available information comes from limited offshore exploration by private
companies and from some reconnaissance surveys undertaken by the former SMR,
State Geological Surveys and since 1992 by the Australian Geological Survey
Organisation(AGSO), the successor to SMR.
Deposits potentially economic in the short to medium term are likely to be in relatively
shallow waters of the continental shelf close to the coast. Commodities forming such
deposits include diamonds, gold, heavy mineral sands, tin and other placer deposits
and construction materials (sand and gravel). Offshore extensions of known onshore
mineralisation such as tungsten, coal, manganese and iron ore are known to occur in
some areas. Most of the offshore mineral exploration for diamonds and heavy mineralsands is based on known distribution of these minerals on adjacent onshore areas.
Other mineral commodities such as phosphates and polymetallic manganese nodules
•

(containing nickel, cobalt and copper) which occur in deep water are likely to be of
long-term interest only.
Australia's Offshore Minerals Act 1994 regulates the exploration for minerals and the
mining of minerals, other than petroleum, over the continental shelf three nautical miles
beyond the territorial baseline of the States and Territories. The Act came into force in
February 1994. Before then, the granting of licences was regulated by the Offshore
(Submerged Lands) Act 1981.
Applications for a mineral exploration licence (MEl) are made to the Designated
Authority (usually the relevant State or Territory Minister responsible for mining) with
an application fee of $3000. The application must be made in the approved manner and
must specify such details as:
• block numbers (each block being approximately 2 km by 2 km; and no more than
500 blocks can be applied for with each application);
• proposed exploration program;
• amount of money allocated to each part of the program;
• technical qualifications of applicant and employees; and
• financial resources.
FIGURE 7 Offshore mineral exploration in Commonwealth waters
NT
SA
.... North Fraser Island• Fraser Island• Alexandra Headlands• North Stradbroke Island• Stradbroke Island
• .... Tweed Heads
• Area under application for exploration licence
.... Application for exploration licence withdrawn
• Area with licences and applications
RingarO~~aY~Tas
~
33BUREAU OF RESOURCE SCIENCES

34
Australia's Identified I\lineral Resources
Each MEL usually has conditions attached to it related to specified expenditure, reporting,
and the steps to be taken to protect the environment. The initial term of the licence is
four years, and each renewal period is for a term of two years. There is a mandatory
reduction of licence areas on renewal of an MEL. However, it is possible for an
exploration licence holder to apply for a retention licence to retain rights over an area if
there is a reasonable prospect of developing a deposit.
Since February 1990,39 offshore MELs have been applied for in Commonwealth waters
(see Figure 7). As at 31 October 1994, seven had been granted, one had been refused,
four had been withdrawn, one had expired and 26 were pending.
Of the 39 applications, 24 (20 off Western Australia and 4 off the Northern Territory)
were in the Joseph Bonaparte Gulf in northwest Australia. This exploration is directed
at the search for alluvial diamonds in offshore palaeochannels. In other areas, MEL
applications have been made to explore for gold, diamonds, mineral sands, tin, and
sand and gravel.
Reference
Symonds, P.A. and Willcox, J.B. (1989) Australia's petroleum potential in areas beyond
an Exclusive Economic Zone. BMR Journal of Australian Geology and Geophysics 11:
11-36.

Mineral ResourcesBranch
Director
Ian Lambert
Personal Assistant - Suzy Obsivac
Identified Resources and Mineral Databases
Bill McKay (Manager)Bauxite
Mike HuleattGold, iron are, tantalum, niobium, lithium, oil shale
Lloyd DavidCopper, lead, zinc, silver, antimony, arsenic, bismuth, cadmium,selenium, tellurium, gem and semi-precious stones, cobalt
Roy TownerTitanium, zirconium, rare earths, clays, magnesite, talc.dolomite, peat, limestone, gypsum, silica, chemicalindustry minerals and specialty minerals. molybdenum
Brian ElliottMineral databases
Keith PorrittMineral databases. GIS support
Stuart GirvanTin, platinum-group metals, tungsten, chromium, mineral databases
Appraisal of Mineral Resource Potential
Yanis Miezitis (Manager)Potential mineral resources
Don PerkinExploration analysis, manganese
Aden McKayUranium, nickel, vanadium, potential mineral resources
Ron SaitCoal, off-shore mineral exploration
Facsimile No: (061272 4161Postal Address:PO Box E11 Queen Victoria TerracePARKES ACT 2600
272 3042
272 4391
272 4020
272 3245
272 4127
272 4369
272 4433
272 3044
272 3243
272 5939
2725815
272 3045
272 5875
35BUREAU OF RESOURCE SCIENCES