Embed Size (px)
Citation preview
Austraust aInfInf
RoBureauNationa
Women in IAlbury, NSW
alian Climate a a C atefluencesfluences
obyn Duellyu of Meteorology
C Cal Climate Centre
Irrigated Agriculture, W, 21-22 October 2009
Outline• What drives the clim
• What trends have wthe Murray-Darling B
• How does this curred h ?droughts?
• Is the current drougclimate change?
mate in Australia?
we observed in the climate of Basin recently and over time?
ent drought compare to other
ght natural climate variability or
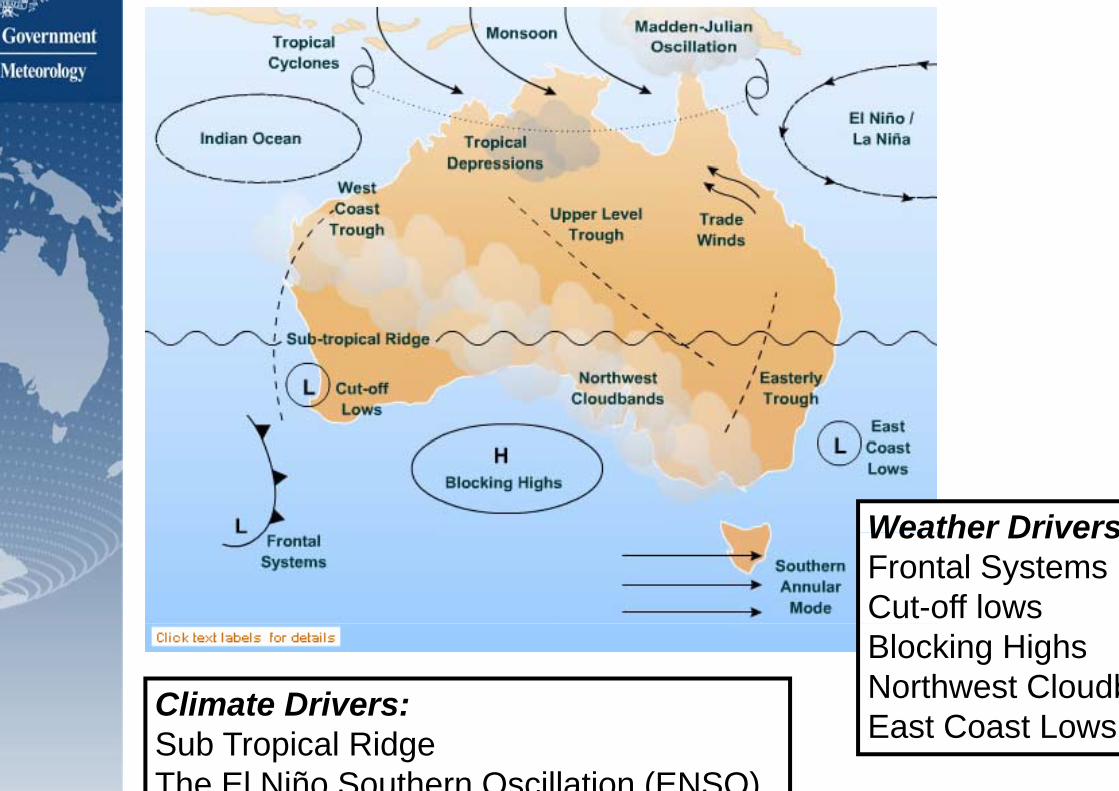
Climate Drivers:Climate Drivers:Sub Tropical Ridge The El Niño Southern Oscill
Weather DriversWeather DriversFrontal SystemsCut-off lowsBlocking HighsNorthwest CloudbE t C t L
lation (ENSO)
East Coast Lows
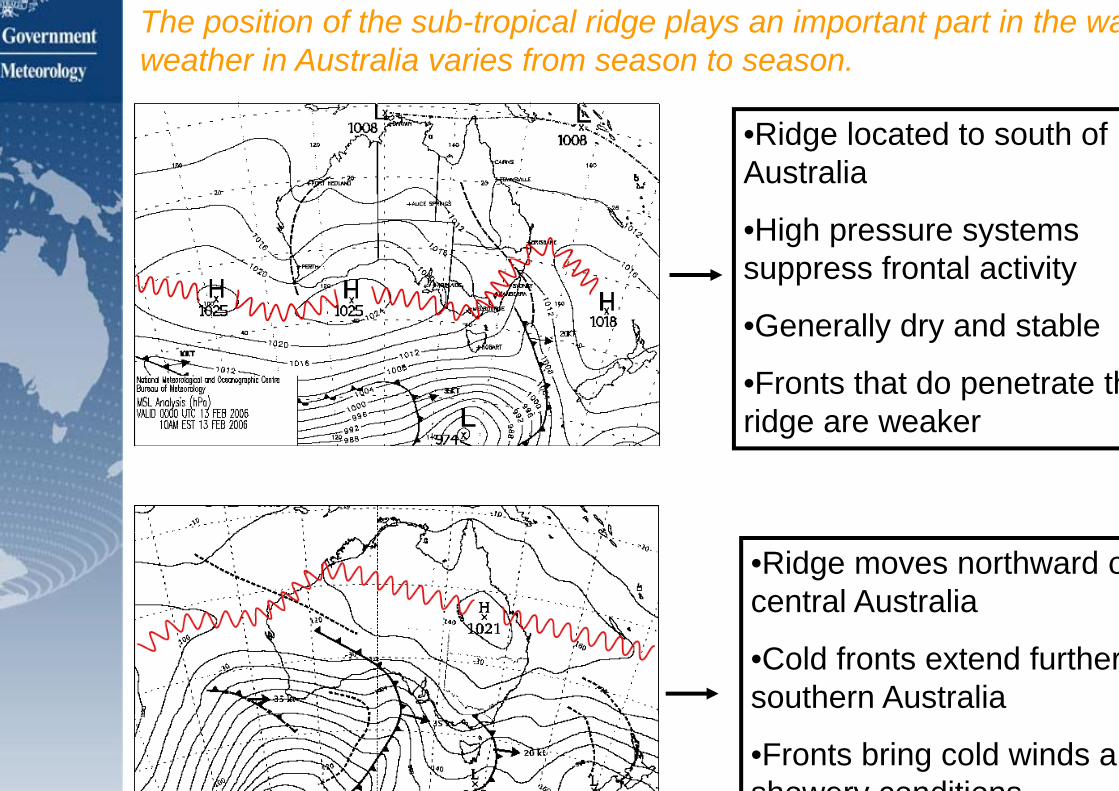
The position of the sub-tropicaweather in Australia varies fro
al ridge plays an important part in the wam season to season.
•Ridge located to south of AustraliaAustralia
•High pressure systems f t l ti itsuppress frontal activity
•Generally dry and stable
•Fronts that do penetrate thridge are weaker
•Ridge moves northward ocentral Australia
•Cold fronts extend furthersouthern Australia
•Fronts bring cold winds anshowery conditions
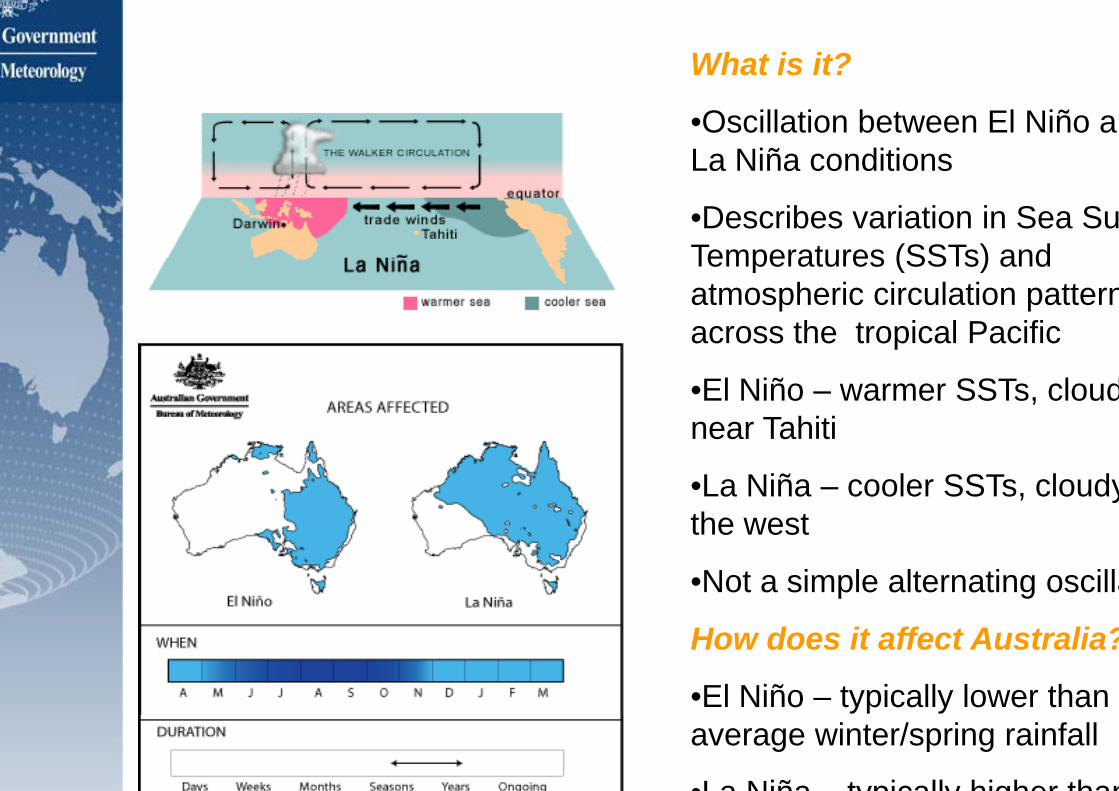
What is it?
•Oscillation between El Niño anLa Niña conditionsLa Niña conditions
•Describes variation in Sea SuTemperatures (SSTs) andTemperatures (SSTs) and atmospheric circulation patternacross the tropical Pacific
•El Niño – warmer SSTs, cloudnear Tahiti
•La Niña – cooler SSTs, cloudythe westthe west
•Not a simple alternating oscilla
How does it affect Australia?
•El Niño – typically lower than average winter/spring rainfall
•La Niña typically higher than
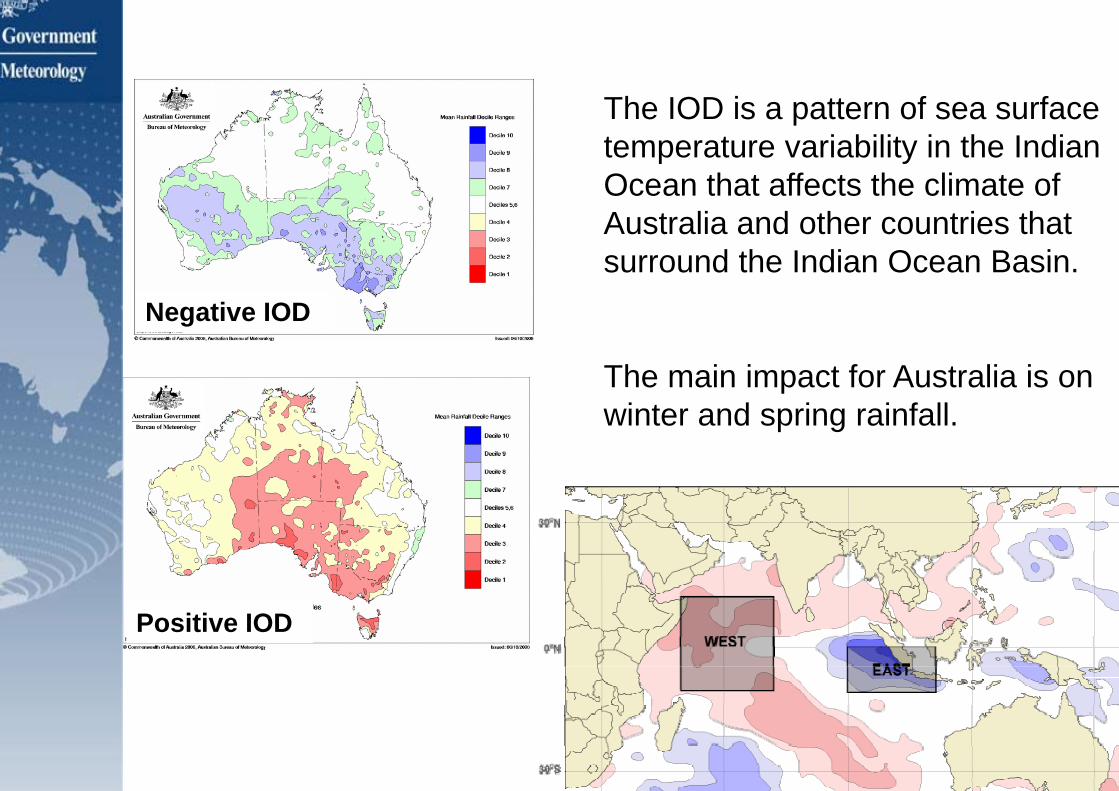
Negative IOD
Positive IODPositive IOD
The IOD is a pattern of sea surface temperature variability in the Indian Ocean that affects the climate of Australia and other countries that surround the Indian Ocean Basinsurround the Indian Ocean Basin.
The main impact for Australia is on winter and spring rainfall.
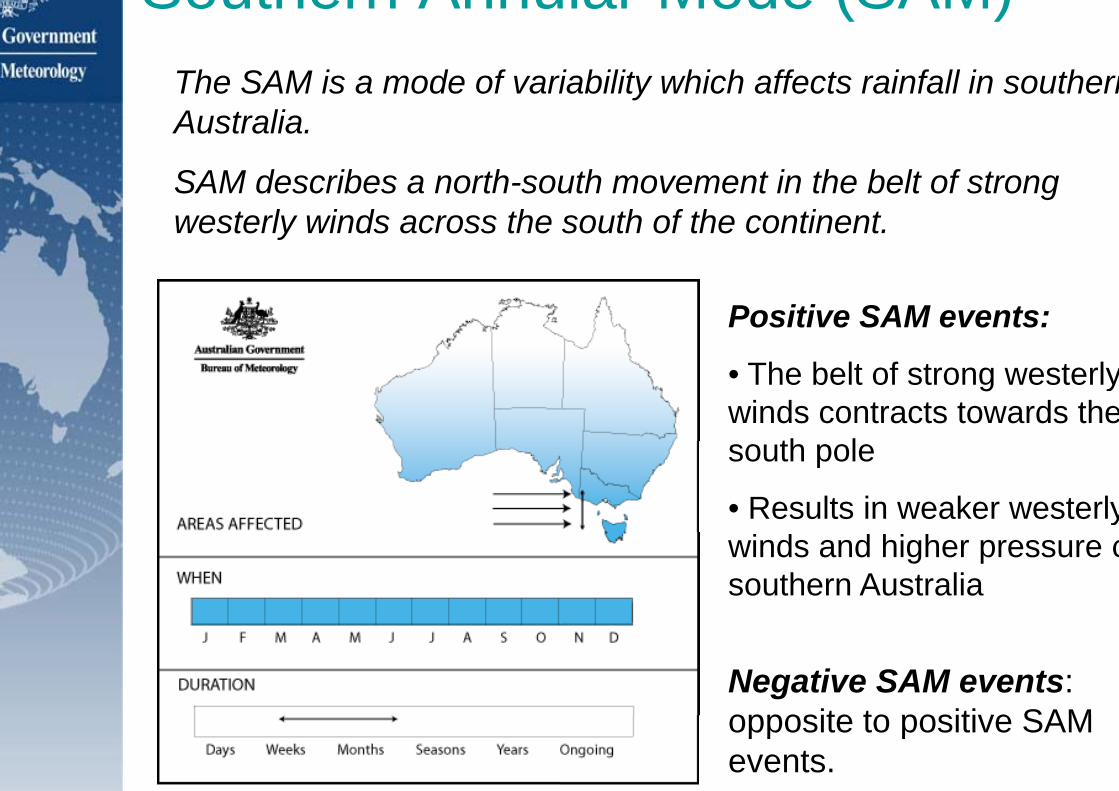
Southern AnnuTh SAM i d f iThe SAM is a mode of variAustralia.
SAM describes a north-souwesterly winds across the
ular Mode (SAM)i bilit hi h ff t i f ll i thriability which affects rainfall in southern
uth movement in the belt of strong south of the continent.
Positive SAM events:
• The belt of strong westerlywinds contracts towards the
th lsouth pole
• Results in weaker westerlywinds and higher pressure osouthern Australia
Negative SAM events: opposite to positive SAMopposite to positive SAM events.
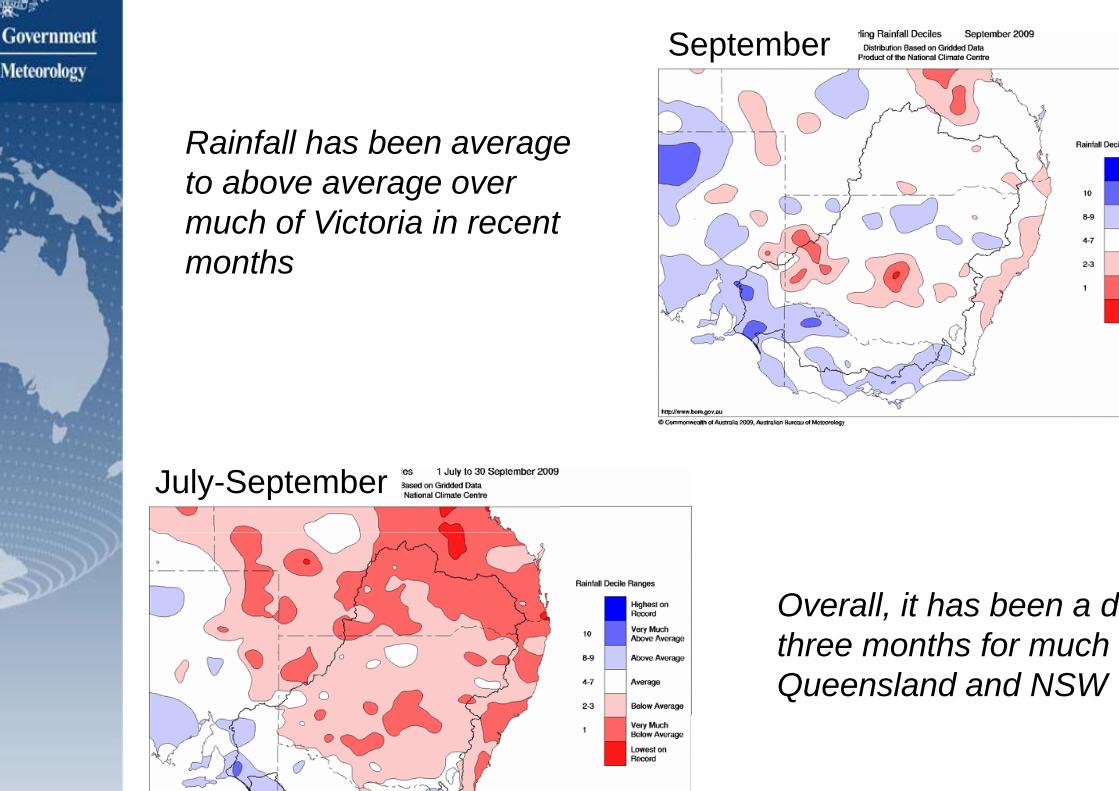
Rainfall has been averageto above average over much of Victoria in recent monthsmonths
July-September
September
e
t
Overall, it has been a dthree months for much Queensland and NSW
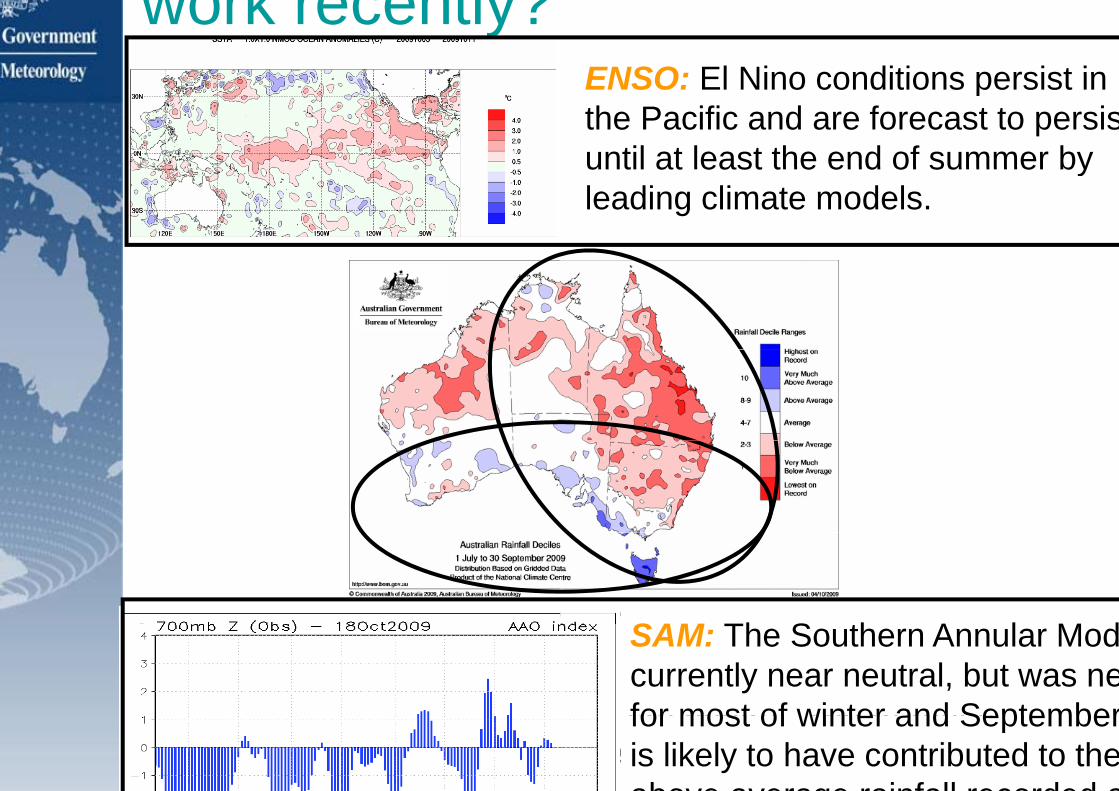
work recently?
I
c
ENSO: El Nino conditions persist inENSO: El Nino conditions persist in the Pacific and are forecast to persisuntil at least the end of summer byuntil at least the end of summer by leading climate models.
SAM Th S th A l M dIOD: The most recent values of the IOD are neutral The Bureaus
SAM: The Southern Annular Modcurrently near neutral, but was nefor most of winter and SeptemberIOD are neutral. The Bureaus
POAMA model suggests neutral IOD conditions ill persist o er the coming
for most of winter and Septemberis likely to have contributed to theabove average rainfall recorded a
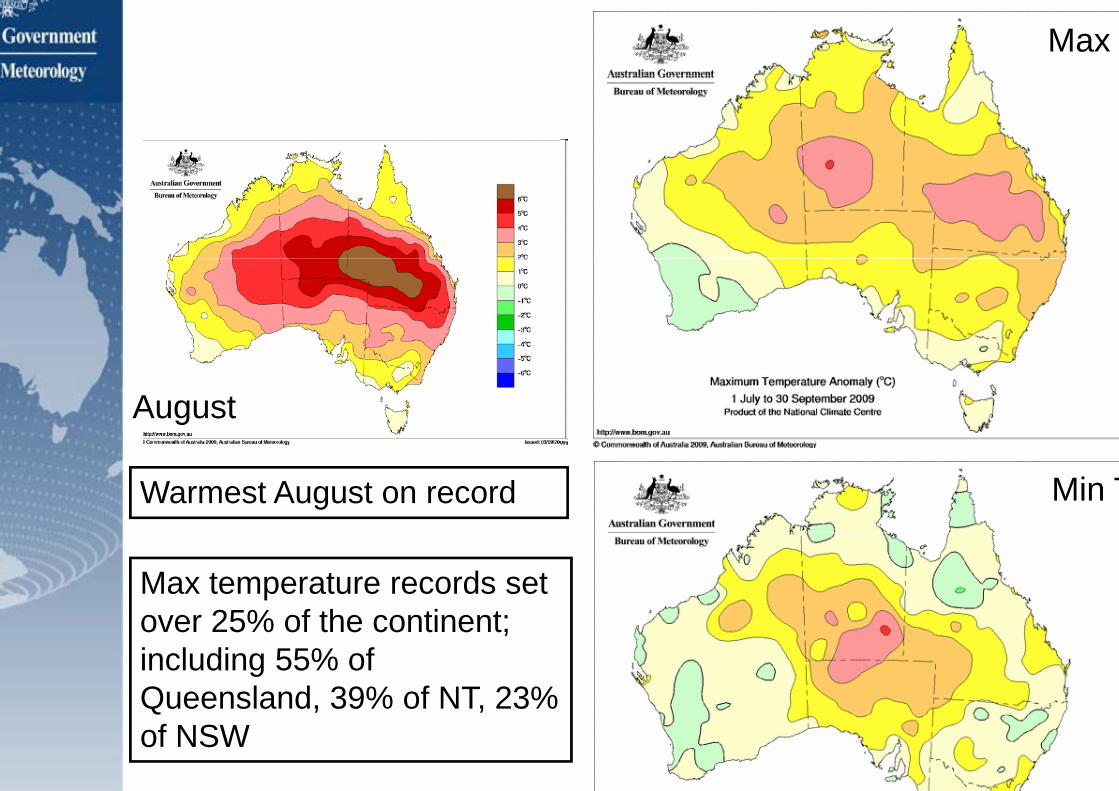
August
Warmest August on record
Max temperature records set over 25% of the continent;over 25% of the continent; including 55% of Queensland, 39% of NT, 23% of NSW
Max
Min T
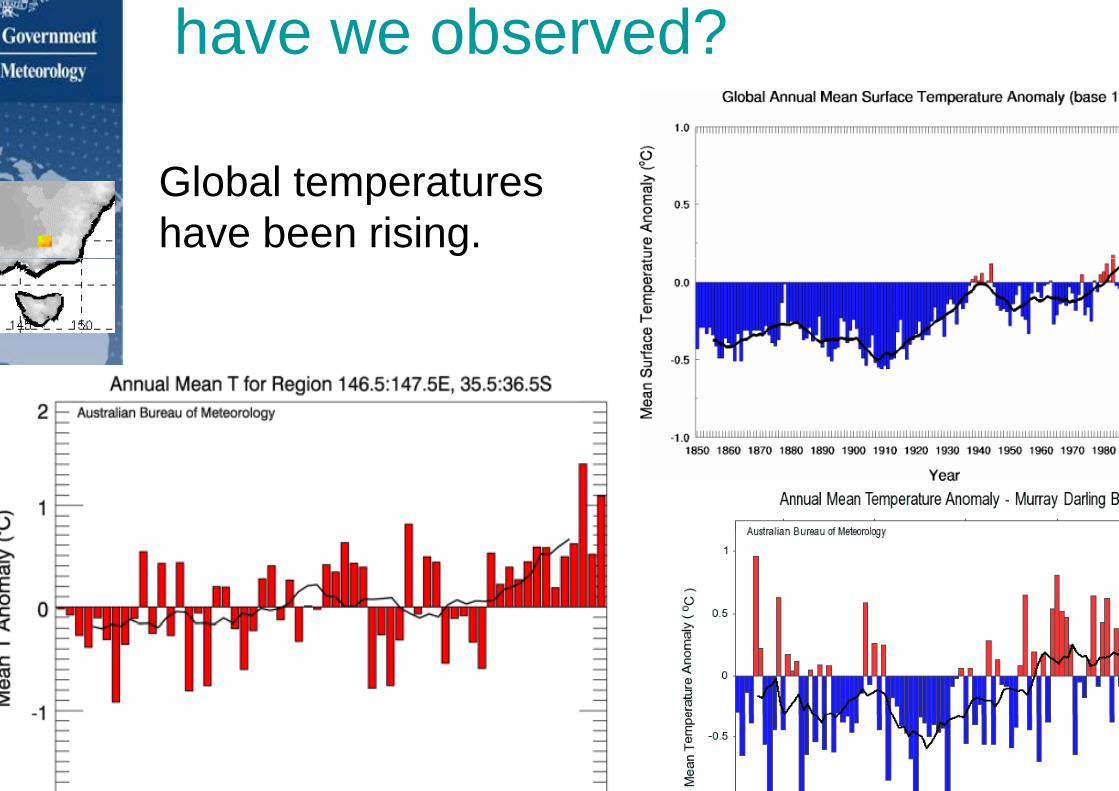
have we obse
Gl b l t tGlobal temperatures have been rising.
Mean temperatures inAustralia haveAustralia have increased by approximately 0 9ºCapproximately 0.9ºC since 1910.
Most of the warming has occurred since
erved?
n
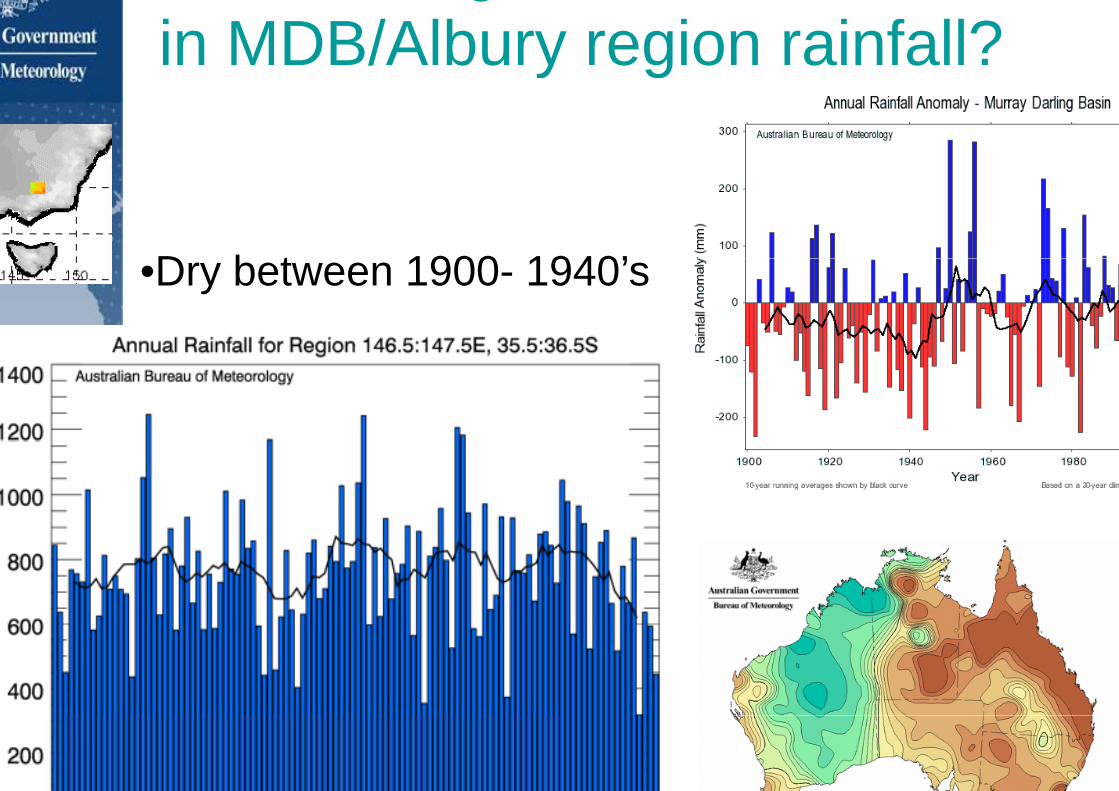
gin MDB/Alburyy
D b t 1900 19•Dry between 1900- 19
•Some wet periods betp1950-2000 (particularly 1950’s & 1(particularly 1950 s & 1
•Dry since 2001
y region rainfall?y g
940’940’s
tween
1970’s)1970 s)
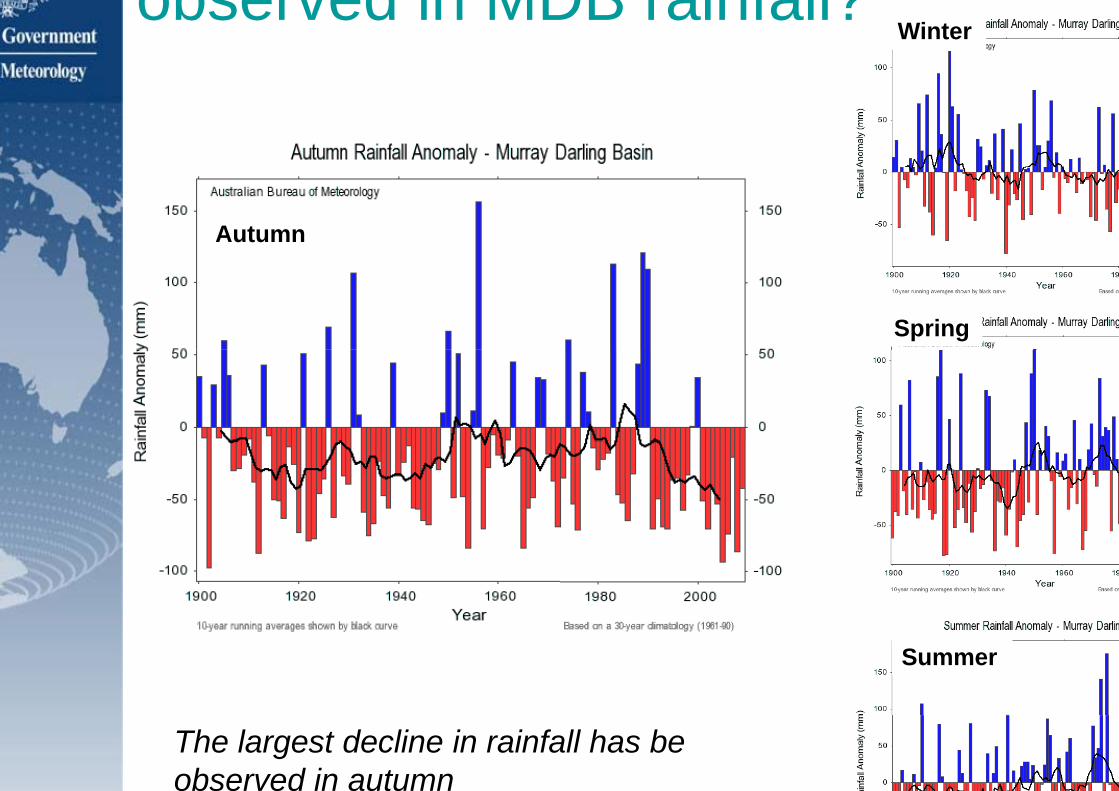
observed in MD
Autumn
The largest decline in rainfaobserved in autumn
DB rainfall?Winter
Spring
Summer
all has be
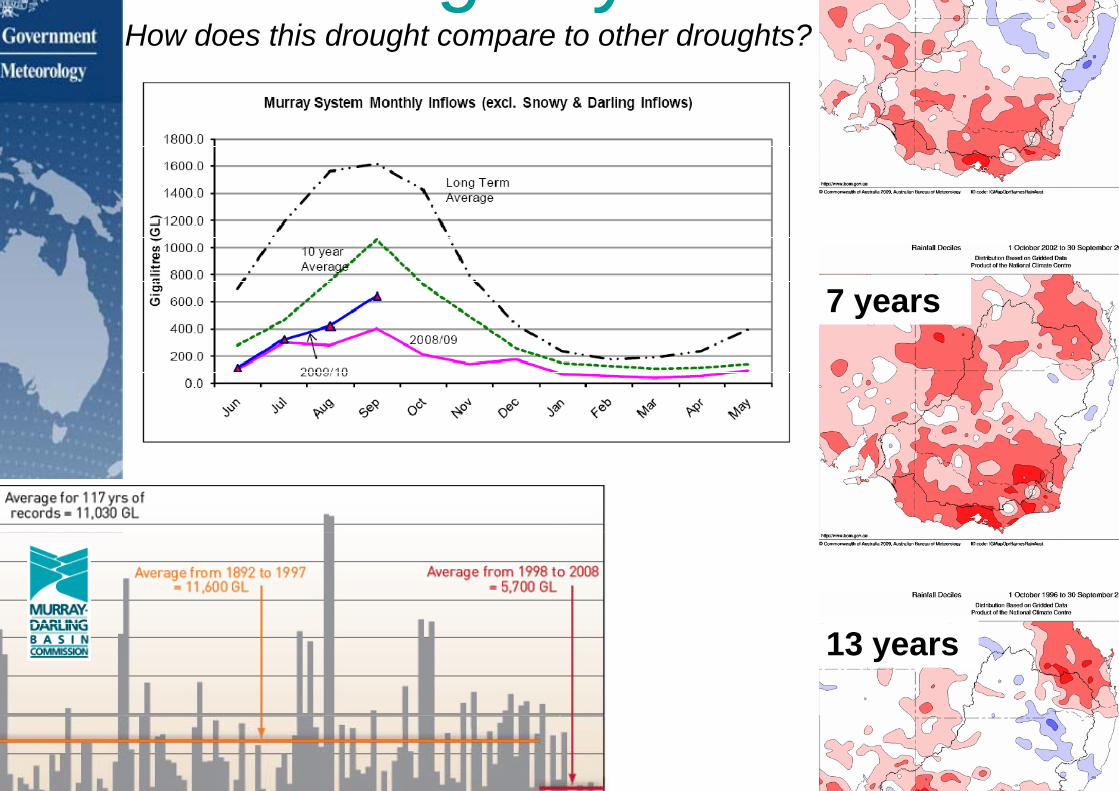
gHow does this drought compare
yto other droughts?
7 years
13 years
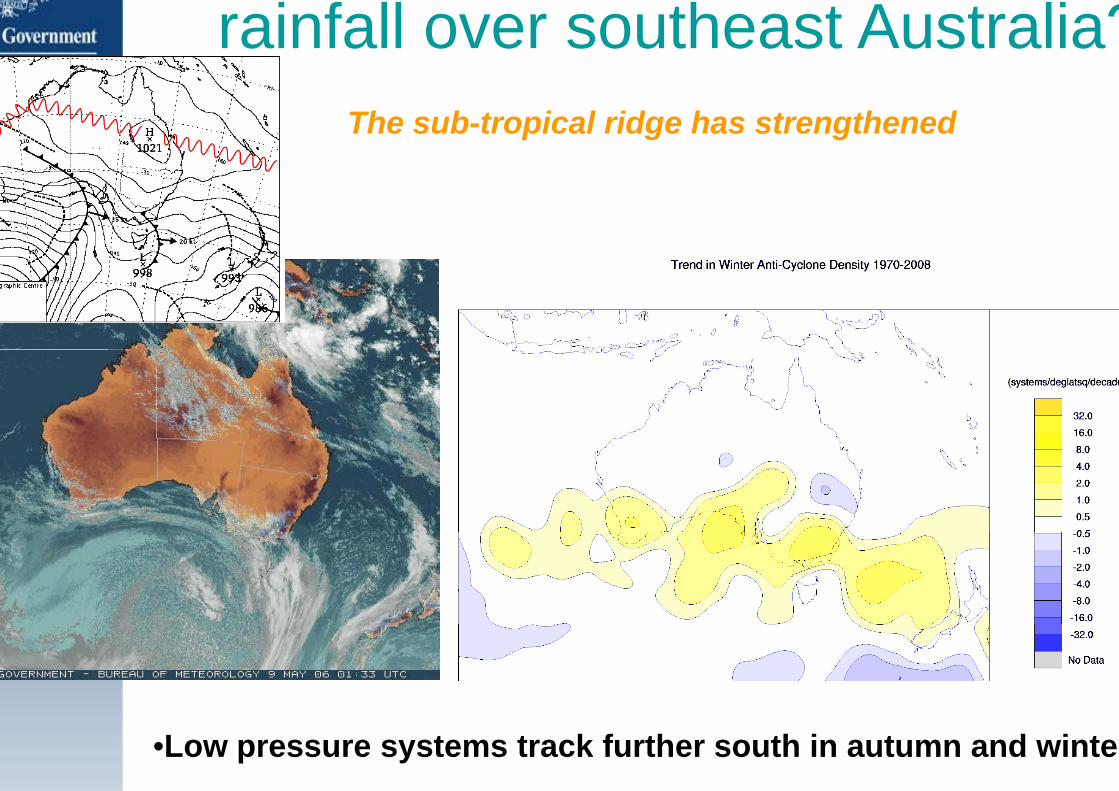
rainfall over The sub-tropic
•Low pressure systems trac
southeast Australia?cal ridge has strengthened
ck further south in autumn and winte
Summary
• There are many influencBasin, including:g– the El Niño Souther– the Indian Ocean Di– The sub-tropical ridg– Southern Annular M
• Rainfall has significantly– since 1996 in Victor– since 2001 in NSW
• It is not yet clear whetheygreenhouse warming or
• Even if the rainfall declinhas certainly been exacgreenhouse warming.Th i fi i id• There is firming evidencsouth eastern Australia i
ces on the climate of the Murray-Darling
n Oscillation (ENSO) and ipole.pge
Modey declined (10 to 20%) ria and southern NSW
er this is wholly or partially a result of y p yr natural decadal variabilityne is not greenhouse related the droughterbated by higher temperatures due to
th t th d li i t i f llce that the decline in wet season rainfall is at least partially greenhouse related