Embed Size (px)
Citation preview
Authorised and regulated by theFinancial Services Authority
Baring AssetManagement Limited155 Bishopsgate, London EC2M 3XY
Tel +44 (0)20 7628 6000Fax +44 (0)20 7638 7928
www.barings.com
June 2009
The Greater China Fund, Inc. and The Asia Pacific Fund, Inc.
Market Outlook and Investment Strategy
2
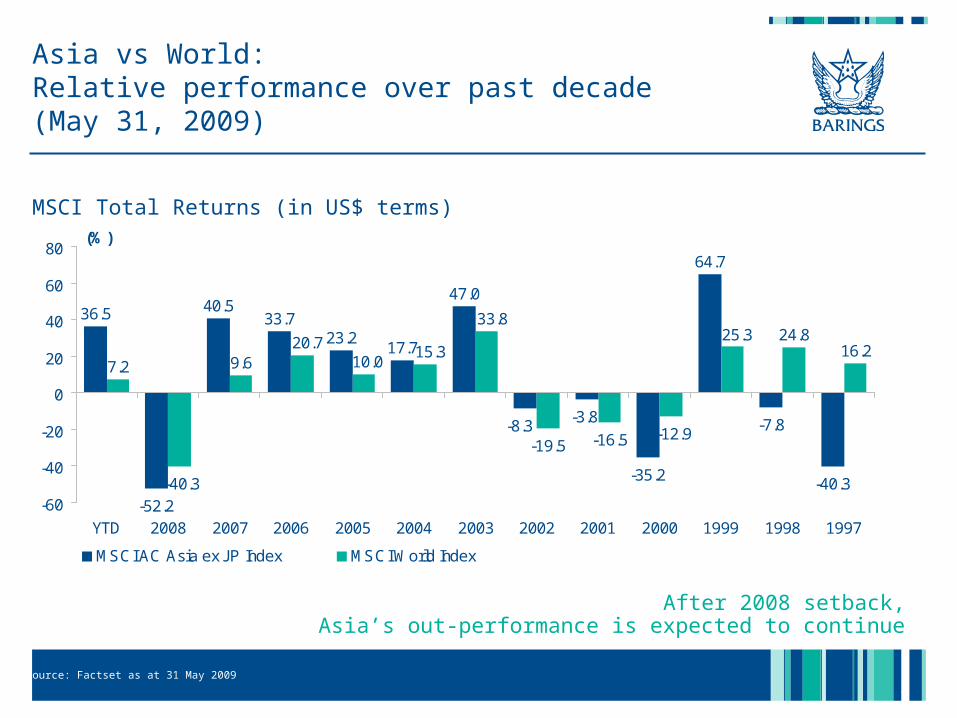
Asia vs World:Relative performance over past decade (May 31, 2009)
After 2008 setback, Asia’s out-performance is expected to continue
Source: Factset as at 31 May 2009
MSCI Total Returns (in US$ terms)
36.5
-52.2
40.533.7
23.217.7
47.0
-35.2
64.7
-7.8
-40.3
7.2 9.6
-19.5 -16.5
24.816.2
-3.8-8.3
25.3
-12.9
33.8
15.3
-40.3
10.020.7
-60
-40
-20
0
20
40
60
80
YTD 2008 2007 2006 2005 2004 2003 2002 2001 2000 1999 1998 1997
(%)
MSCI AC Asia ex JP Index MSCI World Index
3
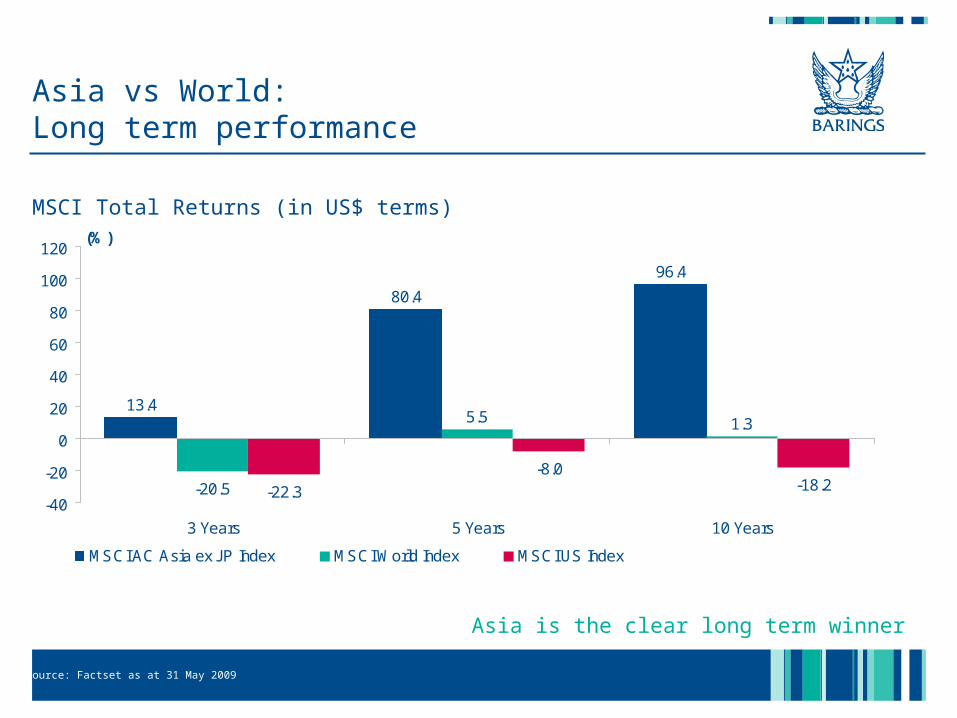
Asia vs World:Long term performance
Asia is the clear long term winner
Source: Factset as at 31 May 2009
MSCI Total Returns (in US$ terms)
13.4
80.4
96.4
-20.5
5.5 1.3
-22.3
-8.0-18.2
-40
-20
0
20
40
60
80
100
120
3 Years 5 Years 10 Years
(%)
MSCI AC Asia ex JP Index MSCI World Index MSCI US Index
4
Driver of global growth
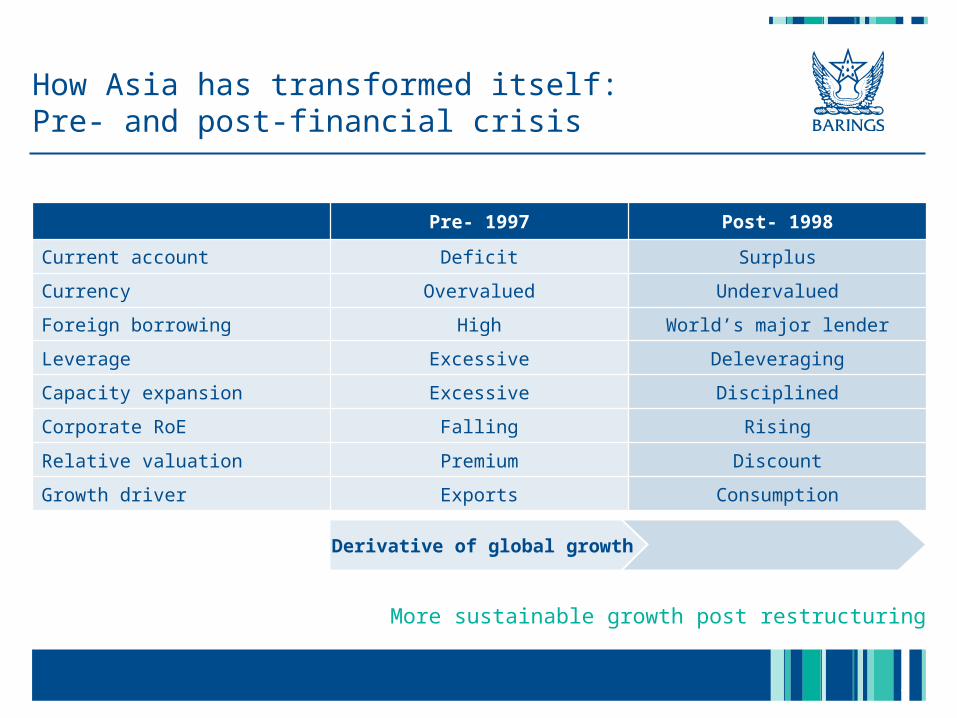
How Asia has transformed itself:Pre- and post-financial crisis
Pre- 1997 Post- 1998
Current account Deficit Surplus
Currency Overvalued Undervalued
Foreign borrowing High World’s major lender
Leverage Excessive Deleveraging
Capacity expansion Excessive Disciplined
Corporate RoE Falling Rising
Relative valuation Premium Discount
Growth driver Exports Consumption
Derivative of global growth
More sustainable growth post restructuring
5
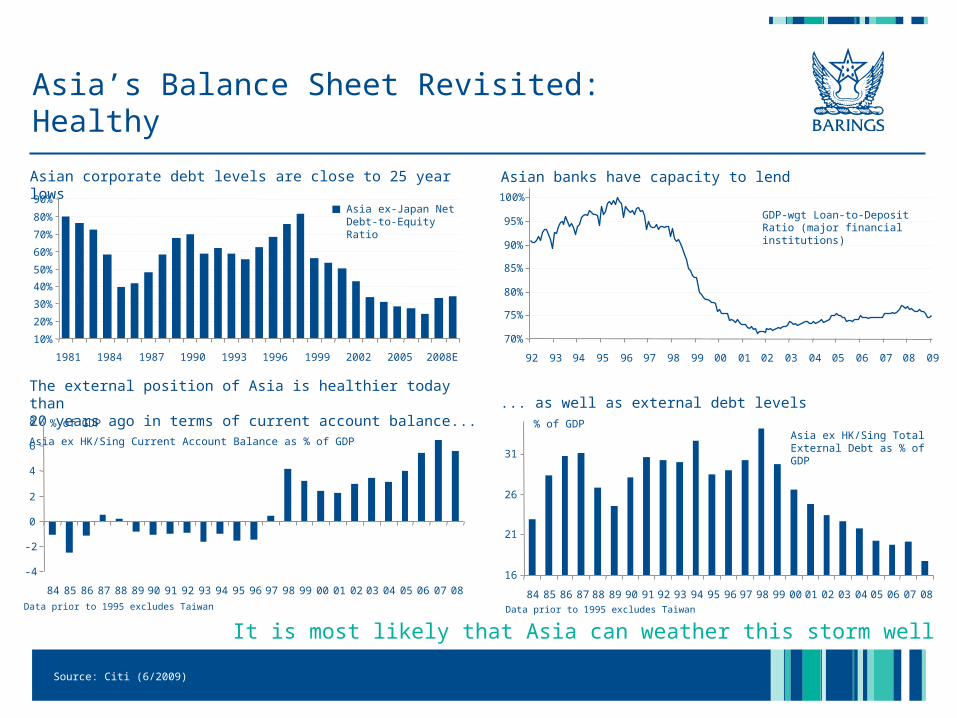
Asia’s Balance Sheet Revisited:Healthy
Asian banks have capacity to lendAsian corporate debt levels are close to 25 year lows
... as well as external debt levelsThe external position of Asia is healthier today than 20 years ago in terms of current account balance...
10%
20%
30%
40%
50%
60%
70%
80%
90%
1981 1984 1987 1990 1993 1996 1999 2002 2005 2008E
Asia ex-Japan Net Debt-to-Equity Ratio
70%
75%
80%
85%
90%
95%
100%
92 93 94 95 96 97 98 99 00 01 02 03 04 05 06 07 08 09
GDP-wgt Loan-to-Deposit Ratio (major financial institutions)
-4
-2
0
2
4
6
8
84 85 86 87 88 89 90 91 92 93 94 95 96 97 98 99 00 01 02 03 04 05 06 07 08
Asia ex HK/Sing Current Account Balance as % of GDP
16
21
26
31
84 85 86 87 88 89 90 91 92 93 94 95 96 97 98 99 00 01 02 03 04 05 06 07 08
Asia ex HK/Sing Total External Debt as % of GDP
Source: Citi (6/2009)
Data prior to 1995 excludes Taiwan Data prior to 1995 excludes Taiwan
It is most likely that Asia can weather this storm well
% of GDP % of GDP
6
0.5
1.5
2.5
3.5
4.5
5.5
Dec 96 Jan 99 Feb 01 Mar 03 Apr 05 May 07 Jun 09
-10
0
10
20
30
40
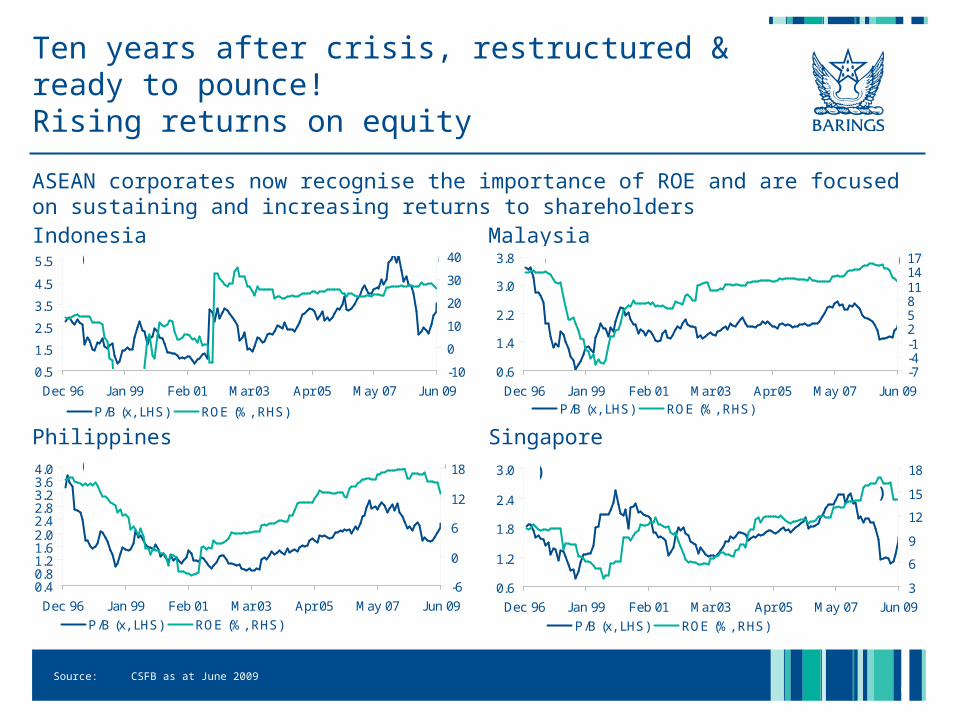
P/B (x, LHS) ROE (%, RHS)
(x) (%)Indonesia
Philippines
Malaysia
Singapore
Ten years after crisis, restructured & ready to pounce!Rising returns on equity
ASEAN corporates now recognise the importance of ROE and are focused on sustaining and increasing returns to shareholders
Source: CSFB as at June 2009
0.6
1.4
2.2
3.0
3.8
Dec 96 Jan 99 Feb 01 Mar 03 Apr 05 May 07 Jun 09
-7 -4 -1 258111417
P/B (x, LHS) ROE (%, RHS)
(x) (%)
0.40.81.21.62.02.42.83.23.64.0
Dec 96 Jan 99 Feb 01 Mar 03 Apr 05 May 07 Jun 09
-6
0
6
12
18
P/B (x, LHS) ROE (%, RHS)
(x) (%)
0.6
1.2
1.8
2.4
3.0
Dec 96 Jan 99 Feb 01 Mar 03 Apr 05 May 07 Jun 09
3
6
9
12
15
18
P/B (x, LHS) ROE (%, RHS)
(x) (%)
7
0
2
4
6
8
10
12
14
16
19
80
19
81
19
82
19
83
19
84
19
85
19
86
19
87
19
88
19
89
19
90
19
91
19
92
19
93
19
94
19
95
19
96
19
97
19
98
19
99
20
00
20
01
20
02
20
03
20
04
20
05
20
06
20
07
20
08
20
09
20
10
%
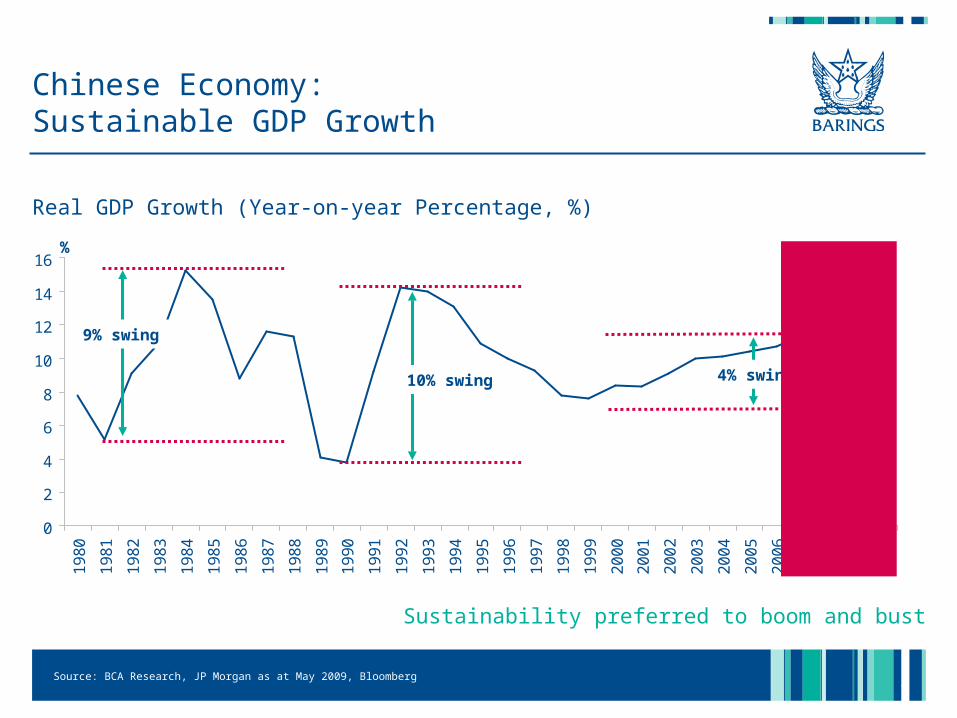
Chinese Economy:Sustainable GDP Growth
Real GDP Growth (Year-on-year Percentage, %)
Source: BCA Research, JP Morgan as at May 2009, Bloomberg
Sustainability preferred to boom and bust
CREDIT TIGHENING
9% swing
10% swing 4% swing
8
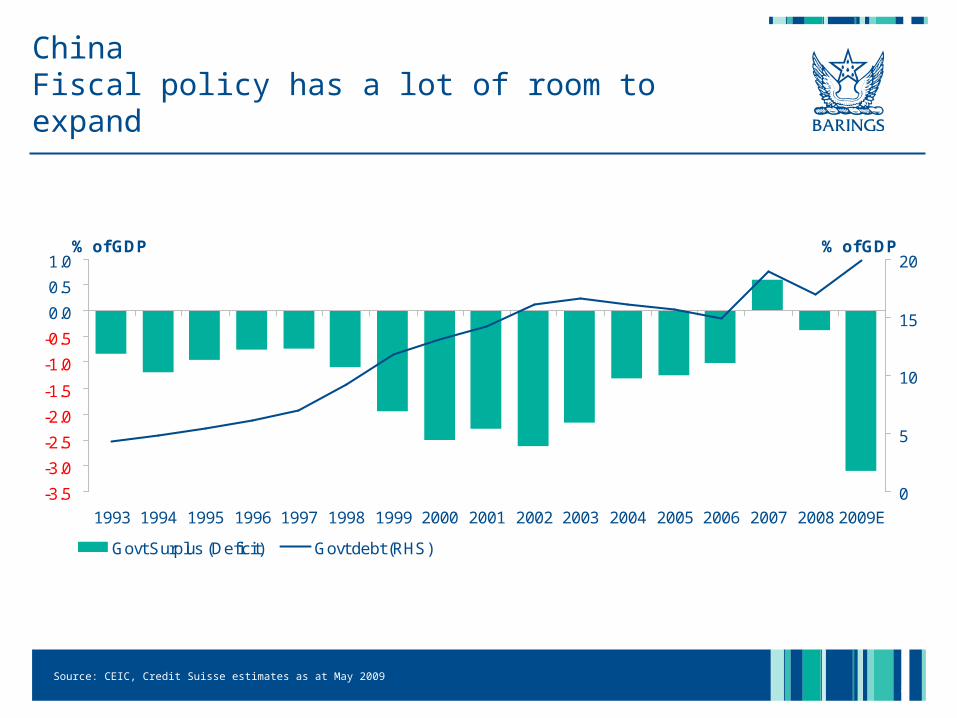
ChinaFiscal policy has a lot of room to expand
Source: CEIC, Credit Suisse estimates as at May 2009
-3.5
-3.0
-2.5
-2.0
-1.5
-1.0
-0.5
0.0
0.5
1.0
1993 1994 1995 1996 1997 1998 1999 2000 2001 2002 2003 2004 2005 2006 2007 2008 2009E
% of GDP
0
5
10
15
20% of GDP
Govt Surplus (Deficit) Govt debt (RHS)
9
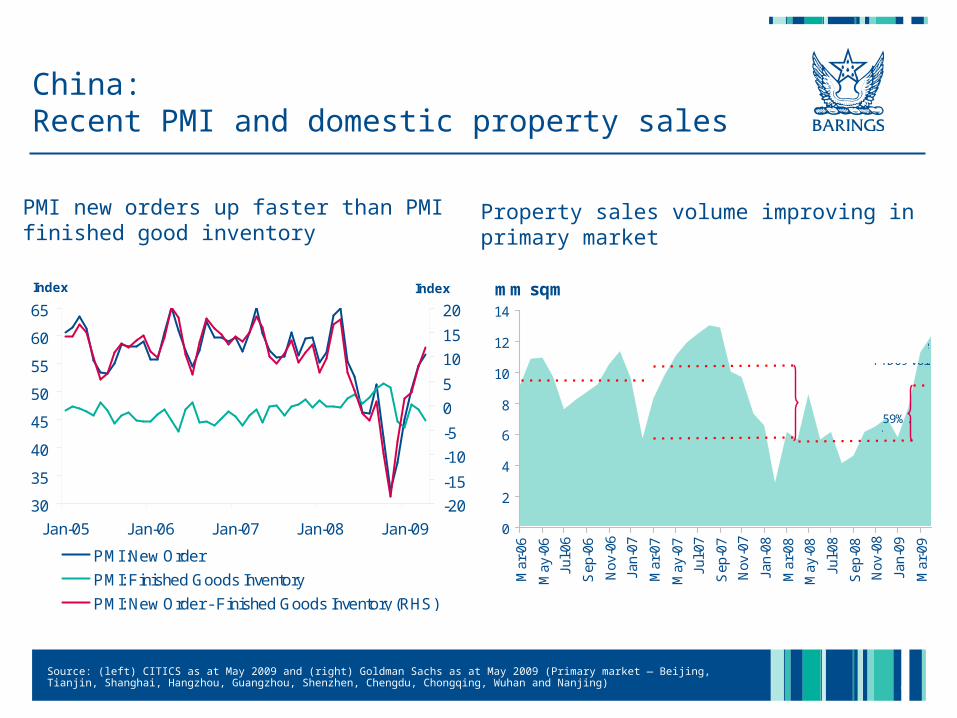
China: Recent PMI and domestic property sales
Source: (left) CITICS as at May 2009 and (right) Goldman Sachs as at May 2009 (Primary market — Beijing, Tianjin, Shanghai, Hangzhou, Guangzhou, Shenzhen, Chengdu, Chongqing, Wuhan and Nanjing)
PMI new orders up faster than PMI finished good inventory
30
35
40
45
50
55
60
65
Jan-05 Jan-06 Jan-07 Jan-08 Jan-09
Index
-20
-15
-10
-5
0
5
10
15
20
Index
PMI :New Order
PMI: Finished Goods Inventory
PMI: New Order - Finished Goods Inventory (RHS)
Property sales volume improving in primary market
0
2
4
6
8
10
12
14
Mar
-06
May
-06
Jul-0
6
Sep
-06
Nov
-06
Jan-
07
Mar
-07
May
-07
Jul-0
7
Sep
-07
Nov
-07
Jan-
08
Mar
-08
May
-08
Jul-0
8
Sep
-08
Nov
-08
Jan-
09
Mar
-09
mm sqm
Average Mar 06-Dec06 transaction vol. Average 07 transaction vol.
42%Average 08 transaction vol.
Average YTD09 vol.
59%59%.
10
40
50
60
70
80
90
100
110
120
Fe
b-0
8
Ap
r-0
8
Jun
-08
Au
g-0
8
Oct
-08
De
c-0
8
Fe
b-0
9
Ap
r-0
9
2009 2010
50
60
70
80
90
100
110
120
Fe
b-0
8
Ap
r-0
8
Jun
-08
Au
g-0
8
Oct
-08
De
c-0
8
Fe
b-0
9
Ap
r-0
9
2009 2010
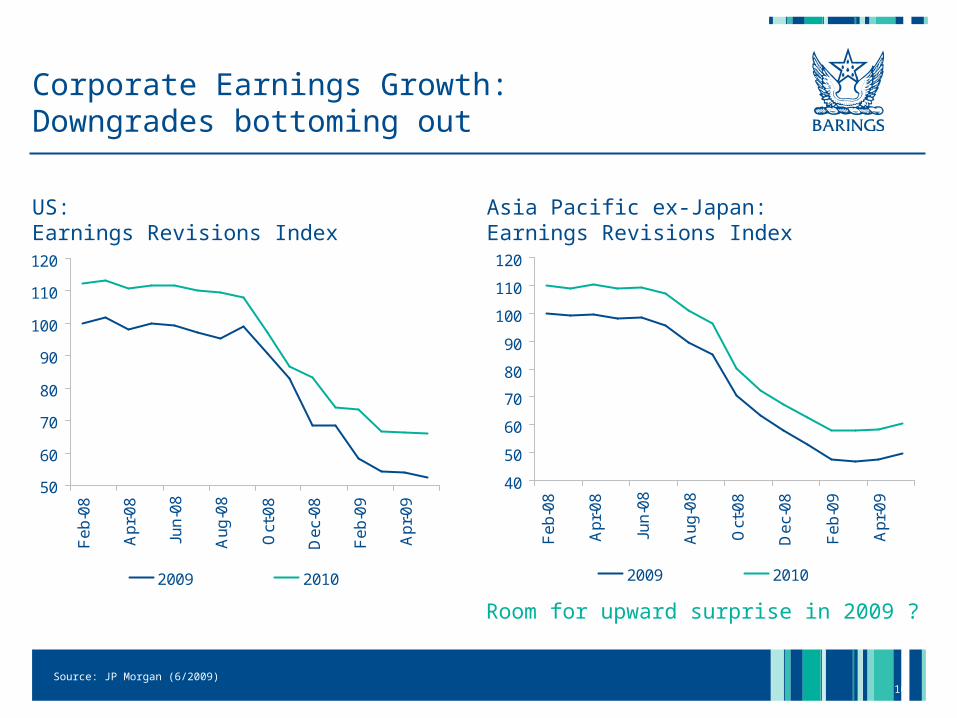
Corporate Earnings Growth:Downgrades bottoming out
Source: JP Morgan (6/2009)
Room for upward surprise in 2009 ?
US: Earnings Revisions Index
Asia Pacific ex-Japan: Earnings Revisions Index
11
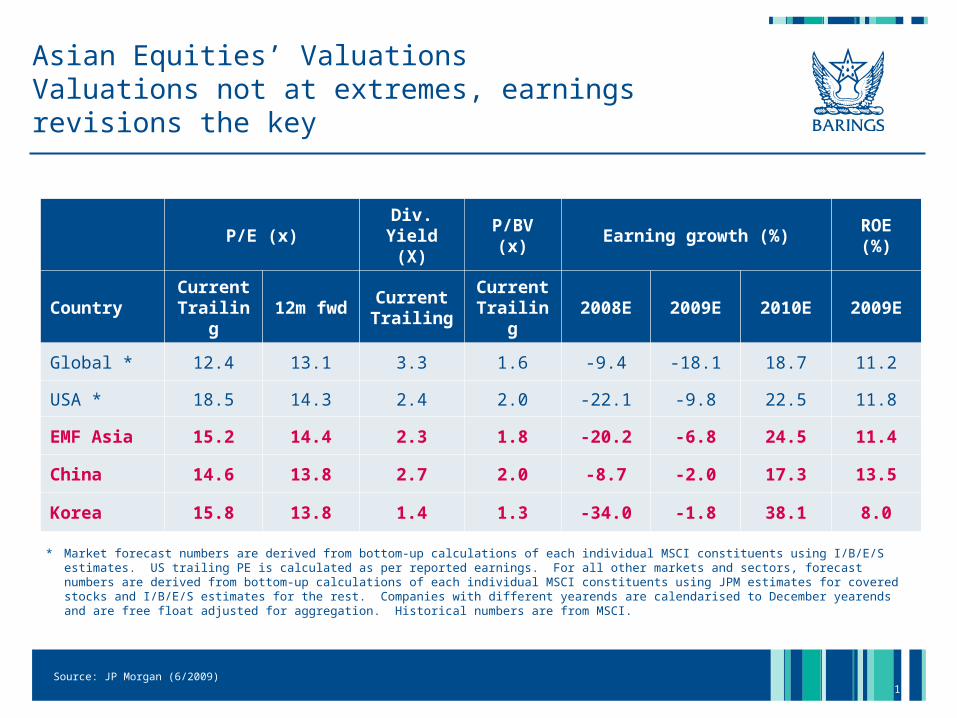
Asian Equities’ ValuationsValuations not at extremes, earnings revisions the key
Source: JP Morgan (6/2009)
P/E (x)Div. Yield
(X)P/BV (x) Earning growth (%) ROE (%)
CountryCurrent Trailing
12m fwdCurrent Trailing
Current Trailing
2008E 2009E 2010E 2009E
Global * 12.4 13.1 3.3 1.6 -9.4 -18.1 18.7 11.2
USA * 18.5 14.3 2.4 2.0 -22.1 -9.8 22.5 11.8
EMF Asia 15.2 14.4 2.3 1.8 -20.2 -6.8 24.5 11.4
China 14.6 13.8 2.7 2.0 -8.7 -2.0 17.3 13.5
Korea 15.8 13.8 1.4 1.3 -34.0 -1.8 38.1 8.0
* Market forecast numbers are derived from bottom-up calculations of each individual MSCI constituents using I/B/E/S estimates. US trailing PE is calculated as per reported earnings. For all other markets and sectors, forecast numbers are derived from bottom-up calculations of each individual MSCI constituents using JPM estimates for covered stocks and I/B/E/S estimates for the rest. Companies with different yearends are calendarised to December yearends and are free float adjusted for aggregation. Historical numbers are from MSCI.
12
Asia and ChinaStrategy and Outlook
Massive monetary injection stabilises liquidity environment and asset prices
Little evidence of sharp broad based recovery yet selected regions and industry segments stand a good chance to see growth re-accelerating
Asian economies and consumers are underleveraged with China continuing to drive growth and reflation in the whole Asian region
Markets will re-focus on secular and above market earnings growth following the strong share price rebound from distressed valuations
Our high alpha approach seeks to capture the best opportunities in the region through companies with the most attractively priced growth
13
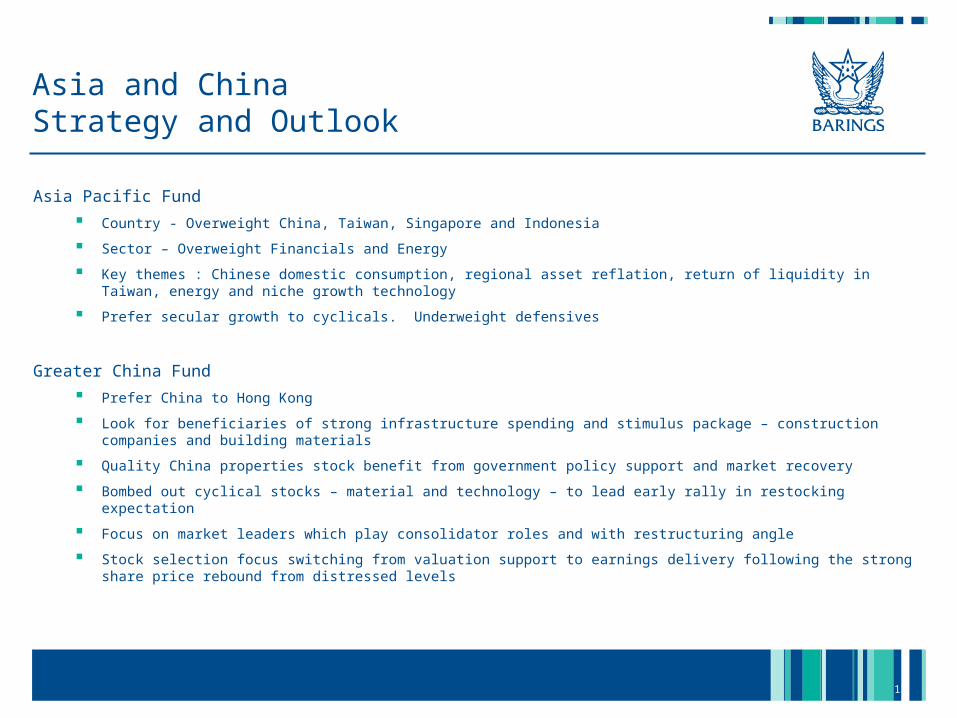
Asia Pacific Fund
Country - Overweight China, Taiwan, Singapore and Indonesia
Sector – Overweight Financials and Energy
Key themes : Chinese domestic consumption, regional asset reflation, return of liquidity in Taiwan, energy and niche growth technology
Prefer secular growth to cyclicals. Underweight defensives
Greater China Fund
Prefer China to Hong Kong
Look for beneficiaries of strong infrastructure spending and stimulus package – construction companies and building materials
Quality China properties stock benefit from government policy support and market recovery
Bombed out cyclical stocks – material and technology – to lead early rally in restocking expectation
Focus on market leaders which play consolidator roles and with restructuring angle
Stock selection focus switching from valuation support to earnings delivery following the strong share price rebound from distressed levels
Asia and ChinaStrategy and Outlook
14
The China and Asia Conundrum
What is the share of China and Asia ex-Japan in the world’s economy five years from now?
What is the potential size of the Chinese economy compared to Japan?
What is China and Asia ex-Japan’s market capitalization relative to that of the US?
What was Japan’s market capitalization relative to that of the US in 1990?
How are you positioned in China and Asia ex-Japan? Is it consistent with your economic view?
15
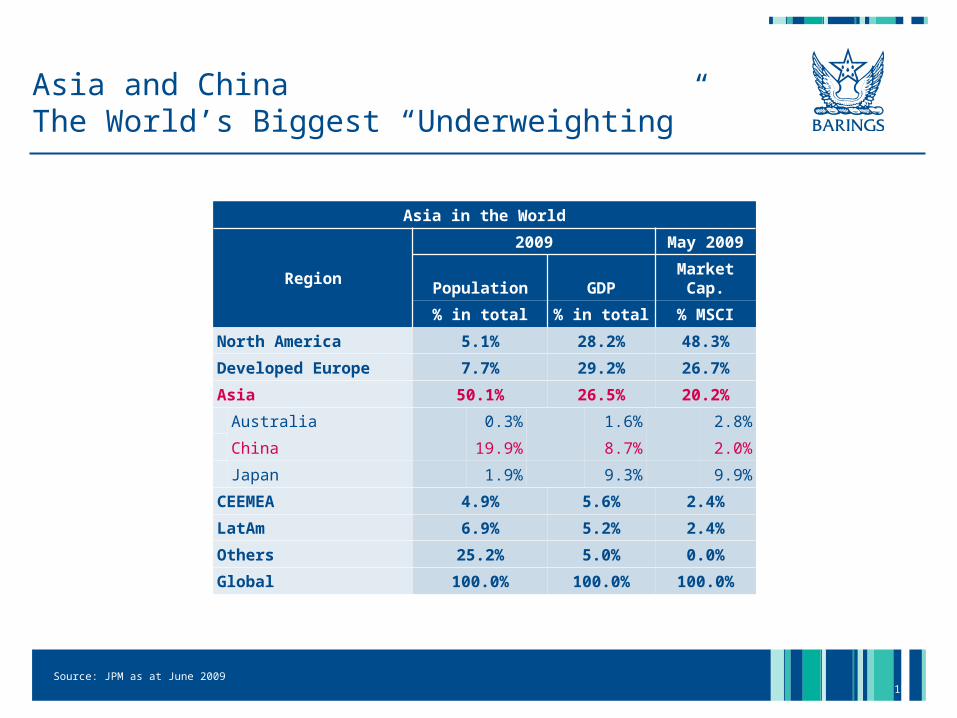
Asia and China The World’s Biggest “Underweighting”
Source: JPM as at June 2009
Asia in the World
Region
2009 May 2009
Population GDP Market Cap.
% in total % in total % MSCI
North America 5.1% 28.2% 48.3%
Developed Europe 7.7% 29.2% 26.7%
Asia 50.1% 26.5% 20.2%
Australia 0.3% 1.6% 2.8%
China 19.9% 8.7% 2.0%
Japan 1.9% 9.3% 9.9%
CEEMEA 4.9% 5.6% 2.4%
LatAm 6.9% 5.2% 2.4%
Others 25.2% 5.0% 0.0%
Global 100.0% 100.0% 100.0%
16
Important Information – Regulatory Disclosure
This document is provided as a service to professional investors/advisers. It is issued in the United Kingdom by Baring Asset Management Limited and/or by its investment adviser affiliates in other jurisdictions. The affiliate serving as the Greater China Fund/the Asia Pacific Fund’s investment adviser is Baring Asset Management (Asia) Limited. In the United Kingdom this document is issued only to persons falling within a permitted category under (i) the FSA’s rules made under section 238(5) of the Financial Services and Markets Act 2000 and (ii) the Financial Services and Markets Act 2000 (Promotion of Collective Investment Schemes) (Exemptions) Order 2001.
This is not an offer nor a solicitation to buy or sell any investment referred to in this document. Baring Asset Management group companies, their affiliates and/or their directors, officers and employees may own or have positions in any investment mentioned herein or any investment related thereto and from time to time add to or dispose of any such investment. The contents of this document are based upon sources of information from third party sources which are believed to be reliable but no guarantee, warranty or representation, express or implied, is given as to their accuracy or completeness. This document may include forward-looking statements, which are based upon our current opinions, expectations and projections as of the date on the cover hereof. We undertake no obligation to update or revise any forward-looking statements. Actual results could differ materially from those anticipated in the forward-looking statements. Changes in rates of exchange may have an adverse effect on the value, price or income of an investment. There are additional risks associated with investments (made directly or through investment vehicles which invest) in emerging or developing markets. Compensation arrangements under the Financial Services and Markets Act 2000 of the United Kingdom will not be available.
Private investors in the Company referred to herein should obtain their own independent financial advise before making investments. This document must not be relied on for purposes of any investment decisions. Before investing in the Company, we recommend that all relevant documents, such as reports and accounts and prospectus should be read, which specify the particular risks associated with investment in the Company, together with any specific restrictions applying and the basis of dealing. The Company may not be available for investment in all jurisdictions. There may also be prohibitions or restrictions on distribution of this document and other material relating to the Company and accordingly recipients of any such documents are advised to inform themselves about and to observe any such restrictions.
Compliance (Boston): June 10, 2009


![Finale 2004 - [Showtime I - Fullscore Harmonie.MUS]£ ã ã bb bb bb # # # # b b bb bb bb bb bb bb 44 44 44 44 44 44 44 44 44 44 44 44 44 44 44 44 44 44 44 44 44 44 4 4 4 4 4 4 4 4](https://img.pdfslide.net/doc/110x75/5b08e3307f8b9a520e8d5803/finale-2004-showtime-i-fullscore-bb-bb-bb-b-b-bb-bb-bb-bb-bb-bb-44.jpg)