Embed Size (px)
Citation preview
Author’s Accepted Manuscript
Social capital and efficiency of earthquake wastemanagement in Japan
Kiyomi Kawamoto, Karl Kim
PII: S2212-4209(15)30107-2DOI: http://dx.doi.org/10.1016/j.ijdrr.2015.10.003Reference: IJDRR280
To appear in: International Journal of Disaster Risk Reduction
Received date: 23 July 2015Revised date: 9 October 2015Accepted date: 9 October 2015
Cite this article as: Kiyomi Kawamoto and Karl Kim, Social capital andefficiency of earthquake waste management in Japan, International Journal ofDisaster Risk Reduction, http://dx.doi.org/10.1016/j.ijdrr.2015.10.003
This is a PDF file of an unedited manuscript that has been accepted forpublication. As a service to our customers we are providing this early version ofthe manuscript. The manuscript will undergo copyediting, typesetting, andreview of the resulting galley proof before it is published in its final citable form.Please note that during the production process errors may be discovered whichcould affect the content, and all legal disclaimers that apply to the journal pertain.
www.elsevier.com/locate/ijdr
* Corresponding author.
E-mail address: [email protected] (K. Kawamoto)
Social Capital and Efficiency of Earthquake Waste
Management in Japan
Kiyomi Kawamotoa*
, Karl Kimb
a Regional Environmental Science, Regional Cooperation Course, Department of International and
Regional Studies, Hakodate, Hokkaido University of Education, 1-2 Hachiman-chou, Hakodate city,
Hokkaido 040-8567, Japan.
b Department of Urban and Regional Planning and National Disaster Preparedness Training Center,
University of Hawaii at Manoa, 828 Fort Street Mall, Suite 320, Honolulu, Hawaii 96813, USA.
Abstract
This paper examines how Social Capital (SC) affects the efficiency of waste management by
citizens during and after earthquake disasters in Japan. The behavior of citizens is critical to
understanding waste management and SC is an important element of community resilience. SC
reveals the strength of relationships and the structure of networks in a community. There is, however,
limited understanding about how SC affects waste management and other recovery activities, and how
it changes over time. The coastal cities of Iwate and Miyagi prefectures were among the most heavily
damaged communities during the Great East Japan Earthquake (GEJE) in March of 2011. Residents of
these communities experienced many challenges related to waste management and recovery from the
disaster. A web survey was used to collect data on waste management activities. Data Envelopment
Analysis (DEA) with a Malmquist Productivity Index was used to analyze the 520 valid responses.
This study defines inputs based on community and individual resilience attributes, including SC.
Outputs are defined by the level of waste management activities, including collection, separation and
transportation. Efficiency of waste management improved by the quality change in citizen skills and
knowledge of earthquake waste management. The effect of quality change was larger than the
quantity change in the operation rate. The quality change of earthquake waste management improved
throughout the disaster. While the quality change of waste management persisted over the longer term
recovery period the operation rate, however, declined.
Keywords: earthquake waste management, social capital, efficiency, Malmquist index, Great East
Japan Earthquake
2
1. Introduction
When large earthquakes occur, huge volumes of waste are typically generated. Brown et al. [1]
provide a useful review of the literature on disaster waste management. They found that while
community behavior is an essential factor in efficient waste management during non-disaster times
there is limited understanding of waste management during and after disasters. A large volume of
waste was generated from the Great East Japan Earthquake (GEJE). Following the disaster, the
Japanese Ministry of the Environment released waste management guidelines [2]. Local governments
also developed their own guidelines. While the Ministry of the Environment recommended this
information be distributed to the communities, they did not clarify the role of citizens in disaster waste
management.
Community participation is particularly important to waste management, because public and
private sector resources are limited and stretched during and after major disasters. Often the first
priority is to save lives. During catastrophic events, the initial focus is on search and rescue, mass care,
humanitarian relief, sheltering, and basic services. One way of stretching limited resources is to draw
upon social capital. Social capital (SC) can be defined as both the nature of relationships and the
structure of networks in a community. SC is an important component of community resilience [3, 4] .
Aldrich [5] showed how networks and resources available through SC play a significant role in
recovery during the post-disaster period. Joshi and Aoki [6] described how SC can improve policy
implementation during recovery. Nakagawa and Shaw [7] showed that communities’ SC and
leadership are the most critical elements to successful disaster recovery. Islam and Walkerden [8]
described how SC contributes to the short-term and the long-term recovery from disasters. Although
SC is recognized as a key factor in disaster recovery, few studies have focused on how SC improves
waste management. This study also examines the changes in SC after the disaster, which is also not
well understood.
Waste management activities by citizens include the collection, separation, and transportation of
waste. Performance measurements are needed to assess the efficiency of these activities. Data
Envelopment Analysis (DEA) is a performance measurement technique for examining efficiency. In
addition, DEA can be used to measure changes across time periods. Wo et al. [9] measured regional
changes in energy efficiency using DEA. Camanho and Dyson [10] assessed the performance of banks
using the Malmquist Index. One of the authors of this paper used the Malmquist Index to measure
changes in the efficiency of municipal solid waste management [11].
The purpose of this study is to investigate how SC affects the efficiency of waste management by
citizens following an earthquake disaster. We also consider efficiency measures over time to
determine which changes in SC and waste management persist over the longer term recovery period.
3
2. The Role of Social Capital
2.1 Social Capital
Grube and Storr have pointed out that a community’s capacity for self-governance depends on SC
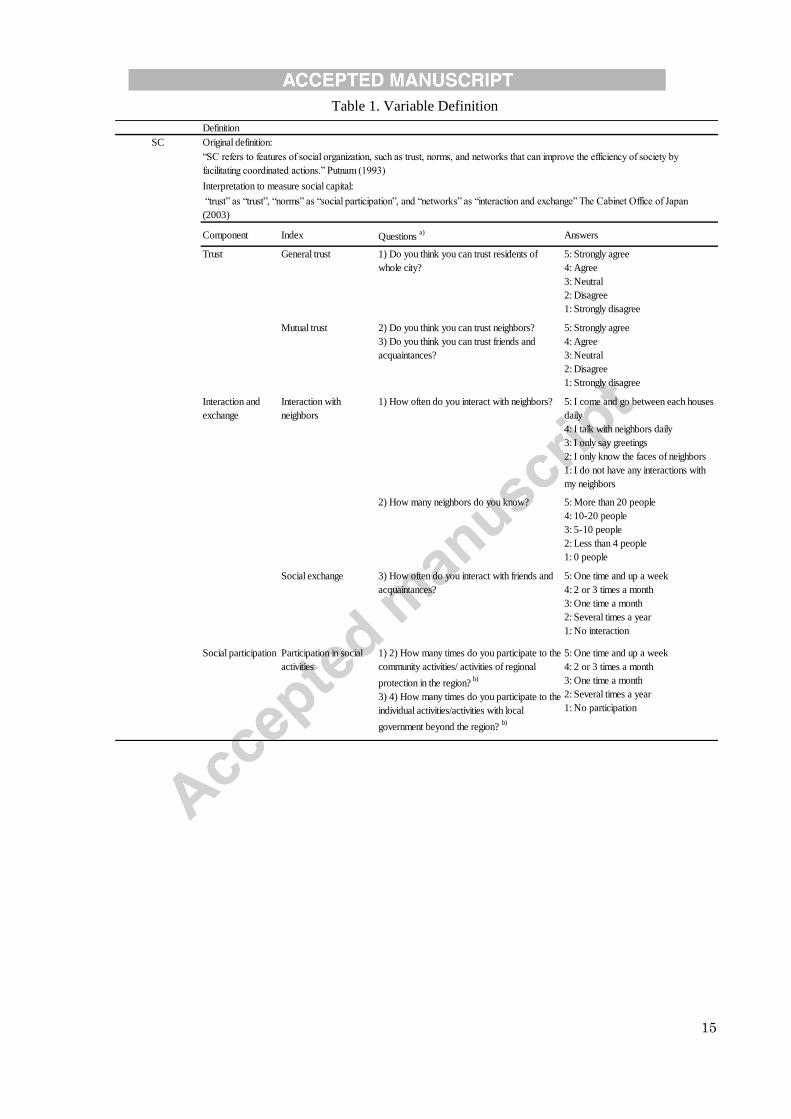
[12]. This paper draws on Putnam’s [13] definition, whereby “SC refers to features of social
organization, such as trust, norms, and networks that can improve the efficiency of society by
facilitating coordinated actions.” The Cabinet Office of Japan [14] defines “social trust” as “general
trust,” “norms” as “social participation,” and “networks” as “interaction and exchange” to measure
Japanese SC. Accordingly, the terms “trust,” “social participation,” and “interaction and exchange”
are used in this study. “Trust” is comprised of general and mutual trust. “Social participation” refers to
participation in social activities. “Interaction and exchange” is measured in terms of the interactions
with neighbors and social exchange. Table 1 displays the variable definitions of this study.
2.2 Social Capital in Community Resilience
Resilience refers to the ability to resist impacts, absorb harmful forces and then to respond
effectively and recover from disasters. Moreover, according to the Community and Regional
Resilience Institute, resilience involves disciplines ranging from psychology to ecology [15].
This study focuses on how SC, an important feature of resilience affects the efficiency of
earthquake waste management by citizens.
Community resilience is a process linking specific capacities (resources with dynamic attributes)
to adaptation after a disturbance [3]. Norris et al. have described how key attributes of communities
contribute to resilience. According to Carpenter, social networks contribute to greater community
resilience from all types of disasters [16]. Abramson et al. [17] have shown that resilience depends on
a community’s and individual’s attributes, as well as access to social resources. As such, community
and individual resilience attributes can be grouped into four categories: i) social capital, ii) economic
capital, iii) political capital, and iv) human capital. In this study, access to social resources was
replaced by the access to earthquake waste management, and Abramson et al.’s concepts were applied
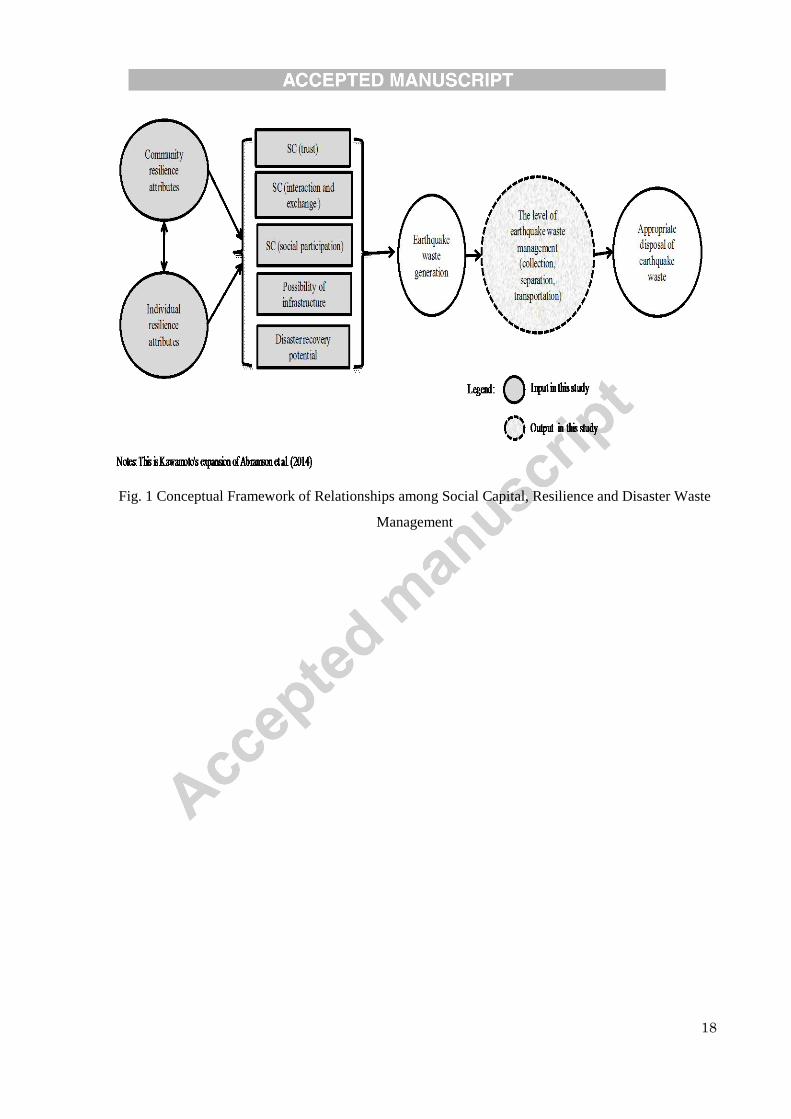
to earthquake waste management using community and individual level attributes. Fig. 1 shows the
conceptual framework of the relationship between SC, resilience, and disaster waste management.
The inputs are based on a community’s and individual’s resilience attributes, as well as SC, and
the outputs are based on the levels of earthquake waste management activities (collection, separation
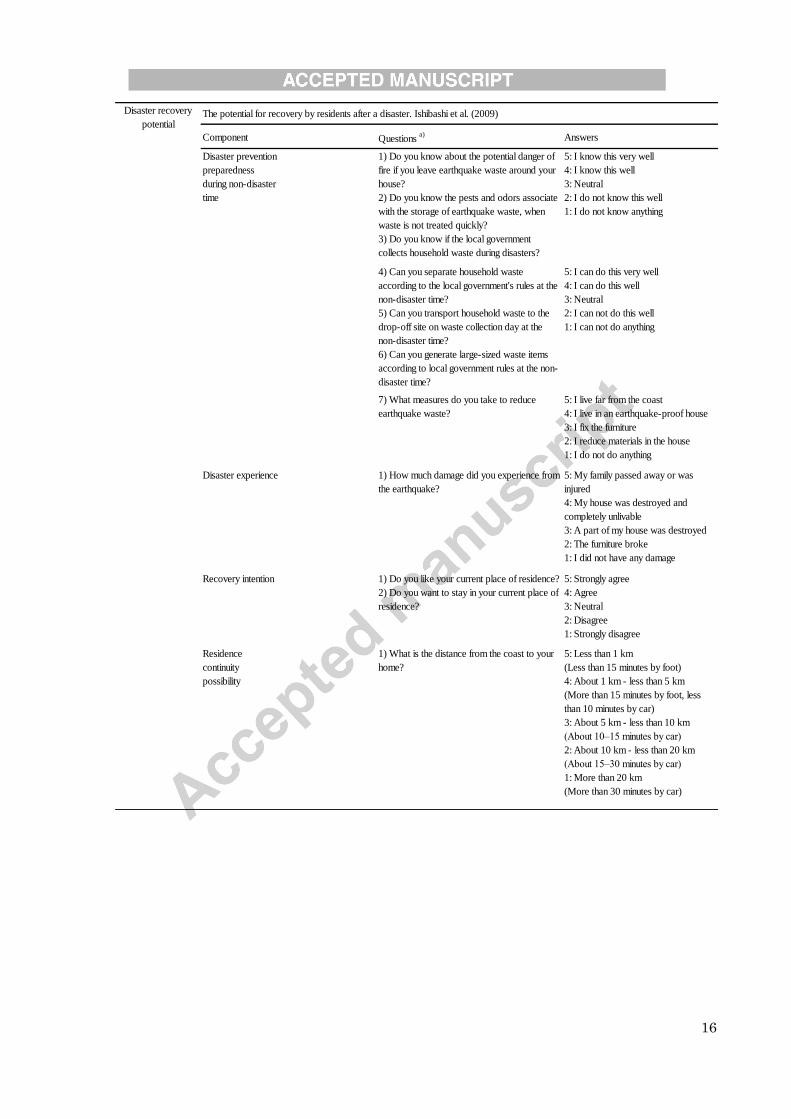
and transportation). The disaster recovery potential is defined as the potential for recovery by
residents following a disaster. This study includes an assessment of the disaster recovery potential, as
proposed by Ishibashi et al. [18], and was used as a substitute index for human capital. In this study,
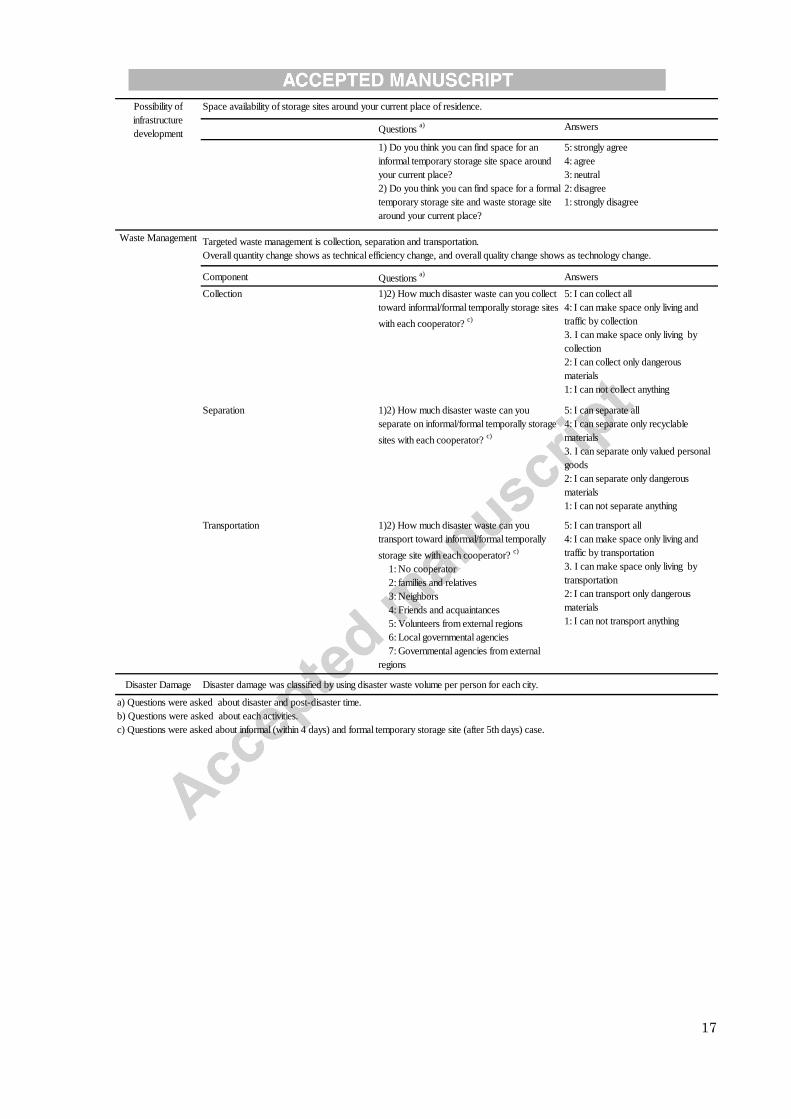
the possibility of infrastructure development was measured based on the availability of space for
storage sites around residential properties. In the case of some cities, local governments plan to use
4
public spaces like urban parks as storage sites. However, because of the volume of waste generated,
there are not enough large public open space areas to accommodate the waste, hence some cities plan
to use private spaces, like fields or amusement parks. The availability of private open space largely
depends on the economic situation of the areas. Therefore, this factor was used as a substitute index
for economic and political capital.
3. Study Areas
3.1 Case study cities
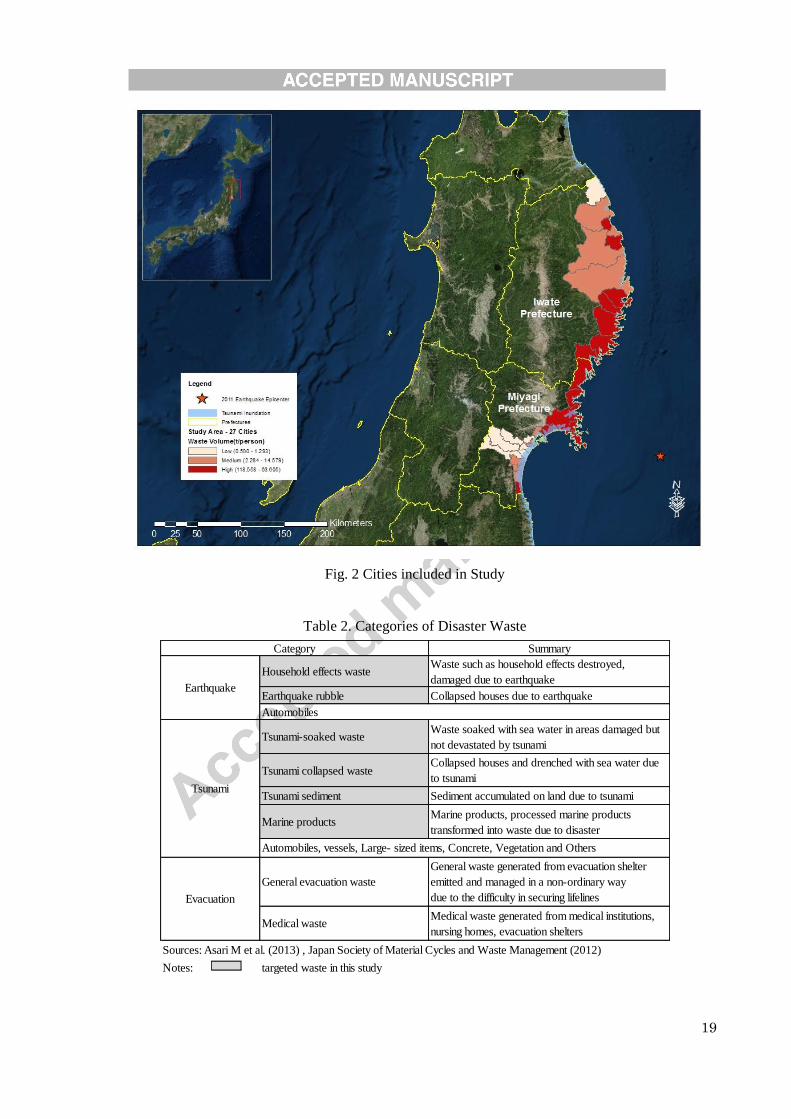
The communities examined in this study include the 27 coastal cities of Iwate and Miyagi
prefectures in Japan. Fig. 2 shows the cities included in this study. These cities suffered extensive
damage from the GEJE. Because of the magnitude of this event, residents had considerable
experience in managing debris caused by the earthquake and tsunami. The disaster generated a mix of
debris that included contaminated radioactive waste from the Fukushima nuclear power plant.
Because citizens were not typically involved in the handling of radioactive waste, Fukushima
prefecture was excluded from this study.
3.2 Earthquake Waste
Table 2 shows the categories of disaster waste [19]. There are three types of disaster waste: i)
earthquake waste, ii) tsunami waste, and iii) evacuation waste. This study focuses on earthquake
waste (i.e., household effects waste and earthquake rubble) and tsunami waste (i.e., water-soaked
waste, waste generated from structures which collapsed because of the tsunami, tsunami generated
sediment and marine waste). Automobiles and boating vessels were not included in this study.
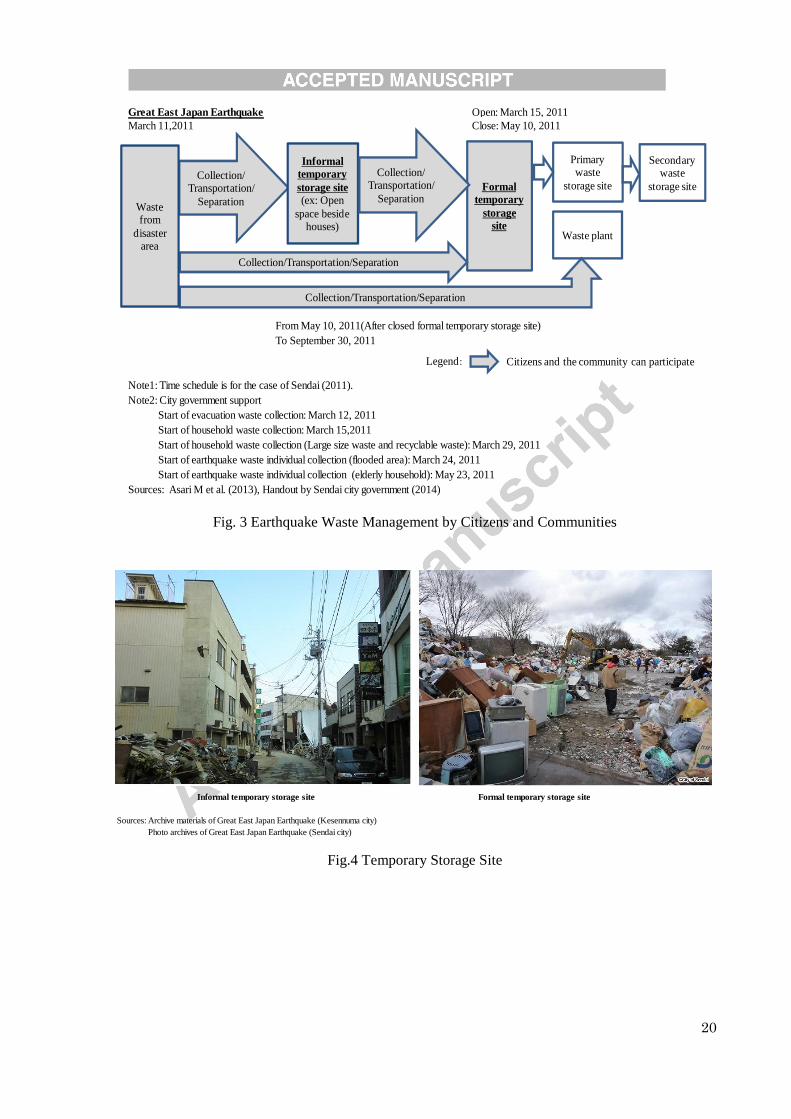
Fig. 3 illustrates the waste management activities following the earthquake in Japan. Citizens and
communities participated in collection, separation, and transportation activates during the early stages
of the recovery from the earthquake. This paper focuses on the main activities of earthquake waste
management. Informal temporary storage sites were often provided n vacant lots or on the shoulders
of roads near homes to facilitate the cleanup and repair of damaged properties. Formal temporary
storage sites were provided in parks and other public spaces. An illustrative diagram of the temporal
sequence of activities for Sendai is contained in Fig.3. Temporary storage sites were designated by the
Sendai government on the fifth day after the earthquake. Fig. 4 shows photos of temporary storage
sites.
4. Methodology
4.1 Data Collection
Data were collected with a web-based survey administered in July of 2014. The target respondents
5
were males and females over the age 20 years who met the following criteria: i) have lived for over
four years in the case study cities (in order to focus on members of communities before the GEJE.); ii)
were residents of case study cities a week after the GEJE (because they were likely to have
participated in the early stages of earthquake waste management); and iii) lived within 50 km away of
the coastline. The survey was administered by a professional web survey company. The sampling
procedure called for the collection of equal numbers of each age and gender group in the case study
areas. Five age classes (20s, 30s, 40s, 50s and 60s and over) and two gender groups (Male and
Female) were used, with each class consisting of 52 respondents. A total of 520 valid responses were
collected in this study.
The survey instrument included questions using a five level scale with five as the highest value
and one as the lowest. Because questions referred to the extent and nature of damage caused by the
earthquake, consent was obtained prior to administering the survey. Migration from these areas to
other communities increased because of the extensive damage caused by the disaster. The number of
valid responses for each city differed.
4.2 Efficiency Change Measurement
Data Envelopment Analysis (DEA) is a non-parametric linear programming method used to
measure the efficiency of Decision Making Units (DMUs) [20]. The DMU can be used to convert
inputs into outputs from which performance can be evaluated [21]. Multiple inputs and outputs are
considered for each DMU, and a DEA-based Malmquist Index was used to estimate the efficiency of
waste management over time. The Malmquist Index measures productivity changes over time. The
productivity measured by distance functions. The index was originally developed by Malmquist [22]
in 1953 and has improved over time. In 1994, Fare et al. [23] extended these concepts by applying an
input-oriented index to the geometric mean of the Malmquist Index proposed by Caves et al. in 1982
[24]. The distance function is based on the DMU’s use of inputs Xt to produce outputs Y
t in time
period t. The input distance, D, function is D (Xt, Y
t). The Malmquist Index, M, is shown as follows:
[
]
(1)
Technical efficiency change (EC) and technology change (TC) are estimated by rewriting (1) as
follows:
[
]
(2)
6
[
]
(3)
M >1 captures the progress in the total factor productivity of the DMU from time period t to t+1,
while M<1 shows a decay in productivity. EC is also known as the “frontier productivity index,” and
shows the relative distance between frontiers. Therefore, EC denotes the change of the operation rate.
TC is the shift in the technology frontier between the time periods. TC, therefore, denotes quality
change. In this study, t is 2011, the year that the GEJE occurred, and t+1 is the post-disaster time
period (2014 was used). Data from two different time periods were collected.
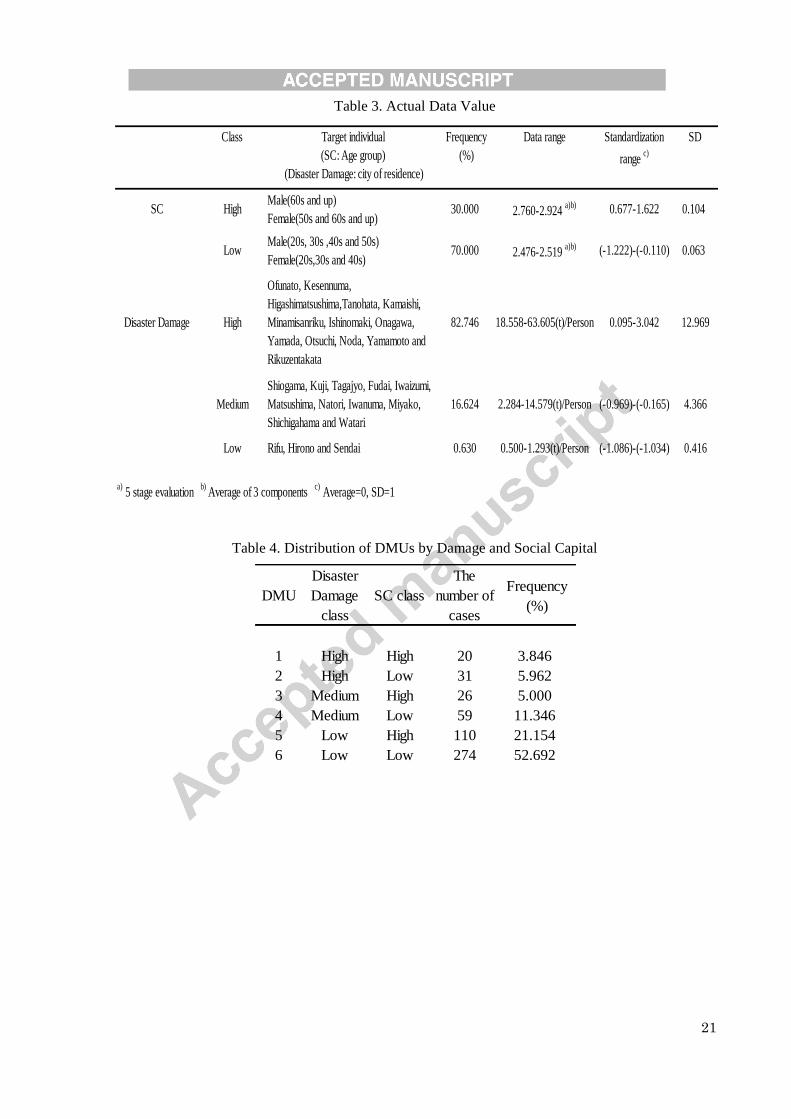
4.3 Decision Making Units
This study used six DMUs representing the level of SC and disaster damage. Earthquake waste
management activities differ depending on the extent and nature of damage. The SC levels are based
on the average scores of three components: trust, interaction and exchange, and social participation.
The scores of the two time periods were averaged, then divided by the standard deviation, and then
grouped into two levels of SC: high and low. Damage data were based on reported waste volumes per
person, averaged and divided by the standard deviation, then grouped into three levels of waste: high,
medium, and low. Table 3 presents the data values in the analysis, while Table 4 shows the
distribution for each DMU by levels of damage and social capital.
4.4 Calculation of Input Data
Five input and two output models were constructed in this study.
4.4.1 Disaster Recovery Potential
Disaster recovery potential of individual i, Di, is shown as follows:
D𝑖 A𝑖 + 𝑖 + R𝑖 + P𝑖 4
(4)
where,
A𝑖 Disaster prevention preparedness of individual 𝑖 during non − disaster time ;
𝑖 Disaster experience of individual 𝑖;
R𝑖 Recovery intention of individual 𝑖;
P𝑖 Residence continuity possibility of individual 𝑖. Distance is measured from the coast to
individual i’s house,
7
with
A𝑖= ∑A𝑖𝑗
7
𝑗=
7
(5)
where,
A𝑖𝑗 Disaster prevention preparedness factors of individual 𝑖 during non − disaster time
𝑗 1…7 ;
A𝑖 Knowledge of potential danger of waste fire;
A𝑖 Knowledge of pests and odor associated with waste;
A𝑖3 Knowledge of household waste collection by the local government during disaster time;
A𝑖4 Separation of household waste by the rule at non − disaster time;
A𝑖5 ransportion of household waste to the drop − off site by the rule at non − disaster time;
A𝑖6 Generation of large − sized waste according to the rule at non − disaster time;
A𝑖7 Reduction measures for earthquake waste,
with, moreover,
R𝑖 ∑R𝑖𝑗
𝑗=
2
(6)
where,
R𝑖𝑗 Recovery intention factors of individual 𝑖 𝑗 1 2 ;
R𝑖 Local attachment;
R𝑖 Intention of stay at the current place of residence.
4.4.2 SC
SC (trust) of individual i, Ti, is shown as follows:
𝑖 ∑ 𝑖𝑗
3
𝑗=
3
(7)
where,
𝑖𝑗 rust factors of individual 𝑖 𝑗 1…3 ;
𝑖 rust for residents of the whole city;
𝑖 rust for neighbors;
𝑖3 rust for friends and acquaintances
and SC (interaction and exchange) of individual i, AEi, is represented by:
8
A 𝑖 ∑A 𝑖𝑗
3
𝑗=
3
(8)
where,
A 𝑖𝑗 Interaction and exchange factors of ndividual 𝑖 𝑗 1…3 ;
A 𝑖 Interaction with neighbors;
A 𝑖 Number of acquaintances in the neighborhood;
A 𝑖3 Interaction with friends and acquaintances,
and SC (social participation) of individual i, Si, is measured by:
S𝑖 ∑S𝑖𝑗
4
𝑗=
4
(9)
where,
S𝑖𝑗 Social participation factors of individual 𝑖 𝑗 1…4 ;
S𝑖 Participation to the community activities in the region;
S𝑖 Participation to the activities of regional protection in the region;
S𝑖3 Participation to the individual activities beyond the region;
S𝑖4 Participation to the activities with local government beyond the region.
4.4.3 Possibility of infrastructure development
Possibility of infrastructure development around individual i, PIi, and is shown as follows:
PI𝑖 ∑PI𝑖𝑗
𝑗=
2
(10)
where,
PI𝑖𝑗 Possibility of infrastructure development factors around individual 𝑖 𝑗 1 2 ;
PI𝑖 Informal temporary storage sites;
PI𝑖 Formal temporary storage sites and waste storage sites.
4.5 Calculation of Output Data
The output is measured as the access level to temporary storage sites. Seventy percent of useable
responses were provided by the residents of Sendai in this study. As mentioned previously, in Sendai,
formal temporary storage sites were created by the local government on the fifth day after the GEJE.
Therefore, this study divided access levels based on the availability of informal temporary storage
sites within four days after the disaster and formal temporary storage sites from the fifth day after the
9
disaster. The earthquake waste management activities for citizens included collection, separation and
transportation activities.
Different stakeholders exhibit varying levels of risk reduction activity. Jain [25] analyzed
stakeholder actions reducing disaster risk in a large scale infrastructure development, and showed that
different stakeholders had varying degrees of influence in each project phase. Iwata et al. [26] found
that public rather than private mitigation contributed to greater reduction of the damage resulting from
natural disasters. Nakayachi and Ozaki [27] observed that the trust ratings of risk managers improved
when they voluntarily shared information with the general public during disasters. Based on these
findings, this study analyzed which types of cooperative action were most effective in promoting
waste management outcomes during disaster recovery.
The level of earthquake waste management of individual i, Mi, is shown as follows:
M𝑖 M𝑖𝑎𝑚𝑗 + M𝑖𝑏𝑚𝑗
(11)
where,
M𝑖𝑎 Management level toward informal temporary storage site of individual 𝑖 within
four days;
M𝑖𝑏 Management level toward formal temporary storage sites of individual 𝑖 from the fifth
day;
M𝑖𝑚 Kinds of earthquake waste management 𝑚 1…3 ;
m1 is collection, m2 is separation and m3 is transportation.
M𝑖𝑗 ypes of cooperators 𝑗 1…7 ;
j1 is no cooperator, j2 is families and relatives, j3 is neighbors, j4 is friends and acquaintances, j5 is
volunteers from external regions, j6 is local governmental agencies, and j7 is governmental agencies
from external regions.
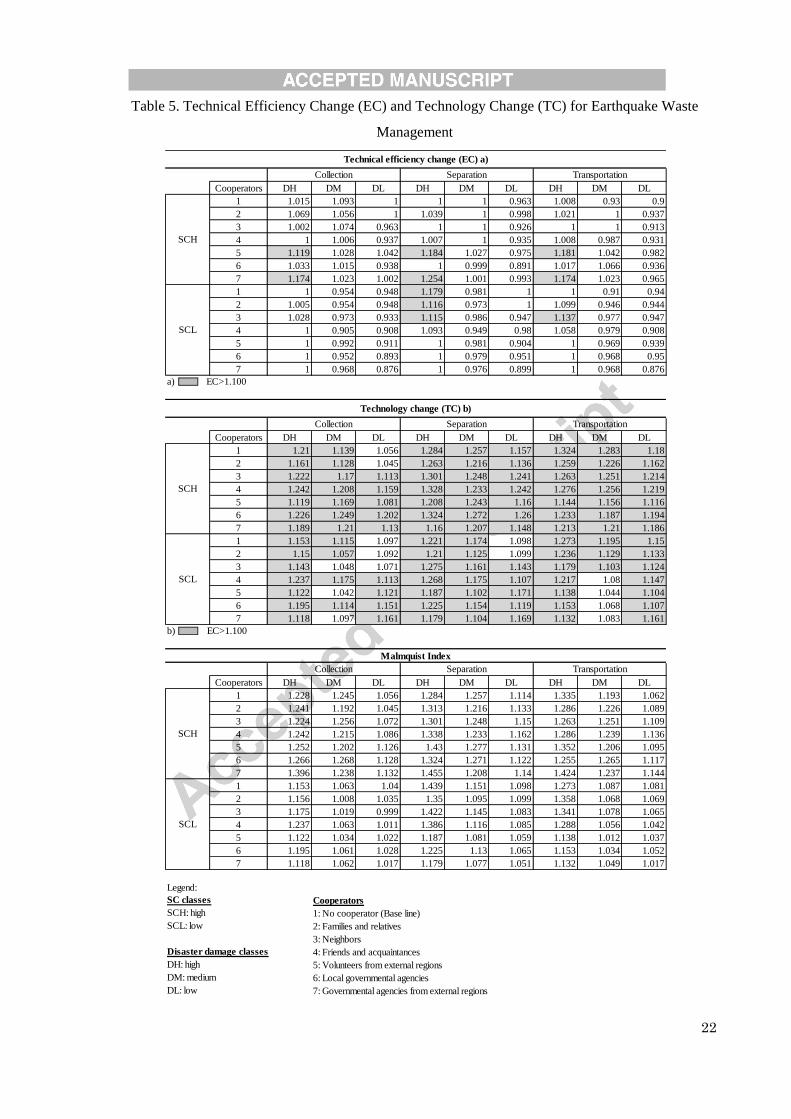
5. Results and Findings
The results are contained in Table 5. The results show how SC affects the efficiency of earthquake
waste management, and efficiency changes over the longer term recovery period. All Malmquist index
values were shown to be larger than 1. This means that the efficiency of earthquake waste management
in communities improved during the post-disaster period. The Malmquist index is a function of both
the technical efficiency change (EC) and the technology change (TC). The study focused specifically
on EC>1.100 and TC>1.100 to estimate the improvements in earthquake waste management within the
case study communities. The High SC group consisted of those individuals in the elderly age group, while
the Low SC group was individuals in the young and middle age groups.
10
5.1 Technical Efficiency Change (EC)
5.1.1 Collection
The EC of the high SC group increased during the post-disaster period. This was especially the
case when those individuals in the elderly age group with high levels of disaster damage cooperated
with volunteers from external regions (EC=1.119) and governmental agencies from external regions
(EC=1.174). Many government staff members from cities outside the region assisted with waste
management after the GEJE. Those in the elderly age group learned how to cooperate and create
networks with those from external regions to collect waste throughout the disaster period (during and
after), and thus the operation rate of the earthquake waste collection improved.
The EC of the high SC group with medium disaster damage increased (EC=1.093, 1.056, 1.074,
1.006, 1.028, 1.015, 1.023). On the EC of the low SC group with medium disaster damage, on the
other hand, decreased (EC=0.954, 0.954, 0.973, 0.905, 0.992, 0.952, 0.968).
The EC of the low SC group with low disaster damage decreased (EC=0.948, 0.948, 0.933, 0.908,
0.911, 0.893, 0.876) during the post-disaster period. While those in the elderly age group with
medium levels of disaster damage improved their rates of collection, those in the young and middle
age groups with medium to low disaster damage, did not experience changes in the rate of collection.
5.1.2 Separation
The EC of the high SC group increased during the post-disaster period. This is especially the case
for those in the elderly age group with high levels of disaster damage who cooperated with volunteers
from external regions (EC=1.184) and governmental agencies from external regions (EC=1.254). It
was reported that volunteers from external regions helped separate personal items, such as,
photographs from the earthquake waste. Members of the elderly age group learned how to cooperate
with those from the external regions to separate waste throughout the disaster period (during and
after).
The EC of the low SC group with high disaster damage increased, especially when those
individuals in the young and middle age group cooperated with families or relatives (EC =1.116) and
neighbors (EC =1.115). The earthquake waste included valuable personal items, so citizens needed to
identify and separate valuable items from other waste. Individuals in the young and middle age group,
as a result of this process, learned how to cooperate with other people involved with disaster waste
management.
5.1.3 Transportation
The EC of the high SC group increased during the post-disaster period. Especially when those in
the elderly age group with high disaster damage cooperated with volunteers from the external regions
(EC=1.181) and governmental agencies from the external regions (EC=1.174).
The EC of the low SC group with high disaster damage increased, especially when those in the
11
young and middle age group cooperated with their neighbors (EC =1.137). Citizens transported
earthquake waste with their cars to the temporary storage site after the GEJE, even though cars and
gasoline were in limited supply. Those in the elderly age group learned how to cooperate and share
limited resources with those from the external regions, while those in the young and middle age group
learned to cooperate with neighbors during the recovery process.
The EC of all SC group with low disaster damage tended to decrease in the post-disaster period. In
such cases, citizens did not feel the need to cooperate or create networks, therefore did not develop SC
during the time of the disaster.
5.2 Technology Change (TC)
All TC increased during the post-disaster period for all damage levels and all SC groups (TC>1).
Most TC was shown to have a specific progressed value of TC>1.100. The frontier of earthquake
waste management shifted in the post-disaster period, which means that the quality of community and
individual earthquake waste management, in terms of citizens’ skills, knowledge, and SC, improved.
Usually citizens’ skills and knowledge in the collection, separation, and transportation phases during
periods of non-disasters is less than the skills and knowledge during periods of disaster. Skills and
knowledge were shown to improve over the three year recovery period. Citizens obtained skills and
knowledge regarding earthquake waste management through their experience during the disaster and
this has persisted over the longer term recovery period.
6. Conclusions
In previous studies it has been shown that the efficiency of waste management tends to change
after the disaster. It depends on the change of the operation rate, in terms of human capital, economic
capital and infrastructure. However, we found that the efficiency of earthquake waste management
also improves because of the quality change in earthquake waste management, in terms of skills and
knowledge. The effect of quality change was larger than that of the change in the operation rate.
Additionally, we found that the quality change in earthquake waste management persists over the
longer term recovery period, although the operation rate declined.
This study showed how SC affects the efficiency of earthquake waste management and the
efficiency changes for the longer term recovery period. Three findings emerged. First, the operation
rate of earthquake waste management improved by cooperation and network creation especially in
communities with high levels of damage. Moreover, the quality of earthquake waste management, in
terms of citizens’ skills and knowledge, increased throughout the recovery period. We believe that the
quality of earthquake waste management can be improved with enhanced training on cooperation,
networking and strengthening social capital before a disaster occurs.
12
Second, the most cooperative partners depended SC particularly in communities with high levels
of damage. The level of cooperation, moreover, varied by age group. When those in the elderly age
group cooperated with volunteers and governmental agencies from external regions, the operation rate
increased. Moreover, when those in the young and middle age group cooperated with family, relatives
and neighbors, the operation rate increased. In these places with high levels of damage, strong
cooperation improves efficiency. Strong leadership and efforts to motivate increased cooperation can
create increased efficiencies in waste management. We suggest greater dissemination of information
regarding different approaches to cooperative behavior related to disaster waste management activities.
A more systematic inventory of the types of behaviors and the sharing of resources for collection,
separation, and transportation of waste is needed.
Third, communities that experienced low levels of disaster damage exhibited declining
efficiencies in waste management during the post-disaster period. Citizens in these communities did
not feel the need to cooperate or create networks. It also points to the positive social effects that occur
in heavily impacted communities. Perhaps all communities can better prepare for disasters and the
management of waste through the strengthening of social capital before disaster strikes.
This study shows the role and possibilities of SC in earthquake waste management by using data
inclusive of two time periods. SC, however, decreases if it is not frequently used. How can
communities maintain the SC over the long term? What conditions are required to sustain high
performance of SC? To answer these questions, time series data should be collected and analyzed.
Earthquake waste management not only requires social capital and cooperative behavior, but also the
understanding and use of waste management equipment as well as the need to address safety concerns
during cleanup operations. When with increased involvement of citizens in the handling of earthquake
waste, health and safety matters must always be considered. These remain as topics for further study.
Acknowledgement
This research was financially supported by The Environment Research and Technology
Development Fund (No. 3K143015) of the Ministry of the Environment, Japan. The authors gratefully
acknowledge the funding support that made it possible to complete this study.
References
[1] Brown C, Milke M, Seville E. Disaster waste management: A review article. Waste Manage
2011; 31:1085-98.
[2] Ministry of the Environment, Japan. Disaster Waste Management Guidelines. Tokyo; 2014 (in
Japanese).
[3] Norris FH, Stevens SP, Pfefferbaum B, Wyche KF, Pfefferbaum RL. Community resilience as
13
metaphor, theory, set of capacities, and strategy for disaster readiness. American Journal of
Community Psychology 2008; 41: 127-50.
[4] Ainuddin S, Routray JK. Community resilience framework for an earthquake prone area in
Baluchistan, International Journal of Disaster Risk Reduction 2012; 2, 25-36.
[5] Aldrich DP. Building resilience. Chicago and London: The University of Chicago Press; 2012.
[6] Joshi A, Aoki M. The role of social capital and public policy in disaster recovery: A case study of
Tamil Nadu State, India. International Journal of Disaster Risk Reduction 2014; 7: 100-8.
[7] Nakagawa Y, Shaw R. Social Capital: A Missing Link to Disaster Recovery. International
Journal of Mass emergencies and Disasters 2004; 22(1): 5-34.
[8] Islam R, Walkerden G. How bonding and bridging networks contribute to disaster resilience and
recovery on the Bangladeshi coast; International Journal of Disaster Risk Reduction 2014; 10:
281-91.
[9] Wo A-H, Cao Y-Y, Liu B. Energy efficiency evaluation for regions in China: an application of
DEA and Malmquist indices. Energy efficiency 2014; 7(3): 429-39.
[10] Camanho AS, Dyson RG. Data envelopment analysis and Malmquist indices for measuring
group performance. Journal of Productivity Analysis 2006; 26:35–49.
[11] Kawamoto K, Imura H. The efficiency of municipal solid waste management with regional social
capital: The comparison of 47 capitals in Japanese prefectures. Environmental Systems Research
2007; 35:441-50. (in Japanese).
[12] Grube L, Storr VH. The capacity for self-governance and post-disaster resiliency. The Review of
Austrian Economics 2013; 27: 301-24.
[13] Putnam RD. Making Democracy Work. Princeton: Princeton University Press; 1993, 163-85.
[14] Division for Volunteering Support Policy, Quality-of-Life Policy Bureau, Cabinet Office, Japan.
Social Capital: For Rich Personal Relations and Community. Tokyo: 2003 (in Japanese).
[15] Community and Regional Resilience Institute, Definition of community resilience: An analysis.
A CARRI Report, 2013.
[16] Carpenter A. Resilience in the social and physical realms: from the Gulf Coast. International
Journal of Disaster Risk Reduction, in press.
[17] Abramson DM, Grattan LM, Mayer B, Colten CE, Arosemena FA, Bedimo-Rung A, Lichtveld
M. The resilience activation framework: A conceptual model of how access to social resources
promotes adaptation and rapid recovery in post-disaster settings. The Journal of Behavioral
Health Services & Research 2014; 42(1):42-57.
[18] Ishibashi E, Itoigawa E, Kumagai Y, Umemoto M. Relative analysis between a community’s
disaster recovery potential and social capital. Journal of Social Safety Science 2009; 11: 309-18.
(in Japanese).
14
[19] Asari M, Sakai S, Yoshioka T, Tojo Y, Tasaki T, Takigami H, Watanabe K. Strategy for
separation and treatment of disaster waste: a manual for earthquake and tsunami disaster waste
management in Japan. Journal of Material Cycles and Waste Management 2013; 15(3): 290-299.
[20] Charnes A, Cooper WW, Rhodes E. Measuring the efficiency of decision making units. European
Journal of Operational Research 1978; 2:429–44.
[21] Cooper WW, Seiford, Tone K. Introduction to data envelopment analysis and its uses, New
York: Springer; 2006, 21-39.
[22] Malmquist S. Index numbers and indifference surfaces. Trabajos de Estadistica 1953; 4:209-42.
[23] Fare R, Grosskopf F, Lindgren B, Roos P. Productivity developments in Swedish hospitals: a
Malmquist output index approach. In: Charnes A, Cooper WW, Lewin AY, Seiford LM (eds)
Data Envelopment Analysis: theory, methodology and applications. Boston: Kluwer Academic
Publishers; 1994, 253–72.
[24] Caves DW, Christensen LR, Diewert WE. The economic theory of index numbers and the
measurement of input, output, and productivity. Econometrica 1982; 50(6):1393–414.
[25] Jain G. The role of private sector for reducing disaster risk in large scale infrastructure and real
estate development: Case of Delhi. International Journal of Disaster Risk Reduction, in press.
[26] Iwata K, Ito Y, Managi S. Public and private mitigation for natural disaster in Japan. .
International Journal of Disaster Risk Reduction 2014; 7: 39-50.
[27] Nakayachi K, Ozaki T. A method to improve trust in disaster risk managers: Voluntary action to
share a common fate. International Journal of Disaster Risk Reduction 2014; 10: 59-66.
15
Table 1. Variable Definition
Component Index Questions a) Answers
General trust 1) Do you think you can trust residents of
whole city?
5: Strongly agree
4: Agree
3: Neutral
2: Disagree
1: Strongly disagree
Mutual trust 2) Do you think you can trust neighbors?
3) Do you think you can trust friends and
acquaintances?
5: Strongly agree
4: Agree
3: Neutral
2: Disagree
1: Strongly disagree
1) How often do you interact with neighbors? 5: I come and go between each houses
daily
4: I talk with neighbors daily
3: I only say greetings
2: I only know the faces of neighbors
1: I do not have any interactions with
my neighbors
2) How many neighbors do you know? 5: More than 20 people
4: 10-20 people
3: 5-10 people
2: Less than 4 people
1: 0 people
Social exchange 3) How often do you interact with friends and
acquaintances?
5: One time and up a week
4: 2 or 3 times a month
3: One time a month
2: Several times a year
1: No interaction
Social participation Participation in social
activities
1) 2) How many times do you participate to the
community activities/ activities of regional
protection in the region? b)
3) 4) How many times do you participate to the
individual activities/activities with local
government beyond the region? b)
5: One time and up a week
4: 2 or 3 times a month
3: One time a month
2: Several times a year
1: No participation
“trust” as “trust”, “norms” as “social participation”, and “networks” as “interaction and exchange” The Cabinet Office of Japan
(2003)
SC
Trust
Interaction and
exchange
Interaction with
neighbors
Definition
Original definition:
“SC refers to features of social organization, such as trust, norms, and networks that can improve the efficiency of society by
facilitating coordinated actions.” Putnam (1993)
Interpretation to measure social capital:
16
Component Questions a) Answers
Disaster prevention
preparedness
during non-disaster
time
1) Do you know about the potential danger of
fire if you leave earthquake waste around your
house?
2) Do you know the pests and odors associate
with the storage of earthquake waste, when
waste is not treated quickly?
3) Do you know if the local government
collects household waste during disasters?
5: I know this very well
4: I know this well
3: Neutral
2: I do not know this well
1: I do not know anything
4) Can you separate household waste
according to the local government's rules at the
non-disaster time?
5) Can you transport household waste to the
drop-off site on waste collection day at the
non-disaster time?
6) Can you generate large-sized waste items
according to local government rules at the non-
disaster time?
5: I can do this very well
4: I can do this well
3: Neutral
2: I can not do this well
1: I can not do anything
7) What measures do you take to reduce
earthquake waste?
5: I live far from the coast
4: I live in an earthquake-proof house
3: I fix the furniture
2: I reduce materials in the house
1: I do not do anything
Disaster experience 1) How much damage did you experience from
the earthquake?
5: My family passed away or was
injured
4: My house was destroyed and
completely unlivable
3: A part of my house was destroyed
2: The furniture broke
1: I did not have any damage
Recovery intention 1) Do you like your current place of residence?
2) Do you want to stay in your current place of
residence?
5: Strongly agree
4: Agree
3: Neutral
2: Disagree
1: Strongly disagree
Residence
continuity
possibility
1) What is the distance from the coast to your
home?
5: Less than 1 km
(Less than 15 minutes by foot)
4: About 1 km - less than 5 km
(More than 15 minutes by foot, less
than 10 minutes by car)
3: About 5 km - less than 10 km
(About 10–15 minutes by car)
2: About 10 km - less than 20 km
(About 15–30 minutes by car)
1: More than 20 km
(More than 30 minutes by car)
The potential for recovery by residents after a disaster. Ishibashi et al. (2009)Disaster recovery
potential
17
Questions a) Answers
1) Do you think you can find space for an
informal temporary storage site space around
your current place?
2) Do you think you can find space for a formal
temporary storage site and waste storage site
around your current place?
5: strongly agree
4: agree
3: neutral
2: disagree
1: strongly disagree
Component Questions a) Answers
Collection 1)2) How much disaster waste can you collect
toward informal/formal temporally storage sites
with each cooperator? c)
5: I can collect all
4: I can make space only living and
traffic by collection
3. I can make space only living by
collection
2: I can collect only dangerous
materials
1: I can not collect anything
Separation 1)2) How much disaster waste can you
separate on informal/formal temporally storage
sites with each cooperator? c)
5: I can separate all
4: I can separate only recyclable
materials
3. I can separate only valued personal
goods
2: I can separate only dangerous
materials
1: I can not separate anything
Transportation 1)2) How much disaster waste can you
transport toward informal/formal temporally
storage site with each cooperator? c)
1: No cooperator
2: families and relatives
3: Neighbors
4: Friends and acquaintances
5: Volunteers from external regions
6: Local governmental agencies
7: Governmental agencies from external
regions
5: I can transport all
4: I can make space only living and
traffic by transportation
3. I can make space only living by
transportation
2: I can transport only dangerous
materials
1: I can not transport anything
Disaster Damage
a) Questions were asked about disaster and post-disaster time.
b) Questions were asked about each activities.
c) Questions were asked about informal (within 4 days) and formal temporary storage site (after 5th days) case.
Disaster damage was classified by using disaster waste volume per person for each city.
Targeted waste management is collection, separation and transportation.
Overall quantity change shows as technical efficiency change, and overall quality change shows as technology change.
Space availability of storage sites around your current place of residence.Possibility of
infrastructure
development
Waste Management
18
Fig. 1 Conceptual Framework of Relationships among Social Capital, Resilience and Disaster Waste
Management
19
Fig. 2 Cities included in Study
Table 2. Categories of Disaster Waste
Summary
Household effects wasteWaste such as household effects destroyed,
damaged due to earthquake
Earthquake rubble Collapsed houses due to earthquake
Tsunami-soaked wasteWaste soaked with sea water in areas damaged but
not devastated by tsunami
Tsunami collapsed wasteCollapsed houses and drenched with sea water due
to tsunami
Tsunami sediment Sediment accumulated on land due to tsunami
Marine productsMarine products, processed marine products
transformed into waste due to disaster
General evacuation waste
General waste generated from evacuation shelter
emitted and managed in a non-ordinary way
due to the difficulty in securing lifelines
Medical wasteMedical waste generated from medical institutions,
nursing homes, evacuation shelters
Notes: targeted waste in this study
Sources: Asari M et al. (2013) , Japan Society of Material Cycles and Waste Management (2012)
Tsunami
Automobiles
Category
Evacuation
Earthquake
Automobiles, vessels, Large- sized items, Concrete, Vegetation and Others
20
Fig. 3 Earthquake Waste Management by Citizens and Communities
Fig.4 Temporary Storage Site
Great East Japan Earthquake Open: March 15, 2011
March 11,2011 Close: May 10, 2011
From May 10, 2011(After closed formal temporary storage site)
To September 30, 2011
Note1: Time schedule is for the case of Sendai (2011).
Note2: City government support
Start of evacuation waste collection: March 12, 2011
Start of household waste collection: March 15,2011
Start of household waste collection (Large size waste and recyclable waste): March 29, 2011
Start of earthquake waste individual collection (flooded area): March 24, 2011
Start of earthquake waste individual collection (elderly household): May 23, 2011
Sources: Asari M et al. (2013), Handout by Sendai city government (2014)
Collection/ Transportation/
Separation
Informal
temporary
storage site
(ex: Open
space beside houses)
Primarywaste
storage siteFormal
temporary
storage
site
Collection/ Transportation/
Separation
Secondarywaste
storage site
Collection/Transportation/Separation
Collection/Transportation/Separation
Wastefrom
disaster area
Waste plant
Legend: Citizens and the community can participate
Informal temporary storage site Formal temporary storage site
Sources: Archive materials of Great East Japan Earthquake (Kesennuma city)
Photo archives of Great East Japan Earthquake (Sendai city)
21
Table 3. Actual Data Value
Table 4. Distribution of DMUs by Damage and Social Capital
Class Target individual
(SC: Age group)
(Disaster Damage: city of residence)
Frequency
(%)
Data range Standardization
range c)
SD
SC HighMale(60s and up)
Female(50s and 60s and up)30.000 2.760-2.924
a)b) 0.677-1.622 0.104
LowMale(20s, 30s ,40s and 50s)
Female(20s,30s and 40s)70.000 2.476-2.519
a)b) (-1.222)-(-0.110) 0.063
Disaster Damage High
Ofunato, Kesennuma,
Higashimatsushima,Tanohata, Kamaishi,
Minamisanriku, Ishinomaki, Onagawa,
Yamada, Otsuchi, Noda, Yamamoto and
Rikuzentakata
82.746 18.558-63.605(t)/Person 0.095-3.042 12.969
Medium
Shiogama, Kuji, Tagajyo, Fudai, Iwaizumi,
Matsushima, Natori, Iwanuma, Miyako,
Shichigahama and Watari
16.624 2.284-14.579(t)/Person (-0.969)-(-0.165) 4.366
Low Rifu, Hirono and Sendai 0.630 0.500-1.293(t)/Person (-1.086)-(-1.034) 0.416
a) 5 stage evaluation
b) Average of 3 components
c) Average=0, SD=1
DMU
Disaster
Damage
class
SC class
The
number of
cases
Frequency
(%)
1 High High 20 3.846
2 High Low 31 5.962
3 Medium High 26 5.000
4 Medium Low 59 11.346
5 Low High 110 21.154
6 Low Low 274 52.692
22
Table 5. Technical Efficiency Change (EC) and Technology Change (TC) for Earthquake Waste
Management
Cooperators DH DM DL DH DM DL DH DM DL
1 1.015 1.093 1 1 1 0.963 1.008 0.93 0.9
2 1.069 1.056 1 1.039 1 0.998 1.021 1 0.937
3 1.002 1.074 0.963 1 1 0.926 1 1 0.913
4 1 1.006 0.937 1.007 1 0.935 1.008 0.987 0.931
5 1.119 1.028 1.042 1.184 1.027 0.975 1.181 1.042 0.982
6 1.033 1.015 0.938 1 0.999 0.891 1.017 1.066 0.936
7 1.174 1.023 1.002 1.254 1.001 0.993 1.174 1.023 0.965
1 1 0.954 0.948 1.179 0.981 1 1 0.91 0.94
2 1.005 0.954 0.948 1.116 0.973 1 1.099 0.946 0.944
3 1.028 0.973 0.933 1.115 0.986 0.947 1.137 0.977 0.947
4 1 0.905 0.908 1.093 0.949 0.98 1.058 0.979 0.908
5 1 0.992 0.911 1 0.981 0.904 1 0.969 0.939
6 1 0.952 0.893 1 0.979 0.951 1 0.968 0.95
7 1 0.968 0.876 1 0.976 0.899 1 0.968 0.876
Cooperators DH DM DL DH DM DL DH DM DL
1 1.21 1.139 1.056 1.284 1.257 1.157 1.324 1.283 1.18
2 1.161 1.128 1.045 1.263 1.216 1.136 1.259 1.226 1.162
3 1.222 1.17 1.113 1.301 1.248 1.241 1.263 1.251 1.214
4 1.242 1.208 1.159 1.328 1.233 1.242 1.276 1.256 1.219
5 1.119 1.169 1.081 1.208 1.243 1.16 1.144 1.156 1.116
6 1.226 1.249 1.202 1.324 1.272 1.26 1.233 1.187 1.194
7 1.189 1.21 1.13 1.16 1.207 1.148 1.213 1.21 1.186
1 1.153 1.115 1.097 1.221 1.174 1.098 1.273 1.195 1.15
2 1.15 1.057 1.092 1.21 1.125 1.099 1.236 1.129 1.133
3 1.143 1.048 1.071 1.275 1.161 1.143 1.179 1.103 1.124
4 1.237 1.175 1.113 1.268 1.175 1.107 1.217 1.08 1.147
5 1.122 1.042 1.121 1.187 1.102 1.171 1.138 1.044 1.104
6 1.195 1.114 1.151 1.225 1.154 1.119 1.153 1.068 1.107
7 1.118 1.097 1.161 1.179 1.104 1.169 1.132 1.083 1.161
Cooperators DH DM DL DH DM DL DH DM DL
1 1.228 1.245 1.056 1.284 1.257 1.114 1.335 1.193 1.062
2 1.241 1.192 1.045 1.313 1.216 1.133 1.286 1.226 1.089
3 1.224 1.256 1.072 1.301 1.248 1.15 1.263 1.251 1.109
4 1.242 1.215 1.086 1.338 1.233 1.162 1.286 1.239 1.136
5 1.252 1.202 1.126 1.43 1.277 1.131 1.352 1.206 1.095
6 1.266 1.268 1.128 1.324 1.271 1.122 1.255 1.265 1.117
7 1.396 1.238 1.132 1.455 1.208 1.14 1.424 1.237 1.144
1 1.153 1.063 1.04 1.439 1.151 1.098 1.273 1.087 1.081
2 1.156 1.008 1.035 1.35 1.095 1.099 1.358 1.068 1.069
3 1.175 1.019 0.999 1.422 1.145 1.083 1.341 1.078 1.065
4 1.237 1.063 1.011 1.386 1.116 1.085 1.288 1.056 1.042
5 1.122 1.034 1.022 1.187 1.081 1.059 1.138 1.012 1.037
6 1.195 1.061 1.028 1.225 1.13 1.065 1.153 1.034 1.052
7 1.118 1.062 1.017 1.179 1.077 1.051 1.132 1.049 1.017
Legend:
Cooperators
1: No cooperator (Base line)
2: Families and relatives
3: Neighbors
4: Friends and acquaintances
5: Volunteers from external regions
6: Local governmental agencies
7: Governmental agencies from external regions
DH: high
DM: medium
DL: low
SCH
SCL
SC classes
SCH: high
SCL: low
Disaster damage classes
SCL
b) EC>1.100
Malmquist Index
Collection Separation Transportation
Technical efficiency change (EC) a)
SCH
Collection Separation Transportation
SCH
SCL
a) EC>1.100
Technology change (TC) b)
Collection Separation Transportation