Embed Size (px)
Citation preview
1
AUTHORS NAME – Deepak Kumar Upreti
GUIDE NAME – Prof. B. C. Joshi
Physics Department
S. S. J. Campus,
Kumaun University Almora
2
KEYWORDS
Fluorescence, Emission Spectra, Absorption spectra, Energy transfer, Rare earths, Phosphate glass, Dyes, Polymer, dipole‐dipole interaction, dipole‐quadrupole interaction etc.
3
CERTIFICATE
This is to certify that the thesis entitled “Sensitized
luminescence in ultraviolet and visible excited phosphors
doped with rare earth ions and phosphors doped with dyes”
submitted by Mr. Deepak Kumar Upreti for the award of Ph.D.
degree in Physics is the outcome of his own bonafide work.
He has carried out the research work under my supervision
and has put in the required attendance under Para (ii) of the
ordinances, in the Department of Physics, Kumaun University,
S.S.J. Campus, Almora while supplicating for the Ph.D. degree.
(Prof. B. C. Joshi)
Department of Physics
Kumaun University
S.S.J. Campus
Almora- 263601
Uttarakhand (India)
4
ACKNOWLEDGEMENT
At the foremost, I wish to express my deep sense of gratitude to my
parents Sri Basav Datt Upreti and Smt.Puspa Upreti and Smt. Chandra Upreti
(Tai ji) who took great pains for my education, bringing me to the present stage,
their continuous support for my research activities and patience during the
course of the work.
I am indebted to my supervisor Prof. B.C. Joshi, Head, Department of
Physics, Kumaun University, Uttarakhand (India) for perpetual guidance and
everlasting inspiration throughout the progress of the research work presented
in the thesis. He always made my problem simpler. I hope his guidance and
blessing will support me to face the challenges of the life.
Thanks are due to Prof. K.L. Shah, Prof. M.C. Durgapal, Dr. O.P.S. Negi,
Dr. P.S. Bisht in the Department of Physics, S.S.J. Campus Almora, Dr. Sanjay
Pant, Dr. Bimal Pandey in the Department of Physics, D.S.B. Campus Nainital
for their fullest co-operation, suggestions and moral support during present
work.
I acknowledge special thank to Prof. Kavita Pandey, former Head,
Department of Physics, Kumaun University Nainital and Prof. M.C. Pant former
Head, Department of Physics, S.S.J Campus Almora for their encouragement
and moral support.
I also express my gratitude to Mr. K.P. Pandey (mama ji), Mrs. Pratibha
Pandey (mami ji), Pooja, Sonu, Payal and Gaurav providing the family like
5
facilities at Almora during the research work. Without whom the work was not
possible for me.
I thanks to Mr. R.S. Rayal, Mr. J.C. Upadhayay, Mr. Heera Singh
Kharayat, Mr. Nailwal, Mr. Joga Ram and Mr. Rajendra Singh Rana the non-
teaching staff of the Physics department S.S.J. campus Almora for their help as
required during the research work.
It gives me pleasure to express my special thanks to Dr. Rajiv Lohani, Dr.
C. C. Dhondiyal, Dr. Dinesh Yadav, Gaurav Pant, Rakesh Pandey, Dr. B. B.
Bhatt, Bhawana Khulbey, Mrs. Pratibha Fuloria, Gaurav, Chandrashekhar,
Puspa, Himanshu, Jagat, Neeraj, Ranjan and Kanchan, for their help &
suggestion during the work. Friendly cooperation of all the members of research
group of Photophysics lab, Kumaun University, Nainital is also gratefully
acknowledged.
All the teaching and non-teaching staff of Govt. P.G. college Dwarahat
are gratefully thanked for their help and suggestion during the research work.
Not getting words for expressing my sentiments to my loving sister
Kusum whose support is to me from the bed of hospital in serious condition.
At Last but not least I would like thank to almighty God for giving me
strength and determination needed for the successful completion of the work
presented in this monograph.
DATE: (DeepakKumar Upreti)
S.S.J.Campus, Almora
6
PREFACE
The luminescence of rare earth ions in glass has been subject of
interest since the advent of lasers, because unlike other luminescence
centers, in glasses, sharp bands occur under proper excitation. Since in the
RE earths ion the electronic transitions occur within the inner shielded 4-f
electron, their spectroscopic properties are not influenced by their
surroundings and therefore generally shift in emission bands do not occurs
in glass of varying nature.
The interaction among rare earth ions as well as with other ions (like
UO2++, Mn2+ etc.) doped in different crystals or glasses or solution causes
the transfer of excitation energy of one ion to another ion. Such interactions
thus help in increasing the emission of the acceptor ion. Glasses are known
to be non-crystalline solids. In the development of RE doped optical device,
the choice of the host glass matrix is very important factor to be considered.
The choice of suitable glass former and glass modifier system help to meet
the specific requirement.
Such an energy transfer between rare earth ions to rare earth ions
find wide application in sensitizing solid state and glass lasers, infrared
quantum counters as well as in infrared to visible converters.
Interest has been spurred both by the special spectral characteristics
of the dyes and by their wide range of applications. Polymers appropriately
doped with dye molecule, emitting in the visible spectrum provide stable
7
sources of light for displays and illumination sources at a significantly lower
cost than semiconductor. Organic light emitting diodes may indeed evolve as
the most inexpensive alternatives to fluorescent light sources. Polymer fibers
doped with organic dyes have proved to be potential candidate for use in
fiber lasers and fiber amplifiers media of holographic recording and
permanent optical memory, solar energy converters etc.
In the present work, the study of emission and optical interaction
(energy transfer) between various pairs of RE ions as well as the emission
and absorption spectra of dyes doped polymer has been made. The work
was carried out in the physics laboratory of, S. S. J. Campus, Almora and in
the D.S.B. Campus Kumaun University, Nainital. The work has been
presented in six chapters.
Chapter 1 contains a review of spectroscopic properties of rare earth
elements, the mechanism of energy transfer and relaxation processes in
rare earth elements. Along with these a comparison between properties of
glasses and crystals and optical properties of rare earth ions in glasses and
crystals has been also discussed. The origin of molecular spectra and
broadness of molecular spectra has been discussed. Brief discussion on
dyes doped in polymer has also been taken.
Chapter 2 contains the details of the chemicals used, their
composition and methods of preparation of samples. The experimental
procedure and apparatus used to study the fluorescence spectra, absorption
spectra; fluorescence decay time measurement of various samples is also
included.

8
Chapter 3 contains the three series Tb3+-Nd3+, Tb3+-Er3+and Tb3+-Pr3+
in zinc phosphate glass for an investigation of energy transfer. In all the
above mentioned system Tb3+ is taken as sensitizer (donor) and Nd3+, Er3+,
Pr3+ are taken as activator (acceptor). Fong-Deistler theory is used to find
the multipolar term responsible for the energy transfer mechanism. The
energy transfer mechanism in Tb-Nd systems is explained using cross
relaxation. The linear dependence of energy transfer probability vs square of
acceptor + donor concentration shows the electric dipole-dipole interaction in
the above mentioned systems. The average donor-acceptor distance (DD→A),
energy transfer probability (Pda), transfer efficiency (η) has been computed
for all the three above mentioned systems.
Chapter 4 describes the study of energy transfer in Sm-Sm, Sm-Eu
and UO2-Er systems in zinc phosphate glass. The nature of energy transfer
between them, energy levels involved in energy transfer, the mechanism of
energy transfer as well as the multipolar term responsible for the transfer
have been discussed. Various parameters necessary for quantitative study
have been also calculated. The quenching of Sm3+ ions is also discussed.
Chapter 5 contains Dy-Pr and Tm-Er system in zinc phosphate glass
for the study of energy transfer. Various parameters necessary for
quantitative study i.e. donor-acceptor distance, energy transfer efficiency
and energy transfer probability have been also calculated. The electric
dipole-dipole interaction is mainly found to be responsible for the energy
transfer.
9
Chapter 6 contains the study of emission and absorption spectra of
different dyes. Spectroscopic parameter such as molar extinction coefficient,
oscillator strength etc. have also been calculated from emission and
absorption spectra of various dyes doped in polymers. A dye series of
fluorescein and erythrosin B is presented for the study of energy transfer.
Critical transfer distance, reduced concentration and overlap integral are
calculated for the series.
The work published during the period of study has been listed in the
Appendix.
10
Chapter1: Introduction Page No.
1.1 General introduction 1 1.2 Rare earth elements 2 1.3 Energy levels of rare earth ions 3 1.4 Spectroscopic properties of rare earth ions 7
1.4. A) Forced electric dipole transitions
1.4. B) Magnetic dipole transitions
1.4. C) Electric quadrupole transitions
1.5 Excitation and relaxation processes in rare earth ions 9 1.5. A) Radiative decay 1.5. B) Non-radiative decay 1.5. B.1) Forester theory 1.5. B.2) Dexter theory 1.5. B.3) Inukuti and Hirayama theory 1.5. B.4) Peterson and Bridenbaugh theory 1.5. B.5) Fong-Diestler theory
1.6 Multiphonon relaxation 17 1.7 Energy migration 22 1.8 Structure of the glasses 23 1.9 The rare earth ions in glasses and crystal: 25
Properties and Applications 1.10 Molecular spectra 29 1.11 Dyes 30 1.12 Dyes doped in polymer 31 1.13 Polymer structure and classification 32 1.14 Polymer synthesis 34 1.15 Energy transfer probabilities and efficiencies 38 1.16 Objective of the work 41 Bibliography
Chapter2: Experimental techniques
2.1 Introduction: 59 2.2 Choice and preparation of materials 60
2.2. A) chemicals 2.2. B) glass composition & preparation 2.2. C) glass series 2.2. D) polymer compositions and preparation 2.2. E) polymer series doped with dyes

11
2.3 Absorption spectroscopy 64 2.4 Fluorescence spectroscopy 64 2.5 Fluorescence decay time 66
Bibliography
Chapter3: Study of Sensitize luminescence and energy transfer process in Tb-Nd, Tb-Er and Tb-Pr systems in zinc phosphate glass
3.1 Introduction: 75 3.2 Experimental materials and methods 77 3.3 Theory 78 3.4 Results and discussion 86
3.4. A) The Tb-Nd system 3.4. B) The Tb-Er system 3.4. B) The Tb-Pr system
3.5 Concluding remark 96 Bibliography
Chapter4: Study of sensitize luminescence and energy transfer process in Sm-Sm, Sm-Eu and UO2-Er systems in zinc phosphate glass
4.1 Introduction: 122 4.2 Experimental materials and methods 125 4.3 Theory 126 4.4 Results and discussion 135
4.4. A) The Sm-Sm system 4.4. B) The Sm-Eu system 4.4. B) The UO2-Er system
4.5 Concluding remark 142 Bibliography
Chapter5: Study of sensitize luminescence and energy transfer process in Dy-Pr and Tm-Er systems in zinc phosphate glass
5.1 Introduction 167 5.2 Experimental materials and methods 169 5.3 Theory 170 5.4 Results and discussion 172
3.4. A) The Dy-Pr system 3.4. B) The Tm-Er system
5.5 Concluding remark 177 Bibliography
12
Chapter6: Study of emission and absorption spectra of some dyes doped in polymer and study of process of energy transfer from fluorescein to erythrosin-B in poly vinyl alcohol
6.1 Introduction 196 6.2 Experimental materials and methods 197 6.3 Theory 198 6.4 Molecular structure of dyes 202 6.5 Results and discussion 204
1) Emission and absorption spectra of different
dyes doped in polymer 2) Study of energy transfer from fluorescein to
erythrosin B in Poly vinyl alcohol (PVA). 6.6 Concluding remarks 206
Bibliography
APPENDIX

13
CHAPTER 1 INTRODUCTION
14
CHAPTER 1
INTRODUCTION
1.1 GENERAL INTRODUCTION:
The spectroscopy referred to a branch of science in which light (i.e.
visible radiation) is resolved into its constituent component wavelength to
produce spectra. Spectroscopy has proved powerful tool for qualitative and
quantitative analysis. The meaning of spectroscopy has become broadened
to include studies not only with light but also with other types of
electromagnetic radiation such as x-ray, ultraviolet, infrared, microwave and
radio-frequency radiation.
The processes in which a molecule or atom, when undergoes a
transition from a state of high energy to a state of low energy state emits the
excess energy as photon is called Luminescence. Luminescent materials,
also called phosphors are a substance which converts certain type energy
into electromagnetic radiation over and above thermal radiation. The
electromagnetic radiation emitted by a luminescent material is usually in the
visible range, but can also be in other spectral regions.
In some cases, it useful to sensitize the luminescence centre with the
help of some other atoms / ions (donors or sensitizers), which when excited
transfers its excitation energy to the atoms/ions under study (acceptor or
15
activator) and consequently the emission efficiency of the acceptor is
enhanced. This process is celled sensitization and the luminescence is
termed as sensitized luminescence.
1.2 RARE EARTH ELEMENTS:
Rare earth (RE) elements comprise two interesting group of
chemical elements characterized by the presence of f-electron in
configurations giving rise to their optical spectra. Two series are the
lanthanides, ranging from lanthanum (La, Z=57) to lutetium (Lu, Z=71) and
the actinides, ranging from actinium (Z=89) to lawrencium (Z=103)
(Fig.1.1).Both of the series are characterized by partially filled 4f or 5f shell in
their ground state respectively [1].
Lanthanides are usually found in tripositive ions and possesses xenon
like electronic configuration i.e. 1s2,2s22p6,3s23p63d10,4s24p64d10,5s25p6.
The electron configuration of the trivalent lanthanides, which tend to be most
stable in solid hosts is (Xe)4fN with N=0 for lanthanum to N=14 for lutetium,
where (Xe) is electron structure of Xenon. Thus the ground electronic
configuration of these ions is 4fN and first excited ion configuration is 4fN-15d.
It is principally the properties of the trivalent ions which are important rather
than those of neutral atoms. Most of the rare earth elements can also be
stabilized in the divalent state appropriate host by the use of special growth
and post growth treatments [2].
The actinides have properties similar to those of lanthanides but as 5f
orbits are more exposed to the external field and the levels are easily

16
disturbed. Most of the actinides are highly radioactive hence their uses are
limited .The term RE will be used to denote only the lanthanides series in our
study. Because of their special spectroscopic properties and various
industrial applications, the rare earths have become one of the most
extensively studied groups of elements in the periodic table (Fig1.1)
1.3 ENERGY LEVELS OF RARE EARTH IONS:
The positions of energy levels arise from a combination of the
Coulomb interaction among the electrons, the spin orbit coupling and the
crystalline electric field [1]. The resultant splitting of the 4fN configurations
are shown schematically in Fig.1.2. The electrostatic interaction (Coulomb
interaction) yields terms 2S+1L with the separations of order of 104 cm-1. The
spin –orbit interaction (spin orbit coupling) then splits these terms into J
states with typical splitting of 103 cm-1. Finally, the J degeneracy of free ion
states is partially or fully removed by the crystalline stark field, yielding a
stark manifold usually extending over several hundred cm-1.
Fig.1.3 (energy level diagram) shows the location of the J states of
the trivalent rare earths. The order and the separation of within the J
manifolds vary, however small from host to host.
Dieke [2] and Wybourne [1] successfully solved the complex energy
level structures of the rare earths using tensor operator techniques and
crystal-field theory. The free ion states, obtained by diagonalizing the
combined electrostatic and spin-orbit matrices, are linear combination of
Russell-Saunders sates of the form
17
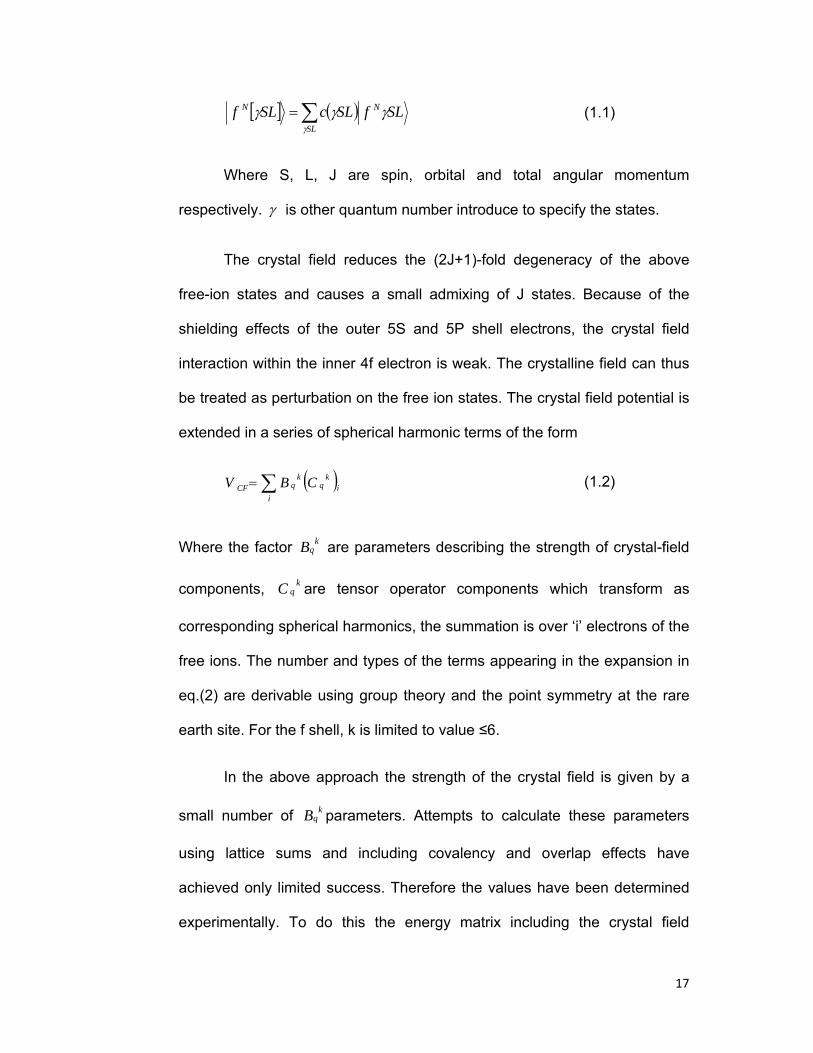
[ ] ( ) SLfSLcSLf N
SL
N γγγγ∑= (1.1)
Where S, L, J are spin, orbital and total angular momentum
respectively. γ is other quantum number introduce to specify the states.
The crystal field reduces the (2J+1)-fold degeneracy of the above
free-ion states and causes a small admixing of J states. Because of the
shielding effects of the outer 5S and 5P shell electrons, the crystal field
interaction within the inner 4f electron is weak. The crystalline field can thus
be treated as perturbation on the free ion states. The crystal field potential is
extended in a series of spherical harmonic terms of the form
( )∑=i
ik
qk
qCF CBV (1.2)
Where the factor kqB are parameters describing the strength of crystal-field
components, kqC are tensor operator components which transform as
corresponding spherical harmonics, the summation is over ‘i’ electrons of the
free ions. The number and types of the terms appearing in the expansion in
eq.(2) are derivable using group theory and the point symmetry at the rare
earth site. For the f shell, k is limited to value ≤6.
In the above approach the strength of the crystal field is given by a
small number of kqB parameters. Attempts to calculate these parameters
using lattice sums and including covalency and overlap effects have
achieved only limited success. Therefore the values have been determined
experimentally. To do this the energy matrix including the crystal field
18
interaction is diagonalzed using an estimated set of starting parameters. The
resulting predicted energy levels are compared with observed levels and, by
an iterative fitting procedure, the parameters are adjusted to obtained best
overall fit to experiment. When the positions of many levels have been
measured, and the site symmetry is high so that only a few terms appear in
the expansion in eq. (2), root mean square deviations of observed and
calculated energies as small as 10 cm-1 have been obtained.
The crystal-field parameters have also been interpreted using a
superposition model proposed by Newman [3]. The field is assumed to arise
from a sum of independent contributions from the other ions in the crystal.
Once the crystal-field parameters for an ion-host system have been
determined, a complete set of energy levels and eigenstates can be
computed. These state can labeled by an additional crystal quantum number
µ and are of the form
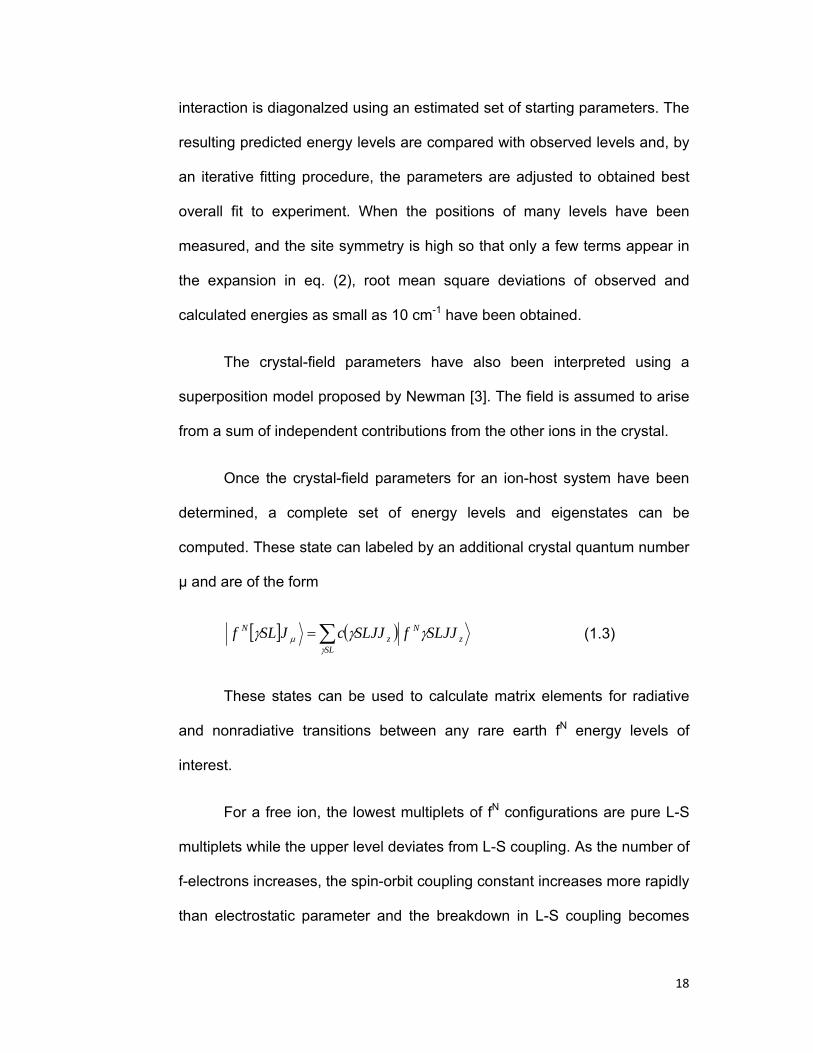
[ ] ( ) zN
SLz
N SLJJfSLJJcJSLf γγγγ
µ ∑=
(1.3)
These states can be used to calculate matrix elements for radiative
and nonradiative transitions between any rare earth fN energy levels of
interest.
For a free ion, the lowest multiplets of fN configurations are pure L-S
multiplets while the upper level deviates from L-S coupling. As the number of
f-electrons increases, the spin-orbit coupling constant increases more rapidly
than electrostatic parameter and the breakdown in L-S coupling becomes

19
greater. The density of the levels plays an important role in the breakdown of
L-S coupling. For the dense levels, the average spacing between levels of
same total angular momentum (J) decreases resulting in mixing in of spin-
orbit interaction of same J but with different L-S. This fact improves the
energy level scheme of fN configuration. Such as 4fN-15d or 4fN-15g further
improves the energy level scheme. Other interactions such as orbit-orbit and
spin-orbit and spin-other orbit in fN shell should be considered for precise
treatment of the calculation of energy levels of a rare earth atom [4].
The energy levels of free rare ions is (2J+1) fold degenerate, because
there exists a spherical symmetry, while in perturbing medium such as
crystal field it reduces the (2J+1) fold degeneracy. This causes the small
admixing of J state [5]. Because of the shielding effects of the outer 5s and
5p shell electrons, the crystal field interaction with inner 4f electron is weak.
The crystal can, thus be treated as perturbation on the free ion states. The
crystal field is essentially electrostatic and that the magnetic field in the
crystal is negligible is explicitly exhibited by the fact that in all the ions with
odd electrons the crystal levels retain an ultimate double degeneracy
(Kramer’s degeneracy) which is removed by external magnetic field. These
results were solely supported by experimental evidences obtained by Bethe
and Kramer. Once the crystal-field parameters for a given ion host system
have been determined, a complete set of energy levels and eigen states can
be computed. However, the locations of higher lying configurations are not
well established because most of the levels are at energies beyond the
readily accessible optical region and above the fundamental absorption edge

20
of many materials. For 5d states there is a strong interaction between outer
5d states and the static and dynamic crystal fields. As a consequence, the
locations of 5d states vary by many thousands of cm-1 in different materials
and the optical transitions have line widths.
1.4 SPECTROSCOPIC POPERTIES OF RARE EARTH IONS:
The optical absorption spectrum of the RE ions from the UV to the
mid-infrared originates from transition between electronic states in the
partially filled 4f orbital [2] shielded by filled 5s and 5p shells. These partially
filled shells of f electron give rise narrow a localized electronic transition that
occurs not only in visible parts of the electromagnetic spectrum but also in IR
and ultraviolet region. The electronic transitions between fN configuration,
which are responsible for the crystal spectra are all, in principle strictly
forbidden as electric dipole transitions. This is because the parity of
wavefunction of electrons does not change. This is true for the free ion. The
parity prohibition can be lifted only by the influence of the crystal lattice,
which leads to a mixing of states of opposite parity.
The absorption at low temperature takes place from the lowest stark
component of the ground state to various stark components of excited state.
The fluorescence spectrum arises due to the transitions from an excited
state of an ion to a lower state. Sometime the emission takes place from
more than one excited state, the terminal state may be the ground state or
any other higher state. At very low the temperatures the fluorescence
originates from lowest stark component of excited state. At higher
temperature the higher stark components becomes populated according to
21
Maxwell-Boltzman law and these states may also participates in absorption
and fluorescence.
The presence of lines in the spectra of RE ions in crystal may be due
to one or more of following mechanism [6, 7]
1. Forced electric dipole transitions
2. Magnetic dipole transitions
3. Electric quadrupole transitions.
The transitions due to higher multipoles are negligible.
1.4. A FORCED ELECTRIC DIPOLE TRANSITIONS
According to Laporte’s selection rule the electric dipole transition
between f states are forbidden as these states have the same parity, while
electric dipole transition require a change of parity of the electron
wavefunction. But if rare earth ions are placed in a perturbing field such as
crystals, glasses or solutions, which generally lacks a centre of symmetry,
which causes the wave functions to be of mixed parity because of interaction
of 4fN level with the remote states of opposite parity such as 4fN-15d or 4fN-
15g.
1.4. B MAGNETIC DIPOLE TRANSITIONS:
Magnetic dipole transitions can only take place between
components of the same L-S coupling multiplets (∆L=0&∆S=0) for which
∆J=0 or ±1 with J=0 ↔ J=0. ∆J= ±1 indicates transition between
neighboring multiplet components and ∆J=0 has a meaning only in an

22
external field. These transitions are not forbidden by the presence of a
centre of symmetry in the environment around the ion and are therefore
allowed between the states of same parity. When the lanthanide ion is
placed in a centre of symmetry, only MD transitions are possible. The
magnetic dipole transitions may thus be expected for many lines and also
been confirmed by experimental data.
1.4. C ELECTRIC QUADRUPOLE TRANSITION:
Selection rule for parity allowed electric quadrupole transition
between fN states are ∆S=0 and both ∆L & ∆J ≤2.The probabilities of these
transitions are usually several orders of magnitudes smaller than those for
dipole processes some transitions having distinctive polarization and angular
dependence have considerable intensities.
1.5 EXCITATION AND RELAXATION PROCESSES IN RARE EARTH
ELEMENTS:
Paramagnetic ions in solids can be treated as isolated ions only
when they are well separated. As concentration is increased or if non-
random distribution occurs, the ion spacing may become sufficiently small
for ions to interact. Such ion-ion interaction is important in the operation of
lasers and other fluorescence devices. When an ion (donor) is excited into a
metastabe state (level), the excited ions may relax to ground state as follows
(a) Luminescence from sensitizer (S).
(b) Radiationless decay in sensitizer (S).

23
(c) Energy transfer from sensitizer (S) to another centre of type
sensitizer (S)
and
(d) Energy transfer from sensitizer (S) to activator (A).
Fig.1.4 shows a host lattice in which a sensitizer (S) and an
activator (A) are presented. In this scheme, four different processes can be
distinguished after excitation of S.
The relaxation of RE ions in excited electronic states includes:
(1) Radiative decay [8]
(2) Nonradiative decay [9] - which is again classified as:
(a) Non radiative decay wherein the excitation energy is converted
into vibrational quanta of surrounding. (i.e. ion – lattice interaction or
multiphonon emission).
(b) Non radiative transfer of energy between like and unlike ions
with possible degradation of excitation energy. (i.e. ion- ion interaction or
cooperative phenomenon).
1.5. A RADIATIVE DECAY:
When rare earths ion changes their electronic state by absorbing or
emitting photon, the optical transition is called radiative decay. Electric
dipole-dipole (EDD) interaction is dominantly responsible for the radiative
decay of rare earth ions. Magnetic dipole (MD) and electric quadrupole (EQ)
are allowed but their contributions are generally small and negligible.

24
Radiative decay may take place as follow
(A) Radiative energy transfer between likes ions with possible
degradation of
excited energy by emission of photons (Phosphorescence).
(B) Radiative energy transfer between unlike ions by ED,MD and QD
interactions.
The radiative energy transfer process also called trival process
occurs merely by the absorption of photons emitted by donors. The
radiative transfer is easily treated by measuring the absorption and
emission characteristics of ions involves. Radiative transfer rate depends
on the number of ions between the excited volume and the absorber and
their emission or absorption strength [8].
1.5. B NON-RADIATIVE DECAY:
The non-radiative transfer from donor to acceptors depletes the
population of excited state of the donor and decreases the intensity and
lifetime from the excited state to lower state [10]. In order that the transfer is
significant and measureable, the rate of energy transfer must be of the same
order of magnitude as the radiative transition in donor ion. The non-radiative
transfer can be subdivided into following three categories [11]
(i) Multipolar resonance,
(ii) Multipolar transfer, and
(iii) Non-resonant energy transfer.
25
In the simple case of two ions each with one excitable electronic
state separated from its electronic ground state by nearly equal energy and
coupled by suitable interaction between two electron system, the excitation
will jump from one ion to another before one is able to emit a quantum of
fluorescence. The mutual interaction is the Coulomb interaction between two
ions and the process is known the non-radiative transfer of energy from
donor to acceptor ions. In early attempts Perrin [12] formulated a classical
theory of excitation energy transfer between molecules in solutions. Transfer
distances of more than 100Å were predicted by this theory. Other attempts
are as follows
1.5. B.1) FORSTER THEORY:
Forster [13] first treated the problem by quantum mechanically by
considering the dipole-dipole interaction assumed that the interaction
between two well separated ion is strongest if for both the ion’s electric
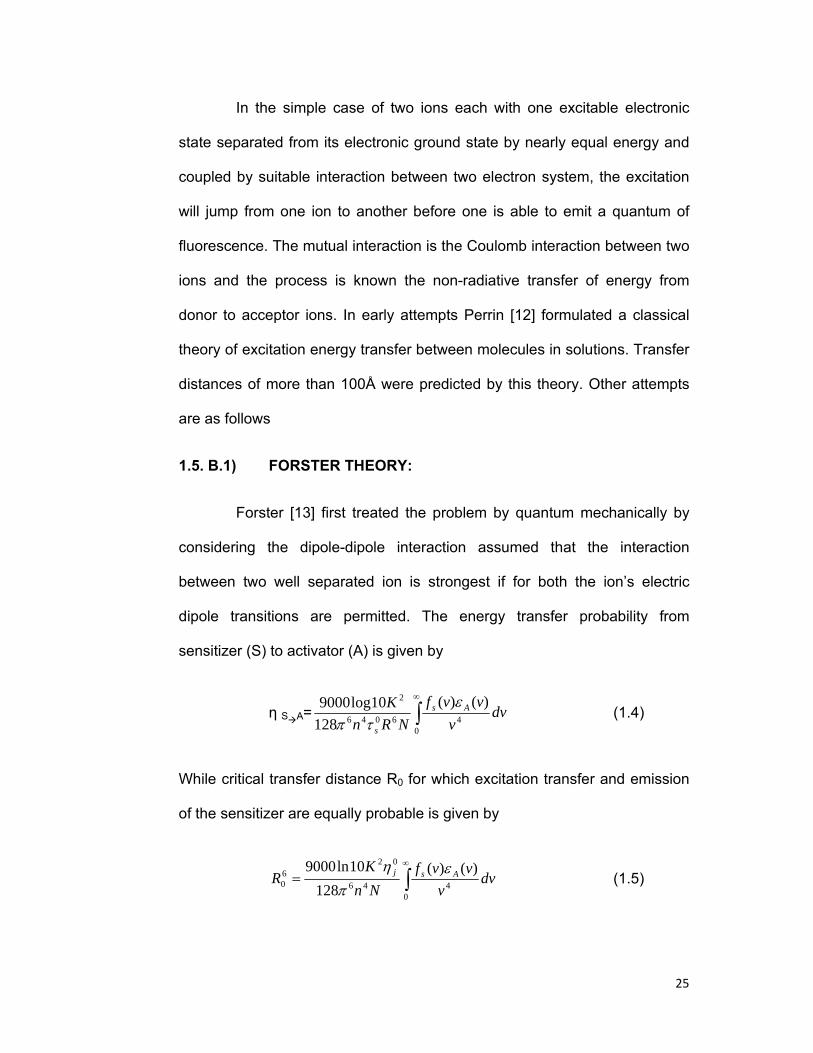
dipole transitions are permitted. The energy transfer probability from
sensitizer (S) to activator (A) is given by
η S A= ∫∞
046046
2 )()(128
10log9000 dvv
vvfNRn
K As
s
ετπ
(1.4)
While critical transfer distance R0 for which excitation transfer and emission
of the sensitizer are equally probable is given by
∫∞
=0
446
0260
)()(128
10ln9000dv
vvvf
NnK
R Asj επ
η (1.5)

26
Where v is the wave number f ( v ) is the spectral distribution of
fluorescence(measured in quanta and normalized to unity on a wave no.
scale). )(vAε is the molecular decade extinction coefficient, N is the avogadro
number, n is the refractive index of the host matrix, R is the distance
between molecules and 0sτ is the radiative lifetime of the excited sensitizer,
K is a constant that depends on a mutual orientation of two doped molecules
and 0jη is the donor fluorescence quantum yield in the absence of acceptor.
Therefore the transfer probability can be written as
6
00
1⎟⎠⎞
⎜⎝⎛=→ R
R
SAS τ
η (1.6)
This shows R -6 dependence of the transfer rate.
1.5. B.2) DEXTER THEORY:
Dexter [14] extended Forster’s theory and includes the case of
forbidden transition moments in donors and acceptors. However his theory is
applicable to rigid media only. He considered the following cases:
(i) Electric dipole-dipole (d-d) interaction - This is simply a
repetition of of Forster’s results and predicts a R-6
dependence of the transfer rate
(ii) Electric dipole-quadrupole (d-q) interaction – In this case the
transfer rate varies as R-8 and may give rise to sensitization
upto 102 lattice site.
27
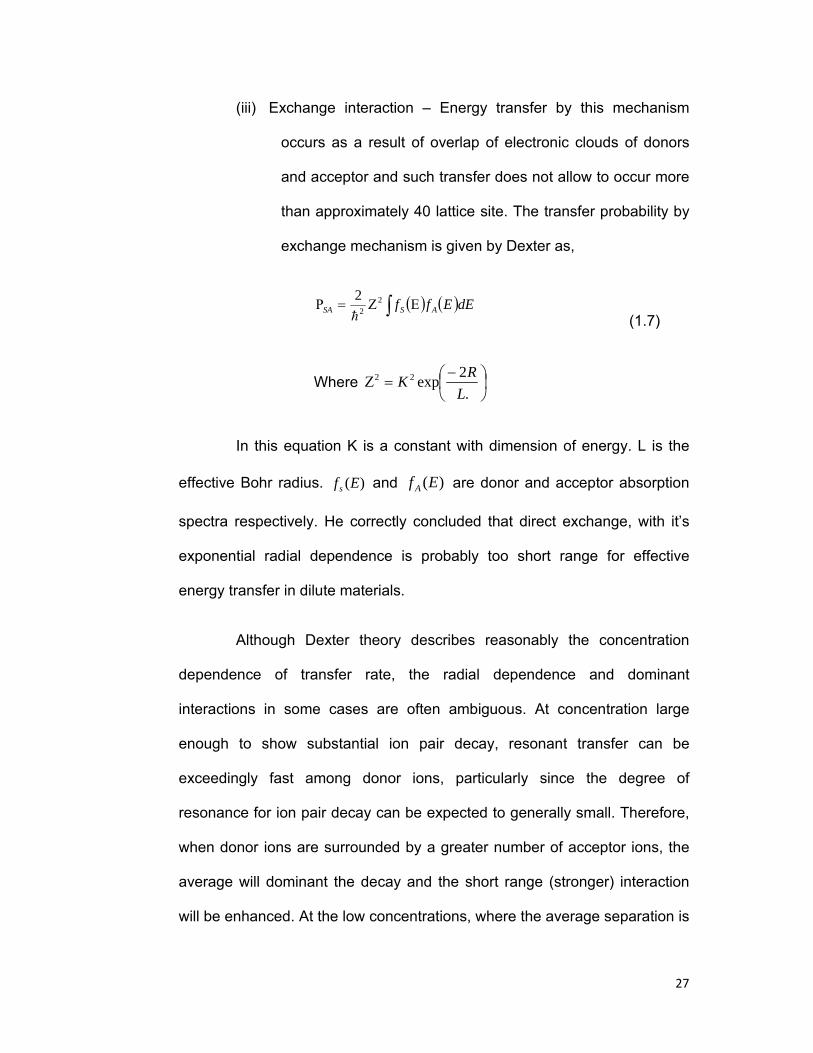
(iii) Exchange interaction – Energy transfer by this mechanism
occurs as a result of overlap of electronic clouds of donors
and acceptor and such transfer does not allow to occur more
than approximately 40 lattice site. The transfer probability by
exchange mechanism is given by Dexter as,
( ) ( )dEEff ASSA ∫ ΕΖ=Ρ 2
2
2h (1.7)
Where ⎟⎠⎞
⎜⎝⎛ −=Ζ
.2exp22
LRK
In this equation K is a constant with dimension of energy. L is the
effective Bohr radius. )(Efs and )(Ef A are donor and acceptor absorption
spectra respectively. He correctly concluded that direct exchange, with it’s
exponential radial dependence is probably too short range for effective
energy transfer in dilute materials.
Although Dexter theory describes reasonably the concentration
dependence of transfer rate, the radial dependence and dominant
interactions in some cases are often ambiguous. At concentration large
enough to show substantial ion pair decay, resonant transfer can be
exceedingly fast among donor ions, particularly since the degree of
resonance for ion pair decay can be expected to generally small. Therefore,
when donor ions are surrounded by a greater number of acceptor ions, the
average will dominant the decay and the short range (stronger) interaction
will be enhanced. At the low concentrations, where the average separation is

28
large, the longer range interactions such as electric dipole-dipole will be
dominant. Thus in a given material, different interaction will dominant for
different concentration ranges.
1.5. B.3) INOKUTI AND HIRAYAMA THEORY:
In the Dexter’s theory it was assumed that luminescence was
dominated by the transfer to the nearest acceptor ion .An extension of the
entire environment including dynamics of the transfer was formulated by
Inokuti & Hirayama [15].
The emission intensity of the donor decays as a result of
electrostatic multipolar interactions with acceptors, when donor & acceptor
ions are randomly distributed and the donor ions are excited by a flash light,
according to the following equation:
( ) ( )⎪⎭
⎪⎬
⎫
⎪⎩
⎪⎨
⎧
⎟⎟⎠
⎞⎜⎜⎝
⎛⎟⎠⎞
⎜⎝⎛ −Γ−−=
StCC
Stt
3
000
31exp0ττ
φφ (1.8)
Where C is the concentration of acceptor, C0 is the critical transfer
concentration.τ0 is the donor decay time in the absence of acceptor and
s=6, 8, 10 corresponding to EDD, EDQ& EQQ interaction between donor &
acceptor respectively. The Inokuti-Hirayama theory also treats the direct
exchange interactions. Where the decay function is given by:
where( ) ( ) ( )
LR
tgCCtt
0
00
3
0
2
expexp0
=
⎭⎬⎫
⎩⎨⎧
⎟⎟⎠
⎞⎜⎜⎝
⎛−−= −
γ
τγγ
τφφ
(1.9)

29
1.5. B.4) PETERSON AND BRIDENBAUGH EXPLAINATION:
The cooperative relaxation of rare earth ions can also occur by
following ways: [16, 17, 18, and 19]
1. Cross relaxation of energy between the same ions.
2. Cross relaxation of energy between different ions.
Cross relaxation of energy between the same ions is observed in
the concentration quenching of some rare earth ions which occurs due to the
production of pairs of the same ions. This mechanism of excited state
relaxation was first given Varsanyi and Dieke [20] and later by Peterson and
Bridenbaugh [21]. If a level ’A’ above a stable fluorescent level ‘B’ is
observed and the difference (A-B) is used for multiple phonon excitation. If
(A-B) becomes very large, the energy is not transferred directly from ‘A’ to
‘B’ and ‘A’ becomes a stable fluorescent level. On other hand, if (A-B)
approach the excitation energy of lower level of another ion of same species,
the transfer is again occurs, that is, fluorescence from ‘B’ is again observed.
The difference in energy (A-B) is then used to excite the second ion. In this
way the ion pair resonance causes to quench the fluorescence intensity
(Fig.1.5).

30
1.5. B.5) FONG-DIESTLER THEORY:
The problem of energy transfer by the use of many body interaction
mechanisms is given by Fong & Diestler [22]. According to which, at low
donor acceptor concentration the transfer rate per ion varies linearly with the
concentration and the transfer occurs by a pair wise (two body) interaction
.At higher concentration a higher order interaction mechanism can take
place. In general the per ion transfer rate PDA varies linearly with Cn-1 where
C is the concentration of the donor & acceptor ions and n determines the
order of the process.
1.6 MULTIPHONON RELAXATION:
Non radiative energy transfer between J states can occur by the
simultaneous emission of several photons sufficient to conserve the energy
of transition. These multiphonon processes arise from interaction of the rare
earth ion with fluctuating crystalline electric field. The crystal field at the ion
site is not static but undergoes oscillatory behavior due to the vibrations of
lattice or molecular group. For one phonon relaxation process, the energy
gap between the electronic levels of RE ion should be equal to the energy of
one phonon of the host matrix. If the energy gap is large compared to the
maximum energy of one phonon, then the relaxation can occur by emission
of several phonons of the host, simultaneously to conserve the energy [23].
Huang and Rhys [24] developed a single configuration coordinate
model based on the Franck-Condon principle. Which is extended to arbitrary
31
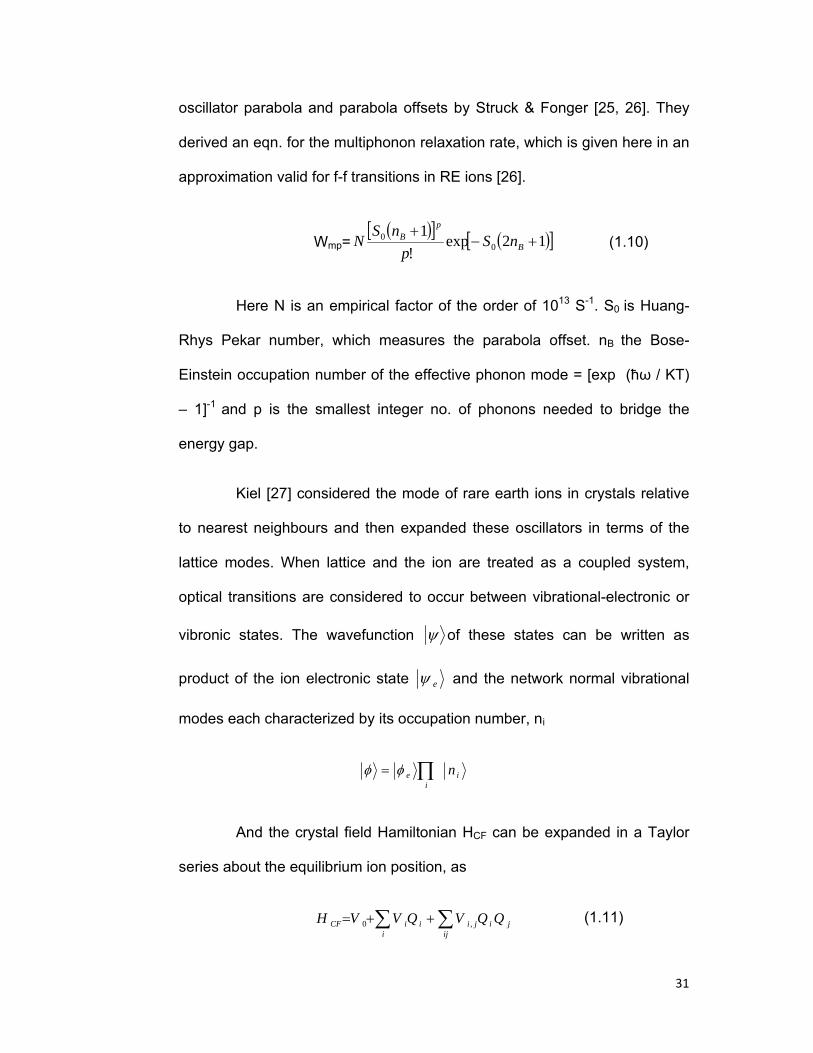
oscillator parabola and parabola offsets by Struck & Fonger [25, 26]. They
derived an eqn. for the multiphonon relaxation rate, which is given here in an
approximation valid for f-f transitions in RE ions [26].
Wmp=( )[ ] ( )[ ]12exp
!1
00 +−
+B
pB nSp
nSN (1.10)
Here N is an empirical factor of the order of 1013 S-1. S0 is Huang-
Rhys Pekar number, which measures the parabola offset. nB the Bose-
Einstein occupation number of the effective phonon mode = [exp (ħω / KT)
– 1]-1 and p is the smallest integer no. of phonons needed to bridge the
energy gap.
Kiel [27] considered the mode of rare earth ions in crystals relative
to nearest neighbours and then expanded these oscillators in terms of the
lattice modes. When lattice and the ion are treated as a coupled system,
optical transitions are considered to occur between vibrational-electronic or
vibronic states. The wavefunction ψ of these states can be written as
product of the ion electronic state eψ and the network normal vibrational
modes each characterized by its occupation number, ni
ii
e n∏= φφ
And the crystal field Hamiltonian HCF can be expanded in a Taylor
series about the equilibrium ion position, as
∑∑ ++=ij
jijii
iiCF QQVQVVH ,0 (1.11)
32
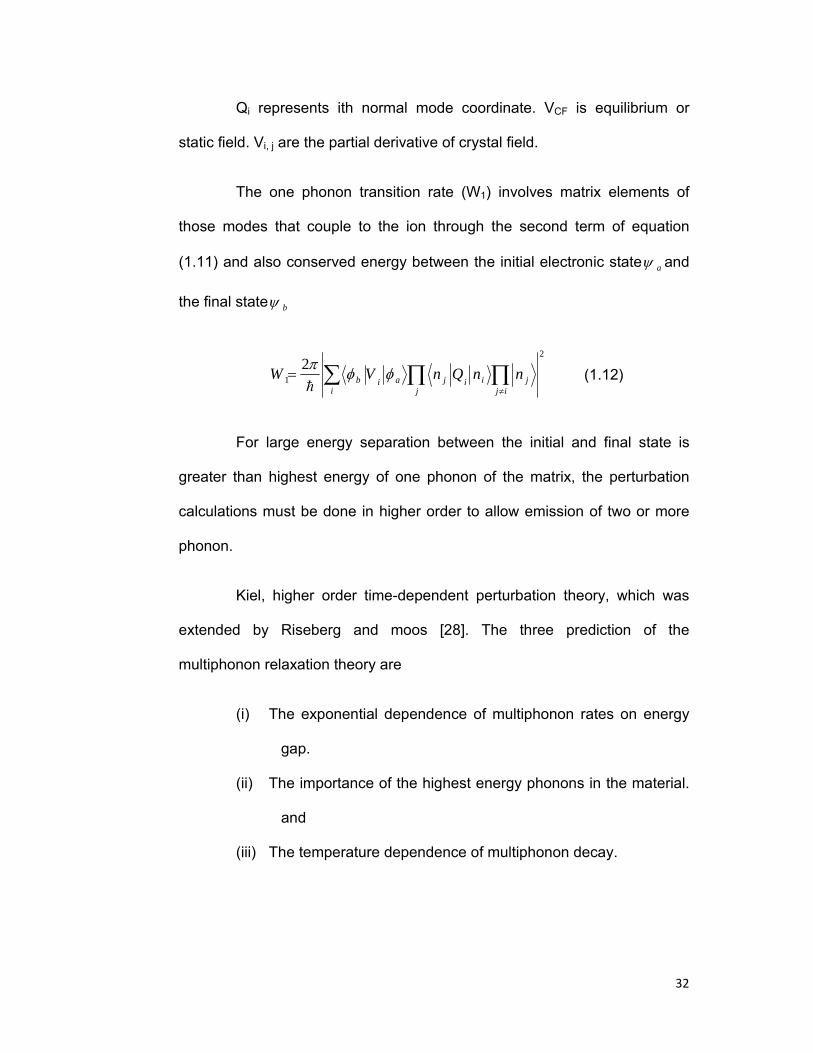
Qi represents ith normal mode coordinate. VCF is equilibrium or
static field. Vi, j are the partial derivative of crystal field.
The one phonon transition rate (W1) involves matrix elements of
those modes that couple to the ion through the second term of equation
(1.11) and also conserved energy between the initial electronic state aψ and
the final state bψ
2
12 ∑ ∏ ∏
≠
=i j ij
jiijaib nnQnVW φφπh
(1.12)
For large energy separation between the initial and final state is
greater than highest energy of one phonon of the matrix, the perturbation
calculations must be done in higher order to allow emission of two or more
phonon.
Kiel, higher order time-dependent perturbation theory, which was
extended by Riseberg and moos [28]. The three prediction of the
multiphonon relaxation theory are
(i) The exponential dependence of multiphonon rates on energy
gap.
(ii) The importance of the highest energy phonons in the material.
and
(iii) The temperature dependence of multiphonon decay.
33
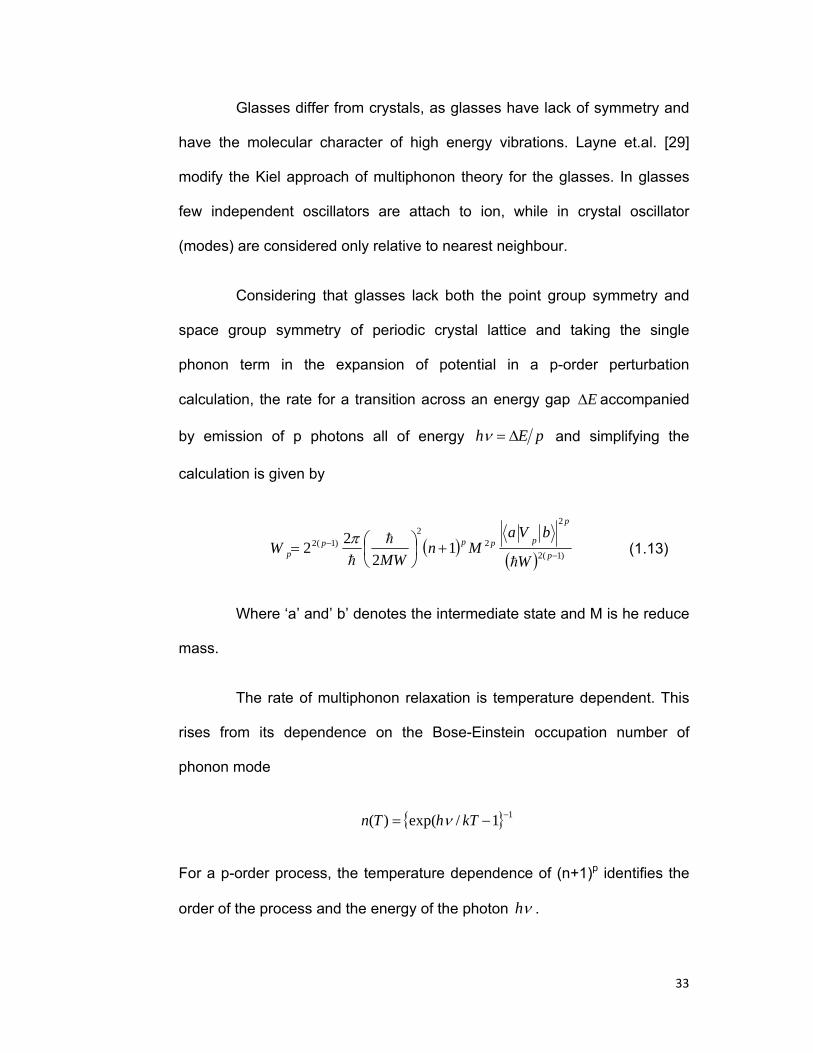
Glasses differ from crystals, as glasses have lack of symmetry and
have the molecular character of high energy vibrations. Layne et.al. [29]
modify the Kiel approach of multiphonon theory for the glasses. In glasses
few independent oscillators are attach to ion, while in crystal oscillator
(modes) are considered only relative to nearest neighbour.
Considering that glasses lack both the point group symmetry and
space group symmetry of periodic crystal lattice and taking the single
phonon term in the expansion of potential in a p-order perturbation
calculation, the rate for a transition across an energy gap E∆ accompanied
by emission of p photons all of energy pEh ∆=ν and simplifying the
calculation is given by
( )( ) )1(2
2
22
)1(2 12
22 −− +⎟
⎠⎞
⎜⎝⎛= p
p
ppppp W
bVaMn
MWW
h
h
h
π (1.13)
Where ‘a’ and’ b’ denotes the intermediate state and M is he reduce
mass.
The rate of multiphonon relaxation is temperature dependent. This
rises from its dependence on the Bose-Einstein occupation number of
phonon mode
11/exp()( −−= kThTn ν
For a p-order process, the temperature dependence of (n+1)p identifies the
order of the process and the energy of the photon νh .
34
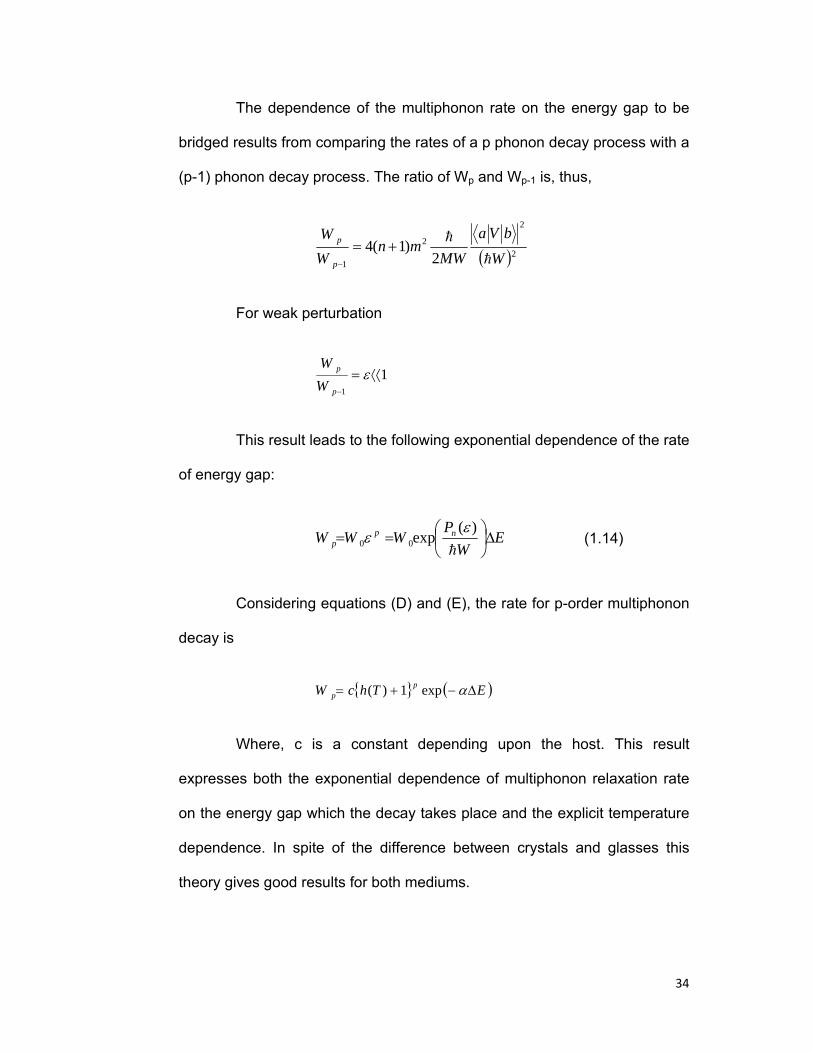
The dependence of the multiphonon rate on the energy gap to be
bridged results from comparing the rates of a p phonon decay process with a
(p-1) phonon decay process. The ratio of Wp and Wp-1 is, thus,
( )2
2
2
1 2)1(4
W
bVaMW
mnWW
p
p
h
h+=
−
For weak perturbation
11
⟨⟨=−
εp
p
WW
This result leads to the following exponential dependence of the rate
of energy gap:
EW
PWWW np
p ∆⎟⎠⎞
⎜⎝⎛==h
)(exp00
εε (1.14)
Considering equations (D) and (E), the rate for p-order multiphonon
decay is
( )EThcW pp ∆−+= αexp1)(
Where, c is a constant depending upon the host. This result
expresses both the exponential dependence of multiphonon relaxation rate
on the energy gap which the decay takes place and the explicit temperature
dependence. In spite of the difference between crystals and glasses this
theory gives good results for both mediums.
35
1.7 ENERGY MIGRATION:
Multiphonon relaxation and cooperative relaxation described in
above articles are one step processes involving resonant energy transfer
between donors and acceptors. Relaxation by energy migration is a
multistep process involving resonant energy transferred from one ion to
another of the same species in a random walk manner and finally to an
acceptor which acts as a quenching centre or energy sinks (Fig. 1.7).
Migration becomes increasingly dominant with the increasing RE content. In
concentrated materials or where the RE is a constituent of the host, the
probability for energy transfer between donor ions may be large. Rapid
energy diffusion can lead to a spatial equilibrium of excitation within the
donor system. The rate limiting step for the donor relaxation becomes either
the donor acceptor transfer rate or the acceptor relaxation rate. A simple rate
equation model for the donor system relaxation predicts a simple
exponential decay in the limit of fast diffusion.
When the rate of energy diffusion within the donor system is slow
but still comparable to the intrinsic decay rate, the donor decay is composed
of two competing processes (i) Excited donors near acceptors relax
predominantly by direct ion pair energy transfer (ii) Distant excited donors
first diffuse into the vicinity of an acceptor before relaxation occurs.
Yakoto & Tanimoto [30] obtained a general solution for the donor
fluorescence decay function including both diffusion within the donor system
& donor exception energy transfer. Experimental evidences from migration
36
of energy have been reported by a number of workers [31-34]. Weber [35]
used Yakota- Tanimoto equation to analyze his data to explain energy
transfer between Eu3+ and Cr3+ in phosphate glass. Another developed
technique for the observation of energy migration in rare earth systems
involves excitation with a narrow band laser in a system with significant
inhomogeneous broadening [36, 37]. In such a system excitation is
selective, involving only a narrow energy bands within the inhomogeneously
broadened system. A narrowed fluorescence signal is observed,
corresponding to emission by that class of ions that has excited. Migration
from these ions to other ions can then be studied by observation of the line
narrowed signal.
Many higher lying excited levels of rare earth ions give
luminescence in various crystalline matrices such as LaCl3 and CaF2 [38]
while these levels do not luminance in some glasses such as borate and
phosphate. Such a quenching of fluorescence of these levels occurs due to
the transfer of electronic excitation energy to the vibration of the surrounding
medium.
1.8 THE STRUCTURE OF THE GLASSES:
Though different in composition & structure, the common property of
all glasses is that they don’t nucleate during the process of cooling from
molten to rigid solid [39]. Like crystals, some glasses consist of a random
three dimensional continuous network of ions [40] and other contain like ions
whose locations are preferentially close to one another and not completely

37
random. Also, some glasses consist of regions of preferred structural group
[41], The chemical bonding forces within the group being stronger than those
between the groups even metals may be produced in the amorphous or a
microcrystalline state but this lack of crystalline structure does not put them
in the category of glasses .A rigid microcrystalline state is called a glass if on
heating it turns into a liquid in a reversible fashion [42].
According to the present theories of the glass structures, oxide
glass of our type chosen for our work are formed from networks of glass with
ions as B,P or Te, which are strongly linked by bridging oxygen ions. Distinct
structural units, such as BO4, PO4, SiO2 tetrahedral exist in glasses with
random orientation [43]. On adding network modifier, such as alkaline ions
(CaO, ZnO, BaO), break up the three dimensional network, thereby
introducing non-bridging oxygen ions. The MO4 tetrahedral (M=B or P) are
undistorted, since their covalent bonding strongly favours preservation of the
tetrahedral geometry. On other hand, the relative positions of the tetrahedral
can be changed in relation to RE ions.
Reisfeld et.al. [44] have proposed that the RE ion in glasses is
coordinated by four MO4 tetrahedra, each tetrahedral contributing two
oxygens to the coordinate with the rare earth (RE). Reisfeld et.al. [45] have
also shown that the behavior of RE ions in glasses is similar to that in
inorganic crystals of low symmetry except for the inhomogeneous
broadening of the spectra because of the site to site variation in crystal field
of the glass. According to their theory, a rare earth ion occupies the centre of
a distorted cube which is made of four tetrahedral of borate, phosphate or
38
silicate. Two oxygen belonging to such a tetrahedral, produce an edge of the
cube as shown in Fig.1.8. This model has been adopted for the present
study of the glass matrices chosen by us. The coordination of RE is such an
arrangement is eight oxygens. The site different can occur from the
existence of non-uniform, non-identical crystal field caused by slightly
different ranges of RE-oxygen distances. The average RE-oxygen distances
calculated by Reisfeld et.al. are 2.1Å and 2.2Å [46] for borate and phosphate
glass respectively. In these glasses, the symmetry is lower than cubic
symmetry.
The position of rare earth ion in borate or phosphate glass can be
assumed as shown in Fig. The RE ion is situated in a cube with eight oxygen
ions at the corners of the cube. Each edge of the cube is common to the
cube and tetrahedron. The cube is not a regular one, but is distorted by the
relative twisting of the tetrahedral which can be situated at angles other than
900 relative to each other [47]. Therefore a low symmetry Cs for the site is
formed. From the inhomogeneous broadening, we can conclude that while
this low symmetry is conserved for all the sites, the position of given site
relative to the surrounding oxygen may depend on the exact of the doped
rare earth ion the cube.
1.9 THE RARE EARTH IONS IN GLASSES AND CRYSTALS:
PROPERTIES AND APPLICATION
The properties of glasses differ from those of crystals and liquids.
The crystals have orders atomic structure, while liquids and glasses
39
possessing a degree of atomic disorder. In glasses (solids), the atom
maintains permanent positions with respect to the location of their
neighbours. Like liquids, glasses are good host matrices for the rare earth
ions.
The luminescence of rare earth ions in glass has been a subject of
renewed interest since the advance of Laser, because, unlike the other
luminescence centre, in glasses, sharp bands occur under the proper
excitation. Since in the RE ions the electronic transition occur among the
inner, shielded 4f-electron their spectroscopic properties are not greatly
influence by their surrounding, and therefore large shifts in emission bands
do not occur in glasses of varying nature [39].
With the upsurge of interest in the optical properties of ions in
glasses and crystals, trivalent rare earths ions have received wide attention
by virtue of their enormous technological applications in the field of
phosphors. There are some phosphors, which have good absorption
properties, but they emits in the undesired wavelength region. The
properties of such phosphors may be improved by the introduction of an
activator which can received energy from the emitting centre already present
and emit it in desired wavelength region. The narrow band absorption and
emission in lanthanides arise from parity forbidden weak transitions,
whereas the post transition group ions, such as Tl+, Pb2+,Sb3+,Sn2+, Bi3+,
generally correspond to emission of broad bands due to parity allowed
transitions. Other hand such as UO2++, Mn++ etc. have high fluorescence out,
even if involving weak transitions. All such ions may sensitize and increase
40
the population of the excited levels of lanthanides by one or two orders of
magnitude compared with the direct absorption of light into the rare earth
ions. The sensitized luminescence is not only useful in providing several
useful photoluminescence phosphors for florescent lamps, but also are of
immense important in improving laser efficiency, infrared quantum counters,
infrared to visible up-converters as well as luminescent solar concentrators
and optical fibers.
The emissions of RE ions in glasses are usually broad in
comparison to crystalline matrices due to different environment at different
rare earth sites which causes a variation in crystal field and, hence giving an
inhomogeneous broadening of the doped RE ion energy levels. Such an
inhomogeneous broadening of spectral bands in glasses is important in
study of energy transfer since these causes in the overlap between donor
and acceptor levels [48]. Also the phonon energy of glasses is higher [49],
which also help in increasing the energy transfer. It is, therefore, necessary
to have an insight in the structure of glasses and position of the doped ion in
the glass.
Due to lack of periodicity in the atomic arrangements, potential
luminescence centers may find themselves in a wide variety of energetically
different environment within a given glass. In general this leads to a
broadening of the luminescence bands compared to the branch of similar
centers in crystals [50]. The doped luminescent ions in glass donor exist as
a part of the glass structure by rearrangements of the constituent atoms.
41
The thermodynamic equilibrium doesn’t exist in glasses. While the
free energy of a glass is below to that of a super cooled liquid. It is higher
than that of its crystalline counterpart. However glass formation is not
dependent upon the difference in the free energies of the glass and crystals
[51]. The height of the energy barrier between the liquid and the crystalline
states at the liquid state temperature determine whether the liquid will revert
to a glass or to a crystal upon cooling .The energy relationships [51] are
shown schematically in Fig. 1.9. This plot of free energies as a function of
atomic structure locate glasses in a flat cavity, which means that a glass of a
given composition can exist in different energy states depending on its
structure and consequently the properties of a glass cannot be defined by
specifying the usual parameters of composition, pressure and temperature.
Weber [52] used laser induced fluorescence line narrowing
technique to investigate the local fields and interactions of paramagnetic
ions in oxide glasses. Since the paramagnetic ion enters into glasses as a
network modifier cations and because the differences in the bonding to
nearest neighbouring anions in multicomponent glass composition, the local
fields at individual ion sites vary. These result in the variation of radiative and
non-radiative transition probabilities as is evident from the inhomogeneous
broadening of absorption and emission lines and non-exponential excited
state decays observed for glasses [53]. In the fluorescence line narrowing
technique, short laser pulse of narrow spectral width is used to excite
selectively an energetically specified subset of ion environment within an
inhomogeneously broadened absorption line. If the emission is measured
42
before substantial cross relaxation between ions in different sites occurs.
The resulting spectrum characterizes only that subset of ions, which were
originally excited. Thus by exciting at a sequence of different frequencies
within the absorption line, one probes the variation of the spectroscopic
properties of the entire ensemble of environments.
1.10 MOLECULAR SPECTRA
Absorption spectra of atoms consist of sharp lines, whereas
absorption spectra of molecules show broad bands in UV/VIS region. These
may exhibit some vibrational structure, particularly in case of rigid molecule.
Polyatomic molecule possessing a large number of normal vibrational
modes of varying frequencies having closely spaced energy levels. As a
result of line broadening due to inhomogeneity of the interactions between
solute molecule and solvent, to hindered rotation, and to the short lifetimes
of the higher excited states, the vibrational structure may be either
unresolved or only partly resolved (Fig.1.10).
The vibration structure may be explained as follows. For each state
of molecule there is a wavefunction that depends on time, as well as on the
internal space and spin coordinates of all electrons and all nuclei, assuming
that the overall translational and rotational motions of the molecule have
been separate from internal motion. A set of stationary states exits whose
observable properties, such as energy, charge density etc. do not change in
time. These states may be described by time-independent part of their wave
functions alone. Their wave functions are the solutions of time independent
43
Schrödinger equation and depend only on the internal coordinates q=q1,
q2,……….. of all electrons and internal coordinates Q=Q1,Q2,………. , of all
nuclei.
Within the Born-Oppenheimer approximation, the total
wavefunction Tψ of stationary state is written as
( ) ( )Qq vj
jQ
vjT χψψ =, 1.15
Where ‘j’ characterizes the electronic state and ‘v’ the vibrational sublevel of
that state (Fig.1.11). And the energy of a stationary state of wavefunction of
equation (1.15) is written as
)()( vibel EEE += 1.16
As a result, each electronic state of molecule with energy E(el) = EQj carries a
manifold of vibrational sublevels, and the energy of an electronic excitation
may be separated into an electronic component and vibrational component
according to
)()( vibel EEE ∆+∆=∆ 1.17
1.11 DYES
Dyes are usually a coloured organic compound or mixture that has
the ability to impart their colour to materials to be dyed in an aqueous
medium. However all the colored substances are not necessarily dyes nor

44
that all dyes are necessarily colored therefore optical brightness or whiteners
(or white dyes) are also included in the term dye.
According to the molecular orbital theory (MO) a molecule, in ground
state the electrons are present in sigma (σ ), pi (π ), or non-bonding
molecular orbitals. When it absorbs radiations there is electronic excitation
i.e., electrons are transferred from bonding to anti-bonding orbitals (σ *, π *).
In M.O. theory the transitions of electron is considered singly. Out of these
transitions σσ → * and σ→n * transitions are difficult and take place only by
the absorption of U.V. radiations. Hence saturated compounds are
colourless. But the ππ → * and π→n * transitions are easier as they
required less energy.
1.12 DYES DOPED IN POLYMER
Polymers are high molecular weight compounds which are composed
of a large number of simple repeating units of one or different type
substances of low molecular weight. These small units are called monomers.
Unmatched in the diversity of their properties, polymers such as nylon,
cotton, wool, rubber, teflon and all plastics are used in nearly every industry.
Natural and synthetic polymers can be produced with a wide range of
stiffness, strength, heat resistance and even price. With continued research
into the science and applications of polymers, they are playing an ever-
increasing role in society.
Incorporation of dyes in solid materials instead of liquid is as old as
dye lasers itself. From application point of view polymers are the first choice
45
as solid host material due to the well-established production techniques and
the very low price. The dye doped polymers are used to develop light
emitting diodes, Lasers, luminescence solar collector, optical sensors,
biological sensor used to investigate the dynamics of protein folding, DNA
structure etc..
Most of the natural and synthetic polymers don’t show luminescence
properties [54]. However luminophoric properties can be introduced in
polymer by doping dyes in it. The photo induced excited state relaxation
processes in various polymers are useful for the study of different specific
interactions between dye and host polymer, which change the photophysics,
and photochemistry of excited molecules due to various microenvironment
effects [54-56].
1.13 POLYMER STRUCTURE AND CLASSIFICATION
The physical structure of chain is also an important factor that
determines the macroscopic properties. The geometrical structure of
polymer is described using the term configuration and conformation [57].
Configuration: Configuration refers to the order that is determined by
chemical bonds and cannot be altered unless chemical bonds are broken
and reformed. The two types of polymer configuration are cis and trans. Cis
configuration arises when substituent groups are on the same side of a
carbon-carbon double bond. Trans refers to the substituents on opposite
sides of the double bond.
46
Conformation: Conformation refers to order that arises from the rotation of
molecules about the single bonds .If two atoms are joined by a single bond
then rotation about that bond is possible since unlike a double bond, it does
not require breaking the bond. The ability of an atom to rotate this way
relative to the atoms, which it joins, is known as an adjustment of the torsion
angle. If the two atoms have other atoms or groups attached to them then
configurations that vary in torisional angle are known as conformations.
Since different conformations represent varying distances between
the atoms or groups rotating about the bond, and these distances determine
the amount and type of interaction between adjacent atoms or groups,
different conformation may represent different potential energies of the
molecule. Three possible conformations are: Anti (Trans), Eclipsed (Cis)
and Gauche (+ or -).
The geometric arrangement of the bonds is not the only way the
structure of a polymer can vary. A branched polymer is formed when there
are side chains attached to main chain. In star branching polymerization
starts with a single monomer and has branches radially outward from this
point. Polymers with high degree of branching are called dendrimers. Often
in these molecules braches themselves have branches. This tends to give
the molecule an overall spherical shape in three dimensions.
Often it is possible to obtain polymers with new and desirable
properties by incorporating more than one kind of monomers into their chain.
Such polymers are known as copolymer. Three main types of copolymer
are random, block and graft. A random copolymer contains a random
47
arrangement of the multiple monomers. A block copolymer contains blocks
of monomers of the same type. Finally a graft copolymer contains a main
chain polymer consisting of one type of monomer with branches made up of
other monomers.
Cross linking: In addition to the bonds which hold monomers together in a
polymer chain, many polymers form bonds between neighboring chains,
these bonds can be formed directly between the neighboring chains, or two
chains may bond to third common molecule. Though not as strong as the
bonds within the chain, these crosslink have an important effect on the
polymer. Polymers with a high enough degree of cross-linking have memory.
When the polymer is stretched the crosslink prevent the individual chains
from sliding past with each other. The chains may straighten out once the
stress is removed they return to their original position and the object returns
to its original shape.
1.14 POLYMER SYNTHESIS
Polymer synthesis is a complex procedure and can take place in a
variety of ways [58]. Addition polymerization describes the method where
monomers are added one by one to an active site on the growing chain.
Addition polymerization The most common type of addition polymerization
is the free radical polymerization. A free radical is simply a molecule with an
unpaired electron. The tendency for the free radicals to gain an additional
electron in order to form a pair makes it highly reactive so that it breaks the
bond on another molecule by stealing an electron, leaning that molecule with

48
an unpaired (which is another free radical). Free radicals are often created
by the division of a molecule (known as an initiator) into two fragments along
a single bond. The following diagram shows the formation of a radical from
its initiator, in this case benzoyl peroxide.
The stability of a radical refers to the molecule΄s tendency to react
with other compounds. An unstable radical will readily combine with many
different molecules. However a stable radical will not easily interact with
other chemical substances. The stability of free radicals can vary widely
depending on the properties of the molecules. The active center is the
location of the unpaired electron on the radical because this is where the
reaction takes place. In free radical polymerization, the radical attacks one
monomer, and the electron migrates to another part of the molecule. This
newly formed radical attacks another monomer and the process is repeated.
Thus the active center moves down the chain as the polymerization. There
are three significant reactions that take place in addition polymerization:
Initiation (birth), Propagation (growth) and termination (death).
Initiation reaction: The first step in producing polymers by free radicals is
the initiation. This step begins when an initiator decomposes into free
radicals in the presence of monomers. The instability of carbon-carbon
double bonds in the monomer makes them susceptible to reaction with the
49
unpaired electrons in the radical. In this reaction, the active center of the
radical grabs one of the electrons from the double bond of the monomer,
leaving an unpaired electron to appear as a new active center at the end of
the chain. Addition can take place at either end of the monomer. In a typical
synthesis, between 60% and 100% of the free radicals undergo an initiation
reaction with a monomer. The remaining radicals may join with each other or
with an impurity instead of with a monomer. "Self destruction" of free radicals
is a major hindrance to the initiation reaction. By controlling the monomer to
radical ratio, this problem can be reduced.
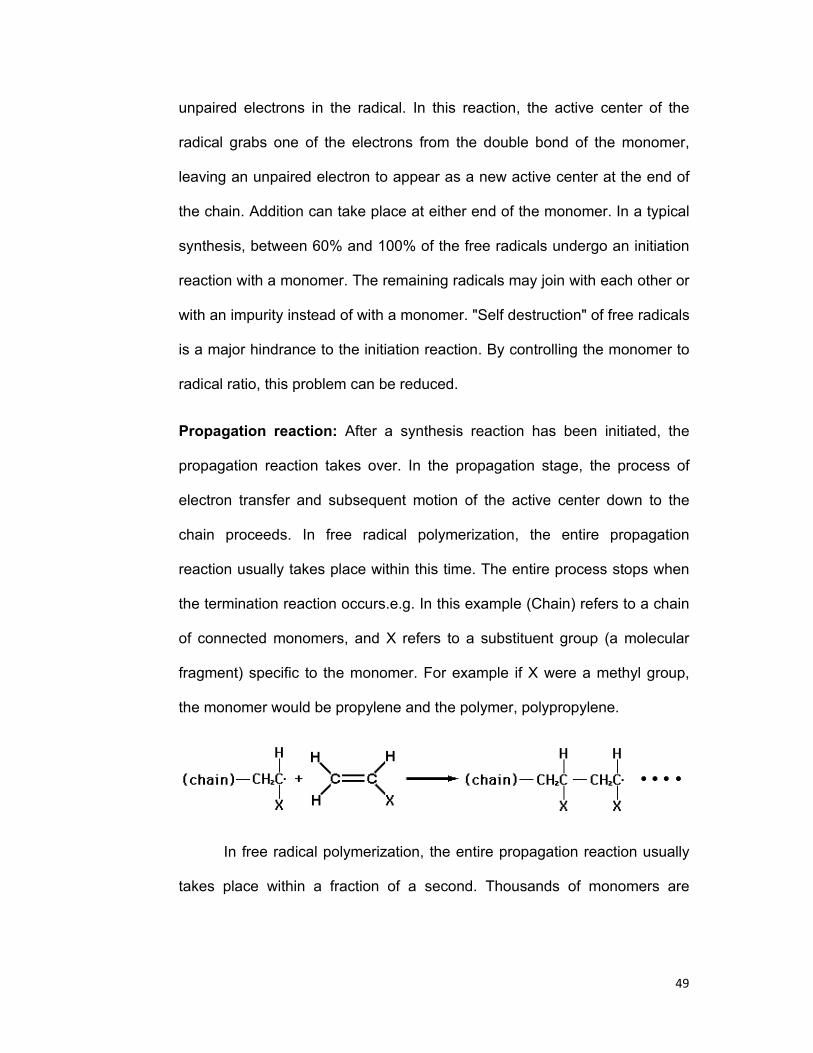
Propagation reaction: After a synthesis reaction has been initiated, the
propagation reaction takes over. In the propagation stage, the process of
electron transfer and subsequent motion of the active center down to the
chain proceeds. In free radical polymerization, the entire propagation
reaction usually takes place within this time. The entire process stops when
the termination reaction occurs.e.g. In this example (Chain) refers to a chain
of connected monomers, and X refers to a substituent group (a molecular
fragment) specific to the monomer. For example if X were a methyl group,
the monomer would be propylene and the polymer, polypropylene.
In free radical polymerization, the entire propagation reaction usually
takes place within a fraction of a second. Thousands of monomers are
50
added to the chain within this time. The entire process stops when the
termination reaction occurs.
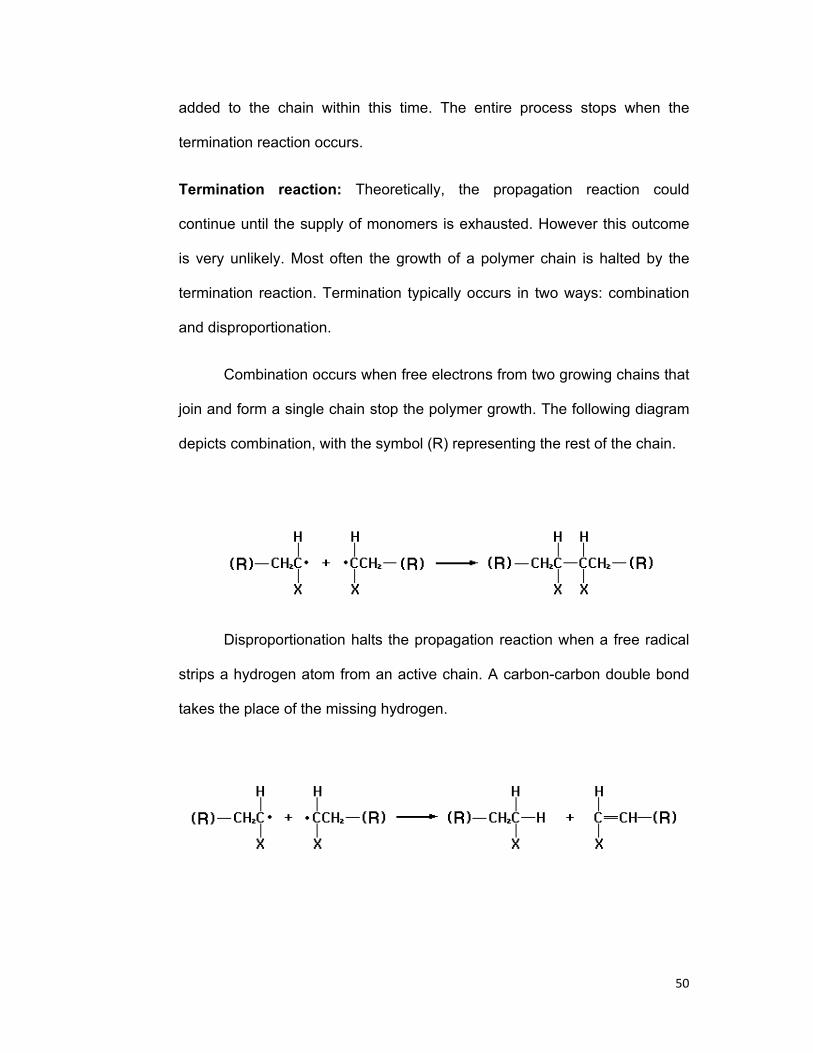
Termination reaction: Theoretically, the propagation reaction could
continue until the supply of monomers is exhausted. However this outcome
is very unlikely. Most often the growth of a polymer chain is halted by the
termination reaction. Termination typically occurs in two ways: combination
and disproportionation.
Combination occurs when free electrons from two growing chains that
join and form a single chain stop the polymer growth. The following diagram
depicts combination, with the symbol (R) representing the rest of the chain.
Disproportionation halts the propagation reaction when a free radical
strips a hydrogen atom from an active chain. A carbon-carbon double bond
takes the place of the missing hydrogen.

51
Living polymerization: it does not undergo termination reaction and
continues until the monomer supply has been exhausted. When this
happens, the free radicals become less active due to interaction with the
solvent molecules. If more monomers are added to the solution, the
polymerization will resume.
The bulk polymer is characterized by a wide distribution of molecular
weights and chain lengths. The degree of polymerization (DP) refers to the
number of repeat units in the chain, and gives a measure of molecular
weight. Many important properties of the final result are determined primarily
from the distribution of lengths and the degree of polymerization.
1.15 CALCULATION OF NON-RADIATIVE ENERGY TRANSFER
PROBABILITIES (PDA) & EFFICIENCIES (η):
Reisfeld [59] has proposed a method to calculate the energy
transfer parameters for any two rare earth ions having well defined electronic
levels. These derivations are based on the rate equations applicable to a
system consisting of a pair of unlike RE ions in a glass medium. The system
is shown in Fig. 1.11.
Here the no. specifies the levels of the donor ion and the letters the
level of acceptor ion. P's are transition probability between various levels
designated in the Fig. 1.9. The superscripts ‘r’ and ‘nr’ refers to the radiative
and non-radiative transition respectively.
'sφ are quantum efficiencies defined as:
52
rnr
r
1010
101 Ρ+Ρ
Ρ=φ
c221
212 Ρ+Ρ
Ρ=φ (1.18)
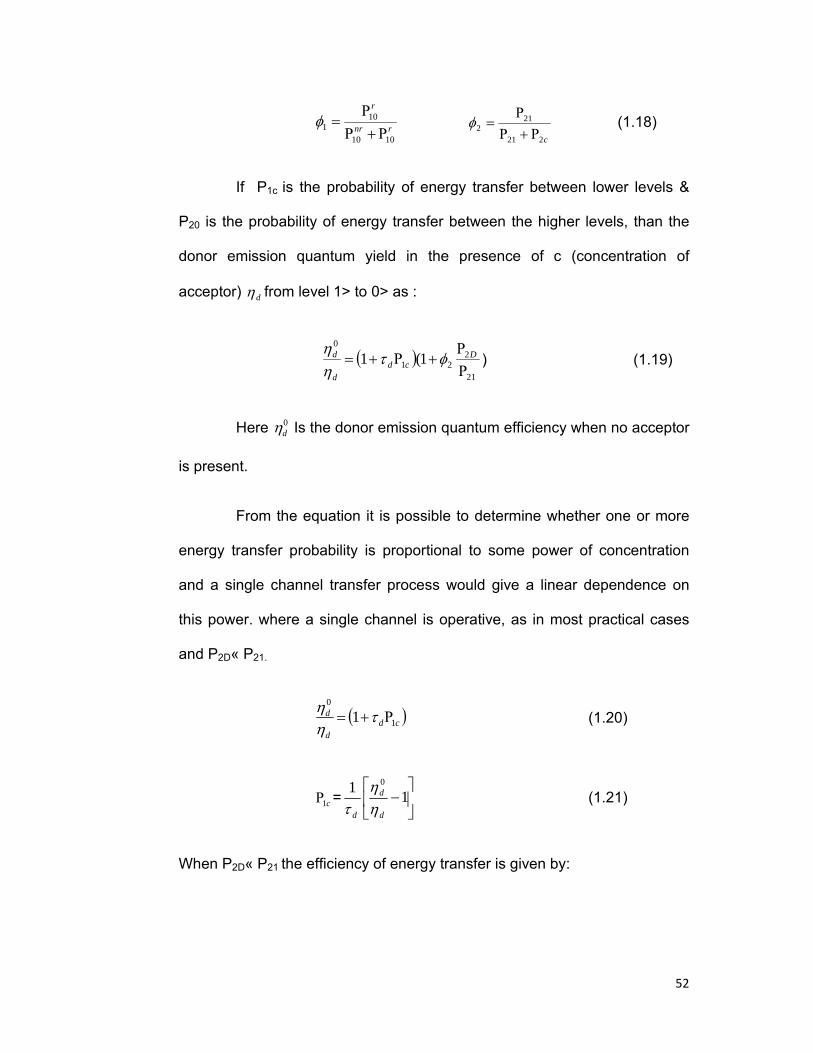
If P1c is the probability of energy transfer between lower levels &
P20 is the probability of energy transfer between the higher levels, than the
donor emission quantum yield in the presence of c (concentration of
acceptor) dη from level 1> to 0> as :
( )21
221
0
1(1ΡΡ
+Ρ+= Dcd
d
d φτηη
) (1.19)
Here 0dη Is the donor emission quantum efficiency when no acceptor
is present.
From the equation it is possible to determine whether one or more
energy transfer probability is proportional to some power of concentration
and a single channel transfer process would give a linear dependence on
this power. where a single channel is operative, as in most practical cases
and P2D« P21.
( )cdd
d1
0
1 Ρ+= τηη
(1.20)
c1Ρ = ⎥⎦
⎤⎢⎣
⎡−11 0
d
d
d ηη
τ (1.21)
When P2D« P21 the efficiency of energy transfer is given by:

53
−=Ρ+
Ρ= 1
1 1
1
dc
dc
ττητ 0
d
d
ηη
(1.22)
These equation 1.26 and 1.27 enable us to calculate Pda and ητ
using known experimental values of donor emission intensity (yield and
fluorescence lifetimes, A simple operational definition of ητ in terms of the
lifetimes can be given as
do
d
ττητ −= 1 (1.23)
where τd0 is the intrinsic (radiative and radiationless) decay time of
the donor excitation & τd is the donor lifetimes in the presence of the
acceptor .If the total donor decay probability is P then:
P=0
11
dd ττ= +Pda (1.24)
where τdo-1
and τd-1 are the donor decay rates in absence and in
presence of the acceptor ion respectively.Pda is the energy transfer
probability given by:
Pda= ⎥⎦
⎤⎢⎣
⎡−=−
00
1111
d
d
ddd ττ
τττ (1.25)
We have frequently exploited the use of equation 1.24 and 1.25 in
our computation.

54
1.16 OBJECTIVE OF THE WORK
An ion or molecule has its own characteristic absorption and
emission spectrum. The optical properties of an ion or molecule are
dependent on ion / molecule itself and the matxics in which the luminescent
ion / molecule is doped. Luminescent ions /molecules can be selected at will
which give emission in the desired wavelength range. Matrix in which ions
/molecules are doped can be selected for which one will get better emission
intensity. A large number of phosphors have been identified by now a days
which have found applications in the field of lighting and television. Still there
is vast scope in this field.
Rare earths have specials characteristic absorption and emission
spectrum. These spectrum having high intensity, small band width and
longer life times but due low oscillator strength they can’t absorb significant
amount of incident energy. This drawback can be overcome by sensitizing
such ions (called activator or acceptor) by other ions (called donor or
sensitizer).
The applications of sensitized phosphors are in sensitizing solid
state glass laser, IR up-converter, solar energy converters, optical amplifiers
etc. So it is useful to find out the circumstances under which the emission
can occur with high efficiency.
With the increasing use of dye doped polymer found various
application as light emitting diodes, lasers, optical sensor and biological
sensor, the study of these dyes are new area for the research.
55
Keeping above points in mind the present work is carried out to
investigate the interaction involved and energy transfer process in various
ion-ion system. The present work we chose zinc phosphate glass as host in
which Na2O is network former and ZnO is the modifier. For the study of
emission and absorption spectrum of different dyes, we take PVA as host.
Chapters 3, 4, 5, 6 present energy transfer process between rare earth to
rare earth and between dye to dye particularly involve the study of
fluorescence spectra, energy level involved, multipolar term and mechanism
responsible for the energy transfer. Different theories are used to explain the
experimental results.

56
BIBLIOGRAPHY
1 B.G. Wybourne: Spectroscopic properties of rare earths, Wiley Inter-science,
New York (1965).
2 G.H. Dieke: Spectra and energy levels of rare earths ions in crystal, John
Wiley and Sons, Inc. New York (1968).
3 D.J. Newman: Adv. Phys. 20 (1971) 197.
4 H.A. Bethe and E.E. Salpeter: Quantum Mechanics of one and two electron
atoms, Academic Press, New York (1957).
5 H.A. Bethe: Ann. Physik, 3 (1929) 133.
6 J. H. Van Vleck: J. Phys. Chem., 41 (1937) 67.
7 B. R. Judd: Phys. Rev., 127 (1962) 750
8 H. F. Ivey: Proc. Int. Conf. on luminescence., 20 (1966) 2027.
9 Th. Forster: Z Naturefosch., 49 (1949) 321.
10 D.L. Dexter: J. Chem. Phys., 21 (1953) 836.
11 D.L. Dexter: Phys. Rev., 126 (1962) 1962.
12 J.Parrin: Second Council de Chime Solvav, Gantier and villar, Paris
(1925).
13 Th.Forster: Ann. Physik, 2 (1948) 55.
14 D.L. Dexter: J. Chem. Phys., 2 (1953) 836.
15 M. Inokuti & F. Hirayama: J. Chem. Phys., 43 (1965) 1978.
16 L. G. Van Uitert and L. F. Johnson: J.Chem.Phys.,44 (1966) 3514
17 G. E. Peterson and P. M. Bridenbaugh: J. Opt. Soc. Am. 53 (1963)
1129.

57
18 F. Varsanyi & G. H. Dieke: Phys. Rev. Lett., 7 (1961) 442.
19 R. Reisfeld and Y. Eckstein: J. Non Cryst. Solids, 11 (1973) 261.
20 F. Varsanyi and G.H. Deike: Phys. Rev. Lett., 7 (1961) 442.
21 G. E. Peterson and P. M. Bridenbaugh: J. Opt. Soc. Am., 53 (1963)
1129.
22 F. K. Fong and D. J. Diestler: J. Chem. Phys., 56 (1972) 2875.
23 R. Reisfeld: Struct and bonding, 13 (1973) 53.
24 Kun Huang and Avnl Rhys: Proceedings of the Royal Society of
London, 204 (1951) 406.
25 C. W. Struck & W.H. Fonger: Journal of Luminescence, 10 (1975) 1.
26 W. H. Fonger and C. W. Struck: Journal of luminescence, 17 (1978)
241.
27 A. Kiel: Quantum electronics, Columbia University press, New York
(1964).
28 L. A. Riseberg and H.W. Moos: Physical review, 74 (1968) 438
29 C.B. Layne, W.H. Lowdermilk and M.J. Weber: Phys. Rev., B15
(1977)179.
30 M. Yakota and O.Tanimoto: J. Phys. Soc. Japan, 22 (1967) 779.
31 R. K. Watts and H. J. Ritcher: Phys. Rev., B6 (1972) 1584.
32 Van Der Ziel, J.P., L.Kopf and L.G. Van Uitert: Phys. Rev., B6
(1972)615.
33 E.Okamota: J. Luminsc., 12/13 (1976) 763.
34 N. Krasutsky and H. W. Moos: Phys. Rev., B38 (1973) 1010.
35 M. J. Weber: Phys. Rev., B4 (1971) 2932.
36 L. A. Riseberg, Phys. Rev., A7 (1973)671.
58
37 N. Motegi and S. Shionoya: J. Luminescence, 8(1973)1.
38 M. J. Weber: Radiative and Non radiative transitions of RE Ions: in
Phys. of quantum electronics (McGraw Hill Book Co., NY), (1966).
39 W. A. Weyl and E. C. Marrboe: The constitution of glasses, A
Dynamic interpretation, Vol 1 (Wiley Interscience, NY) ,1962.
40 B.E. Warren: J. Am. ceram. Soc., 17 (1937)249.
41 A. S. Prebus and J. W. Michner: Ind. Eng. Chem. 46(1952)147.
42 G. E. Rindone: Luminescence in glassy state, Luminescence of
Inorganic Solids (Academic Press, Newyork), 1965.
43 G.O. Karapetyan: Ann. SSSR Izu. Ser Fiz., 27 (1963)779.
44 R. Reisfeld & Y.Eckstein: J.Solid State Chem., 5(1972)174.
45 R. A. Velapodi, R. Reisfeld and L. Boehm: Ninth Rare earth Conf.,
2(1971)488.
46 R. Reisfeld, R.A. Velapodi and L. Boehm and M. Ish. Shalom:
J.Chem. Phys., 75(1971)3980.
47 M.J. Weber, J. Hegarty and D.H. Blackburn:in Boron in Glass and
Glass Ceramics ,Plenum Press, New York (1977).
48 R. Reisfeld: Struct and bonding, 30 (1976)65.
49 R. Reisfeld: Struct and bonding, 22 (1975)123.
50 W. A. Weyl: Coloured glasses, The Society of Glass Technology,
Sheffield, England , (1951).
51 W. A. Weyl and E. C. Marrboe: The constitution of glasses, A
Dynamic interpretation, Vol 1 (Wiley Interscience, NY) ,1962.
52 M. J. Weber: Proc. 7th Int. Conf. on Amorphous and liquid
Semiconductor, Edinburgh, (1977).
59
53 C. B. Layne: Unpublished Ph.D. thesis submitted to university of
California,USA (1975).
54 N. N. Barashkov, O. A. Gunder N. N. Barashkov, O.
A. Gunder: Fluorescent polymers, Ed. By Eliss Herwood, New York, (1994).
55 Photophysics of polymers, ASC, Symposium series
38, edited by Hoyle C.E. and J. M. Torkenson, (1987).
56 T.G. Dewey: Biophysics and biochemical aspects of
fluorescence spectroscopy, Ed., Plenum Press NY (1991).
57 Fred W. Billmeyer: Textbook of polymer science,
John. Wiley & Sons, New York (1968).
58 B. A. Swartz, T. Cole and A. H. Zewail:
Opt.Lett.,1(1977)73.
59 R. Reisfeld: structure and bonding ,13(1973)53

60
Figure caption
Fig.1.1 Rare earth element in periodic table.
Fig.1.2 Schematic diagram of the splitting of rare earth energy levels
due to the electrostatic, spin-orbit, crystal field interactions.
Fig.1.3 G.H.Dieke. Spectra and energy levels of rare earth ions in crystals (Interscience Publisher, New York, 1968).
Fig.1.4 A Sensitizer – activator system with activator (A) and sensitizer (S).Excitation of S (Exc (S)) is followed by one or more of the following processes:
1) Emission from S. 2) Radiation less decay in S. 3) Energy transfer to another centre of type S. and 4) Energy transfer to a centre of type A. Here emission
from A can observed.
Fig.1.5 Excited state relaxation and energy transfer in RE ions.
Fig.1.6 Schematic representation of migration of energy among similar ions.
Fig.1.7 Schematic representation of relaxation of excited state population by cascade and by multiphonon.
Fig.1.8 Proposed rare earth site model.
Fig.1.9 SSchematic picture of the free energies of crystals, supercooled liquid and glasses.
Fig. 1.10: Energy level and molecular spectra.
Fig. 1.11: Schematic representation of potential energy curve and vibrational evel of molecule.
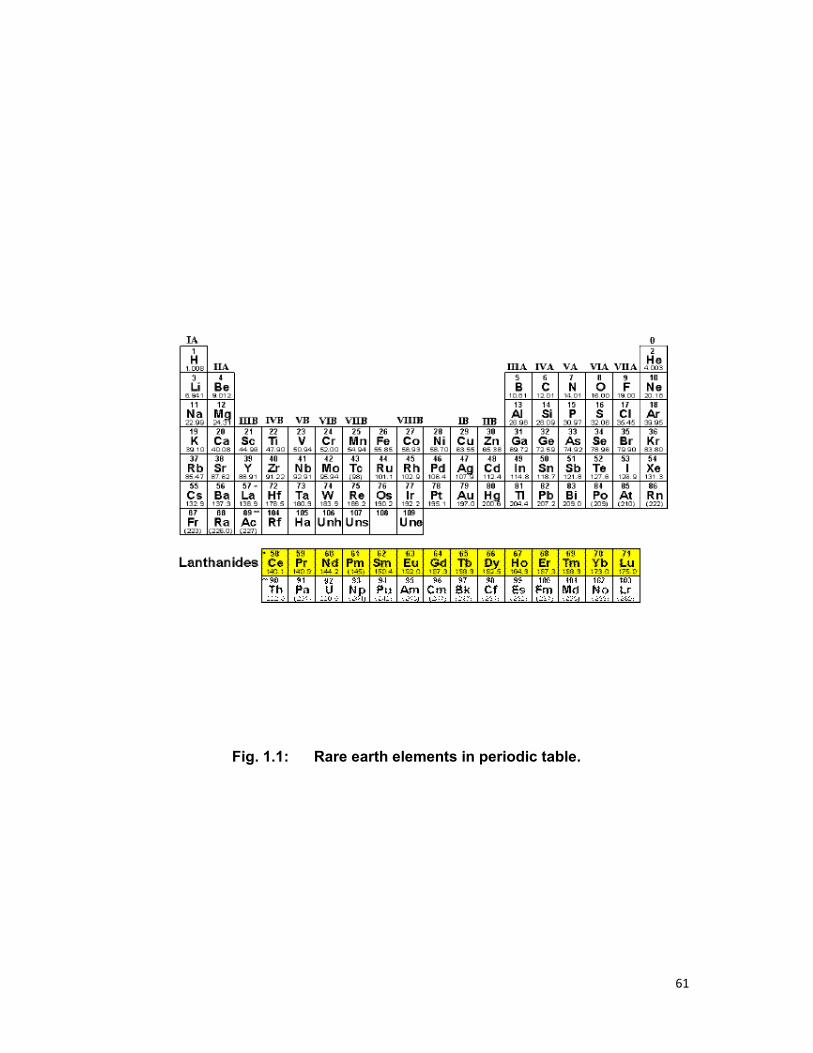
61
Fig. 1.1: Rare earth elements in periodic table.
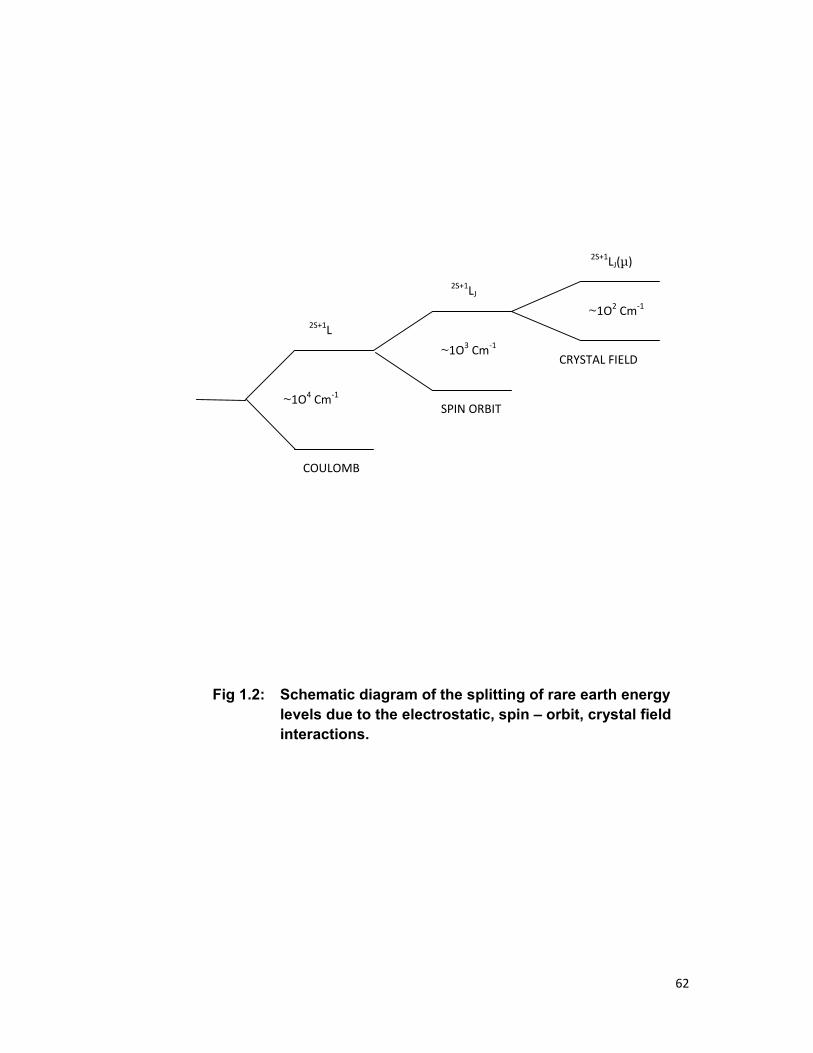
62
Fig 1.2: Schematic diagram of the splitting of rare earth energy levels due to the electrostatic, spin – orbit, crystal field interactions.
COULOMB
SPIN ORBIT
CRYSTAL FIELD
~1O4 Cm‐1
2S+1LJ
2S+1LJ(µ)
2S+1L
~1O2 Cm‐1
~1O3 Cm‐1
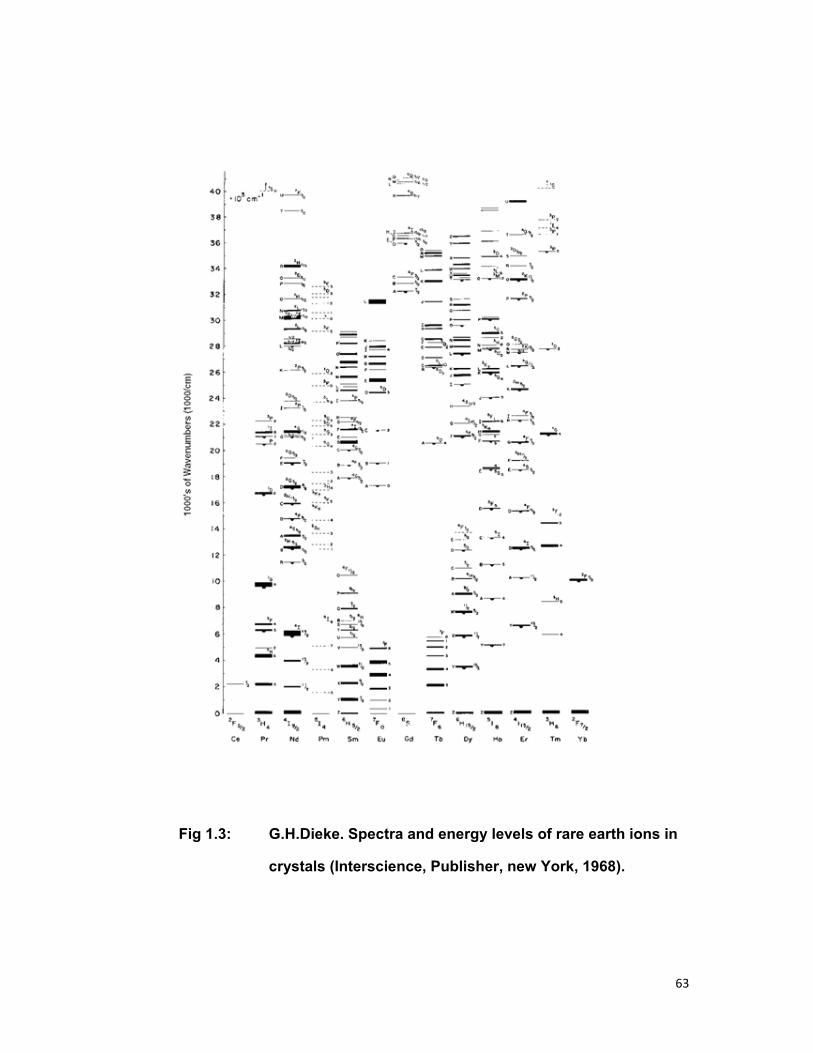
63
Fig 1.3: G.H.Dieke. Spectra and energy levels of rare earth ions in
crystals (Interscience, Publisher, new York, 1968).

64
Fig. 1.4: A sensitizer – activator system with activator (A) and sensitizer (S).Excitation of S (Exc (S)) is followed by one or more of the following processes:
1) Emission from S. 2) Radiation less decay in S. 3) Energy transfer to another centre of type S. and 4) Energy transfer to a centre of type A. Here emission
from A can observed.
SA
HOST SS
1
2
3
4
Exc(S) Em(A)

65
Fig. 1.5: Excited state relaxation and energy transfer in RE ions.
0
1
2
P21
P20
Pr10
Pnr10
Donor Acceptor
C
B
D
A
PCA
PDC2
PCB
PnrBA
PrBA
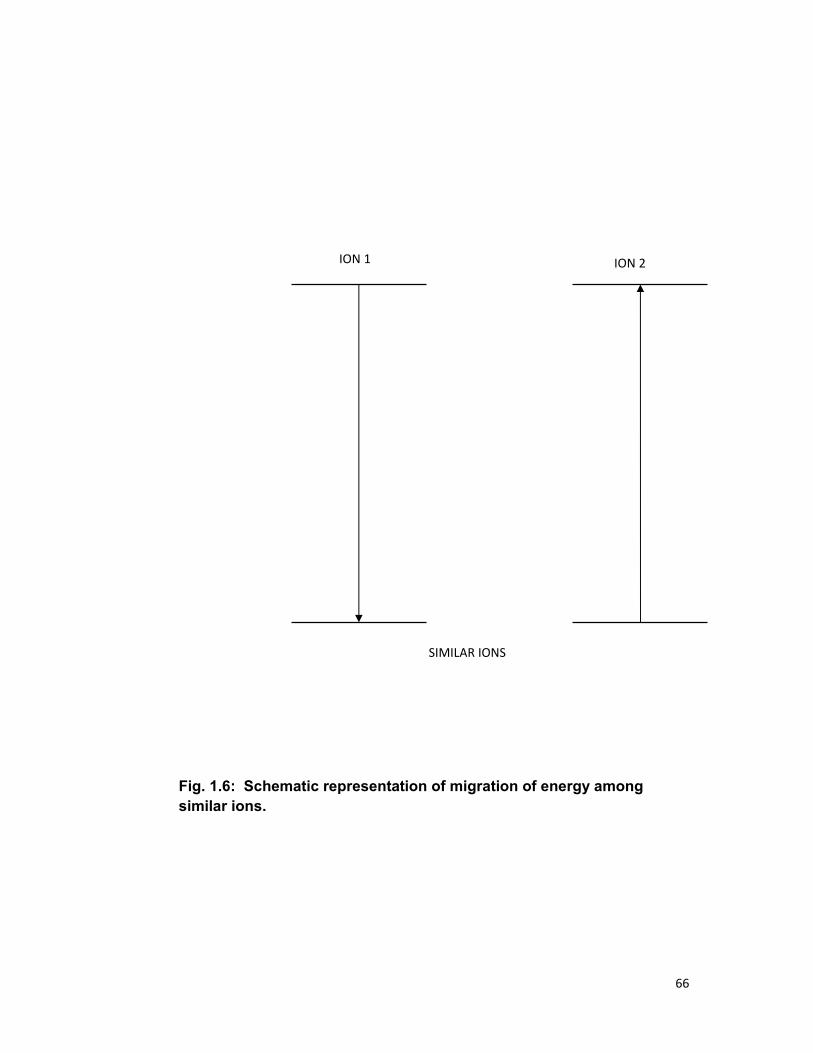
66
Fig. 1.6: Schematic representation of migration of energy among similar ions.
SIMILAR IONS
ION 1 ION 2
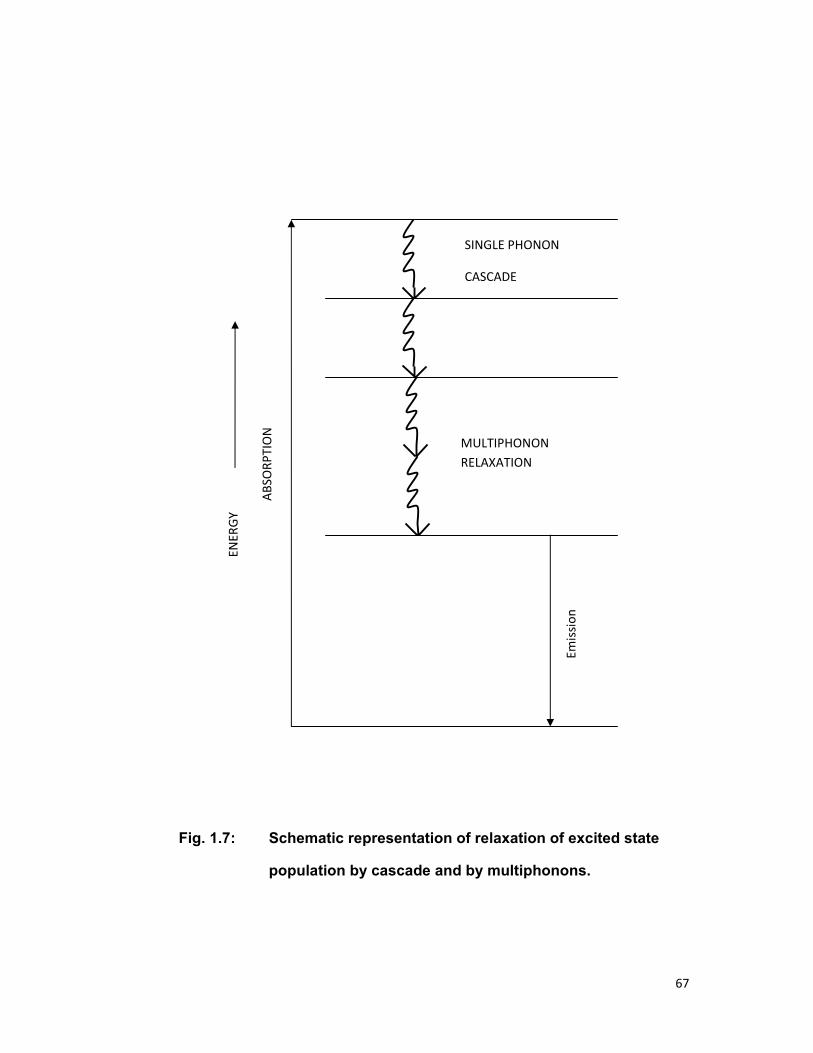
67
Fig. 1.7: Schematic representation of relaxation of excited state
population by cascade and by multiphonons.
MULTIPHONON RELAXATION
SINGLE PHONON
CASCADE
ENER
GY
ABSORP
TION
Emission
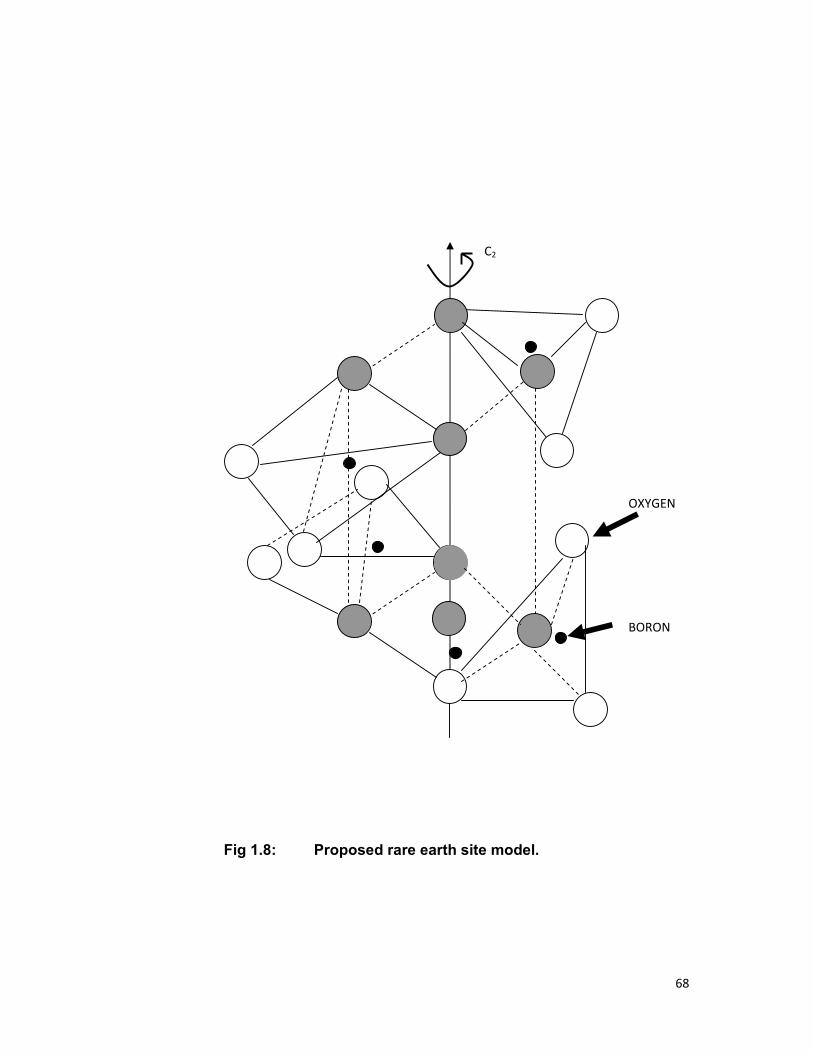
68
Fig 1.8: Proposed rare earth site model.
BORON
OXYGEN
C2

69
Fig. 1.9: Schematic picture of the free energies of crystals, supercooled liquid and glasses.
SUPERCOOLED
FREE ENER
GY
GLASS
CRYSTAL CRYSTAL

70
Fig. 1.10: Comparison between atomic and molecular spectra schemes.
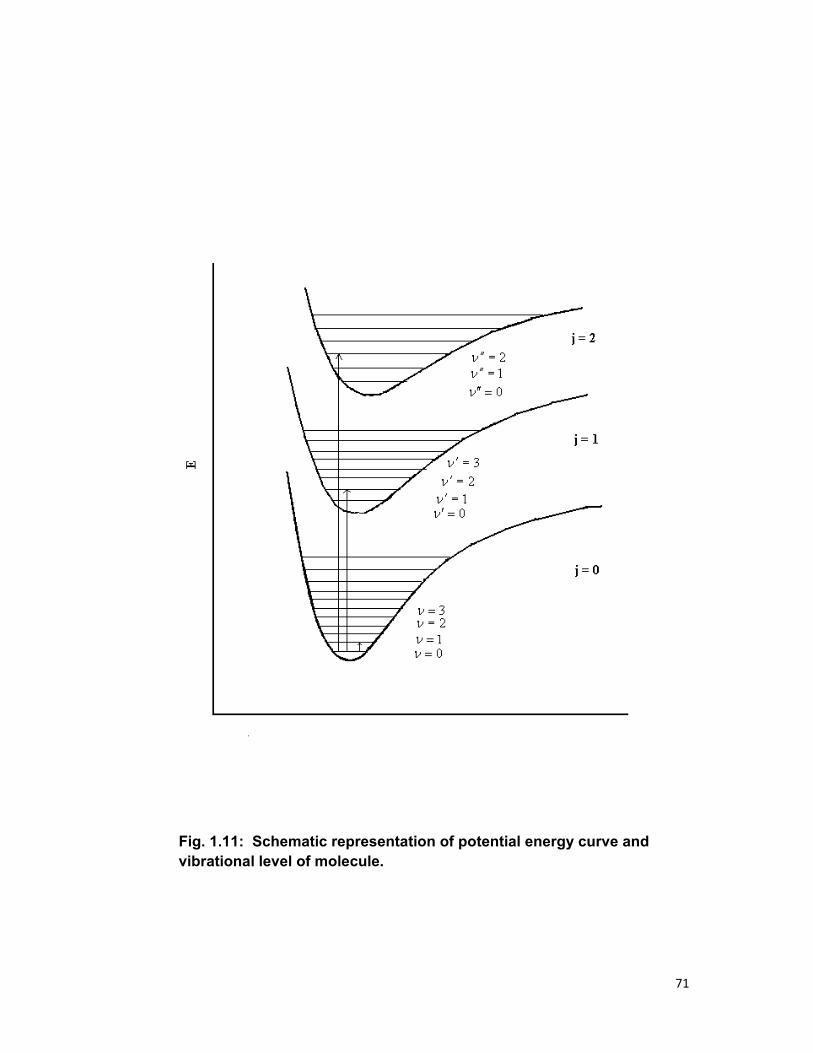
71
Fig. 1.11: Schematic representation of potential energy curve and vibrational level of molecule.
72
CHAPTER 2
EXPERIMENTAL TECHNIQUES
73
CHAPTER 2
EXPERIMENTAL TECHNIQUES
2.1 INTRODUCTION:
The luminescence of the rare earth ions in glasses has been subject
of interest since the advent of lasers because sharp bands occur under
proper excitation [1]. Energy transfer between rare earth ions find wide
application in sensitizing solid state glass lasers & optical amplifiers [2-9]
infrared quantum counters as well as in infrared to visible convertors [10].
Recently, the transfer of excitation energy among dyes is drawing
attention because of its applicability in solar collectors [11, 12]. Dye doped in
transparent polymers can serve as the purpose of luminescent solar
collectors.
The experimental methods to observe the energy transfer process
need the fluorescence studies of donor ions in presence and in absence of
acceptor ions, the absorption spectra of both the ions and the decay time
measurements of donor ions in presence and absence of acceptor ions. A
sufficient knowledge is, therefore, needed to work out the dynamics involved
in energy transfer processes. In this chapter the details of the chemicals
used, their composition, experimental procedure and the apparatus used are
given.
74
2.2 CHOICE AND PREPARATION OF MATERIALS:
The interaction among rare earth ions causes the transfer of
excitation energy of one ion / molecule (donor) to another ion / molecule
(acceptor) [13]. Such interactions help in increasing the emission of the
acceptor ions, which either do not get excited with the direct pumping or get
so weakly, indirectly via the donor ions. In glass matrices, due to
inhomogeneous broadening of the energy levels of doped ion, the probability
of energy transfer increases [14].
The energy transfer parameters are greatly affected by the purity of
the chemicals used in manufacturing the glass for the study of the energy
transfer between the doped ions, viz., donor and acceptor. An efficient
general research on phosphors requires very pure inorganic and organic
substances as the constituents of the glass matrix. Besides, one or more
furnace capable of attaining a temperature of at least 10000C, a source of
high energy phonons and the means of controlling and determining the
energies and number of these particles are the other basic requirements for
an efficient research in this field.
2.2 A) CHEMICALS:
The details of the chemical used in the present work are as follows:
1. Sodium dihydrogen orthophosphate (NaH2PO4.2H2O) was of E Merck
(India) Ltd. Make and was reagent grade pure (R.P.)
75
2. Zinc oxide (ZnO) was of Ferak Berlin (Germany) make and was 99.9%
pure.
3. Rare earth Oxides such as Terbium oxide (Tb2O3), Europium Oxide
(Eu2O3), Erbium oxide (Er2O3), Praseodymium oxide (Pr2O3), Samarium
oxide (Sm2O3), Thulium oxide(Tm2O3),each with a purity of 99.9%,
Dysprosium oxide (Dy2O3)99% pure were obtained from Prof. Fortne
GTE Sylvania, U.S.A.
4. Uranyl acetate [UO2 (C2H3O2.2H2O](phosphor grade), Sodium borate
(Na2B4O7) Calcium oxide (CaO), Magnesium carbonate (MgCO3), Borax
(H 3 BO3) were obtained from Rare earth India ltd.
5. Polyvinyl alcohol (PVA) soluble in cold water and dichloromethane was
obtained from central drug house (P) ltd., Bombay.
6. Fluorescein, Saffranine T, Malachite green, erythrosin B, Eosin was
obtained from BDH chemicals ltd., Poole England.
7. Double distilled water used in the work was obtained from department of
chemistry, S.S.J. campus Almora, U.A. India.
2.2 B) GLASS COMPOSITION & PREPARATION:
Different glass samples with or without rare earth ions were prepared
as follows:
All the components of the glass with requisite composition were taken
in a beaker and were thoroughly stirred with the help of an electrically driven
stirrer till the mixture becomes homogeneous. Then the mixture is placed in
a platinum crucible. The crucible was then put inside an electric furnace
76
(which is capable of achieving temperature up to 12000C at a temperature
ranging from 8500C to 9500C) for half an hour. The molten mass was taken
poured into a brass ring (mould) resting on an aluminum plate. The glass so
formed was then allowed to cool at room temperature. The annealing
conditions for each series of glass samples were kept identical. In this way it
is possible to get glass samples of almost equal size & surface area.
The compositions of glasses prepared for the study were as follows:
1. To study the energy transfer in different rare earth doped series sodium
dihydrogen orthophosphate and zinc oxide were used in the ratio 3:1 by
weight to make zinc phosphate glass.
2. To study the absorption spectra of acceptor RE ion one reference glass
sample of zinc phosphate glass is made by mixing sodium dihydrogen
orthophosphate and zinc oxide in the ratio 3:1 by weight.
The size of glass sample for absorption spectra is taken as
1cmx1cmx3 cm. The presence of zinc oxide in the glasses makes them less
hygroscopic.
2.2 C) GLASS SERIES:
By doping the different donor-acceptor rare earth ion different glass
series were made to study the energy transfer between them. The details of
series of samples so prepared have been presented in the respective
chapters. In general we take 1 wt % doping of donor and 0.2, 0.4, 0.6, 0.8,
1.0 wt% doping of acceptor ion. However for some glass series the acceptor
77
doping is taken 0.5, 1.0, 1.5, 2.0, 2.5 wt% by weight.. UO2++ as a donor is
taken 0.1 wt % for UO2 - Er system.
2.2 D) POLYMER COMPOSITIONS AND PREPARATION:
Thin films of PVA soluble in cold water with or without doping of dyes
were prepared as follows:
PVA and appropriate concentration of dyes were dissolved in distilled
water of known volume by stirring for half an hour at room temperature. This
dye-PVA mixture in water was slowly heated in an incubator to a
temperature of approximately 400 C with intermittent stirring. The
homogeneous mass was then poured in the appropriate container
(polypropylene dish) to obtain transparent sheets of required shape and size
and allowed to dry for approximately 2-3 days at 300K.
Then by doping the different dyes in host PVA were made to study
the luminescence properties of the dye doped polymer samples. The details
of samples than prepared have been presented in the chapter 6.
2.2 E) POLYMER SERIES DOPED WITH DYES:
Following polymer series doped with dyes were prepared as
1. Eosine of molar concentration 0.63 x 10⁻⁵M, 1.25 x 10⁻⁵M, 2.5 x 10-
5M and
5 x 10⁻⁵M doped in PVA.
2. Saffranine T of molar concentration 1.25 x 10⁻⁵M and 5 x 10⁻⁵M
doped in PVA.

78
3. Erythrosin B of molar concentration 0.63 x 10⁻⁴M, 0.80 x 10⁻⁴M and
2.5 x 10⁻⁴M in PVA.
4. Malachite green of molar concentration 2.5 x 10⁻⁵M, 1.25 x 10⁻⁵M
5. Fluorescein of molar concentration of 10-4M and Erythrosin B of
molar 0.31 x 10⁻⁵M, 0.63 x 10⁻⁵M, 0.80 x 10⁻⁵M, 1.0 x 10⁻⁵M and 2.5 x
10-5M doped in PVA concentration.
2.3 ABSORPTION SPECTROSCOPY:
The absorption spectra of the samples (RE doped glass as well as
dye doped polymer sample) were taken by PC controlled double beam UV-
VIS spectrophotometer (ECIL’s UV 5704 SS) having specifications as
follows:
Optics used in the spectrophotometer is double beam with quartz
coated optics .The light source used in the spectrophotometer are deuterium
and tungsten halogen lamp. It has an inbuilt silicon photo detector to cover
the entire wavelength range as given below. The power supply needed to
operate the unit is 230 V AC ±10 %, 50 Hz. The specification of wavelength
and optics involved is as follows:
Wavelength range: 190-1100 nm with wavelength accuracy ± 0.3 nm.
And band pass < 2 nm and .1 nm wavelength resolution.
A Pentium PC with SVGA colour monitor with standard PC
configuration and printer is attached with the unit. All the absorption spectra
were taken at room temperature.
2.4 FLUORESCENCE SPECTROSCOPY:
79
The emission intensity of each sample of the sample series are taken
by the current meter using following arrangement:
A high-pressure mercury lamp excited the samples in a fixed
geometry on frontal illumination with wood’s glass filter. Frontal illumination
of samples was made with the help of a concave mirror having a circular
aperture at its center. The arrangement for emission spectra is shown in
Fig.2.1. As shown in the figure a convex or a cylindrical lens on the entrance
slit of a monochromator focused the emission given by samples. The
dispersing system was either a grating monochromator with a dispersion 3.3
nm/mm and Czerny turner mounting (CEL, model HM 104) or a constant
deviation prism for low light levels. A photomultiplier tube (RCA 1P21)
(Circuit diagram is shown in Fig. 2.2) was attached with the exit slit of
monochromator to scan the dispersed light obtained from monochromator.
Regulated high power supply was used to operate the photomultiplier tube at
750 V. The output of the photomultiplier tube was fed to a current meter
(least count 1×10⁻⁹ amp.). All the graphs are drawn in MS excel 2007.
The emission spectra of rare earths-doped glass and dye-doped
polymer were taken by Jasco made FP-777 spectroflurometer at
photophysics laboratory, DSB Campus, Kumaun University Nainital.
The light source used in FP-777 is 150 W xenon lamp. The light from
the light source was focused on to the entrance slit plane of the excitation
monochromator by the electrical mirror m1 and a concave mirror m0. The
incident light from the slit is dispersed by the grating j1 and than arbitrary
monochromatic beam is selected by the exit slit. A part of the
80
monochromatic beam is lead to the ministering PMT by quartz plate beam
splitter and the diffuser plate DG. The monochromatic beam that has
transmitted the BS is focused on to the center of sample cell by plane mirror
m3 and toroidal mirror m4. The fluorescence radiation from the sample is
focused on to the entrance slit plane of the emission monochromator by
toroidal mirror m5 and plane mirror m6 and m7. The emission
monochromator is identical with exit monochromator in a structure and the
beam from the exit slit is lead to the PMT tube pm2 by concave mirror.
Wavelength range: 220-750 nm with wavelength accuracy ± 1.5 nm. Oth
order light can be expanded to 200 to 850 nm by the optical detector.
Spectral bandwidth changed over in 5 steps of 1.5,3,5,10 & 20 nm,
simultaneous scan is also possible.
2.5 FLUORESCENCE DECAY TIME:
The decay times of the sample, wherever necessary were taken from
the published work of Reisfeld [14] and published and unpublished work of
Joshi et.al. [15]. Joshi et. al. have used the single flash technique for the
fluorescence decay time measurements, which uses the following
experimental arrangements:

81

82
BIBLIOGRAPHY
1. G.O. Karapetyan: Ann SSSR Izu Ser, 27, (1963) 779.
2. R. Reisfeld and C.K.jorgenson: Lasers and excited states of rare earth
(springer-Verlag Berlin, Heidenberg, New York), 1977.
3. X.X.Zhang, P.Hong, M.Bass, B.H.T.Chai, Phys. Rev., B 51, (1995) 9298.
4. A.Bjarkev, in: Optical Fiber Amplifiers: Design and system Applications,
Artech house, Boston, London., (1993).
5. H. Higuchi, M. Takahahsi, Y.Kawamoto, K. Kadono. T.Ohtsuki,
N.Peyghambarian, N.Kitamura, J. Appl. Phys., 8319 (1998).
6. R. Reisfeld, Inorg. Chem. Acta, 140(1987) 345.
7. M.Tsuda, K.Soga, H.Inoue, S. Inoue, A. Makishima. J. Appl. Phys. 85,
(1999) 29
8. J.E.Roman, P.Camy. M.Hempstead, W.S.Brocklesby. S.Nouth, A.Beguin,
C.Lerminiaux, J.S.Wilkinson, Electron.Lett., 31, (1995) 1345.
9. E.Snoeks, G.N.Van den Hoven, A.Polman: IEEE J. Quantum Electron., 32,
(1996) 1680.
10. D. Rose: Laser light amplifiers and oscillator (Academic press, New York,
1969).
11. W. H. Weber and J. Lambe: Appl opt (USA), 15 (1976) 2299.
12. A. Geatzberger and V. Wittwer: Adv Solids St Phys (Neatherland), 19
(1979) 427.
13. Th.Forster and D.L.Dexter: Structure and bonding, 22(1975) 123.
14. R.Reisfeld: structure and bonding, 30(1976) 65.
83
15. J.C.Joshi, B.C.Joshi, Janardan Joshi and R.Lohani: Personal
communication.
84
FIGURE CAPTION
Fig. 2.1: Plan for scanning fluorescence spectra.
Fig. 2.2: Base connection of multiplier tube 1P21.
Fig. 2.3: Design for Sample holder.
Fig. 2.4: Block diagram of spectrophotometer JASCO FP-777
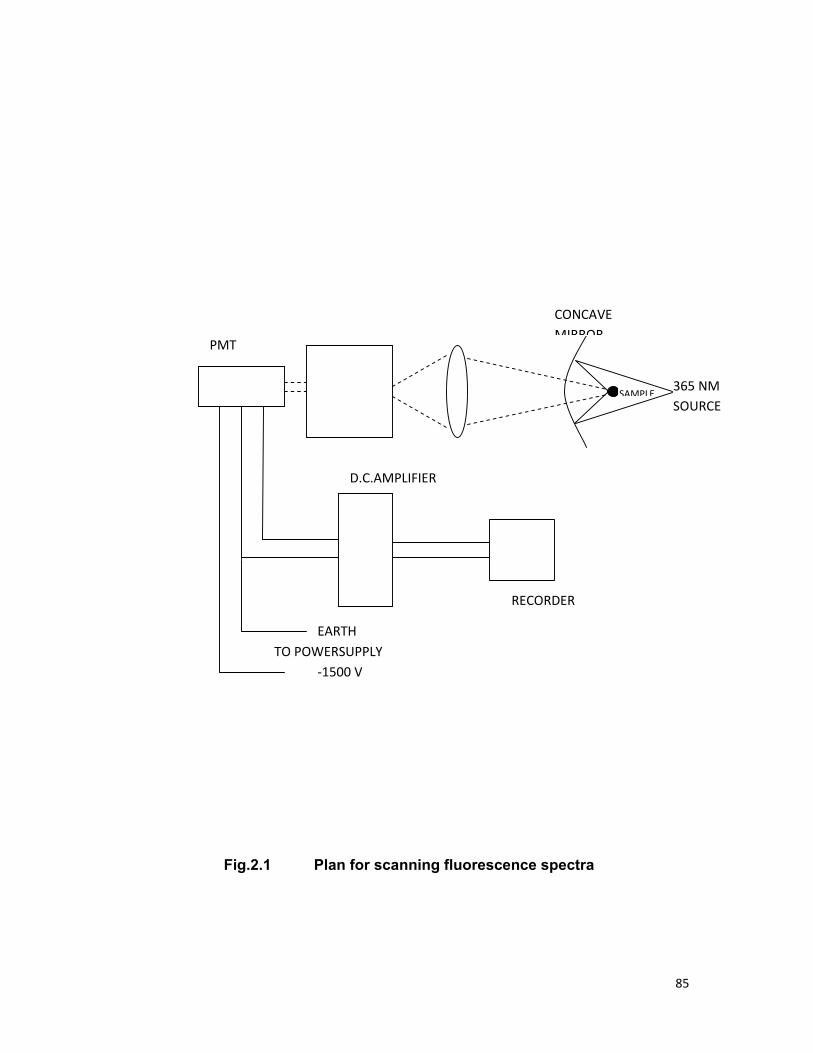
85
Fig.2.1 Plan for scanning fluorescence spectra
TO POWERSUPPLY
CONCAVE MIRROR
D.C.AMPLIFIER
RECORDER
PMT
EARTH
365 NM SOURCE
SAMPLE
‐1500 V
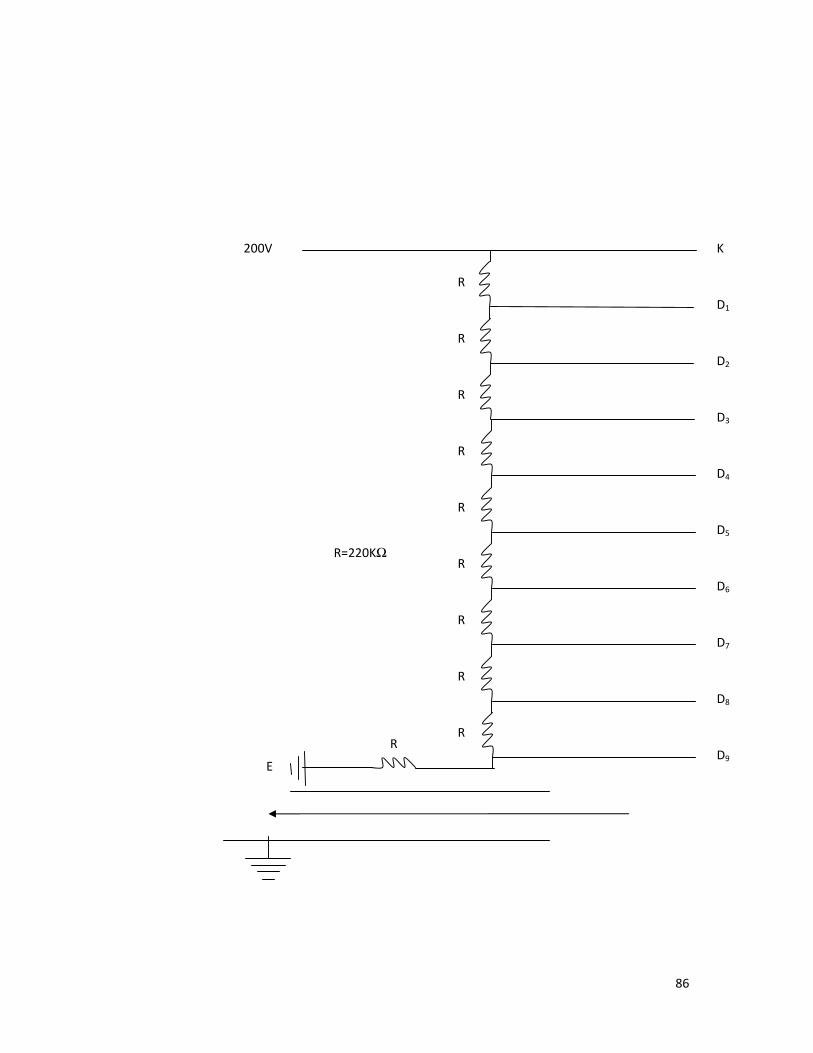
86
R
R
R
R
R
R
R
R
RR
E
D8
D9
D7
R
D1
K
R=220KΩ
D5
D4
D2
D6
D3
200V

87
Fig 2.2 Base connection of photomultiplier tube RCA 1P21
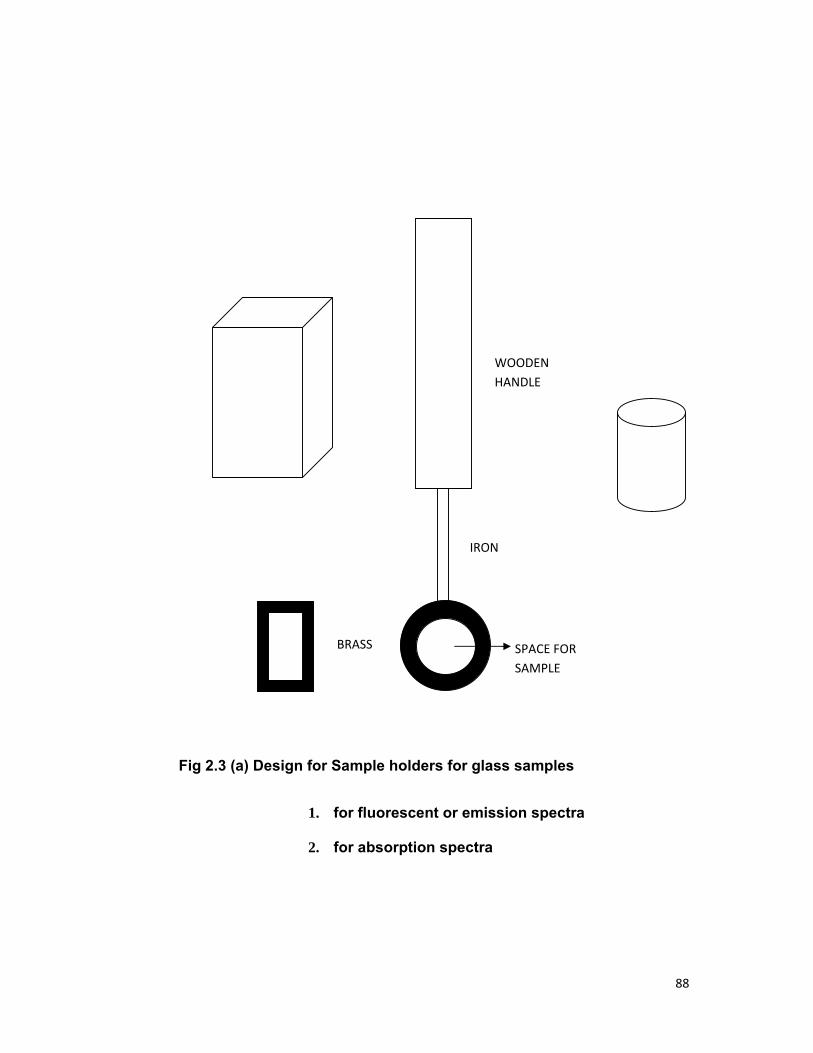
88
Fig 2.3 (a) Design for Sample holders for glass samples
1. for fluorescent or emission spectra
2. for absorption spectra
WOODEN HANDLE
IRON
SPACE FOR SAMPLE
BRASS
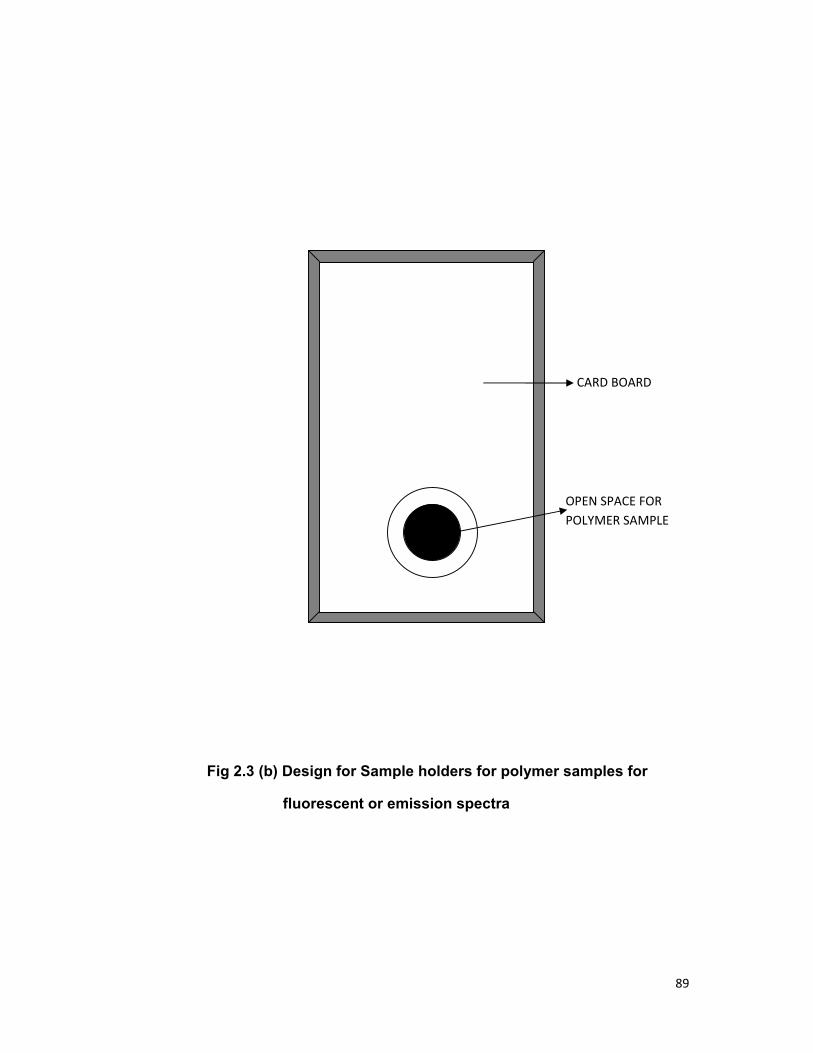
89
Fig 2.3 (b) Design for Sample holders for polymer samples for
fluorescent or emission spectra
OPEN SPACE FOR POLYMER SAMPLE
CARD BOARD
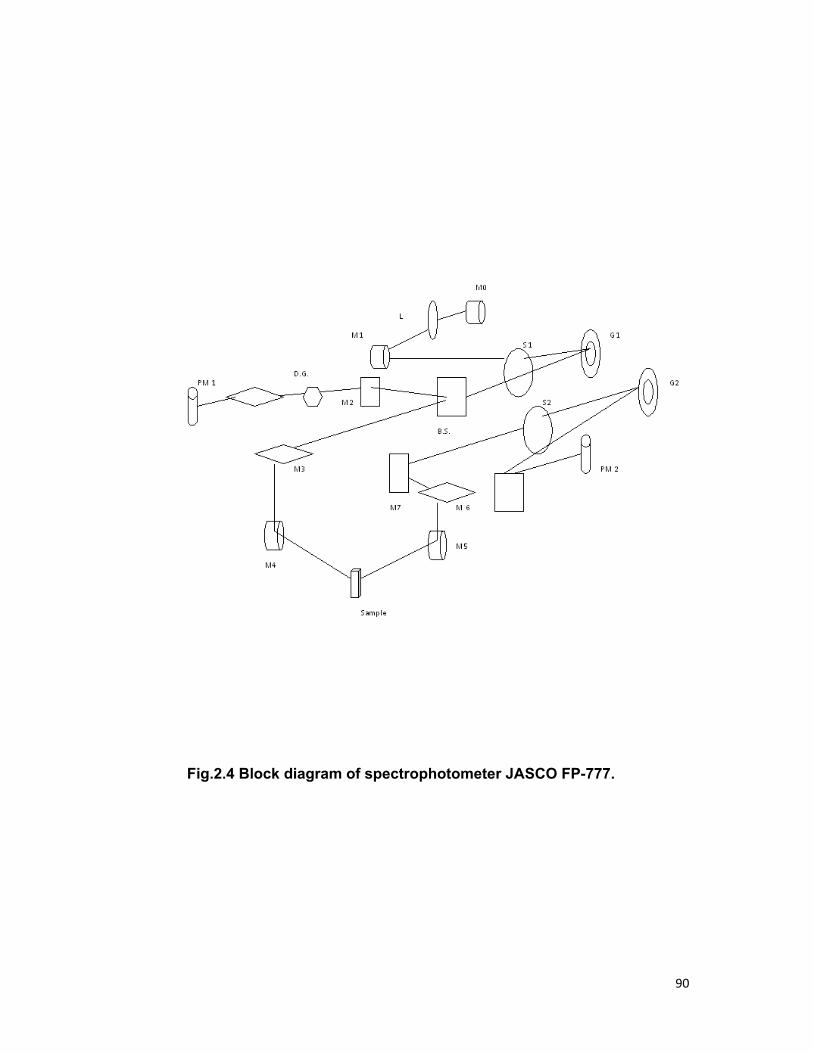
90
Fig.2.4 Block diagram of spectrophotometer JASCO FP-777.

91

92
CHAPTER 3
STUDY OF SENSITIZE LUMINESCENCE AND ENERGY TRANSFER PROCESS IN Tb-Nd,
Tb-Er AND Tb-Pr SYSTEMS IN ZINC
PHOSPHATE GLASS
93
CHAPTER 3
STUDY OF SENSITIZE LUMINESCENCE AND ENERGY TRANSFER PROCESS IN Tb-Nd, Tb-Er AND
Tb-Pr SYSTEMS IN ZINC PHOSPHATE GLASS
3.1 INTRODUCTION
The rare earth ions are characterized by their sharp absorption lines,
which occur due to transitions within 4fN configuration, and consequently the
transitions involved are immune to environmental changes[1-3], however,
the presence of two or more RE ions in a given host matrix affects the
luminescence properties of each other. Thus the interactions among the RE
ions have importance in studying the energy transfer phenomena as well as
in enhancing the emission of a given RE ion arising due to energy transfer
from another RE ion.
The terbium ion is well known for its relatively large absorption
among rare earth ions and has bright green emission. Therefore it is a
suitable choice for sensitizing other RE ions. Chrysochoos & Evers observed
energy transfer between Tb3+ to Eu3+ in dimethyl sulfoxide (DMSO) [4]. Joshi
et. al. [5] reported diffusion limited energy transfer at low Ho3+ concentration
and electric dipole-dipole interaction at higher concentration while the same
authors in other paper nonradiative energy transfer is reported from Tb3+ to
Eu3+ in zinc phosphate glass and found energy transfer mechanism is mainly

94
electric dipole- dipole in nature [6]. Some recent work on studying the
properties of terbium are cited in references [7-9].
Neodymimum finds its wide applications in glass lasers. Diffusion
limited energy transfer from Eu3+ to Nd3+ in borate glass has been studied by
Joshi et. al.[10]. Joshi observed transfer of energy from Dy3+ to Nd3+ in
calibo glass and Tm3+ to Nd3+ in zinc phosphate glass [11]. A. Sureshkumar
et.al. [12] studied the spectral properties of different conc. of Nd3+ ion in
barium lead borophosphate glass. Many other researchers also studied
neodymium properties with or without other ions in different glass matrices
[13-15].
In recent years, the erbium is the most studied RE ions in different
host materials [16-22]. Lohani [23] have reported the transfer of energy from
Mn2+ to Er3+ while Reisfeld et. al. [24] have observed non-radiative energy
transfer between Tm3+ and Er3+ ions in phosphate and borate glasses and
their result shows a mutual migration of energy between Tm3+ and Er3+ ions
. R.Lohani. [23] have reported non-radiative energy transfer from Dy3+ to Er3+
in zinc phosphate glass.
The importance of Pr3+ in infrared emission is well known. Joshi et.
al. [25] sensitized the praseodymium ion (Pr3+) by Mn2+ in phosphate glass
and reported that the energy transfer from Mn2+ to Pr3+ takes place non-
radiatively and the mechanism of energy transfer observed by them was
electric dipole-dipole interaction. Joshi has also reported non-radiative
energy transfer from Dy3+ to Pr3+ in calibo glass by electric dipole-quadrupole
interaction [26]. R.Lohani [23] has reported non-radiative energy transfer
95
from Sm3+ to Pr3+ in zinc phosphate glass. Some of the workers studying
properties of Pr3+ are cited in references [25-30].
In view of the above properties of Tb3+, Nd3+, Er3+ and Pr3+, we have
chosen the Tb3+ - Nd3+, Tb3+ - Er3+ and Tb3+ - Pr3+ systems in zinc phosphate
glass to investigate the following points:
(a) Nature of the energy transfer from Tb3+ - Nd3+, Tb3+ - Er3+ and
Tb3+ -Pr3+
(b) The mechanism of energy transfer between the ions in each of
the systems mentioned above.
(c) The levels between which the energy transfer takes place.
(d) Calculation of parameters related to energy transfer as a
function of concentration (e.g. average donor –acceptor
distance (DD-A), transfer probabilities (PDA), transfer efficiencies
(η) etc.)
(e) Comparison of the energy transfer rate in Tb-Nd, Tb-Er and
Tb-Pr systems.
3.2 EXPERIMENTAL MATERIALS AND METHODS:
Sodium dihydrogen phosphate 2-hydrate (NaH2PO4 .2H2O) and
zinc oxide (ZnO), both of reagent grade, were used in a proportion of 3:1 by
weight, were used as the constituents of the glass matrix .The method for
preparing the glass pallets has already been discussed in chapter 2.
96
The following series of glasses were prepared by doping the above
mentioned rare earth ions for studying the energy transfer.
Series 3.I: This series consists of glasses doped with 1 wt % (fixed)
of Tb3+ ions codoped with 0.2 wt %, 0.4 wt%, 0.6 wt%,
0.8 wt% and 1.0 wt% and 1.2 wt% of Nd3+ ions.
Series 3.II: This series consists of glasses doped with 1 wt % (fixed)
of Tb3+ codoped with 0.2 wt %, 0.4 wt% ,0.6 wt%,0.8 wt
% ,1.0 wt% of Er3+.
Series 3.III: This series consists of glasses doped with 1 wt %
(fixed) of Tb3+ codoped with 0.5 wt %, 1.0 wt% ,1.5
wt%,2.0 wt % ,2.5 wt% of Pr3+.
In addition to these glasses with 1 wt% of Nd3+,1 wt% of Er3+, 1 wt%
of Pr3+ were prepared to study the absorption spectra of these ions in
isolation.
Emission & absorption spectra were taken according to the method
described in chapter 2.
3.3 THEORY:
The transfer of excitation energy from one ion to another ion can
occur either via radiatively or non-radiatively. Most frequently observed
energy transfer energy transfer is non-radiative. In radiative transfer the life
time of the excited donor ion is not affected in presence of acceptor ion,
whereas in non-radiative transfer process life time of donor ion decreases on
97
increasing the acceptor concentration. In case of radiative decay the
magnitude and the shape of spectrum changes as acceptor concentration,
whereas in the case of non-radiative transfer only the magnitude not the
shape changes.
Theory of non-radiative resonance energy transfer from one molecule
(sensitizer or donor) to another molecule (activator or acceptor) was first
given by Forster [31]. The energy transfer rate (PDA), according to this
theory, is proportional to the overlap of the donor emission and acceptor
absorption spectra and R-6, where R is the donor acceptor distance. Forster
[31] theory was extended by Dexter [32] for the ions in inorganic crystals and
for higher multipolar interaction.
Interactions involving two or more ions, which provide the means for
energy transfer and co-operative relaxation, are:
1) Electric multipolar coupling arising from the interaction of
multipoles e.g. D-D, D-Q etc. of different ions.
2) Magnetic dipole-dipole interaction.
3) Exchange interaction.
The interaction between two like or two unlike ions lead to energy
transfer and relaxation in the following manner.
a. An ion A in an excited state 2 decays to its ground state 1 with
corresponding excitation of a neighboring ion B from its ground state 1 to
excited state 2. If A and B are identical ions, this process involves resonant
transfer of energy from ion to ion while this does not lead to net relaxation it

98
does give rise to spatial energy migration resonant energy transfer becomes
fast in concentrated RE ions.
b. An excited ion A decays from state 2 to 2′ while ion B initially in
its ground state is excited to 1′. A and B may or may not be identical .In the
absence of any additional interactions energy conservation imposes the
constraint of resonance i.e.
E2 – E2′= E1- E1′.
In liquids and solids, however due to the presence of ion –lattice
coupling, any energy mismatch may be taken up by the emission or
absorption of one or more phonons.
In Fig. 3.1, a schematic energy level diagram for the sensitizer (D)
and an activator (A) centre is shown. The donor is raised from the ground
state 1 to the excited state 2. In order to energy transfer to activator (A),
donor (D) has to return from state 2 to state 1/,while activator (A ) at the
same time should move from state 1 to a higher energy level. According to
Forster–Dexter theory [31, 32] this is possible only if one of the levels of A
lies at the same height as level of D, if this happens it is called resonance.
The energy transfer can take place from D→A in two essentially different
ways in following ways.
1. The transfer can be brought about by the coulomb interaction
between all charged particle of D and A. In case the distance
between D and A is so much that there charge clouds do not
overlap this is the only possible way of resonant nonradiative
energy transfer.
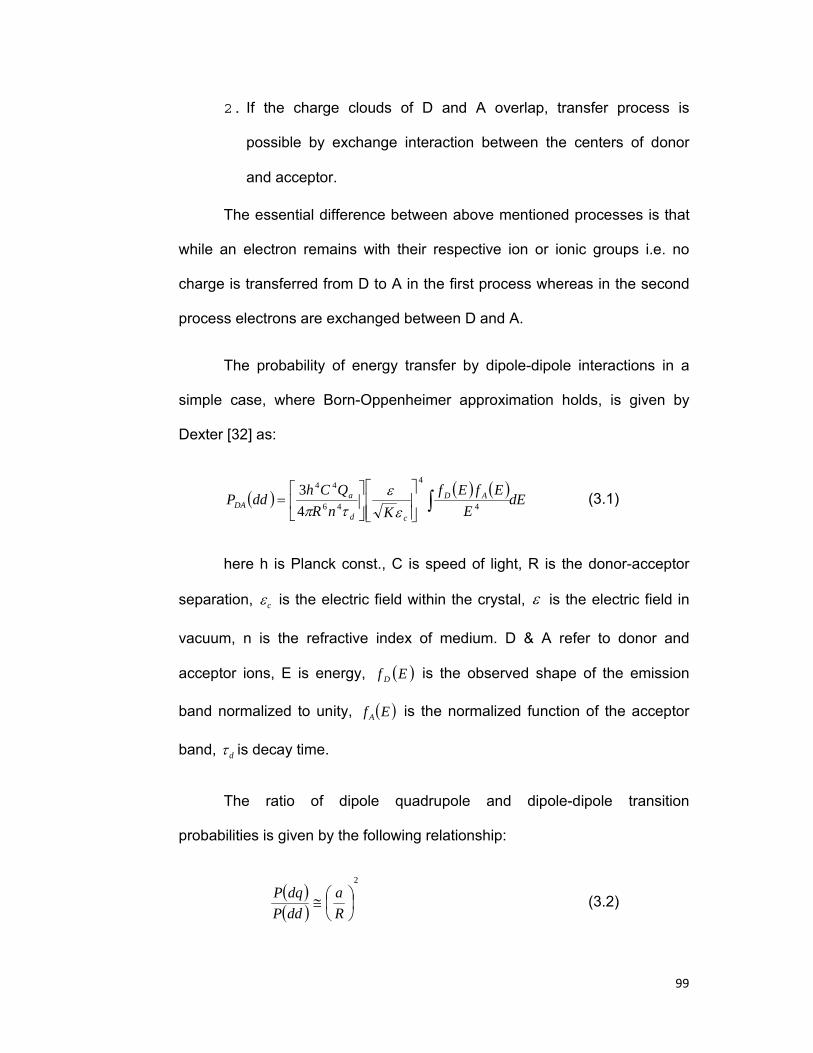
99
2. If the charge clouds of D and A overlap, transfer process is
possible by exchange interaction between the centers of donor
and acceptor.
The essential difference between above mentioned processes is that
while an electron remains with their respective ion or ionic groups i.e. no
charge is transferred from D to A in the first process whereas in the second
process electrons are exchanged between D and A.
The probability of energy transfer by dipole-dipole interactions in a
simple case, where Born-Oppenheimer approximation holds, is given by
Dexter [32] as:
( ) ( ) ( )dE
EEfEf
KnRQCh
ddP AD
cd
aDA ∫⎥
⎥⎦
⎤
⎢⎢⎣
⎡⎥⎦
⎤⎢⎣
⎡= 4
4
46
44
43
εε
τπ (3.1)
here h is Planck const., C is speed of light, R is the donor-acceptor
separation, cε is the electric field within the crystal, ε is the electric field in
vacuum, n is the refractive index of medium. D & A refer to donor and
acceptor ions, E is energy, ( )Ef D is the observed shape of the emission
band normalized to unity, ( )Ef A is the normalized function of the acceptor
band, dτ is decay time.
The ratio of dipole quadrupole and dipole-dipole transition
probabilities is given by the following relationship:
( )( )
2
⎟⎠⎞
⎜⎝⎛≅
Ra
ddPdqP
(3.2)
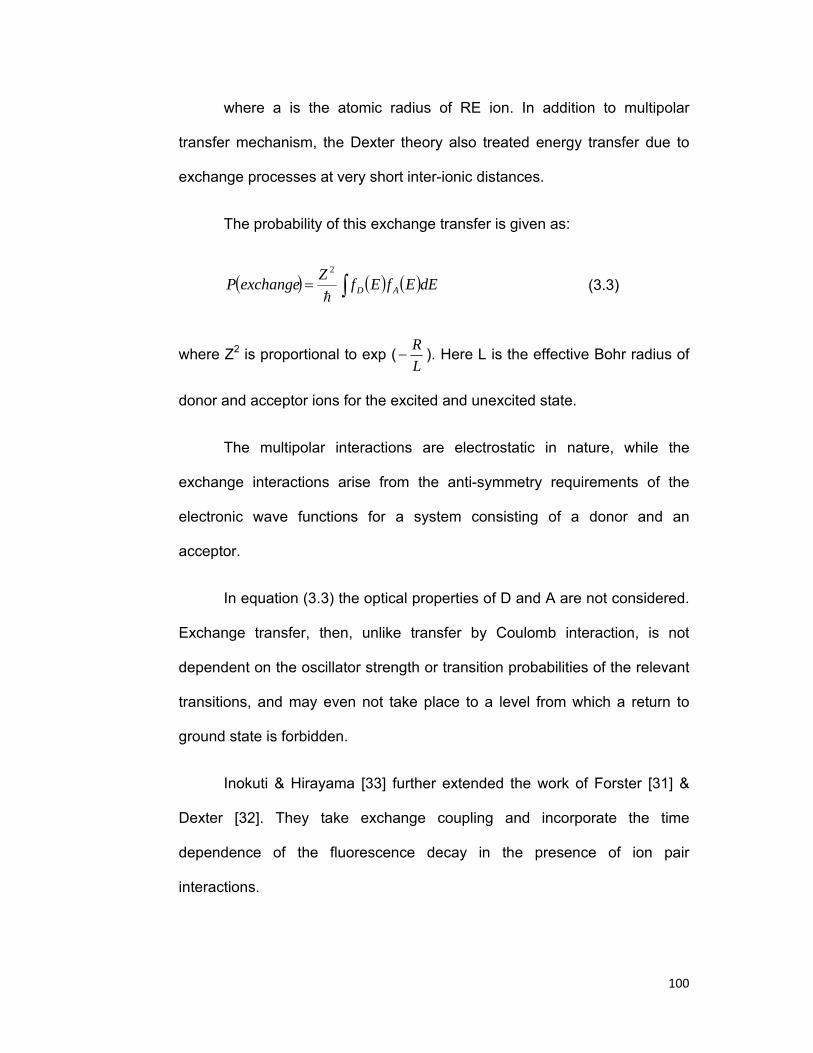
100
where a is the atomic radius of RE ion. In addition to multipolar
transfer mechanism, the Dexter theory also treated energy transfer due to
exchange processes at very short inter-ionic distances.
The probability of this exchange transfer is given as:
( ) ( ) ( )dEEfEfZexchangeP AD∫=h
2
(3.3)
where Z2 is proportional to exp (LR
− ). Here L is the effective Bohr radius of
donor and acceptor ions for the excited and unexcited state.
The multipolar interactions are electrostatic in nature, while the
exchange interactions arise from the anti-symmetry requirements of the
electronic wave functions for a system consisting of a donor and an
acceptor.
In equation (3.3) the optical properties of D and A are not considered.
Exchange transfer, then, unlike transfer by Coulomb interaction, is not
dependent on the oscillator strength or transition probabilities of the relevant
transitions, and may even not take place to a level from which a return to
ground state is forbidden.
Inokuti & Hirayama [33] further extended the work of Forster [31] &
Dexter [32]. They take exchange coupling and incorporate the time
dependence of the fluorescence decay in the presence of ion pair
interactions.
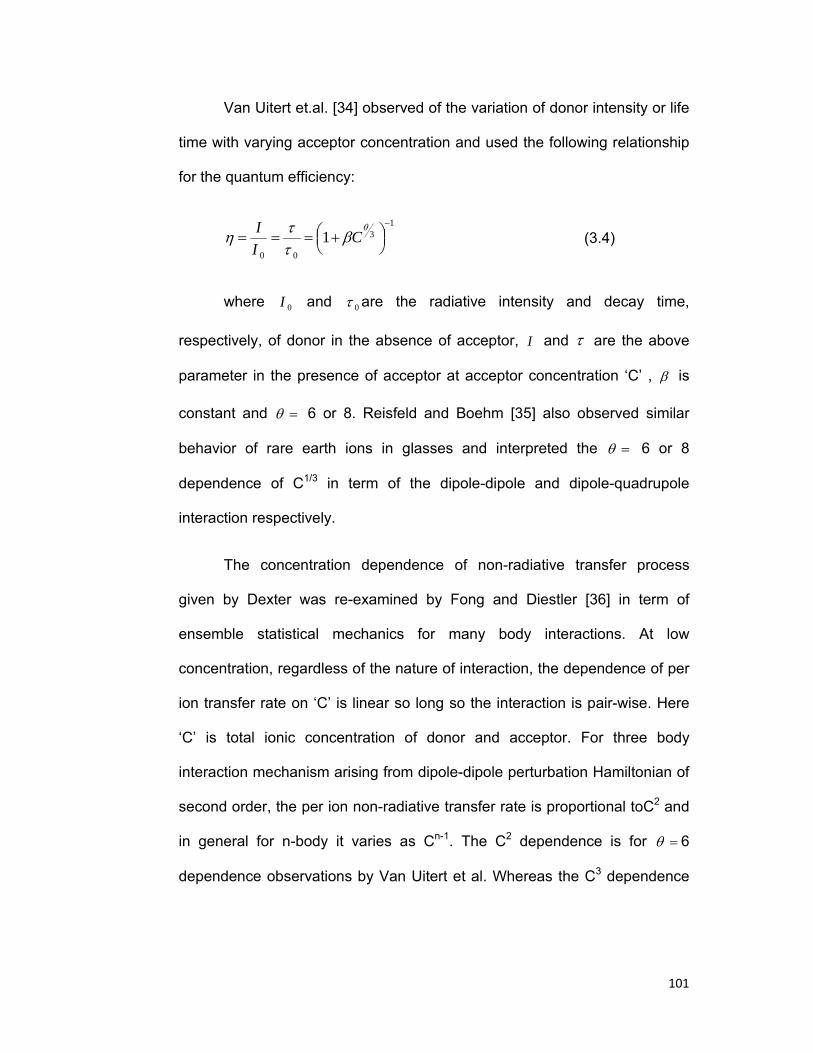
101
Van Uitert et.al. [34] observed of the variation of donor intensity or life
time with varying acceptor concentration and used the following relationship
for the quantum efficiency:
13
00
1−
⎟⎠⎞⎜
⎝⎛ +===
θβ
ττη C
II
(3.4)
where 0I and 0τ are the radiative intensity and decay time,
respectively, of donor in the absence of acceptor, I and τ are the above
parameter in the presence of acceptor at acceptor concentration ‘C’ , β is
constant and =θ 6 or 8. Reisfeld and Boehm [35] also observed similar
behavior of rare earth ions in glasses and interpreted the =θ 6 or 8
dependence of C1/3 in term of the dipole-dipole and dipole-quadrupole
interaction respectively.
The concentration dependence of non-radiative transfer process
given by Dexter was re-examined by Fong and Diestler [36] in term of
ensemble statistical mechanics for many body interactions. At low
concentration, regardless of the nature of interaction, the dependence of per
ion transfer rate on ‘C’ is linear so long so the interaction is pair-wise. Here
‘C’ is total ionic concentration of donor and acceptor. For three body
interaction mechanism arising from dipole-dipole perturbation Hamiltonian of
second order, the per ion non-radiative transfer rate is proportional toC2 and
in general for n-body it varies as Cn-1. The C2 dependence is for =θ 6
dependence observations by Van Uitert et al. Whereas the C3 dependence
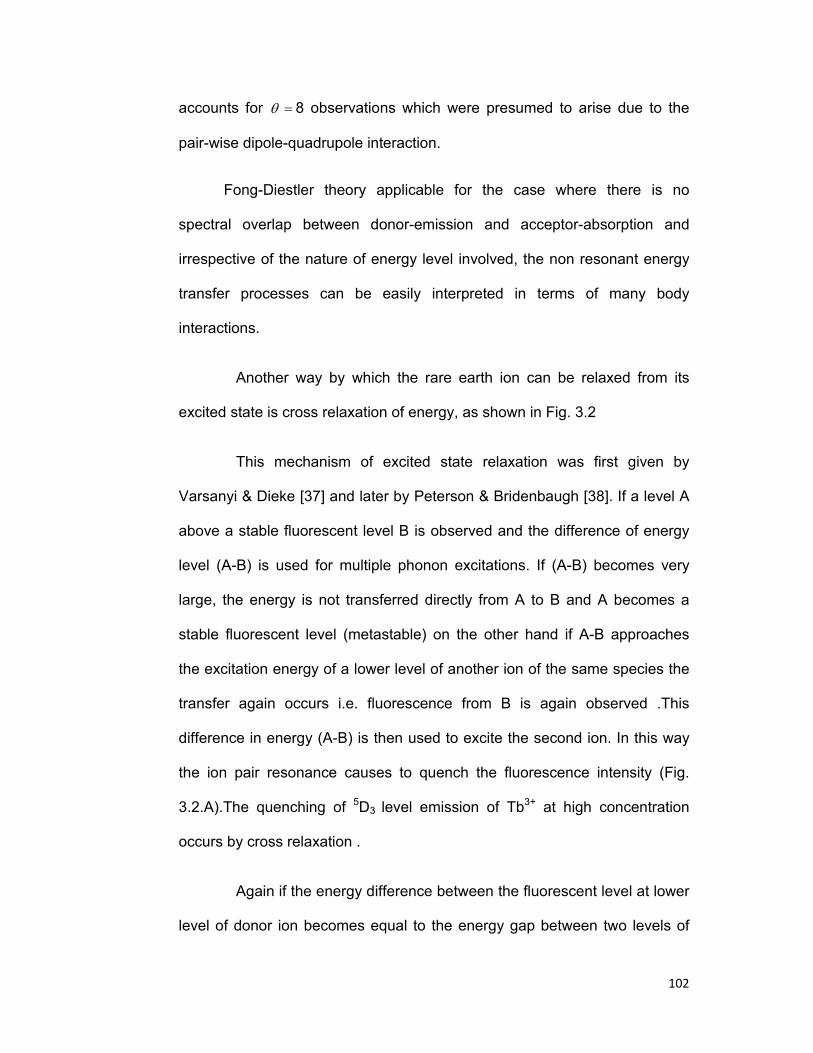
102
accounts for =θ 8 observations which were presumed to arise due to the
pair-wise dipole-quadrupole interaction.
Fong-Diestler theory applicable for the case where there is no
spectral overlap between donor-emission and acceptor-absorption and
irrespective of the nature of energy level involved, the non resonant energy
transfer processes can be easily interpreted in terms of many body
interactions.
Another way by which the rare earth ion can be relaxed from its
excited state is cross relaxation of energy, as shown in Fig. 3.2
This mechanism of excited state relaxation was first given by
Varsanyi & Dieke [37] and later by Peterson & Bridenbaugh [38]. If a level A
above a stable fluorescent level B is observed and the difference of energy
level (A-B) is used for multiple phonon excitations. If (A-B) becomes very
large, the energy is not transferred directly from A to B and A becomes a
stable fluorescent level (metastable) on the other hand if A-B approaches
the excitation energy of a lower level of another ion of the same species the
transfer again occurs i.e. fluorescence from B is again observed .This
difference in energy (A-B) is then used to excite the second ion. In this way
the ion pair resonance causes to quench the fluorescence intensity (Fig.
3.2.A).The quenching of 5D3 level emission of Tb3+ at high concentration
occurs by cross relaxation .
Again if the energy difference between the fluorescent level at lower
level of donor ion becomes equal to the energy gap between two levels of
103
the acceptor ion. The excited state of donor ion is relaxed by transferring its
energy to the acceptor by cross relaxation (Fig. 3.2 B).
Cross relaxation between different ions are given by Reisfeld and
Eckstein [24] in
Er3+[ 2P3/2 → 4G11/2] → Tm3+ [3H6→ 3H4]
Eu3+[ 5D0 → 7F6] → Nd3+ [7F7/2→ 3I9/2].
104
3.4 RESULTS AND DISCUSSION
3.4. A) The Tb - Nd system in zinc phosphate glass
Fluorescent spectra:
Fig.3.2 (A) shows the emission spectra of Tb3+ (1 wt %) in zinc
phosphate glass. It clearly shows four peaks arising from the 5D4 -7F
manifold transitions. The broadening of the lines is characteristic of the glass
matrix. Emission from the 5D3 level was not observed in our case due to high
concentration of Tb3+ ions and ions previously excited to the 5D3 level cross
relax to the 5D4 state.
Energy level diagram:
The energy level diagram of these ions is shown in Fig. 3.3. The
incident radiation (365 nm group of mercury lines) excites the Tb3+ ions. The
Tb3+ ions rapidly depopulate to luminescent 5D4 level and Nd3+ to the ground
level 4I9/2.
Nature of energy transfer:
Fig.3.4 shows the variation of Tb3+ emission intensity with the varied
concentration of Nd3+ ions and in Fig. 3.2(B) shows the emission spectra of
Tb3+ (1wt%) + Nd3+ (1wt%). Both the observations indicate that there is
overall decrease of emission intensity of Tb3+. The overall decrease of the
emission intensity of Tb3+ ion suggested that there is non-radiative energy
transfer from Tb3+ to Nd3+ ion.

105
Energy transfer by exchange process is negligible in our case
because it needs acceptor-donor separation of about 0.3-0.4nm with overlap
of wavefunction, while in our case donor-acceptor separation varies from
1.80 to 2.16 nm.
The absorption spectrum of Nd3+ in zinc phosphate glass is shown in
Fig. 3.7. The absorption peak which lies at 583nm falls partially at the
emission (5D4-7F6 transition) 592nm of Tb3+. Hence the possibility of small
radiative transfer from Tb3+ to Nd3+ can’t be ruled out.
Mechanism of energy transfer:
In order to find out the mechanism of energy transfer, we proceed
as follows:
Careful observation of energy level diagram of Tb3+ and Nd3+ in Fig.
3.3 shows that there is no energy level of Nd3+ close to 5D4 level of Tb3+. The
4G9/2 level of Nd3+ is 267 cm-1 above the 5D4 level of Tb3+ while 2G9/2 level of
Nd3+ is 1333 cm-1 below the 5D4 level of Tb3+. Hence phonon assisted
energy transfer is less possible [39]. Therefore we suggest that the only way
of energy transfer from Tb3+ to Nd3+ is the ion pair resonance or cross
relaxation. This can be explained as follows:
Tb3+ and Nd3+ are randomly distributed in glass matrix. When this
glass matrix is excited to 365nm group of mercury lines, Tb3+ ions rapidly
depopulate to luminescent 5D4 level and Nd3+ to ground level 4I9/2. On adding
Nd3+ to Tb3+ all the four peaks decreases with same proportion. As energy
gap between 5D4 & 7F0 of Tb3+ is equal to energy gap of 2G7/2 & 4I9/2 of Nd3+,
106
this may cause the energy transfer from 5D4 of Tb3+ to 4I9/2 of Nd3+.
Symbolically this may be shown as
Tb3+ (5D4-7F0 ) → Nd3+ ( 2G7/2 -4I9/2 ) (Fig.3.5).
Such processes (cross relaxation) become appreciable if energy is living in
long-lived metastable state. In present case decay time of metastable state
5D4 is 2.5 ms, hence have enough time to transfer its energy to 4I9/2 level of
Nd3+. Van Uitert et. al. also interpreted their result of self quenching of Sm3+
by cross relaxation of energy [40] . Reisfeld et. al. [24] also used this
process to explain their result of energy transfer in Tm-Er system.
Energy level involved in energy transfer:
As explained above ,the energy level between which energy
transfer can take place are 5D4 level of Tb3+ to 2G7/2 level of Nd3+ .This may
be written symbolically as Tb3+ (5D4-7F0 ) → Nd3+ ( 2G7/2 -4I9/2 ).
Multipolar term responsible for energy transfer:
To find out which of the multipolar term is responsible for energy
transfer, a graph is drawn between energy transfer probabilities (Pda) and
square of the concentration (donor & acceptor) which gives a straight line
(Fig. 3.6). The linear dependence of Pda on the square of the concentration
of donor & acceptor is attributed to because of dipole- dipole interaction
between donor & acceptor [36]. The dipole -dipole mechanism of energy
transfer is further supported by the average donor to acceptor distance
which varies in this system between 1.87nm & 2.55 nm (Table 3.1) which is
107
in the range of electric dipole- dipole interaction between donor & acceptor in
accordance with Forster’s [31] & Dexter’s [32] theories of multipolar
interactions.
Other parameters involved in the energy transfer:
In this series, the average donor acceptor distance along with the
energy transfer probabilities & transfer efficiencies are presented in table 3.1
which are calculated by using the following formulae:
DD→A = 1 / (Cd + Ca) 1/3
where Cd & Ca are donor and acceptor ion concentration per cm3 in the host
matrix.
Pda =1/τ0 (Id0/Id - 1),
η= 1 – Id/Id0.
Critical transfer distance (R0), at which the energy transfer
probability is equal to the radiative transition probability, in our system is
2.16nm. This value can be compared with those obtained by Eyal et al [41],
R0=2.1nm in Mn-Tm system in metal fluoride glass & by Joshi et. al. [42]
R0=2.50nm in Sm-UO2 system in zinc phosphate glass for electric dipole-
dipole interactions.
108
3.4. B) The Tb - Er system in zinc phosphate glass
Fluorescent spectra:
Fig.3.9 (A) shows the emission spectra of Tb3+ (1 wt%) in zinc
phosphate glass. It clearly shows four peaks arising from the 5D4 -7F
manifold transitions. The broadening of the lines is characteristic of the glass
matrix. Emission from the 5D3 level was not observed in our case due to high
concentration of Tb3+ ions and ions previously excited to the 5D3 level cross
relax to the 5D4 state.
The erbium ions also get excited by 365nm radiation and give
visible emission in some glasses, like tellurite [43] and in borate glasses by
382nm excitation source due to transition 3H11/2→3I15/2 (524nm) in tellurite
glass and due to 4S3/2→4I11/2 (548nm) in borate glasses [44]. In our case a
very weak and uncorrected spectra could be observed because of the fact
that the selection rule ∆ J = 2 is not always applicable for the fluorescent
spectrum because of the possibility of non-radiative transitions between
levels, which are dominant when energy gap is less than 3000 cm-1 [44].
This energy corresponds to about three phonons in our glass lattice. This
number of phonons can be available easily in the glass at the temperature
around it. As a result the levels 3H11/2 and 4S3/2 undergoes depopulation and
hence a weak or no emission is observed from these levels. Emission from
other levels was not observed in our study.
109
Energy level diagram:
The energy level diagram of these ions is shown in Fig. 3.8. The
incident radiation (365 nm group of mercury lines) excites the Tb3+ ions. The
Tb3+ ions rapidly depopulate to luminescent 5D4 level and Er3+ to the ground
level 4I15/2.
Nature of energy transfer:
As shown in Figs 3.9(B) and 3.10, the overall emission of Tb3+
decreases when doped along with Er3+ ions. Such an overall decrease in
donor emission indicates that there is non- radiative energy transfer from
Tb3+ to Er3+. This decrease of Tb3+ emission is more pronounced with
increasing Er3+ concentration. This decrease in Tb3+ emission can be
explained as - on increasing Er3+ concentration there are more Er3+ ions
available for receiving the excited energy of Tb3+ ions, which reduce the
radiative energy of Tb3+ ions.
Since the absorption peak (490nm) of Er3+ ions as can be seen from
Fig.3.12 falls on emission peak (490nm) of Tb3+ , the possibility of small
radiative energy transfer from Tb3+ to Er3+ can’t be neglected.
Mechanism of energy transfer:
A close look at the energy level diagram of Tb3+ and Er3+ presented
in Fig. 3.8 shows that 4F7/2 level of Er3+ is almost at same height to the 5D4
level of Tb3+. The energy can easily be transferred from Tb3+ to Er3+ as
110
follows. Small mismatch of the energy level can be compensated by the low
energy phonon.
Tb3+ and Er3+ are randomly distributed in glass matrix. When the glass
matrix is excited by 365 nm group of mercury lines, Tb3+ ions rapidly
depopulate to luminescent level 5D4 and Er3+ to ground state 4I15/2. As the
decay time of the metastable state 5D4 of Tb3+ is 2.5 ms, it has enough time
to transfer its energy to 4F7/2 of Er3+.
Energy level involved in energy transfer:
As explained above, the energy level between which energy
transfer can take place can be 5D4 level of Tb3+ to 4F7/2 of Er3+.
Multipolar term responsible for energy transfer:
The linearity of the graph drawn between energy transfer probabilities
(Pda) and square of the donor concentration + acceptor concentration (C2)
presented in Fig. 3.11 shows that electric dipole-dipole interaction is mainly
responsible for the energy transfer, which supports the Fong-Diestler theory.
The average donor acceptor distance varies from 1.45 nm to 1.71 nm (Table
3.2) also in support of electric dipole –dipole interaction suggested by
Dexter.
Energy transfer by exchange process is ruled out in present case
because it needs acceptor-donor separation of about 0.3 to 0.4 nm with
considerable overlap of wavefunction, while in present case donor acceptor
distance varies from 1.45 nm to 1.71nm.

111
Other parameters involved in the energy transfer:
The average donor acceptor distance along with the energy transfer
probabilities & transfer efficiencies are presented in table 3.2.
The critical transfer distance at which the probability of energy
transfer is equal to radiative decay in present case is equal to 1.59 nm, the
critical transfer distance can be compared with Nakazava and Shionoya [45]
in calcium metaphosphate glass for various rare earth ion pairs lying
between 0.3 nm and 1.2 nm., by Joshi et al.[6] (1.91 nm) for Dy3+-Ho3+ in
zinc phosphate glass.
3.4. C) The Tb - Pr system in zinc phosphate glass
Fluorescent spectra:
Fig.3.13 (A) shows the emission spectra of Tb3+ (1 wt%) in zinc
phosphate glass. It shows four peaks arising from the 5D4 -7F manifold
transitions. The broadening of the lines is characteristic of the glass matrix.
Emission from the 5D3 level was not observed in our case due to high
concentration of Tb3+ ions and ions previously excited to the 5D3 level cross
relax to the 5D4 state.
Energy level diagram:
The energy level diagram of these ions is shown in Fig. 3.13. The
incident radiation (365 nm group of mercury lines) excites the Tb3+ ions. The
Tb3+ ions rapidly depopulate to luminescent 5D4 level. Pr3+ is not excited by
the 365nm radiation so the ions will be in the ground level 3H4.

112
Nature of energy transfer:
On studying the figure presented in 3.13(B) and 3.15, it is observed
that the emission of Tb3+ decreases when doped along with Pr3+ ions. The
decrease in emission is noticed when the concentration of Pr3+ ion is
increased. Such an overall decrease in donor (Tb3+) emission indicates that
there is non- radiative energy transfer from Tb3+ to Pr3+. This decrease in
Tb3+ emission can be explained as, on increasing Pr3+ concentration there
are more Pr3+ ions available for receiving the excited energy of Tb3+ ions,
which reduces the radiative energy of Tb3+ ions.
Since the absorption peak (490nm) of Pr3+ ions as can be seen from
Fig.3.17 falls on emission peak (490nm) of Tb3+. Hence there is possibility of
small radiative energy transfer from Tb3+ to Pr3+.
Mechanism of energy transfer and multipolar term responsible for
energy transfer:
A close look at the energy level diagram of Tb3+ and Pr3+ presented
in Fig. 3.14 shows that 3P0 level of Pr3+ is at same height to the 5D4 level of
Tb3+.The small mismatch of the energy level can be explained by the low
energy phonon present in the lattice. Energy transfer phenomena from Tb3+
to Pr3+ is explained as
Tb3+ and Pr3+ are randomly distributed in glass matrix. When the glass
matrix is excited by 365 nm group of mercury lines, Tb3+ ions rapidly
depopulate to luminescent level 5D4 and Pr3+ to ground state 3H4. As the

113
decay time of the metastable state 5D4 of Tb3+ is 2.5 ms, it has enough time
to transfer its energy to 3P0 of Pr3+.
Energy transfer by exchange process is negligible in present case
because it needs acceptor-donor separation of about 0.3 to 0.4 nm with
overlap of wavefunction, while in present case donor acceptor distance
varies from 1.16 nm to 1.56nm.
The linearity of Fig. 3.16 (Pda versus C2) shows that electric dipole-
dipole interaction is mainly responsible for the energy transfer, which
supports the Fong-Diestler theory. The average donor acceptor distance
varies from 1.16 nm to 1.56 nm (Table 3.3) also in support of electric dipole
–dipole interaction suggested by Dexter
Energy level involved in energy transfer:
As explained above, the energy level between which energy
transfer can take place can be 5D4 level of Tb3+ to 3P0 of Pr3+.
Other parameters involved in the energy transfer:
The average donor acceptor distance along with the energy transfer
probabilities & transfer efficiencies are presented in table 3.3.
The critical transfer distance at which the probability of energy
transfer is equal to radiative decay in present case is equal to 1.40 nm, the
critical transfer distance can be compared with the values obtained by
Nakazava and Shionoya in calcium-metaphospate glass [46] for various rare
114
earth ion pairs (lying between 0.3nm and 1.2nm) and Reisfeld &Boehm for
Sm-Eu pair in phosphate glass (1.44nm) [29].
3.5 CONCLUDING REMARKS:
In this chapter the study of energy transfer in Tb-Nd, Tb-Er and Tb-
Pr systems in zinc phosphate glass has been done. In all the above
mentioned series Tb3+ is taken as sensitizer (donor) and Nd3+, Er3+ , Pr3+
are taken as activator (acceptor). Tb3+ emission is observed decreasing with
the increasing concentration of Nd3+, Er3+, and Pr3+. This is explained by
non-radiative energy transfer from Tb3+ to Nd3+, Er3+, and Pr3+. However the
absorption peak (583nm) of Nd3+ and absorption peak (490nm) of Pr3+ falls
partially at the emission peak at 592nm(5D4-7F6 transition) of Tb3+ ions, small
possibility of radiative energy transfer can’t be ruled out. We calculated the
various parameters as average donor-acceptor distance (DD-A), energy
transfer probability (Pda) and transfer efficiency (η ), which are necessary for
the study of non-radiative energy transfer.
The energy transfer mechanism in Tb-Nd system is explained using
the cross relaxation. Fong-Deistler theory is used to find the multipolar term
responsible for the energy transfer. The linearity of the graph plotted
between energy transfer probability and square of donor + acceptor
concentration in all the above series suggested that the electric dipole-dipole
interaction is mainly found for the energy transfer.
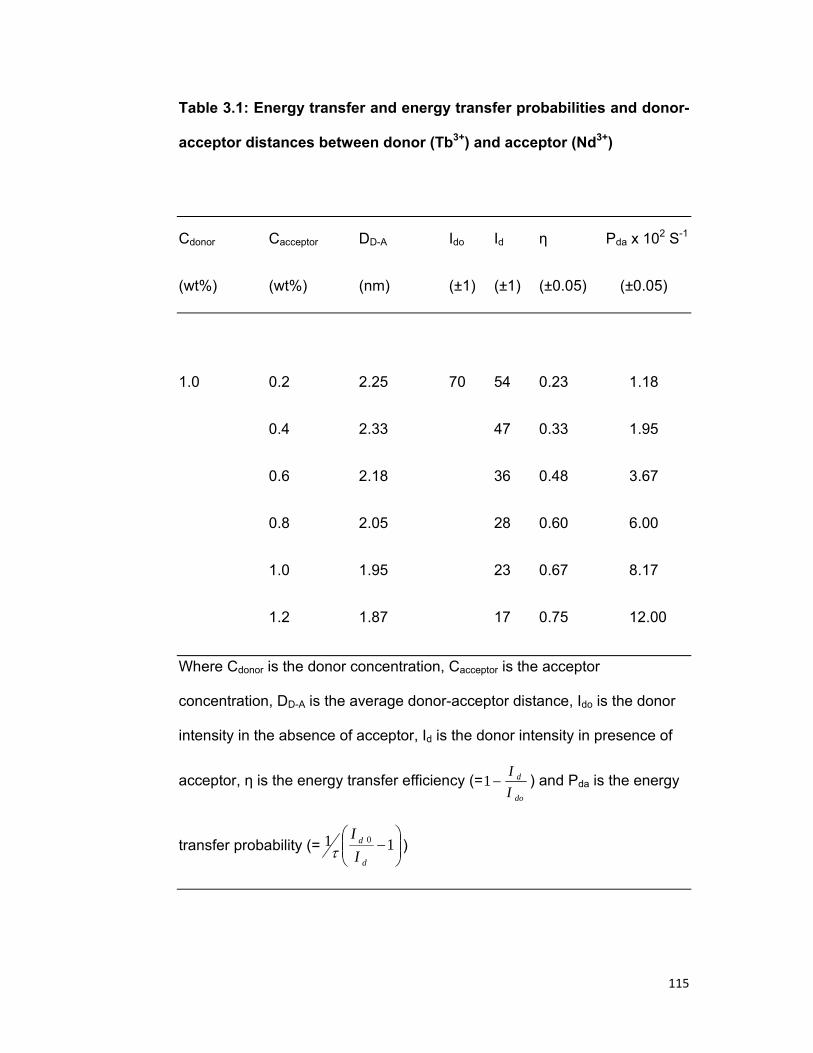
115
Table 3.1: Energy transfer and energy transfer probabilities and donor-
acceptor distances between donor (Tb3+) and acceptor (Nd3+)
Cdonor Cacceptor DD-A Ido Id η Pda x 102 S-1
(wt%) (wt%) (nm) (±1) (±1) (±0.05) (±0.05)
1.0 0.2 2.25 70 54 0.23 1.18
0.4 2.33 47 0.33 1.95
0.6 2.18 36 0.48 3.67
0.8 2.05 28 0.60 6.00
1.0 1.95 23 0.67 8.17
1.2 1.87 17 0.75 12.00
Where Cdonor is the donor concentration, Cacceptor is the acceptor
concentration, DD-A is the average donor-acceptor distance, Ido is the donor
intensity in the absence of acceptor, Id is the donor intensity in presence of
acceptor, η is the energy transfer efficiency (=do
d
II
−1 ) and Pda is the energy
transfer probability (= ⎟⎟⎠
⎞⎜⎜⎝
⎛−11 0
d
d
II
τ )
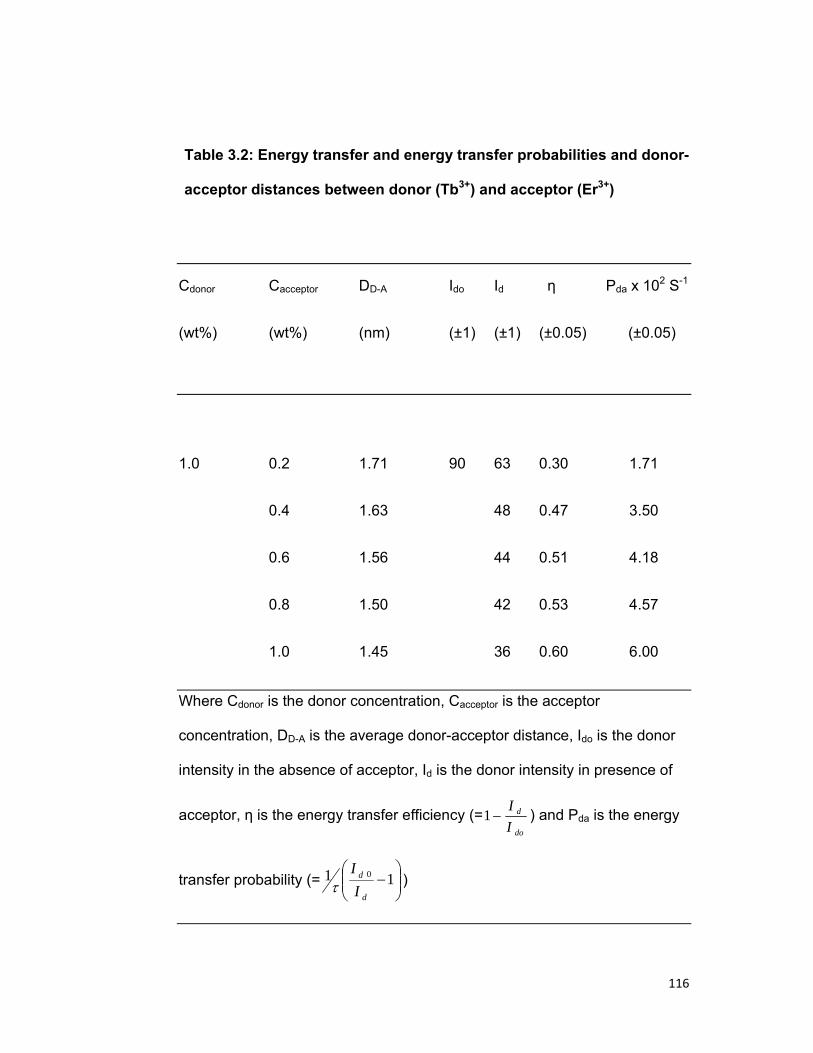
116
Table 3.2: Energy transfer and energy transfer probabilities and donor-
acceptor distances between donor (Tb3+) and acceptor (Er3+)
Cdonor Cacceptor DD-A Ido Id η Pda x 102 S-1
(wt%) (wt%) (nm) (±1) (±1) (±0.05) (±0.05)
1.0 0.2 1.71 90 63 0.30 1.71
0.4 1.63 48 0.47 3.50
0.6 1.56 44 0.51 4.18
0.8 1.50 42 0.53 4.57
1.0 1.45 36 0.60 6.00
Where Cdonor is the donor concentration, Cacceptor is the acceptor
concentration, DD-A is the average donor-acceptor distance, Ido is the donor
intensity in the absence of acceptor, Id is the donor intensity in presence of
acceptor, η is the energy transfer efficiency (=do
d
II
−1 ) and Pda is the energy
transfer probability (= ⎟⎟⎠
⎞⎜⎜⎝
⎛−11 0
d
d
II
τ )

117
Table 3.3: Energy transfer and energy transfer probabilities and donor-
acceptor distances between donor (Tb3+) and acceptor (Pr3+)
Cdonor Cacceptor DD-A Ido Id η Pda x 102 S-1
(wt%) (wt%) (nm) (±1) (±1) (±0.05) (±0.05)
1.0 0.5 1.56 80 53 0.33 2.04
1.0 1.41 42 0.47 3.62
1.5 1.30 30 0.62 6.67
2.0 1.23 25 0.68 8.80
2.5 1.16 21 0.73 11.20
Where Cdonor is the donor concentration, Cacceptor is the acceptor
concentration, DD-A is the average donor-acceptor distance, Ido is the donor
intensity in the absence of acceptor, Id is the donor intensity in presence of
acceptor, η is the energy transfer efficiency (=do
d
II
−1 ) and Pda is the energy
transfer probability (= ⎟⎟⎠
⎞⎜⎜⎝
⎛−11 0
d
d
II
τ )
118
BIBLIOGRAPHY
1 G.H.Dieke: Spectra and Energy levels of Rare Earth Ions in
crystals (John Wiely and Sons., New York) 1968.
2 B.G.Wybourne: Spectroscopic properties of Rare Earths (Wiely
Interscience, New York) 1965.
3 M.A.Eliashevich: Spectra and Rare Earths (State Publishing house,
Moscow) 1953.
4 J.Chrysochoos & A.Evans:Chem. Phys.Lett., 20(1973)174.
5 J.C.Joshi, N.C.Pandey, B.C.Joshi, R.Belwal & Janardan Joshi:
J.Non Cryst. Solids, 27(1978)173.
6 B.C.Joshi:J.Non Cryst. Solids, 180(1995)217.
7 H.E.Bendoff, Heider priem et.al. : J.Phys.: condensed matter,
11(1999)7627.
8 L.De, S.Menzeas, G.S.Marcial, and B.deAreujo: J.Appl.Phys.,
94(2003)863.
9 M.A.Noginov, P.Venkateswarlu and M.Mahdi:J.Opt.Soc.Am.B,
13(1996)735.
10 J.C.Joshi, N.C.Pandey, B.C.Joshi, R.Belwal & Janardan Joshi:
J.Solid State Chem., 23(1978)135.
11 B.C.Joshi, R.Lohani:J. Non Cryst.Solids, 215(1997)103.
12 A.Sureshkumar & A.B.Manjubhasini:Ind.J.Pure & appl.Phys,
43(2005)17.
119
13 H.Jiang, John Myers, D.Rhonehouse, M.Myers:Am.Ceramic Soc.
Annl.Meet, (2000).
14 Paul.R.Ehrmann& John H.Campbell:J.Numerical Society,
85(2002)1061.
15 L.De, S.Menzeas, G.S.Marcial and B.de Areujo: J.Appl.Phys.,
94(2003)863.
16 M. Shojiya, M. Takahashi, R. Kanno, Appl. Phys. Lett. ,65(1994)
1874.
17 K. Kojima, S. Yoshida, H. Shiraishi, Appl. Phys. Lett. ,67(1995)
3423.
18 J. J. Ju, T. Y. Kwon, S. I. Yun, Appl. Phys. Lett., 69(1996) 1358.
19 T.Gregorkiewicz, D.T.X.Yhao, J.M.Langer: Physica Status Solidi,
210(1999)735.
20 S.M.Karstriskii, Yu N.Kortisko, V.A.Fedorov, C.Sada: Physica
status solidi, 1(11) (2004)3158.
21 F.Auzel:Acta Physica Polonica,90(1996).
22 Y.Yan, A.J.Faber, H.De Wall: J.NonCryst.Solids, 181(1995)283.
23 R. K. Lohani: Unpublished Ph.D. thesis submitted to Kumaun
University, (2000).
24 R.Reisfeld & Y.Eckstein: J.Noncryst.solids, 11(1973) 261.
25 B.C.Joshi & M.C.Joshi & B.D.Joshi:J. Phy. Chem. Solids, 52 (1991)
939.
26 B.C.Joshi: Unpublished Ph.D. thesis submitted to Kumaun
University,(1978).
120
27 Y.K. Sharma, R.K. Singh and S.S.L.Surana, International
Conference on disordered systems, Goa (India) Sept. 24 (2004).
28 N.Krasutsky and H.W.Moos: Phys.Rev., B8 (1973)1010.
29 W.T.Carnall, P.R.Fields and K.Rajanak: J.Chem Phys.,
49(1968)4424.
30 P.Goldner and F.Auzel: Journal of applied physics, 79(1996)7972.
31 Th. Forster: Ann.Phys., 2(1948)55.
32 D.L.Dexter: J.Chem.Phys., 21(1953)836.
33 M. Inokuti & F. Hirayama: J. Chem. Phys., 43(1965)197.
34 L.G.Van Uitert, E.F.Dearborn and J.J.Rubin: J.Chem.Phys.,
45(1966)1578.
35 R.Reisfeld and L.Boehm: J.Solid State Chem., 4(1972)417.
36 F.K.Fong and D.J.Diestler: J.Chem. Phys., 56(1972)417.
37 F. Varsanyi & G.H.Deike: Phys. Rev. Lett.,7(1961).442.
38 G.E.Peterson & P.M.Bridenbaugh: J.Opt.Soc.America, 53 (1963)
112.
39 T. Miyakawa & D. L.Dexter, Phys Rev B.,1(1970)2961.
40 L.G.Van Uitert & L.F.Johnson: J. Chem. Phys., 44(1966) 3514.
41 M. Eyal, R. Reisfeld, A.Schiller, C.Jacobani & C.K.Jorgenson:Chem.
Phys. Lett. , 140 (1987)595.
42 B.C.Joshi & R. Lohani, Bimal pandey: J. Noncryst. Solids,
337(2004)97.
43 R.Reisfeld & Y.Eckstein: J.Non-cryst.solids, 15(1974) 125.
44 R.Reisfeld & Y.Eckstein: J.Solid State Chem, 5(1972) 183.
45 E Nakazava & Shionoyas: J Chem Phys, 47(1967) 3211.
121
46 E Nakazava & Shionoyas: J.Phys.Soc.Japan, 28 (1972) 1260.
122
Figure Caption
Fig. 3.1: A) Schematic representation of multipolar resonance.
B) Schematic representation of multipolar transfer.
C) Schematic representation of non resonant energy transfer.
Fig.3.2 Emission spectra of (A) Tb3+ (1.0 wt % fixed) (B) Tb3+ (1 wt%) + Nd3+ (0.4 wt%
Fig.3.3 Energy level diagrams of Tb3+ and Nd3+ .
Fig.3.4 Emission spectra of Tb3+ (1.0 wt %) in presence of varing
concentration of Nd3+.
Fig.3.5 Schematic representation of cross relaxation betweenTb3+ and
Nd3+ .
Fig.3.6 Variation of energy transfer probability (Pda) with square of
donor + acceptor concentration.
Fig.3.7 Absorption spectra of Nd3+ (1.0wt%) in zinc phosphate glass.
Fig. 3.8 Energy level diagram of Tb3+ and Er3+.
Fig 3.9 Emission spectra of (A) Tb3+ (1.0 wt %) and (B) Tb3+ (1.0wt %) + Er3+ (0.6wt %) in zinc phosphate glass.
Fig 3.10 Emission spectra of Tb3+ with varying concentration of Er3+
in zinc phosphate glass.
123
Fig 3.11 Variation of energy transfer probability, Pda, with square of
donor + acceptor concentration.
Fig. 3.12 Absorption spectra Er-3+ (1 wt %) in zinc phosphate glass.
Fig.3.13 Emission spectra of (A) Tb3+ (1.0 wt % fixed) (B) Tb3+ (1 wt%)
+ Pr3+ (1.0 wt%).
Fig. 3.14 Energy level diagram of Tb3+ and Pr3+.
Fig. 3.15 Variation of Tb3+ ion emission with the varied concentration of
Pr3+ in zinc phosphate glas
Fig.3.16 Variation of energy transfer probability (Pda) with square of
donor + acceptor concentration.
Fig. 3.17 Absorption spectra of Pr3+(1 wt%) in zinc phosphate glass.
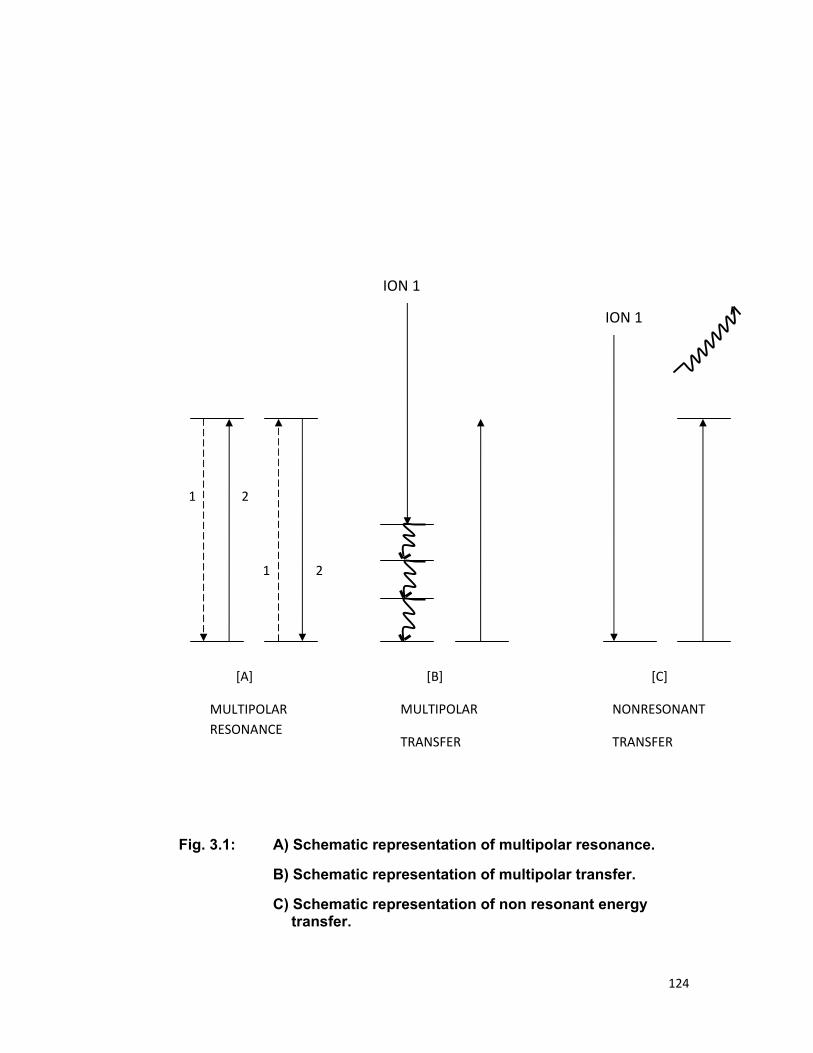
124
Fig. 3.1: A) Schematic representation of multipolar resonance.
B) Schematic representation of multipolar transfer.
C) Schematic representation of non resonant energy transfer.
ION 1
ION 1
1 2
2 1
[A]
MULTIPOLAR RESONANCE
[B]
MULTIPOLAR
TRANSFER
[C]
NONRESONANT
TRANSFER
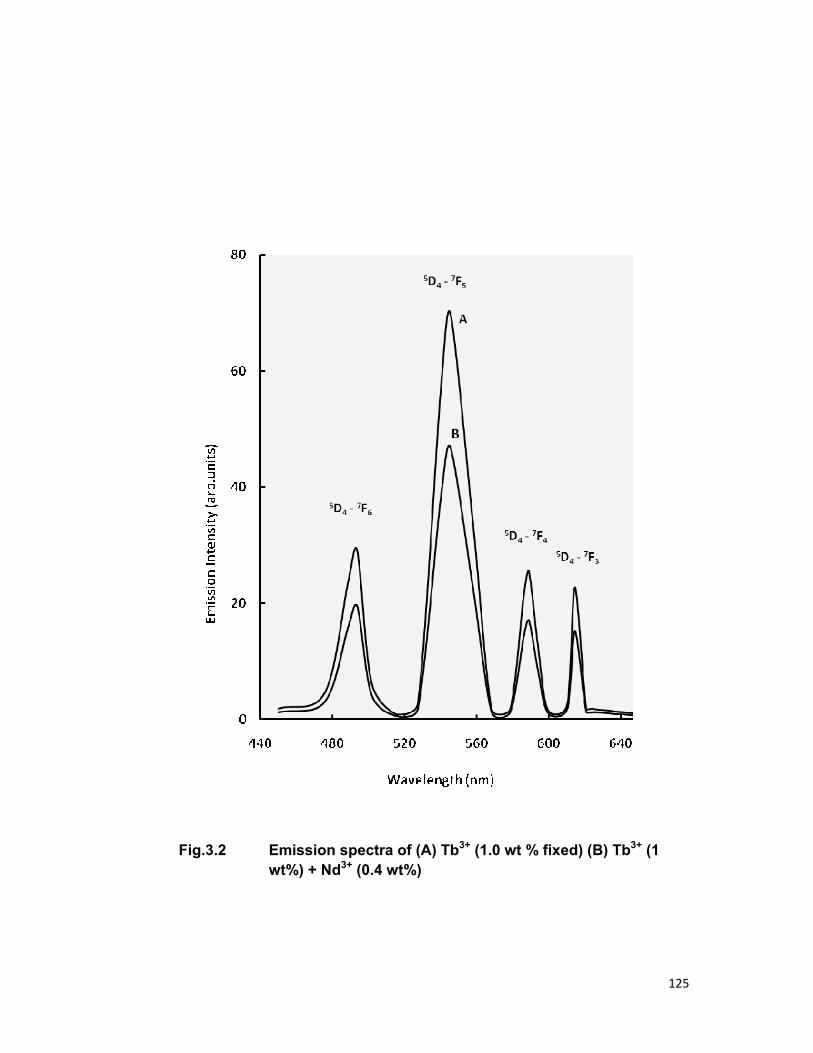
125
Fig.3.2 Emission spectra of (A) Tb3+ (1.0 wt % fixed) (B) Tb3+ (1 wt%) + Nd3+ (0.4 wt%)

126
Fig.3.3 Energy level diagrams of Tb3+ and Nd3+ .

127
Fig.3.4 Emission spectra of Tb3+ (1.0 wt %) in presence of varing
concentration of Nd3+.
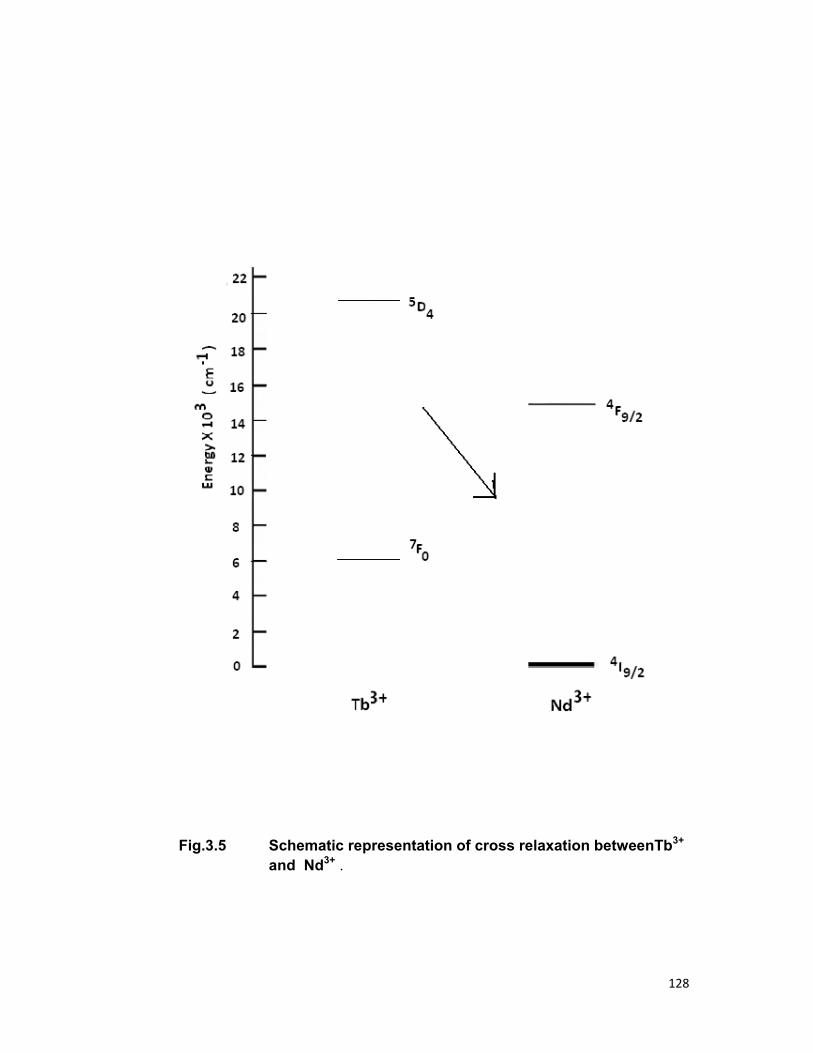
128
Fig.3.5 Schematic representation of cross relaxation betweenTb3+ and Nd3+ .
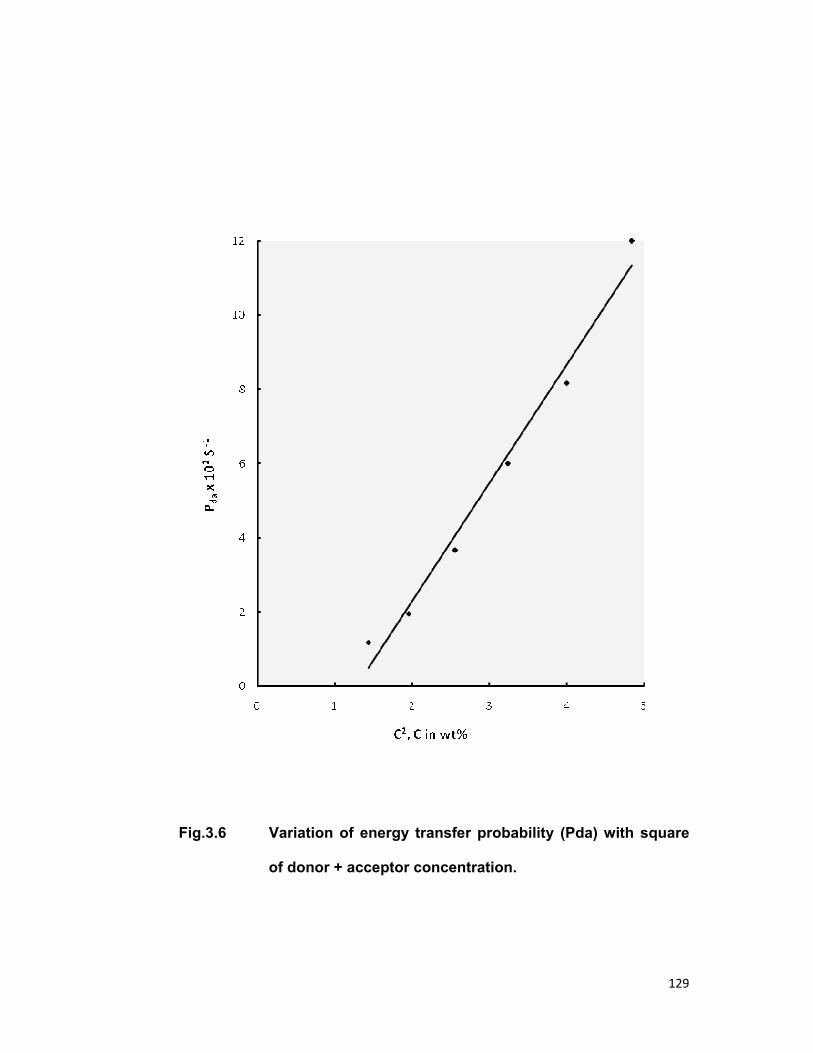
129
Fig.3.6 Variation of energy transfer probability (Pda) with square
of donor + acceptor concentration.
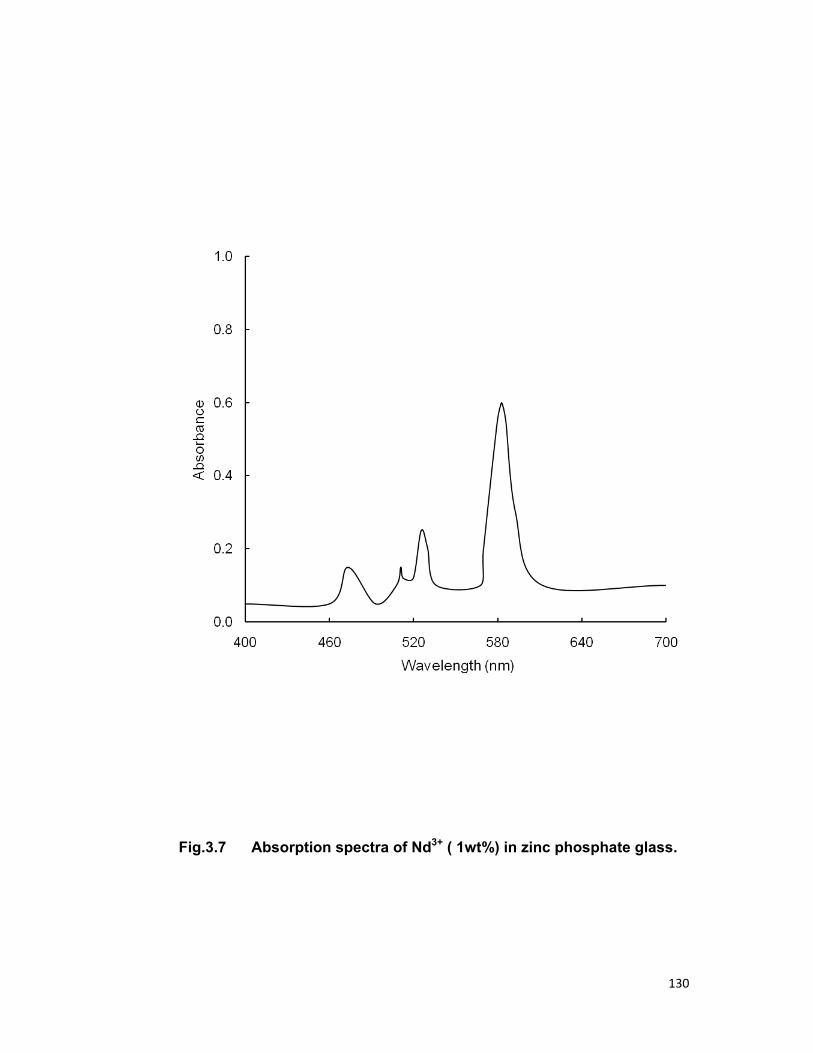
130
Fig.3.7 Absorption spectra of Nd3+ ( 1wt%) in zinc phosphate glass.
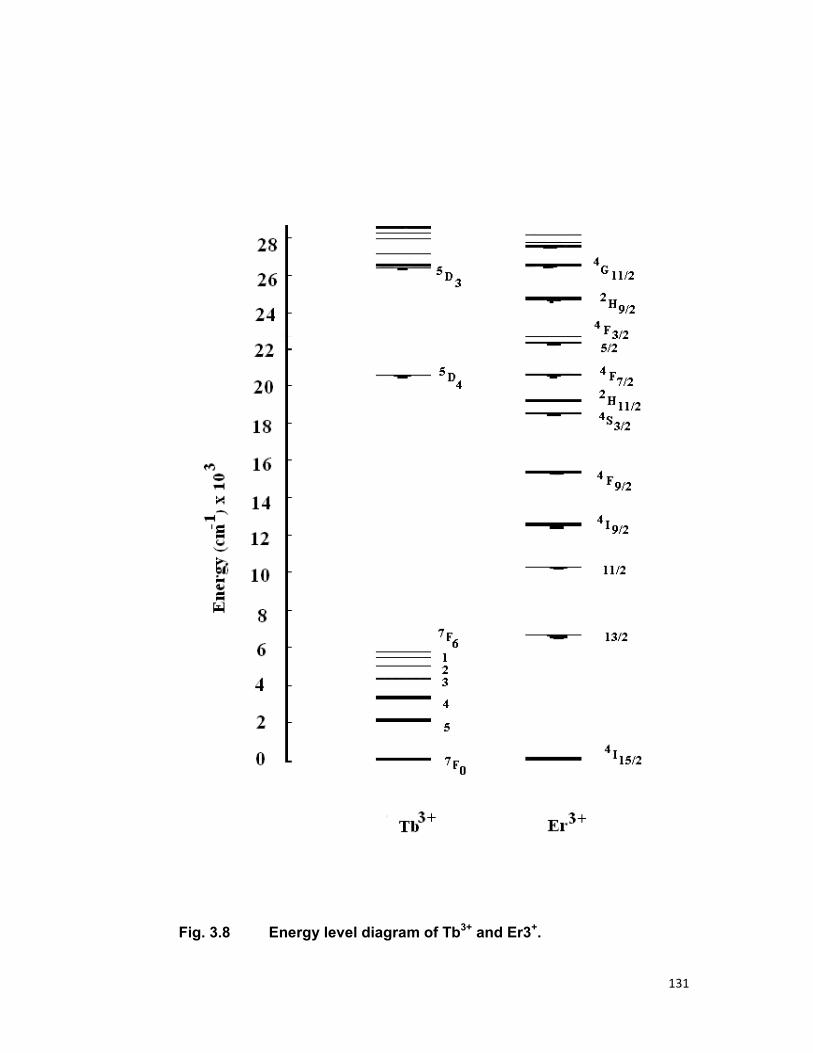
131
Fig. 3.8 Energy level diagram of Tb3+ and Er3+.

132
Fig 3.9 Emission spectra of (A) Tb3+ (1.0 wt %) and (B) Tb3+ (1.0wt %) + Er3+ (0.6wt %) in zinc phosphate glass.
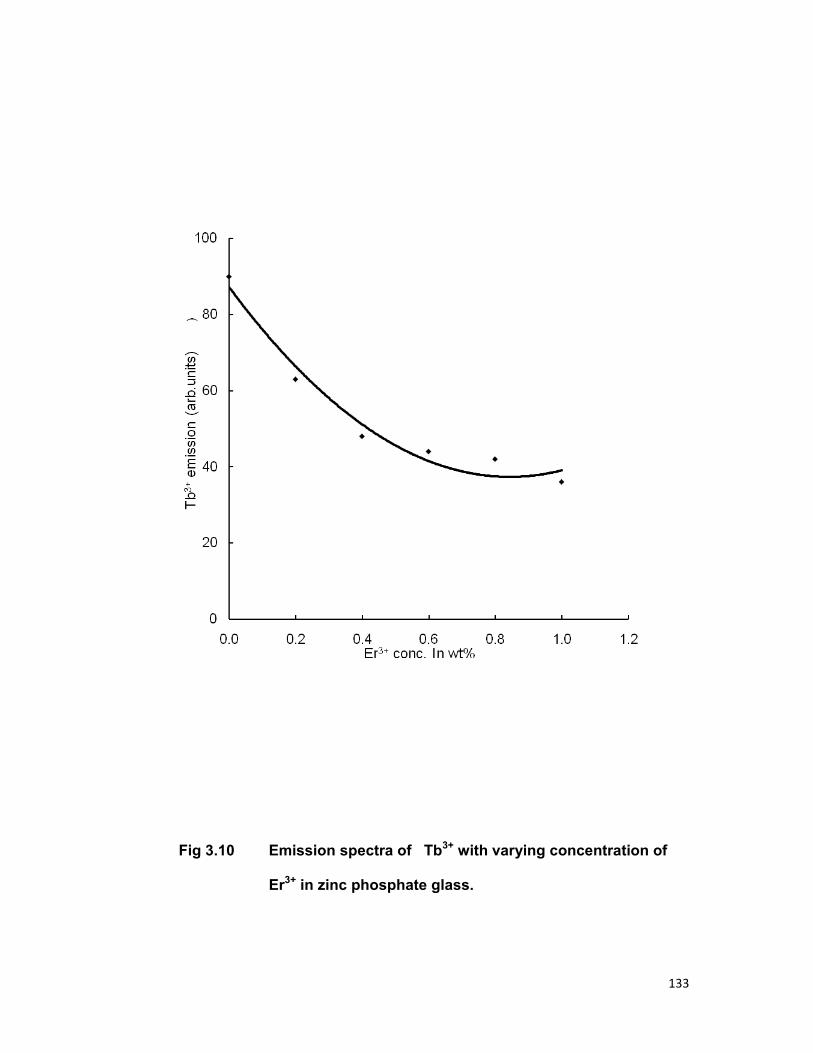
133
Fig 3.10 Emission spectra of Tb3+ with varying concentration of
Er3+ in zinc phosphate glass.
134
Fig 3.11 Variation of energy transfer probability, Pda, with square of
donor + acceptor concentration.
0
2
4
6
1 2 3 4 5C2, C is donor+acceptor concentration
Pdax 10
2S
-1
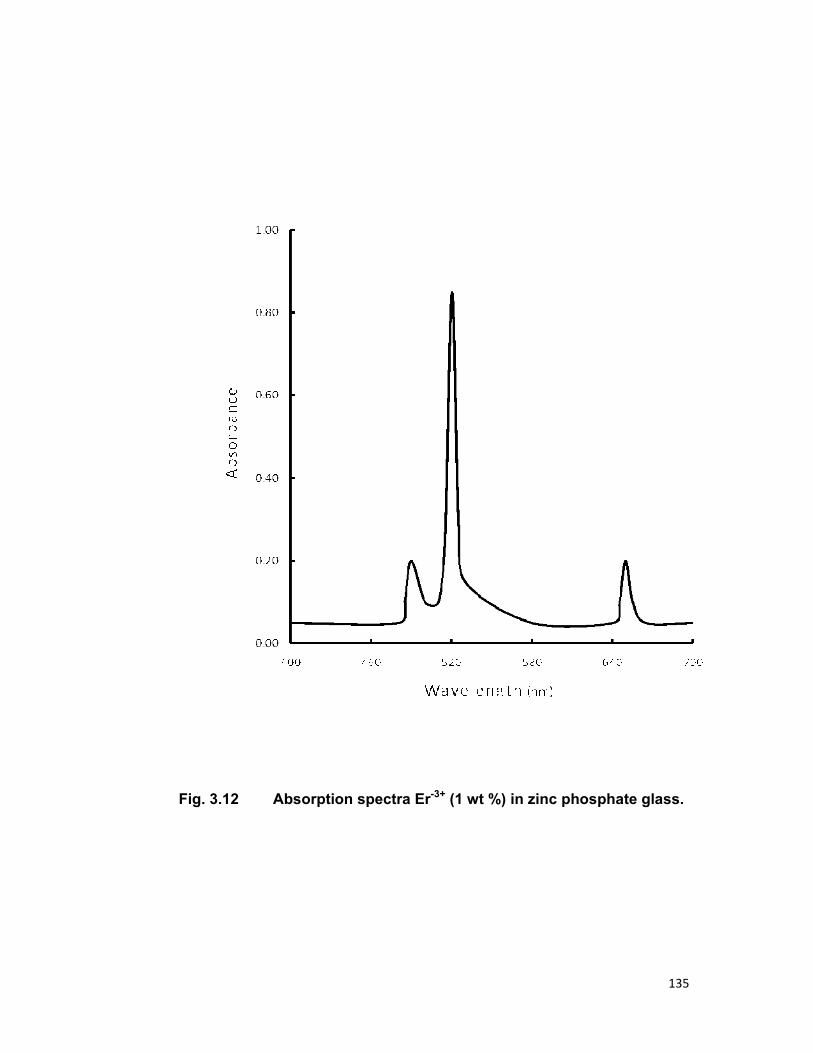
135
Fig. 3.12 Absorption spectra Er-3+ (1 wt %) in zinc phosphate glass.
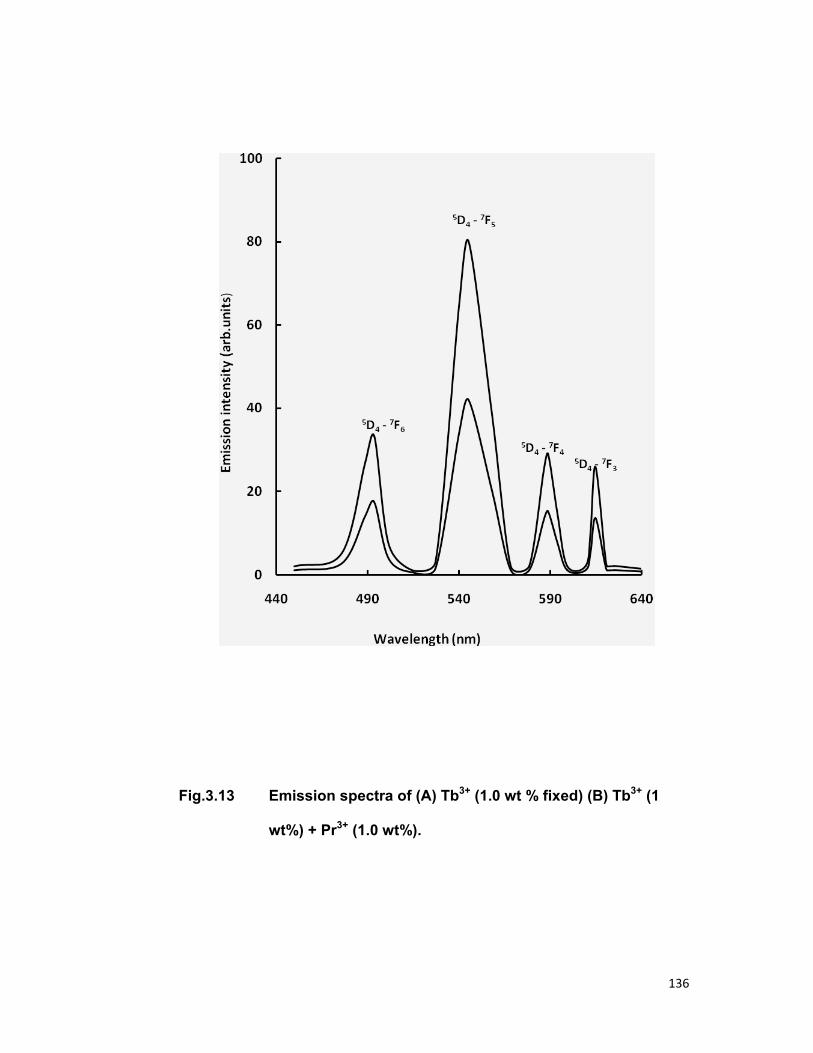
136
Fig.3.13 Emission spectra of (A) Tb3+ (1.0 wt % fixed) (B) Tb3+ (1
wt%) + Pr3+ (1.0 wt%).

137
Fig. 3.14 Energy level diagram of Tb3+ and Pr3+.
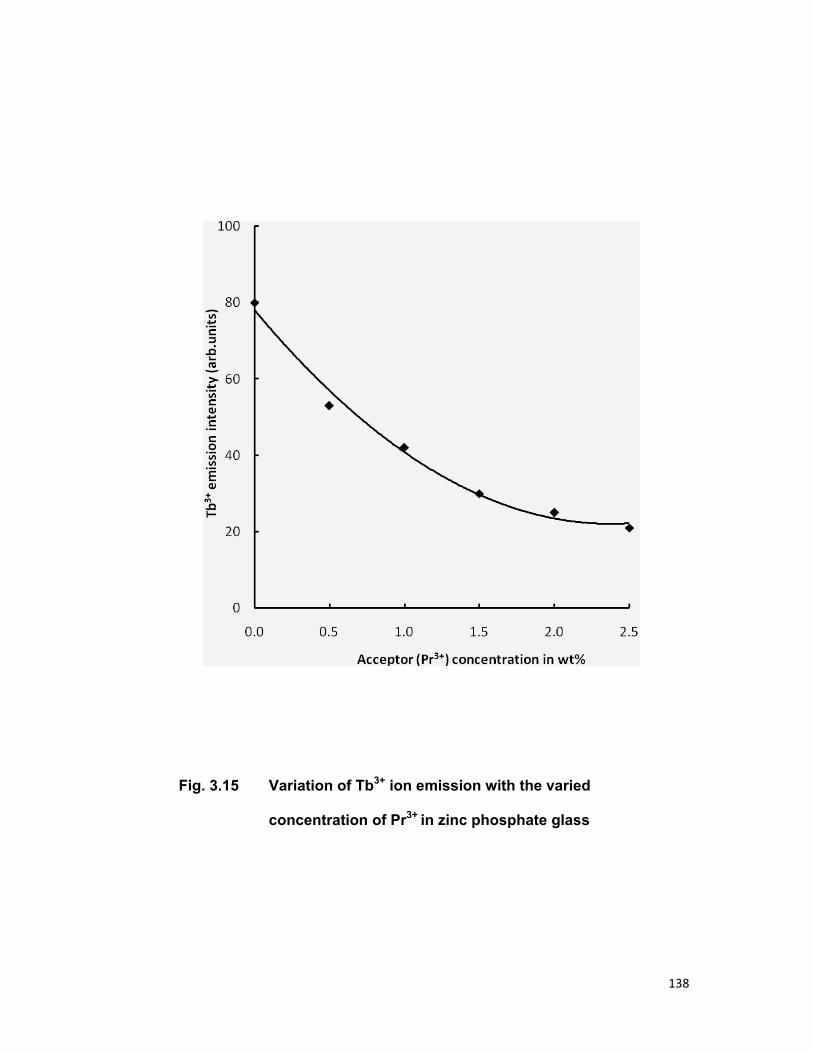
138
Fig. 3.15 Variation of Tb3+ ion emission with the varied
concentration of Pr3+ in zinc phosphate glass
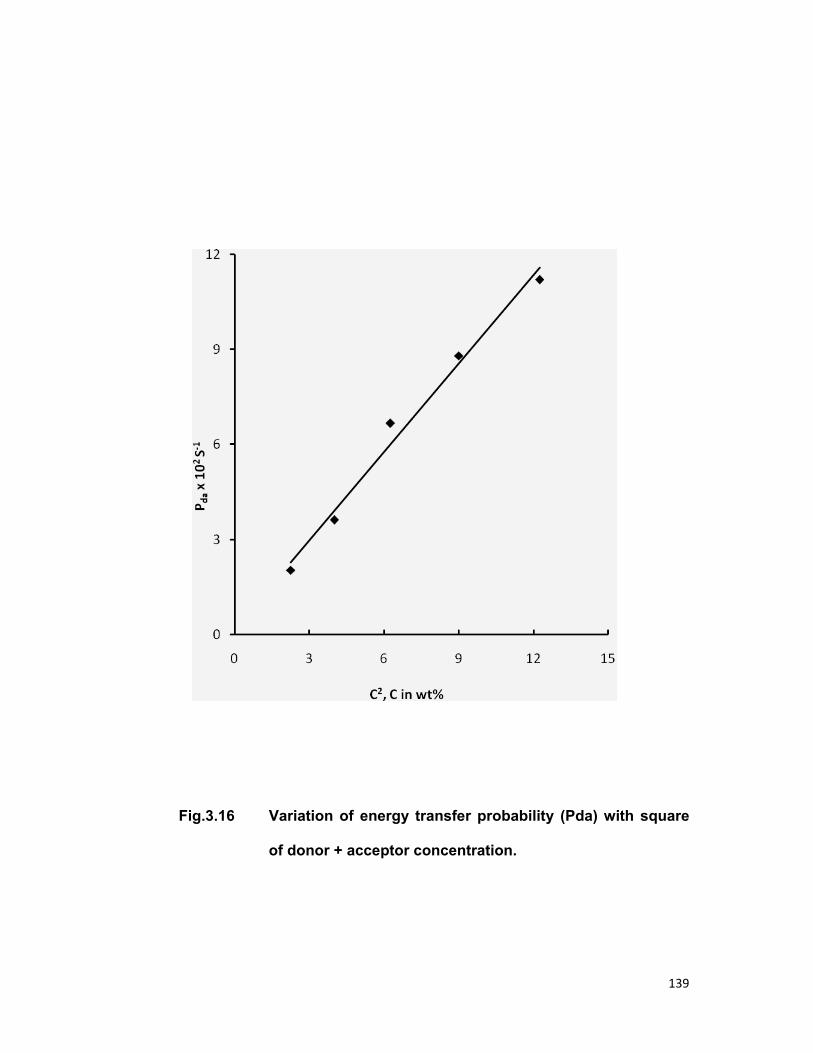
139
Fig.3.16 Variation of energy transfer probability (Pda) with square
of donor + acceptor concentration.
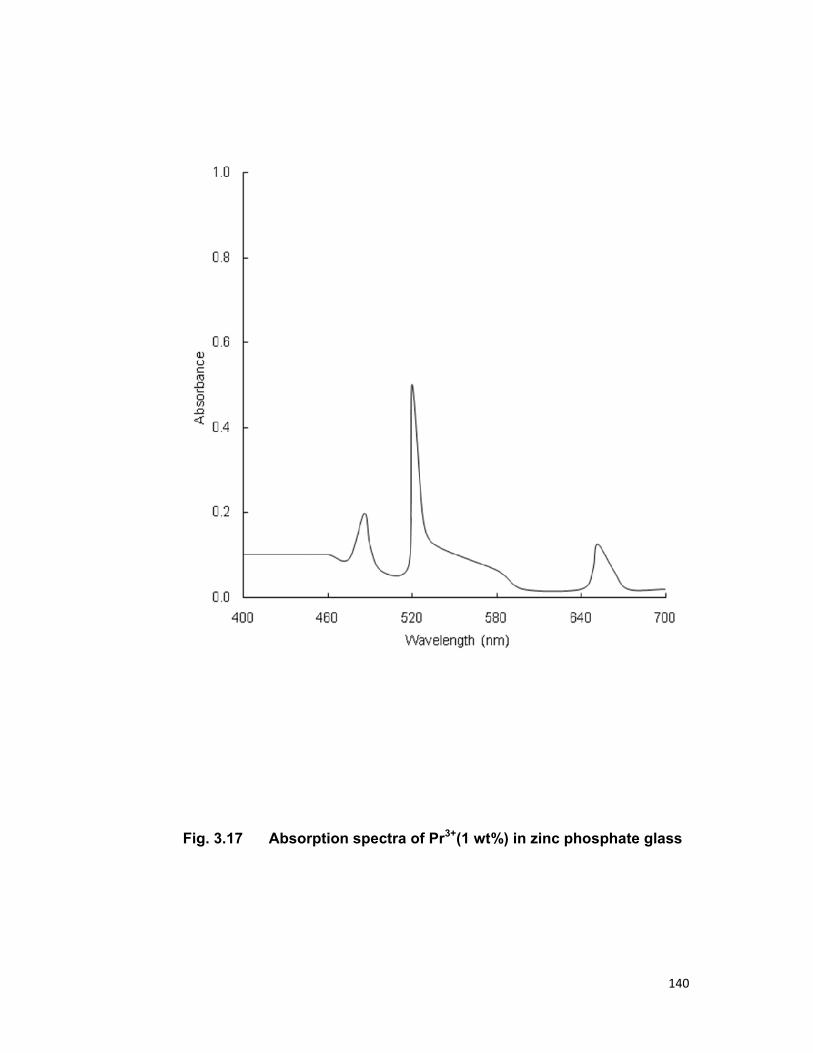
140
Fig. 3.17 Absorption spectra of Pr3+(1 wt%) in zinc phosphate glass
141
CHAPTER 4
STUDY OF SENSITIZE LUMINESCENCE AND ENERGY TRANSFER PROCESS IN SM-SM, SM-EU AND UO2-ER SYSTEMS IN ZINC
PHOSPHATE GLASS

142
CHAPTER 4
STUDY OF SENSITIZE LUMINESCENCE AND ENERGY TRANSFER PROCESS IN Sm-Sm, Sm-Eu
AND UO2-Er SYSTEMS IN ZINC PHOSPHATE GLASS
4.1 INTRODUCTION:
The sensitization of luminescence is a well known phenomena. Due
to its wide applications there has been a great interest for energy transfer
phenomena in rare earth activated phosphors. Because of the special
spectroscopic properties of the rare earth ions, RE doped glasses and fibers
are widely used in bulk and in fiber in lasers.
The self quenching of samarium ions in tungstate glass has been
reported by Van Uitert and Johnson [1] which occurs by electric dipole-dipole
mechanism, Joshi [2] studied the self quenching of samarium in calibo glass
occurred by electric dipole-quadrupole interaction and Reisfeld et.al. [3]
studied in borate and phosphate glass by electric dipole-quadrupole
interaction. Reisfeld and Boehm [4] observed energy transfer from Sm3+ to
Eu3+ in phosphate glass.
Europium (Eu) is one of the rarest, hard as lead and is quite ductile. It
is the most reactive of the RE metals. Studies of europium ion in various
host e.g. crystal & glasses have revealed that this ion with configuration 4f is
generally found in trivalent state [5]. The red emission of Eu3+ doped
phosphors has been extensively used in colour television and lasers [6]. Eu
activated yttrium vanadate is in commercial use as the red phosphor in
143
colour TV tubes. To enhance the Eu3+ emission many researchers have
sensitized it by RE and other ions in various matrices. Reisfeld et.al. [7] have
observed that the emission of Eu3+ is enhanced by two orders of magnitude
due to non-radiative energy transfer from UO2++ and from Bi3+ to Eu3+ in
glasses. Joshi [8] has also reported energy transfer from Tb3+ to Eu3+ in zinc
phosphate glass. Optical properties of Eu3+ ions in glasses have been
extensively studied for preparing materials for good optical devices [9-12].
In glasses the uranium ion exists in many forms such as trivalent
(U3+), tetravalent (U4+) and hexavalent (U6+) [13-14]. The emission of
uranium ions occur from an excited level situated at 20200cm-1 [15], from
which the probability of energy transfer to various ions such as rare earths
ions is high. Also due to strong and broad absorption bands in UV region (it
has large oscillator strength compare to trivalent rare earth ions) the large
portion of excitation energy is absorbed by it can easily be transferred to
other rare earth ions.
The uranyl ion (UO2++) has its maximum emission in green region.
This ion has found its application in various field such as indirect pumping
source application for RE ions in lasers, luminescence, photochemical
reactions, studying the nature of excited state solar energy converters [16-
20].
Cabezas and Deshazer [21] studied the energy transfer process from
uranyl to europium in borosilicate glass. They have shown that the addition
of uranyl to europium increases europium emission fivefold; however the
study is mostly confined to the radiative transfer. Joshi et.al.[22] observed
144
energy transfer from UO2++ to Eu3+ in H2O,D2O,potassium format and acetic
media. They found that a small portion of energy lost by uranyl ions is
transferred to Eu3+ ion via non-radiative process. V.V.SytKo et.al. [23]
studied the characteristic features of electron excitation energy transfer from
UO2++ to Ln3+ at an abnormally high concentration of active ions( from the
viewpoint of concentration quenching ) in phosphate matrices. Transfer of
energy from UO2++ to Ho3+ and Eu3+ has also been reported by many
workers [24-27].
The use of Er3+ ions due to their emission in infrared region of
spectrum is well known in laser and in solar energy concentrators. Van Uitert
[28] studied the energy transfer from Tb3+ ions to Er3+ ions in tungstate glass
by dipole-dipole interaction. Er3+ ions are used as activator in Dy3+-Er3+
system in zinc phosphate glass by Joshi et.al. [29].They found electric
dipole-dipole interaction is mainly responsible for the energy transfer
Keeping in view the above properties of Sm3+, Eu3+, UO2++ and Er3+,
we have chosen the Sm3+ - Sm3+, Sm3+ - Eu3+ and UO2++ - Er3+ systems in
zinc phosphate glass to investigate the following points:
(a) Concentration quenching of Sm3+ ions.
(b) Nature of the energy transfer from Sm3+ - Eu3+ and UO2++-
Er3+.
(c) The mechanism of energy transfer between the ions in each of
the systems mentioned above.
(d) The levels between which the energy transfer takes place.
145
(e) Calculation of parameters related to energy transfer as a
function of concentration (e.g. average donor –acceptor
distance (DD-A), transfer probabilities (PDA), transfer efficiencies
(η) etc.).
4.2 EXPERIMENTAL MATERIALS AND METHODS:
Sodium dihydrogen phosphate 2-hydrate (NaH2PO4 .2H2O) and
zinc oxide (ZnO), both of reagent grade, were used in a proportion of 3:1 by
weight, were used as the constituents of the glass matrix .The method for
preparing the glass pallets has already been discussed in chapter 2.
The following series of glasses were prepared by doping the above
mentioned rare earth ions for studying the energy transfer.
Series 3.I: This series consists of glasses doped with Sm3+ ions of
0.5 wt %, 0.8 wt%, 1.0 wt%, 1.2 wt%, 1.5 wt%, 1.8 wt%,
2.0 wt%, 2.5 wt% and 3.0 wt%.
Series 3.II: This series consists of glasses doped with 1 wt % (fixed)
of Sm3+ codoped with 0.2 wt %, 0.4 wt% ,0.6 wt%,0.8 wt
% ,1.0 wt% of Eu3+.
Series 3.III: This series consists of glasses doped with 0.1 wt %
(fixed) of UO2++ codoped with 0.2 wt %, 0.4 wt% ,0.6
wt%,0.8 wt % ,1.0 wt% and 1.2 wt% of Er3+.
146
Glass sample doped with 1 wt% of Er3+ is prepared to study the
absorption spectra.
Emission and absorption spectra were taken according to the method described in chapter 2.
4.3(A) THEORY
In the case of donor-donor interactions at high donor concentration,
the relaxation of electronic excitation energy occurs by migration among the
ions of same species in random walk manner and finally to quenching
centre. This multistep process was originally proposed by Botden [30] to
account for the concentration quenching of luminescence and later
developed by Dexter and Schulman [31]. They observed that with the
increase of concentration, radiative transitions become less likely than non-
radiative.
There are a number of methods for demonstrating the occurrence of
energy transfer as
1. By measuring the excitation spectrum of the emission from the
activator (A). This done by measuring the quantum yield of the
emission from A (identified by its wavelength region) as a function of
the wavelength of the incident radiation. A band in excitation
corresponds to a absorption band. If the excitation spectrum of
activator (A) emission shows excitation band of the sensitizer (D) in
addition of those of A, it is indicates energy transfer from D to A.

147
2. By measuring the decay time of the luminescence from ‘D’ as
fraction of concentration of ‘A’. If ‘D’ is situated in the host lattice in an
isolated position, the average life time ( )dτ of an excited state of ‘D’
(i.e. the decay time of the luminescence) is equal to the reciprocal
of rdP , where r
dP is the probability of radiative emission of donor ion.
The addition of ‘A’ ions, the donor ions can lose its energy and life
time ( )dτ will become shorter and too decay of the luminescence
from ‘D’. By measuring the life time ( )dτ as a function of the
concentration of ‘A’, we can obtain information about the energy
transfer probability from donor to acceptor.
The ratio of number of photons emitted by ‘A’ to that absorbed by
’D’ is called the quantum efficiency (q) of the emission from activator (A) in
case of the sensitizer (D). For high quantum efficiency, rdDA PP ⟩⟩ ( DAP is the
energy transfer probability).
The detailed study of the energy transfer can be done by considering
a system consisting of two type of ions viz., energy donor (D) and energy
acceptor (A). Let D & A are distributed randomly throughout the host matrix
and present in low concentration such that the distance between the
acceptor ions is much greater than the distance between donor ions. The
medium is assumed inactive. A small number of donor ions are initially
excited by a flash of light. The number of excited donor ions is assumed to
very small compared to the total number to donor ions and distributed
uniformly in matrix.

148
In the absence of any interaction between the excited donors, their
decay can be expressed as:
( ) ( ) ⎟⎟⎠
⎞⎜⎜⎝
⎛−=
0
exp0τ
φφ tt (4.1)
where 0τ is the intrinsic donor decay time and ( )tφ and ( )0φ is the
donor excitation density initially and after time t respectively.
This expression denotes the probability of finding a donor at a
particular position in an excited state at time t.
In the absence of resonant transitions within the donor system, the
excited donor ion will decay to a random distribution of acceptor ion
therefore the environment of donor ions varies and the ion pair relaxation
rate depends on the particular environment of any excited donor ion. Thus
the decay of the system of excited donor ions appears non exponential.
In Inokuti –Hirayama [32] approach a donor ion (D) is considered to
be surrounded by a set of quenching ions (A) at distance rj the energy
transfer rate from a donor ion to the ith acceptor ion is Wdai (ri). The time
dependence of the donor ions excited state population is then:
( ) ( ) ∏=
×−=n
iidai rWtttr
10
expexp,τ
φ (4.2)
where N is the total number of acceptor ions.
Statistical average φ (t) of φ (r, t) of an infinitely large no. of donors is
given by:
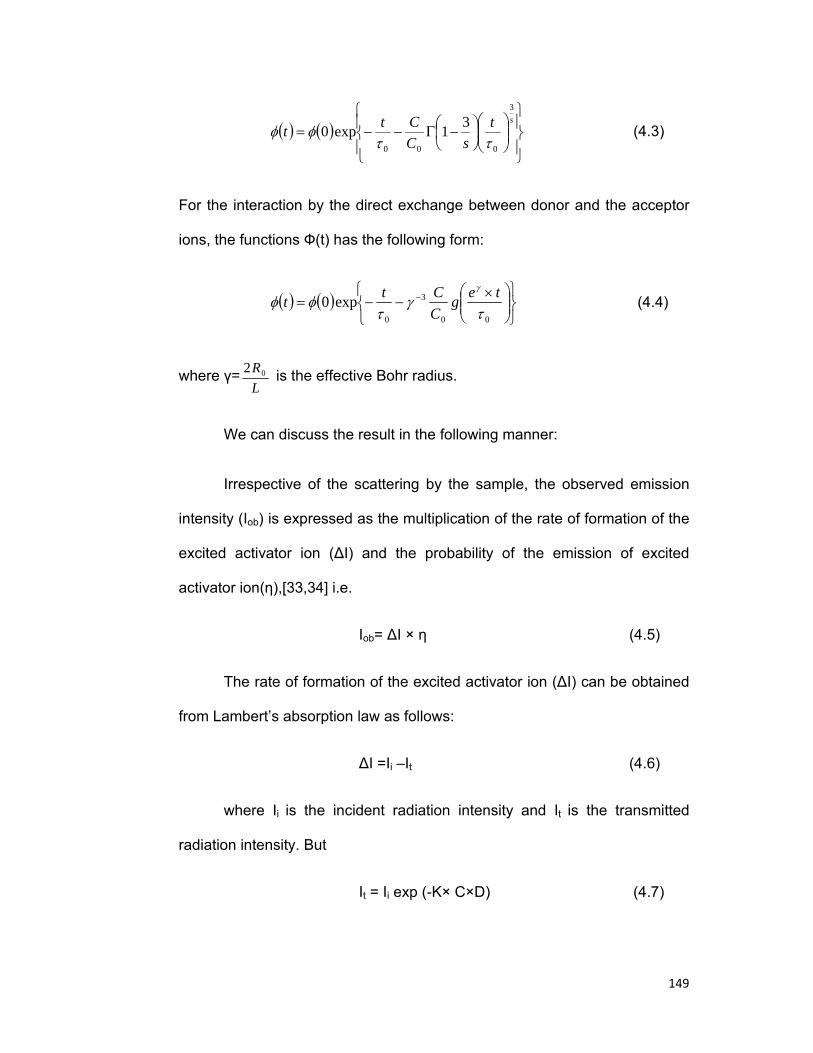
149
( ) ( )⎪⎭
⎪⎬
⎫
⎪⎩
⎪⎨
⎧
⎟⎟⎠
⎞⎜⎜⎝
⎛⎟⎠⎞
⎜⎝⎛ −Γ−−=
stsC
Ctt
3
000
31exp0ττ
φφ (4.3)
For the interaction by the direct exchange between donor and the acceptor
ions, the functions Ф(t) has the following form:
( ) ( )⎭⎬⎫
⎩⎨⎧
⎟⎟⎠
⎞⎜⎜⎝
⎛ ×−−= −
00
3
0
exp0τ
γτ
φφγ teg
CCtt (4.4)
where γ=LR02 is the effective Bohr radius.
We can discuss the result in the following manner:
Irrespective of the scattering by the sample, the observed emission
intensity (Iob) is expressed as the multiplication of the rate of formation of the
excited activator ion (∆I) and the probability of the emission of excited
activator ion(η),[33,34] i.e.
Iob= ∆I × η (4.5)
The rate of formation of the excited activator ion (∆I) can be obtained
from Lambert’s absorption law as follows:
∆I =Ii –It (4.6)
where Ii is the incident radiation intensity and It is the transmitted
radiation intensity. But
It = Ii exp (-K× C×D) (4.7)

150
where K = extinction coefficient, C is the concentration and D is the
path length in the glass.
Therefore equation (4.6) can be written as:
∆I=Ii- Ii exp (-K× C×D)
= Ii (1- exp (-K× C×D)) (4.8)
In the case of weak absorption (low oscillator strength of RE ions)
K ×C<< 1, therefore using the expansion
ex = 1+x+x2+x3+------------and so on
≈ 1+x (when x<<1)
∆I= Ii 1-(1 -K× C×D)
Or ∆I= Ii × K× C×D (4.9)
Now the probability of an excited activator will undergo emission i.e. η
is equal to 3
1
PP where 1P is the probability of emission & 3P is the probability
of deexcitation of activator ion which is equal to the sum of probabilities for
emission
( 1P ) and of non radiative loss 2P .
i.e. 213 PPP += (4.10)
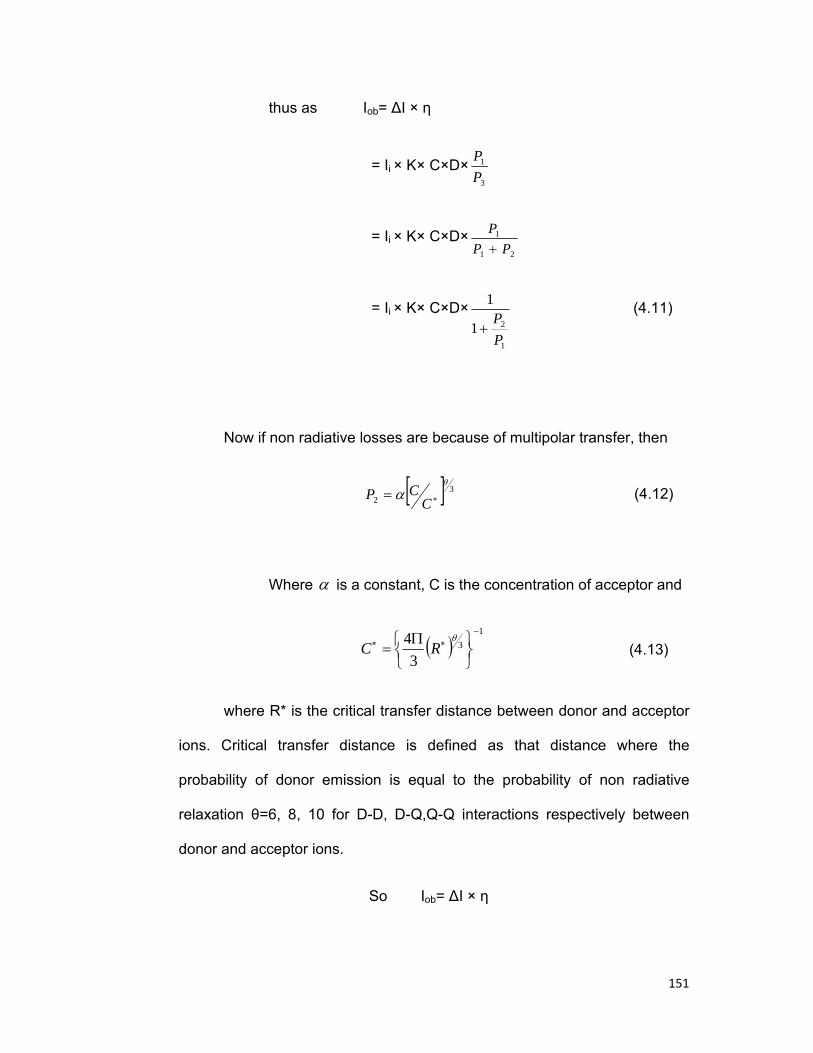
151
thus as Iob= ∆I × η
= Ii × K× C×D×3
1
PP
= Ii × K× C×D×21
1
PPP+
= Ii × K× C×D×
1
21
1
PP
+ (4.11)
Now if non radiative losses are because of multipolar transfer, then
[ ] 32
θα ∗= C
CP (4.12)
Where α is a constant, C is the concentration of acceptor and
( )1
3
34 −
∗∗
⎭⎬⎫
⎩⎨⎧ Π
=θ
RC (4.13)
where R* is the critical transfer distance between donor and acceptor
ions. Critical transfer distance is defined as that distance where the
probability of donor emission is equal to the probability of non radiative
relaxation θ=6, 8, 10 for D-D, D-Q,Q-Q interactions respectively between
donor and acceptor ions.
So Iob= ∆I × η
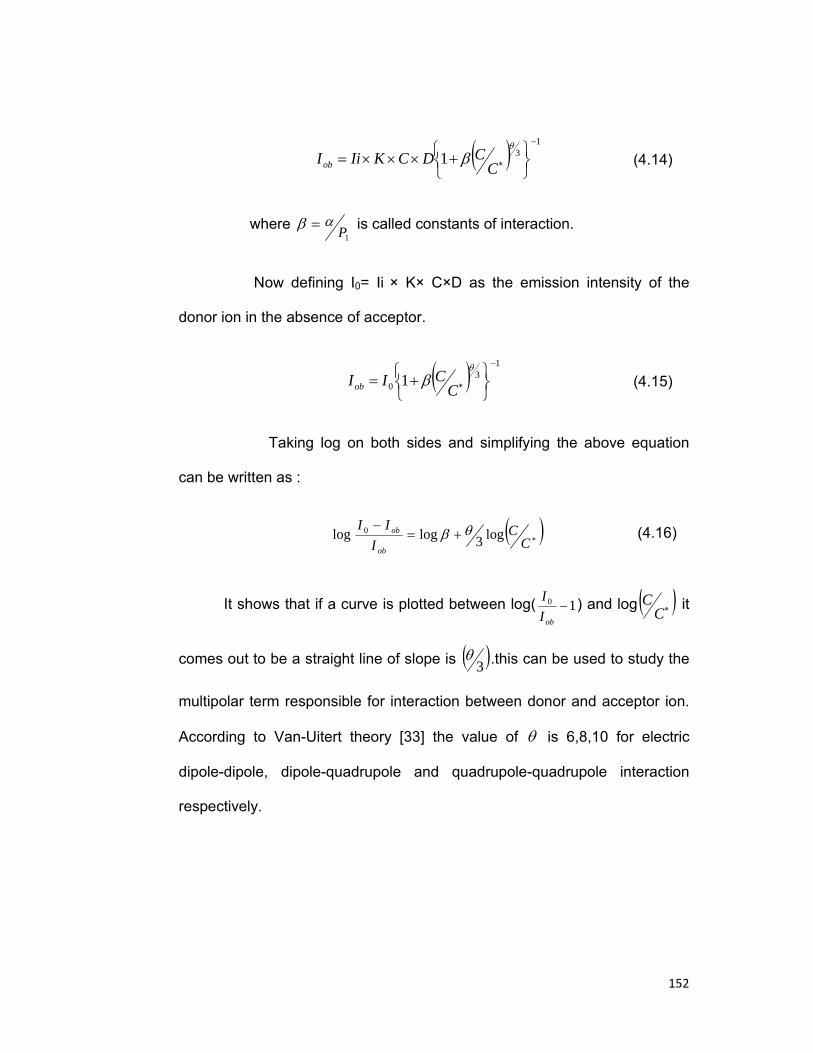
152
( ) 131
−
∗⎭⎬⎫
⎩⎨⎧ +×××=
θβ C
CDCKIiIob (4.14)
where =β1P
α is called constants of interaction.
Now defining I0= Ii × K× C×D as the emission intensity of the
donor ion in the absence of acceptor.
( ) 13
0 1−
∗⎭⎬⎫
⎩⎨⎧ +=
θβ C
CIIob (4.15)
Taking log on both sides and simplifying the above equation
can be written as :
( )∗+=−
CC
III
ob
ob log3loglog 0 θβ (4.16)
It shows that if a curve is plotted between log( 10 −obII ) and log ( )∗C
C it
comes out to be a straight line of slope is ( )3θ .this can be used to study the
multipolar term responsible for interaction between donor and acceptor ion.
According to Van-Uitert theory [33] the value of θ is 6,8,10 for electric
dipole-dipole, dipole-quadrupole and quadrupole-quadrupole interaction
respectively.

153
4.3(A) GENERALIZED ENERGY LEVEL DIAGRAMS FOR THE
PHOSPHORS CENTERS
The luminescence phenomena that occur in solids can be
discussed with the energy level diagram [35]. The generalized and simplified
energy level diagram is presented in Fig.4.1. The figure shows the potential
energy curve of phosphors centre as the function of configurational
coordinate r, which represents three dimensional changes in average
internuclear spacing and possible changes in the geometrical arrangement
of the atoms in the centre [36-39]. Equilibrium ground state and equilibrium
excited state of the phosphor centre are represented by two curves. There
may be following possibilities for the excited phosphor centre
(A) At the certain points, say f, the ground state and the excited state
curves come very close. The high probability is that the excited
energy stored to such points is delivered to the centre and will
quickly dissipate as heat (non-radiatively) to surrounding lattice.
(B) At room temperature, the unexcited centre may be in its ground
state vibrational level, say Ea. This centre is raised to some
excited state level Eb* by absorbing energy (Eb
* - Ea). Let the
excited centre gives up some energy as heat large (Eb* - Ec
*) in
about 10-12 seconds and rests in the excited Ec*. In that case of
favorable selection rule, the centre may make a spontaneous
radiative emission by emitting the energy (Ec* - Ed) as a luminous
photon therefore the emission consists of a broad band.
154
In some exceptional case, when the configurational coordinate curves
are identical in shape and have the same equilibrium distances as e.g. in the
case of rare earth ions one can found line emission. Because of the heat
dissipation, the emission always lies at a lower energy than the absorption.
This displacement of emission with absorption is known as stokes shift.
The above mentioned theory is used by Mott [37] and Seitz [40] for
explaining the thermal quenching of luminescence. Dexter, Klick and Russel
[41] also used similar approach to explain the quenching of solids at higher
temperature.
In all the above mentioned theories, at sufficiently high temperature
emission of lattice vibration occurs in completion with the phonon emission.
Luminescence efficiency η is given by
21
1
PPP+
=η
where 1P is the probability of luminescence emission and 2P that of
the non radiative transitions. It is assumed that 1P is independent of
temperature while 2P rises with temperature.
In Fig.4.2 at the certain points, say S, the ground state and the
excited state curves intersect each other. If the luminescent centre is in
equilibrium configuration of the excited state, it may also, as a result of
thermal activation, attain a vibrational level situated at the point S. Having
achieved it, the centre will return non-radiatively to the equilibrium
configuration of the ground state, dissipating as the heat in the process.
155
Pearson et.al.[42] have explained the fall of decay time of Tb3+ in glasses
and Pringsheim [43] has explained the thermal quenching of uranyl emission
in glass.
4.4 RESULTS AND DISCUSSION
4.4.A.1) The Sm - Sm system in zinc phosphate glass.
The emission spectrum of Samarium (Sm3+) ions in zinc phosphate
glass is shown in Fig.4.3. The three emission peaks shown in the spectrum
arise due to the transitions 4G5/2 →6H5/2 (560nm), 4G5/2 →6H7/2 (595nm) and
4G5/2 6H9/2 (645nm). In glasses, due to high phonon energy the first two
levels undergo a rapid depopulation and the Sm3+ ion luminesces only from
4G5/2 level. The decay time of emitting level in phosphate glass is found 1.8
[44].
4.4.A.2) The concentration quenching
For obtaining high emission efficiency, it is obvious to make the
activator concentration high. As the concentration of the ions is increased,
the emission intensity increases. But in many case it found that the
fluorescence intensity of the ions increases with the concentration to the
maximum value, after getting maximum value emission intensity decreases
with increasing concentration. This phenomenon is known as concentration
quenching.
Some of the ions such as Mn2+ show concentration quenching.
Bingham and Parke [45] obtained concentration quenching of Mn2+ emission

156
at 1.0 mol% in sodium silicate and 0.5 mol% in borate glass. Joshi et.al.
found concentration quenching of Mn2+ at 0.2 wt% in zinc phosphate glass
[46].
4.4.A.3) The concentration quenching in Sm3+ ions.
Variation of emission intensity of Sm3+ ion with the concentration of
Sm3+ is presented in Fig.4.4. It is observed that the quenching starts above
the 1.8 wt% concentration of Sm3+.
The concentration quenching observed in present case can be
explained using Dexter and Schulman [31] which states that if the
concentration of activator becomes so high that the probability of energy
transfer exceeds the probability of emission. In such condition the excitation
energy repeatedly goes from one activator ion to another. Since the lattice is
not perfect, it contains all kinds of sites where the excitation energy may be
lost at the surfaces and to the dislocations due to impurities. In traversing the
host matrix the excitation energy will sooner or later encounter such as site,
where dissipated as heat, it makes no contribution to the luminescence and
thus causing a decrease in the luminescence intensity.
As suggested by above theory, we calculated energy transfer and
energy transfer probabilities, donor- donor distances and energy transfer
efficiency. These values are presented in Table 4.2. The linearity of the
graph (Fig.4.5) drawn between energy transfer probability and square of
donor + donor concentration suggested that electric dipole-dipole interaction
is mainly responsible for the quenching.
157
4.4.B) The Sm - Eu system in zinc phosphate glass
Fluorescent spectra:
The samarium (Sm3+) and europium (Eu3+) ions get excited by 365
nm radiation of excitation. The electronic configuration of the trivalent Sm3+ is
4F6. The Sm3+ ion luminance from 4G7/2, 4F3/2 and 4F7/2 levels to the ground
6H multiplet [47]. The emission spectrum of Sm3+ ion in zinc phosphate glass
is presented in Fig. 4.6(A). The three emission peaks shown in the spectrum
arise due to the transitions 4G5/2 →6H5/2 (560nm), 4G5/2 →6H7/2 (595nm) and
4G5/2 →6H9/2 (645nm). In glasses, due to high phonon energy the first two
levels undergo a rapid depopulation and the Sm3+ ion luminance only from
4G5/2 level. The Eu3+ ions show emission in red region through 5D0 →7F1
(590 nm) and 5D0 →7F2 (617 nm). The emission spectrum of Eu3+ ion in zinc
phosphate glass is presented in Fig. 4.6(B). The energy level diagram of
these ions is shown in Fig. 4.7.
Nature of energy transfer:
Fig.4.8 shows the variation of Sm3+ emission intensity with the
varied concentration of Eu3+ ions. The Fig 4.8 and Fig. 4.6(C) shows that
there is overall decrease of emission intensity of Sm3+ ions and the
increased the emission intensity of Eu3+ ions. The overall decrease of the
emission intensity of Sm3+ ion suggested that there is non-radiative energy
transfer from Sm3+ to Eu3+ ion.
Energy transfer by exchange process is negligible in our case
because it needs acceptor-donor separation of about 0.3-0.4nm with overlap
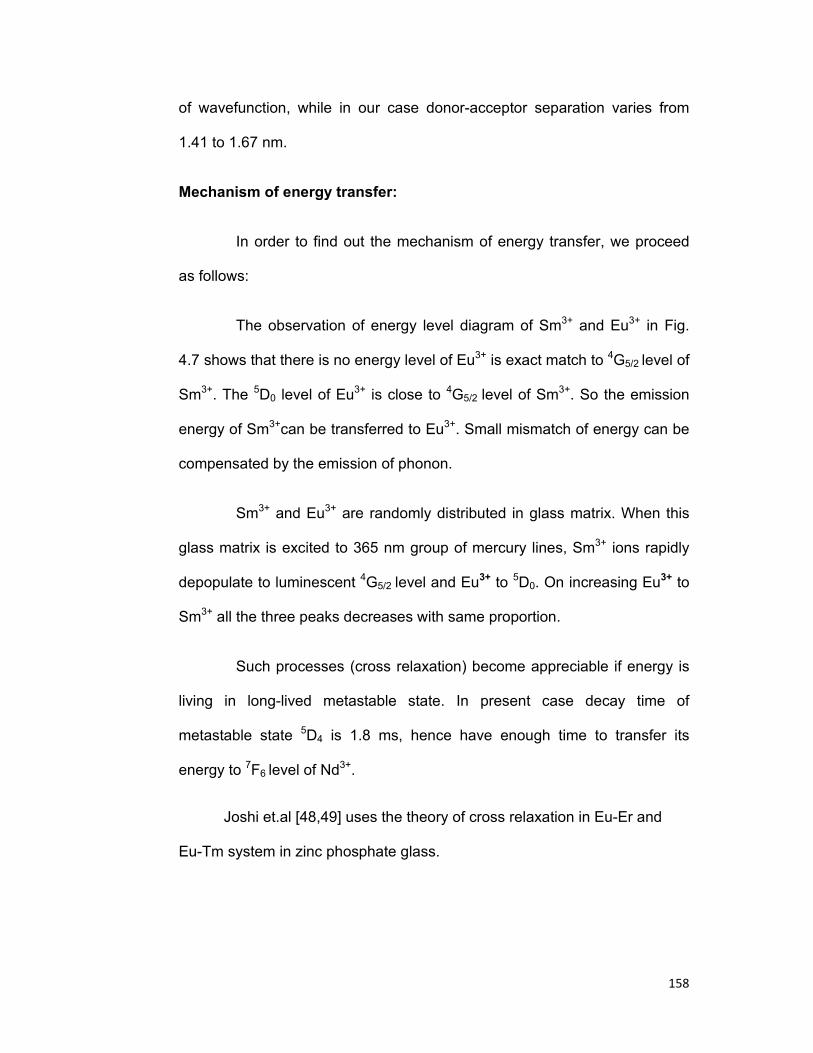
158
of wavefunction, while in our case donor-acceptor separation varies from
1.41 to 1.67 nm.
Mechanism of energy transfer:
In order to find out the mechanism of energy transfer, we proceed
as follows:
The observation of energy level diagram of Sm3+ and Eu3+ in Fig.
4.7 shows that there is no energy level of Eu3+ is exact match to 4G5/2 level of
Sm3+. The 5D0 level of Eu3+ is close to 4G5/2 level of Sm3+. So the emission
energy of Sm3+can be transferred to Eu3+. Small mismatch of energy can be
compensated by the emission of phonon.
Sm3+ and Eu3+ are randomly distributed in glass matrix. When this
glass matrix is excited to 365 nm group of mercury lines, Sm3+ ions rapidly
depopulate to luminescent 4G5/2 level and Eu3+ to 5D0. On increasing Eu3+ to
Sm3+ all the three peaks decreases with same proportion.
Such processes (cross relaxation) become appreciable if energy is
living in long-lived metastable state. In present case decay time of
metastable state 5D4 is 1.8 ms, hence have enough time to transfer its
energy to 7F6 level of Nd3+.
Joshi et.al [48,49] uses the theory of cross relaxation in Eu-Er and
Eu-Tm system in zinc phosphate glass.

159
Multipolar term responsible for energy transfer:
To find out which of the multipolar term is responsible for energy
transfer, a graph is drawn between energy transfer probabilities (Pda) and
square of the concentration (donor & acceptor) which gives a straight line
(Fig. 4.9). The linear dependence of Pda on the square of the concentration
of donor and acceptor is attributed to because of dipole- dipole interaction
between donor and acceptor [50]. The dipole -dipole mechanism of energy
transfer is further supported by the average donor to acceptor distance
which varies in this system between 1.41nm and 1.67 nm (Table 4.3) which
is in the range of electric dipole- dipole interaction between donor & acceptor
in accordance with Forster’s [51] & Dexter’s [52] theories of multipolar
interactions.
Other parameters involved in the energy transfer:
In this series, the average donor acceptor distance along with the
energy transfer probabilities & transfer efficiencies are presented in table 4.3
which are calculated by using the following formulae:
DD→A = 1 / (Cd + Ca) 1/3
where Cd & Ca are donor and acceptor ion Concentration per cm3 in the host
matrix.
Pda =1/τ0 (Id0/Id - 1),

160
η= 1 – Id/Id0.
4.4. C) The UO2 - Er system in zinc phosphate glass
Fig.4.10 (A) shows the emission spectra of U02++ (0.1 wt%) in zinc
phosphate glass. When excited with 365 nm of mercury lines, the uranium
ions in zinc phosphate glass gives bright green luminescence. The emission
spectrum extends in the visible region from blue to red with maximum
intensity in green region corresponding to 525nm. The five bands shown in
the emission spectrum correspond to the transition from the excited level
situated at around 20200 cm-1 above the ground state to the five vibrational
levels situated above ground state with equal energy intervals ( )120855 −± cm
[53]. The emission intensity of uranyl ion in zinc phosphate glass is higher
than in borate and silicate glasses [44]. The reason for this lies in the fact
that phonon energy of phosphate glass (~ 1100cm-1) is lower than in borate
glass. This lower phonon energy results in a higher radiative transition
probability in glass. The broad lines of uranyl emission are characteristic of
the vibrational frequencies of the ion which are further broadened by the
glassy matrix. The energy level diagram of these ions is shown in Fig. 4.11.
Nature of energy transfer:
Fig. 4.10(A) and Fig.4.10(B) shows the emission spectra of uranyl ion
in the absence and presence of the Er3+ ion in zinc phosphate glass
respectively. A comparison of both the curve indicate that the uranyl ion
decreases, when added Er3+ ions. The decrease in intensity of uranyl ions is
overall i.e. its decrease is same for the entire wavelength. This fact results
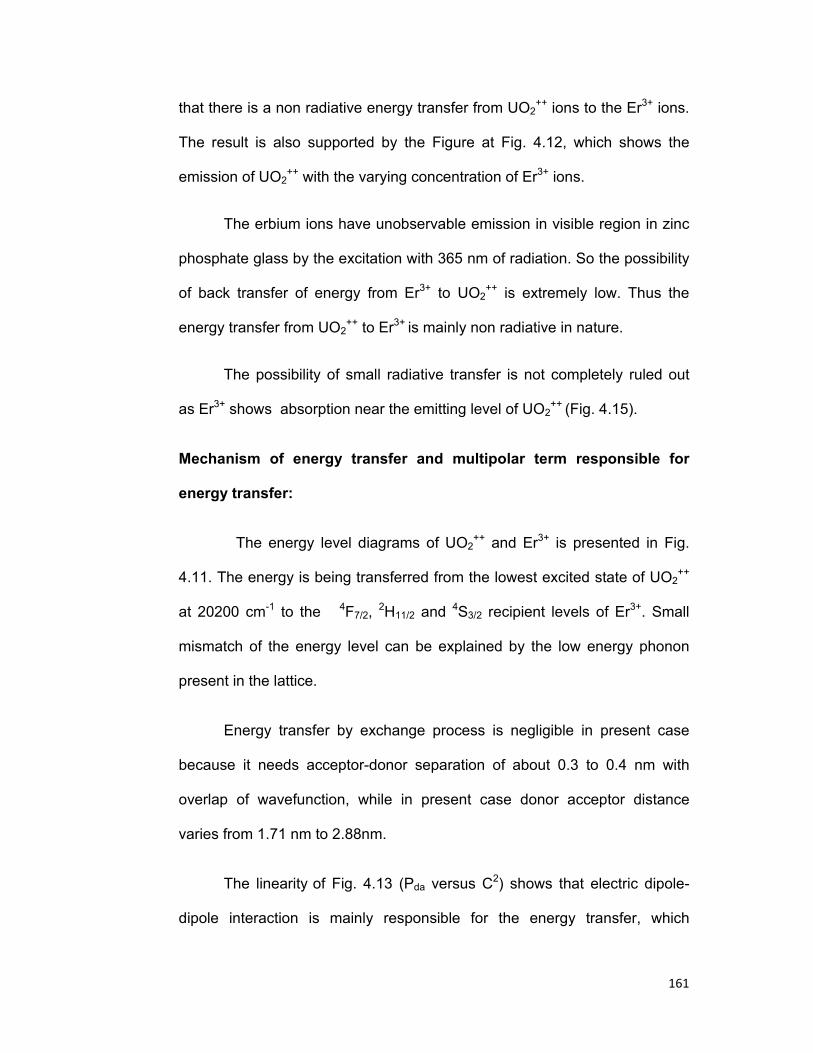
161
that there is a non radiative energy transfer from UO2++ ions to the Er3+ ions.
The result is also supported by the Figure at Fig. 4.12, which shows the
emission of UO2++ with the varying concentration of Er3+ ions.
The erbium ions have unobservable emission in visible region in zinc
phosphate glass by the excitation with 365 nm of radiation. So the possibility
of back transfer of energy from Er3+ to UO2++ is extremely low. Thus the
energy transfer from UO2++ to Er3+ is mainly non radiative in nature.
The possibility of small radiative transfer is not completely ruled out
as Er3+ shows absorption near the emitting level of UO2++ (Fig. 4.15).
Mechanism of energy transfer and multipolar term responsible for
energy transfer:
The energy level diagrams of UO2++ and Er3+ is presented in Fig.
4.11. The energy is being transferred from the lowest excited state of UO2++
at 20200 cm-1 to the 4F7/2, 2H11/2 and 4S3/2 recipient levels of Er3+. Small
mismatch of the energy level can be explained by the low energy phonon
present in the lattice.
Energy transfer by exchange process is negligible in present case
because it needs acceptor-donor separation of about 0.3 to 0.4 nm with
overlap of wavefunction, while in present case donor acceptor distance
varies from 1.71 nm to 2.88nm.
The linearity of Fig. 4.13 (Pda versus C2) shows that electric dipole-
dipole interaction is mainly responsible for the energy transfer, which

162
supports the Fong-Dieslter theory [50]. The average donor acceptor distance
varies from 1.71 nm to 2.88 nm (Table 4.4) also in support of electric dipole
–dipole interaction suggested by Dexter [52].
Dipole-dipole interaction is further corroborated by using Van-Uitert
theory [1]. From Fig. 4.14 we have obtained the value of C* as 0.38 wt% of
UO2++. The curve plotted between log (I0/Iob-1) and log C/C* has been
presented in Fig. 4.10, which comes a straight line indicating a multipolar
interaction between UO2++ and Er. The slope of the line i.e. θ/3 gives a value
around 6 to θ, suggesting dipole-dipole interaction between donor and
acceptor ions.
The average donor acceptor distance along with the energy transfer
probabilities & transfer efficiencies are presented in table 4.4.
The critical transfer distance at which the probability of energy
transfer is equal to radiative decay in present case is equal to 2.42 nm.
4.5 CONCLUDING REMARKS:
The energy transfer between Sm-Sm, Sm-Eu and UO2-Er in zinc
phosphate glass have been made in this chapter. The quenching of Sm3+
ions is observed at 1.8 wt% in zinc phosphate glass. The mechanism is
found to be dipole-dipole in nature for all the series .The average donor-
acceptor distance varies from 2.89 to 1.77 nm while energy transfer
efficiency varies from 0.38 to 0.83 while transfer probability varies from 3.00
× 103 to 24.33 ×10³ s-1 respectively.
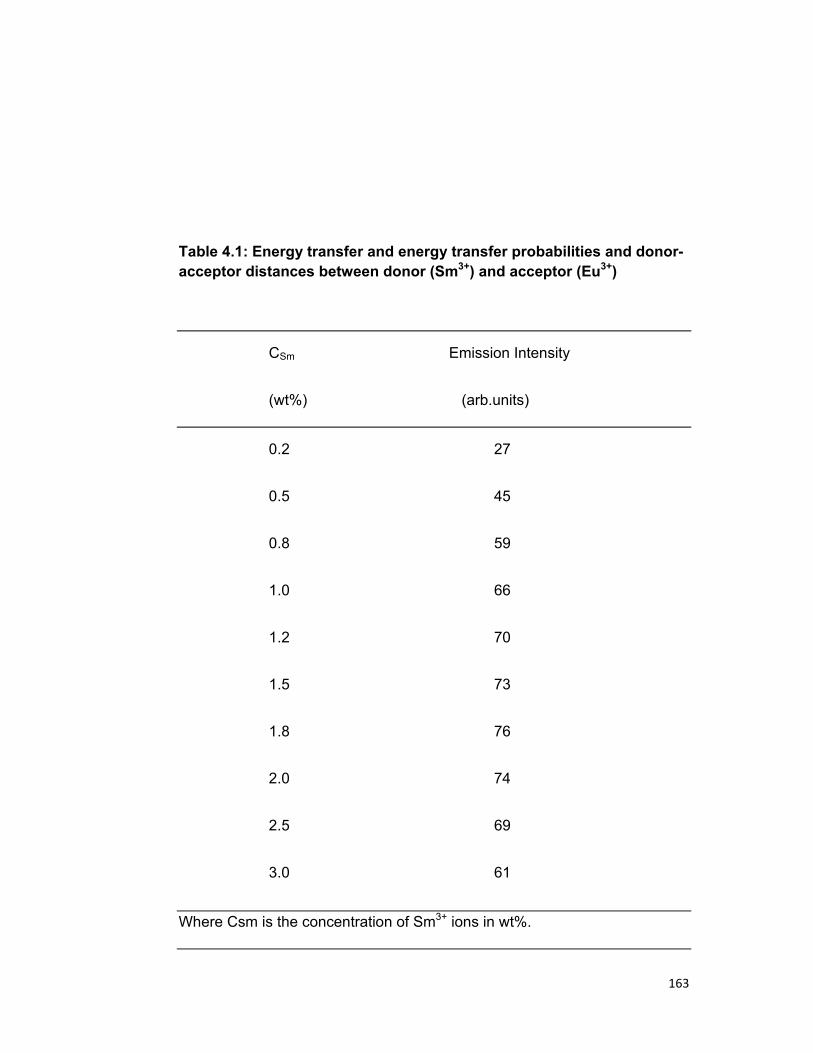
163
Table 4.1: Energy transfer and energy transfer probabilities and donor- acceptor distances between donor (Sm3+) and acceptor (Eu3+)
CSm Emission Intensity
(wt%) (arb.units)
0.2 27
0.5 45
0.8 59
1.0 66
1.2 70
1.5 73
1.8 76
2.0 74
2.5 69
3.0 61
Where Csm is the concentration of Sm3+ ions in wt%.
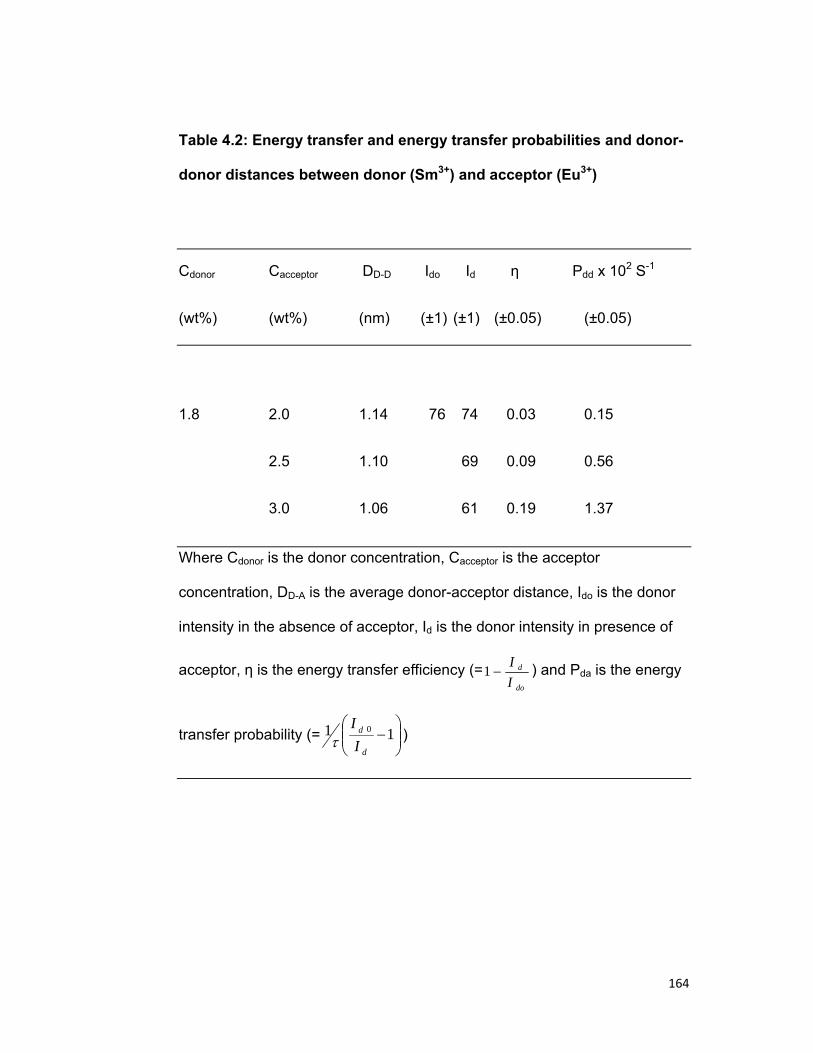
164
Table 4.2: Energy transfer and energy transfer probabilities and donor-
donor distances between donor (Sm3+) and acceptor (Eu3+)
Cdonor Cacceptor DD-D Ido Id η Pdd x 102 S-1
(wt%) (wt%) (nm) (±1) (±1) (±0.05) (±0.05)
1.8 2.0 1.14 76 74 0.03 0.15
2.5 1.10 69 0.09 0.56
3.0 1.06 61 0.19 1.37
Where Cdonor is the donor concentration, Cacceptor is the acceptor
concentration, DD-A is the average donor-acceptor distance, Ido is the donor
intensity in the absence of acceptor, Id is the donor intensity in presence of
acceptor, η is the energy transfer efficiency (=do
d
II
−1 ) and Pda is the energy
transfer probability (= ⎟⎟⎠
⎞⎜⎜⎝
⎛−11 0
d
d
II
τ )
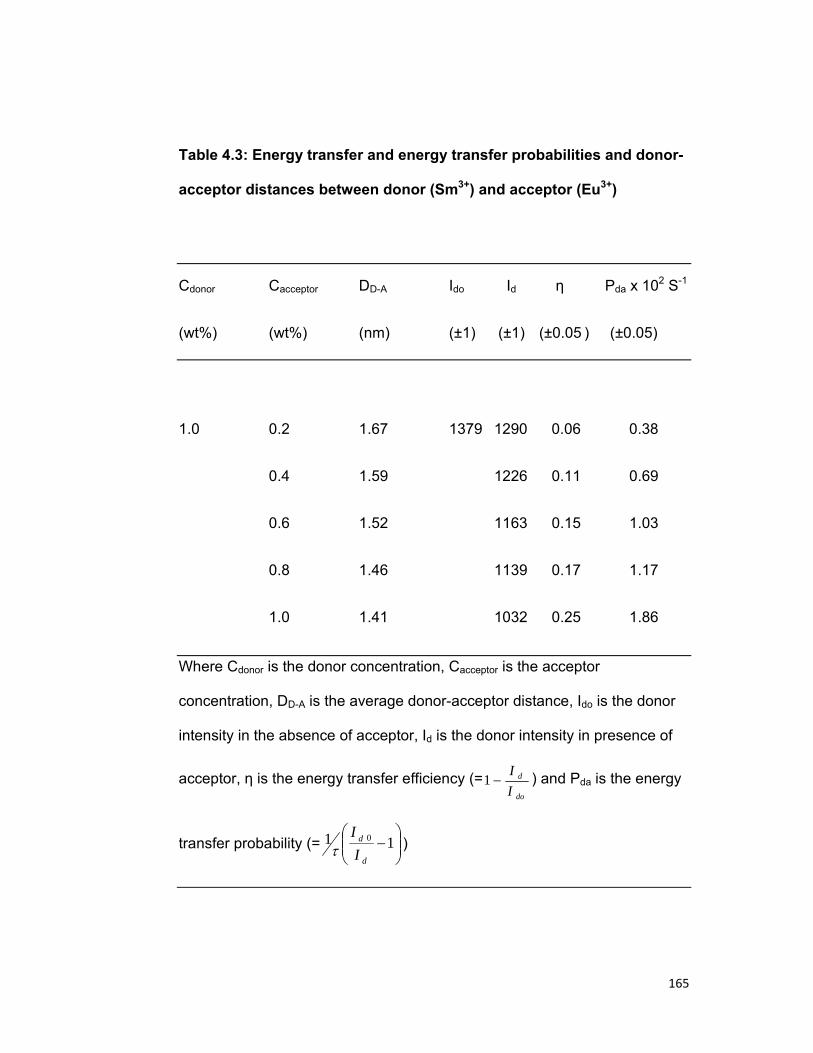
165
Table 4.3: Energy transfer and energy transfer probabilities and donor-
acceptor distances between donor (Sm3+) and acceptor (Eu3+)
Cdonor Cacceptor DD-A Ido Id η Pda x 102 S-1
(wt%) (wt%) (nm) (±1) (±1) (±0.05 ) (±0.05)
1.0 0.2 1.67 1379 1290 0.06 0.38
0.4 1.59 1226 0.11 0.69
0.6 1.52 1163 0.15 1.03
0.8 1.46 1139 0.17 1.17
1.0 1.41 1032 0.25 1.86
Where Cdonor is the donor concentration, Cacceptor is the acceptor
concentration, DD-A is the average donor-acceptor distance, Ido is the donor
intensity in the absence of acceptor, Id is the donor intensity in presence of
acceptor, η is the energy transfer efficiency (=do
d
II
−1 ) and Pda is the energy
transfer probability (= ⎟⎟⎠
⎞⎜⎜⎝
⎛−11 0
d
d
II
τ )
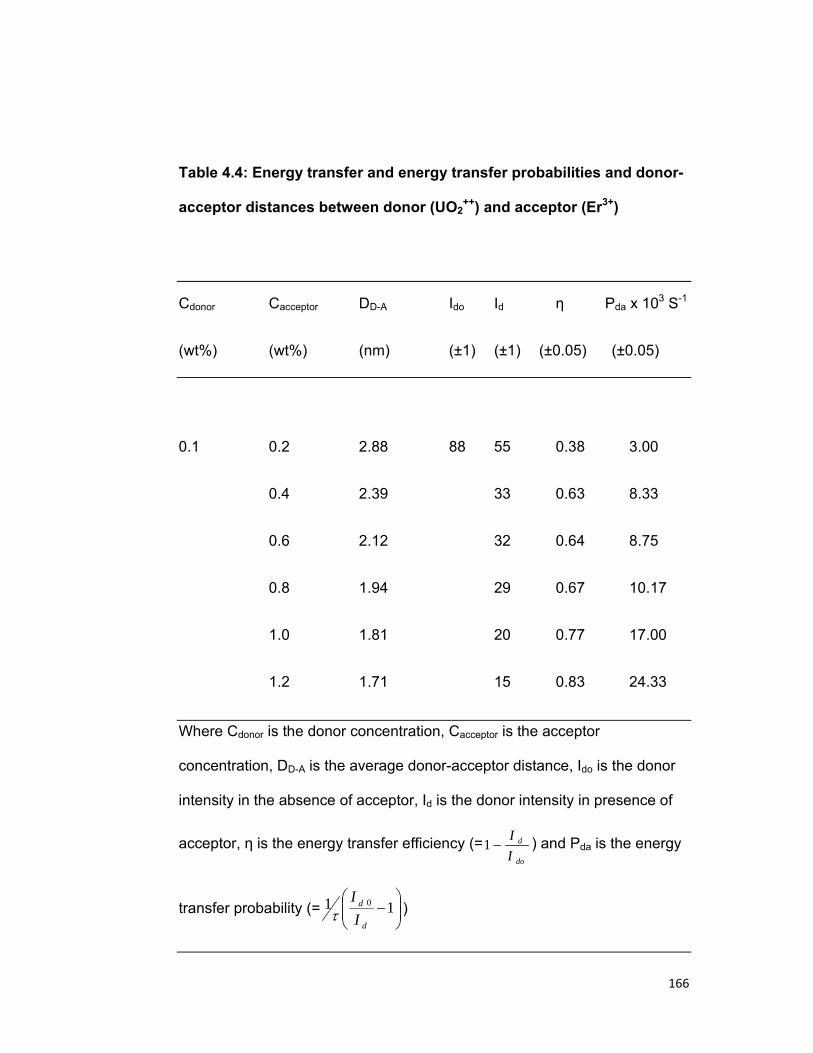
166
Table 4.4: Energy transfer and energy transfer probabilities and donor-
acceptor distances between donor (UO2++) and acceptor (Er3+)
Cdonor Cacceptor DD-A Ido Id η Pda x 103 S-1
(wt%) (wt%) (nm) (±1) (±1) (±0.05) (±0.05)
0.1 0.2 2.88 88 55 0.38 3.00
0.4 2.39 33 0.63 8.33
0.6 2.12 32 0.64 8.75
0.8 1.94 29 0.67 10.17
1.0 1.81 20 0.77 17.00
1.2 1.71 15 0.83 24.33
Where Cdonor is the donor concentration, Cacceptor is the acceptor
concentration, DD-A is the average donor-acceptor distance, Ido is the donor
intensity in the absence of acceptor, Id is the donor intensity in presence of
acceptor, η is the energy transfer efficiency (=do
d
II
−1 ) and Pda is the energy
transfer probability (= ⎟⎟⎠
⎞⎜⎜⎝
⎛−11 0
d
d
II
τ )

167
BIBLIOGRAPHY
1. L.G.Van Uitert and L.F.Johnson: J. Chem. Phys., 44 (1966) 3514.
2. B.C.Joshi: Unpublished Ph.D. thesis submitted to Kumaun
University, Nainital (India) 1978.
3. R.Reisfeld, A Bornstein and L.Boehm: J.Solid State
Chem.,14 (1975)12 .
4. R.Reisfeld & L.Boehm: J.Solid State Chem., 4 (1972) 417.
5. G.H.Dieke: Spectra & energy levels of rare earth ions in crystals:
John Wiley & sons inc., New York, 1968.
6. G.F.Imbush: Inorganic Luminescence in Luminescence
spectroscopy edited by M.D.Lumb (Academic Press, New York),
(1978).
7. R.Reisfeld, N Blich & Lie Boehm: J Lumines., 12 &13(1976) 749.
8. B.C.Joshi: J. Non Crystalline. Solids, 180(1995)217.
9. S. Surendra Babu, P.Babu, C.K.Jayshankar, Th.Troster,
W.Sievers and G.Wartmann: J.condensed matter Phys.,
18(2006)1927.
10. H.E.Bendoff, Heider Priem: J.Phys. Condensed matter,
11(1999)7627.
11. S.Hazarika & S.Rai: Bull.Matter Sci., 27(3) (2004)273.
12. J.Y.ding, C.K.Yin, P.Y.shih, S.w.Yung: Mat.Res.Soc.Symp.Proc.,
770(2003).
168
13. W.A.Weyl: Coloured glasses (Published by society of glass
technology, Sheffield), 1951.
14. A.R.Rodriguez, C.W.Parmeleand A.E.Badger:
J.Am.Ceram.Soc.,26 [1943]137.
15. H.W.Gandy, R.J.Ginther and J.F.Welter:
Appl.Phys.Lett., 4(1964)188.
16. H.D.Burrows and T.J.Kemp: Chem. Soc. Rev., 3(1974)139.
17. D.D.Pant, D.N.Pande and H.C.Pant: Ind.J.Pure Appl.
Phys., 4(1966)289.
18. D.D.Pant, H.B.Tripathi: Ind.J.Pure Appl.Phys., 7(1969)140.
19. E.Rabonowitch and R.L.Belford: Spectroscopy and
photochemistry of Uranyl compounds (Pergamon press, Oxford),
1964.
20. D.D.Pant and H.C.Pant: Ind.J.Pure Appl.Phys., 6(1968)219.
21. L.G.Deshazer and A.Y.Cabezas: Proc. IEEE, 52(1964)1355.
22. B.D.Joshi, A.G.Dalvi and T.R.Bangia: J.Luminescence,
10(1975)261.
23. V.V.SytKo & D.S.Umreiko: Journal of applied spectroscopy,
58(2001)377.
24. B.C.Joshi, R.Lohani, Bimal pandey: J.Non Crystalline Solids,
337(2004)97.
25. J.C.Joshi, N.C.Pandey, B.C.Joshi and Janardan Joshi: Ind. J.
Pure Appl. Phys., 15(1977)596.
26. J.L.Kropp: J.Chem. Phys., 46(1967)843.
27. M.V.Hoffman: J. Electrochem. Soc., 117(1970)227.
169
28. L.G.Van Uitert: J. Luminescence., 4(1971)1.
29. B.C.Joshi, R.Lohani and Bimal Pandey: J. Non-Crystalline solids,
39(2001)443.
30. T.P.J.Botden: Philips Res. Report, 7(1952)197.
31. D.L.Dexter and J.H.Schulman: J.Chem.Phys., 22(1954)1063.
32. M. Inokuti & F. Hirayama: J. Chem. Phys., 43(1965)197.
33. L.G.Van Uitert: J.Electrochem. Soc., 114(1967)1048.
34. L.Otawa, H.Forest, P.M.Jaffe and G. Ban: J.Electrochem. Soc.,
118(1971)482.
35. H.W.Leverenz: Science, 109(1945)183.
36. H.W.Leverenz: Excitation and Emission Phenomenon in
Phosphors .Section in preparation and characteristic of
Luminescence materials (John Wiley and sons, NewYork), (1948).
37. N.F.Mott and R.W.Garney: Electronic process in ionic crystals.
(Dover reprint) (The Clarendon press, Oxford), (1948).
38. F.Seitz: J.Appl.Phys., 16(1945)553.
39. W.Shockly: Bell system Tech. J., 18(1939)645.
40. F.Seitz: Trans Faraday Soc., 35 (1939)79.
41. D.L.Dexter, C.C.Klick and D.A.Russel: Phys.Rev., 100(1953)603.
42. A.D.Pearson, G.E.Peterson and W.R.Northover: J.Appl.Phys.,
37(1966)729.
43. P.Pringsheim: Fluorescence and Phosphorescence (John Wiley
and Sons, New York)1962.
44. R.Lohni: Unpublished Ph.D. thesis submitted to Kumaun
University, Nainital (India) 2000.

170
45. K.Bingham and S.Parke: Phys.Chem. Glasses, 6(1965)225.
46. B.C.Joshi, M.C.Joshi and B.D.Joshi: J.Phys.Chem.Solids,
52(1991)439.
47. G.O.Karapetyan: Optics and Spectroscopy, 20(1966)265.
48. B.C.Joshi, C.C.Dhondiyal, D.K.Upreti and Bhawana Khulbe:
Indian journal of pure and applied phys., 44(2006)811.
49. B.C.Joshi and C.C.Dhondiyal: Indian journal of pure and applied
phys., 43(2005)918.
50. F. K. Fong and D. J. Diestler: J. Chem. Phys., 56(1972)417.
51. Th. Forster: Ann.Phys., 2(1948)55.
52. D.L.Dexter: J.Chem.Phys., 21(1953)836.
53. H.W. Gandy, R.J.Ginther and J.F.Welter: Applied Phys.Lett.,
4(1964)188.
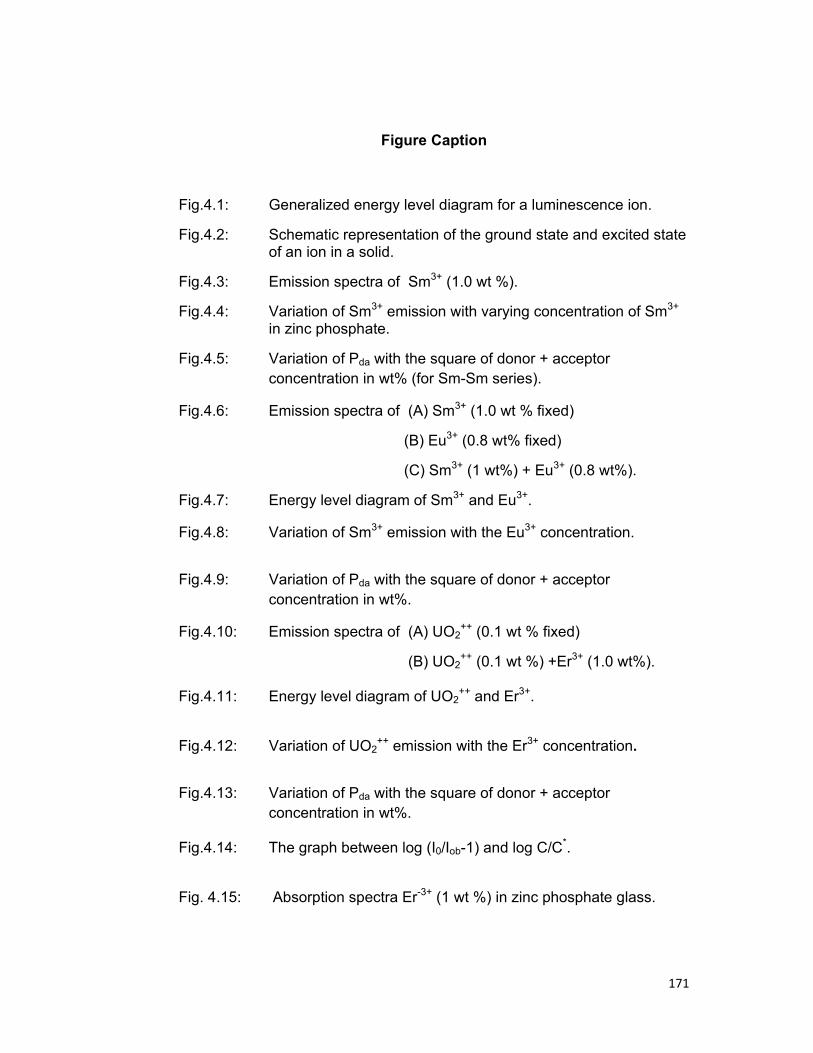
171
Figure Caption
Fig.4.1: Generalized energy level diagram for a luminescence ion.
Fig.4.2: Schematic representation of the ground state and excited state of an ion in a solid.
Fig.4.3: Emission spectra of Sm3+ (1.0 wt %).
Fig.4.4: Variation of Sm3+ emission with varying concentration of Sm3+ in zinc phosphate.
Fig.4.5: Variation of Pda with the square of donor + acceptor concentration in wt% (for Sm-Sm series).
Fig.4.6: Emission spectra of (A) Sm3+ (1.0 wt % fixed)
(B) Eu3+ (0.8 wt% fixed)
(C) Sm3+ (1 wt%) + Eu3+ (0.8 wt%).
Fig.4.7: Energy level diagram of Sm3+ and Eu3+.
Fig.4.8: Variation of Sm3+ emission with the Eu3+ concentration.
Fig.4.9: Variation of Pda with the square of donor + acceptor concentration in wt%.
Fig.4.10: Emission spectra of (A) UO2++ (0.1 wt % fixed)
(B) UO2++ (0.1 wt %) +Er3+ (1.0 wt%).
Fig.4.11: Energy level diagram of UO2++ and Er3+.
Fig.4.12: Variation of UO2++ emission with the Er3+ concentration.
Fig.4.13: Variation of Pda with the square of donor + acceptor concentration in wt%.
Fig.4.14: The graph between log (I0/Iob-1) and log C/C*.
Fig. 4.15: Absorption spectra Er-3+ (1 wt %) in zinc phosphate glass.
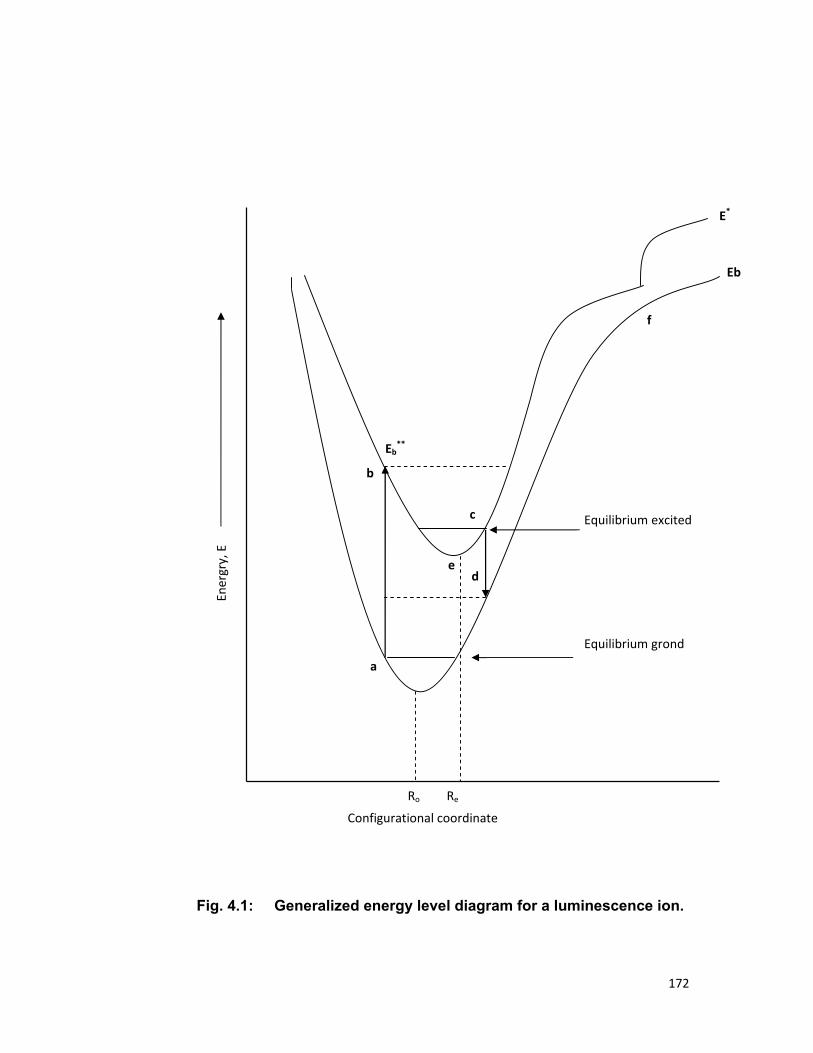
172
Fig. 4.1: Generalized energy level diagram for a luminescence ion.
b
a
Equilibrium grond
c
d
Ro Re
Equilibrium excited
Energry, E
Configurational coordinate
Eb
E*
f
Eb**
e

173
Fig. 4.2: Schematic representation of the ground state and excited state of an ion in a solid.
r
Δr
Energy
r
Ue
S
Ug
(Configurational coordinate)
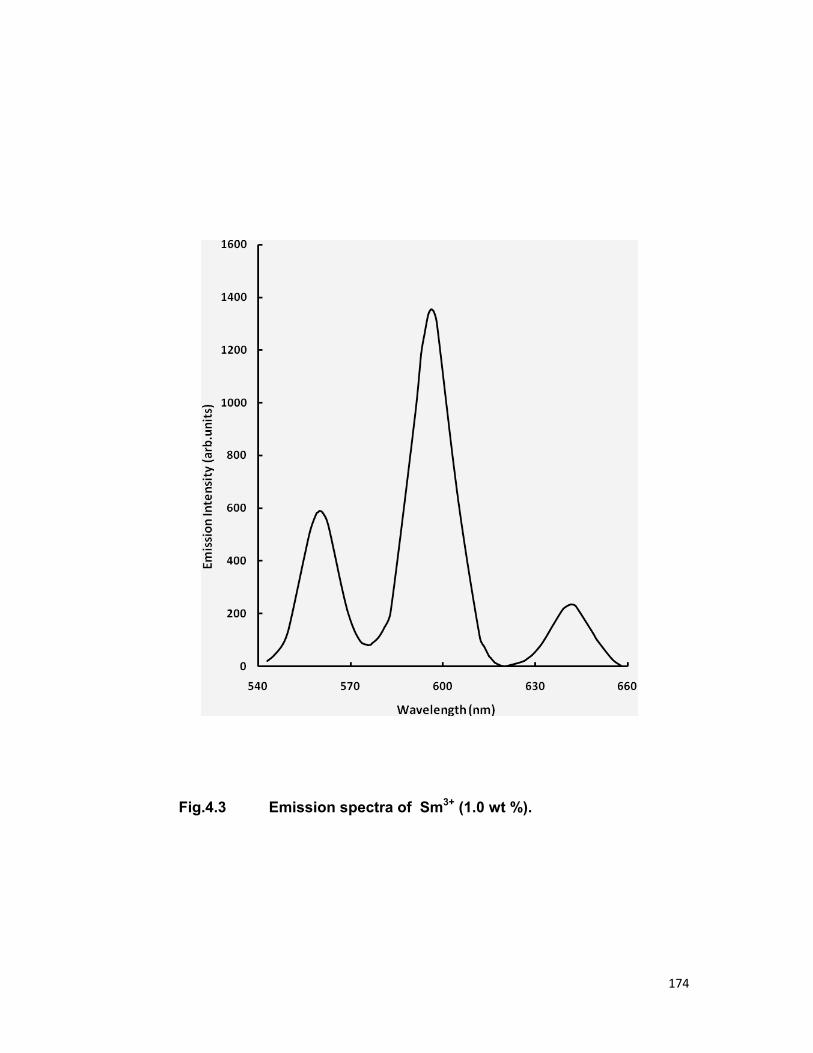
174
Fig.4.3 Emission spectra of Sm3+ (1.0 wt %).

175
Fig.4.4 Variation of Sm3+ emission with varying concentration of Sm3+ in zinc phosphate.
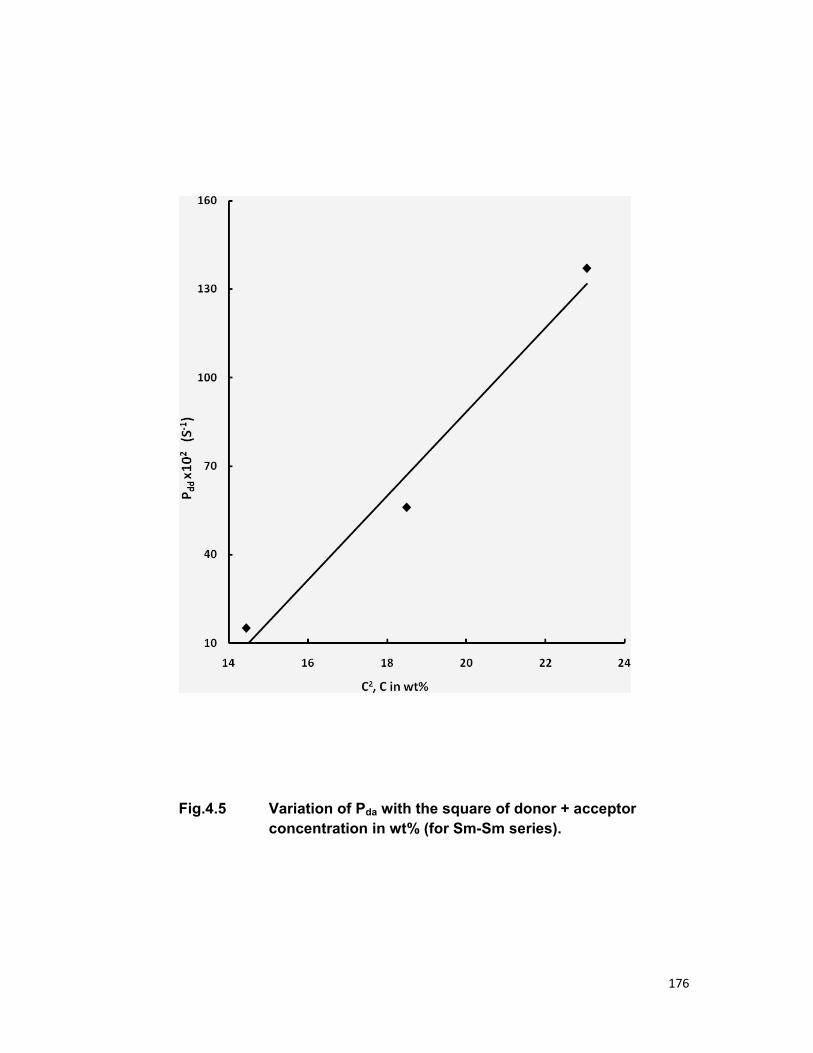
176
Fig.4.5 Variation of Pda with the square of donor + acceptor concentration in wt% (for Sm-Sm series).
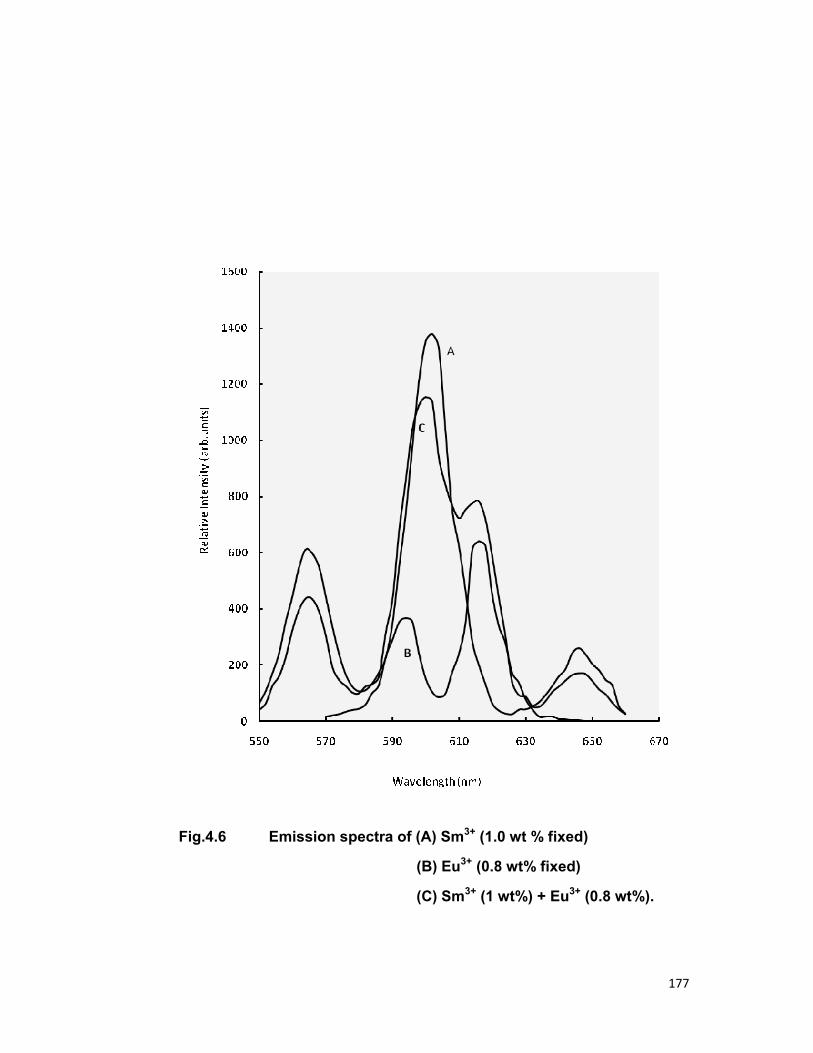
177
Fig.4.6 Emission spectra of (A) Sm3+ (1.0 wt % fixed)
(B) Eu3+ (0.8 wt% fixed)
(C) Sm3+ (1 wt%) + Eu3+ (0.8 wt%).
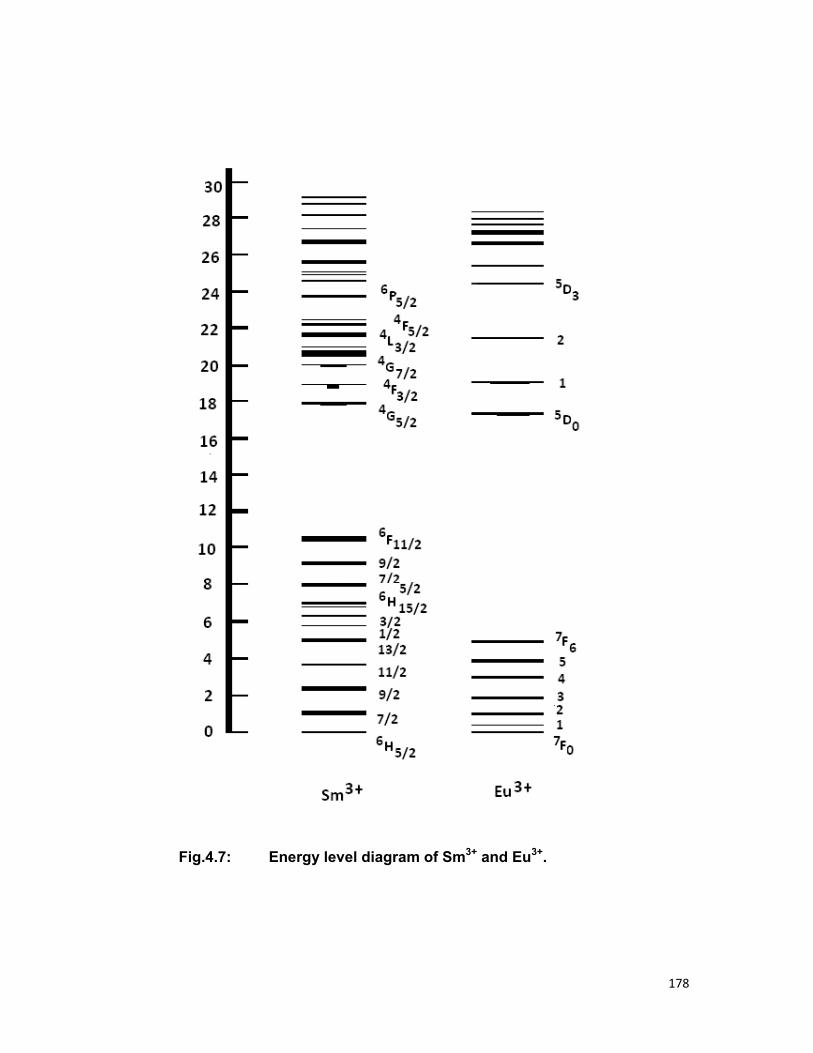
178
Fig.4.7: Energy level diagram of Sm3+ and Eu3+.
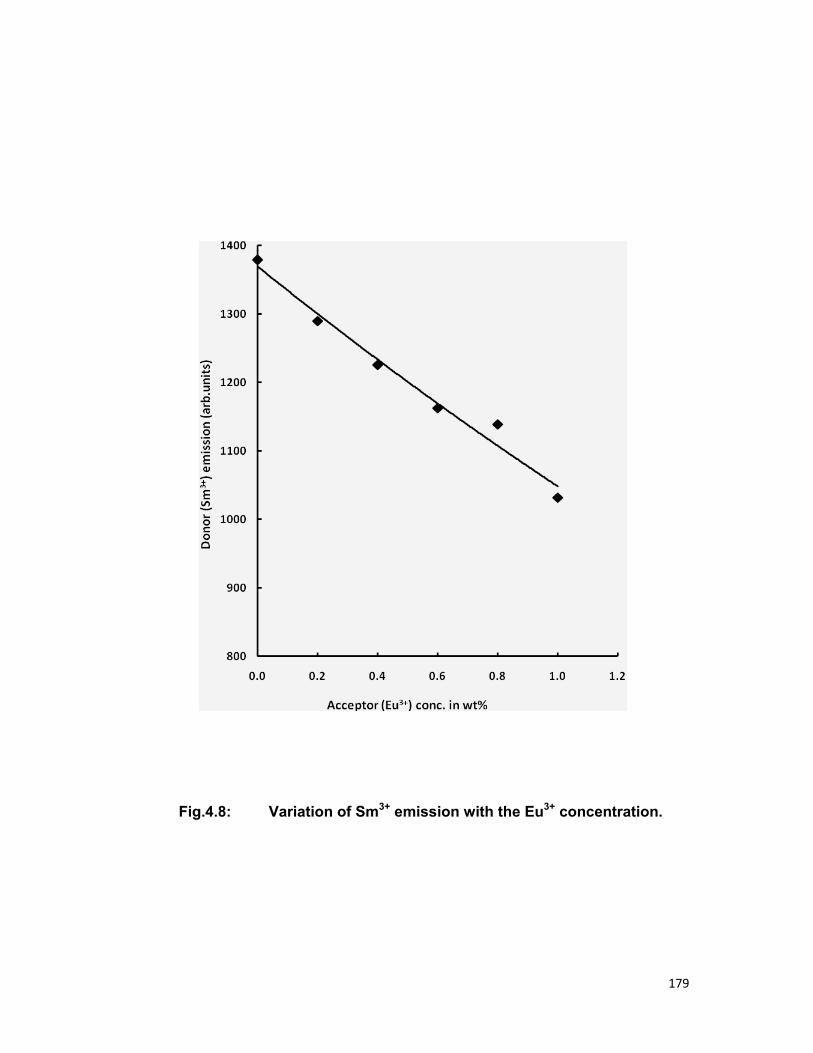
179
Fig.4.8: Variation of Sm3+ emission with the Eu3+ concentration.
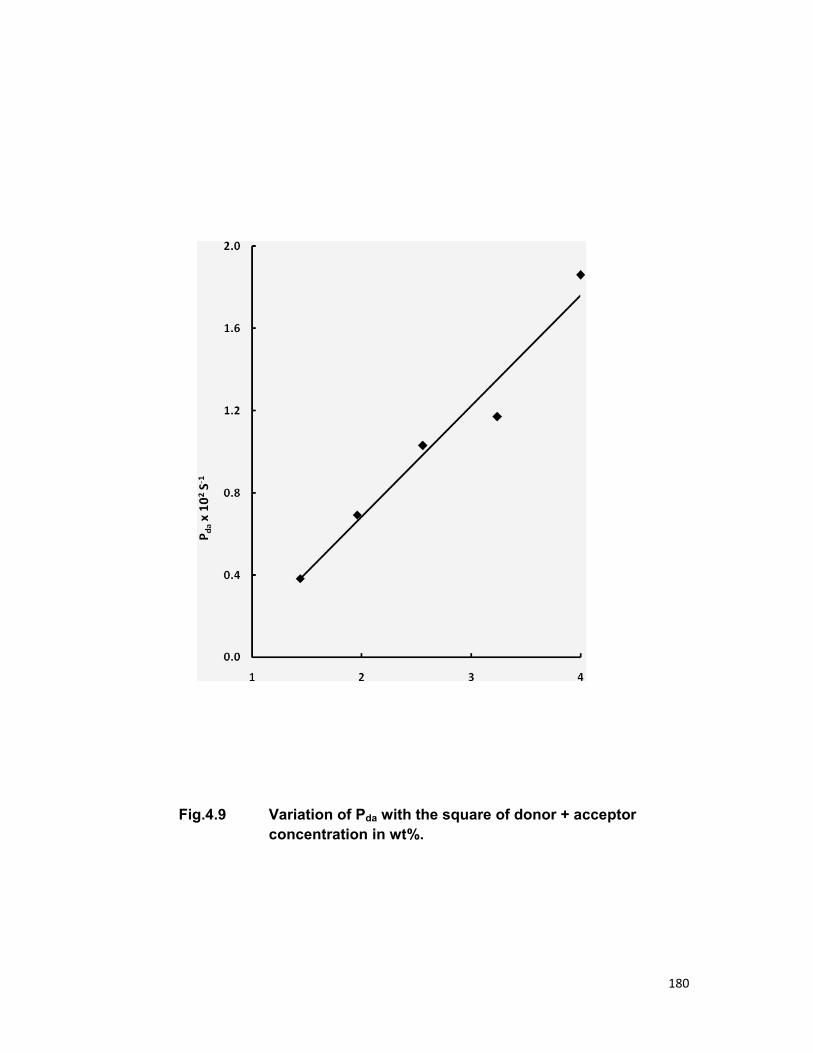
180
Fig.4.9 Variation of Pda with the square of donor + acceptor concentration in wt%.
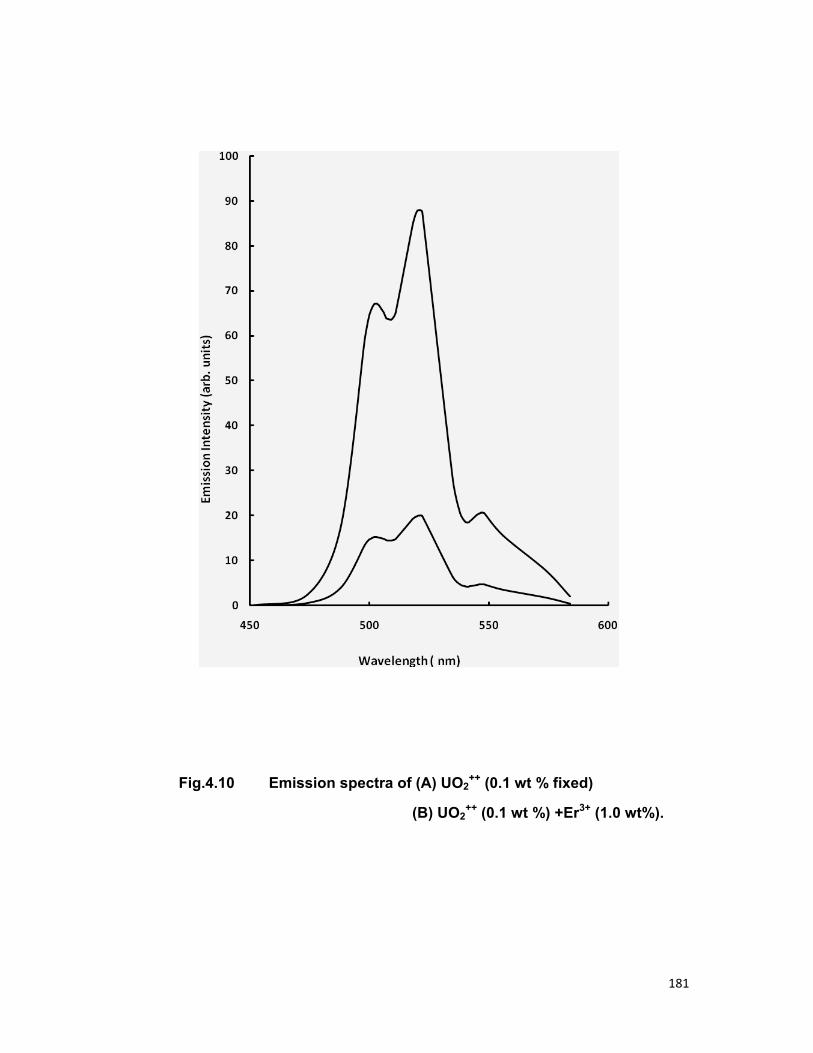
181
Fig.4.10 Emission spectra of (A) UO2++ (0.1 wt % fixed)
(B) UO2++ (0.1 wt %) +Er3+ (1.0 wt%).
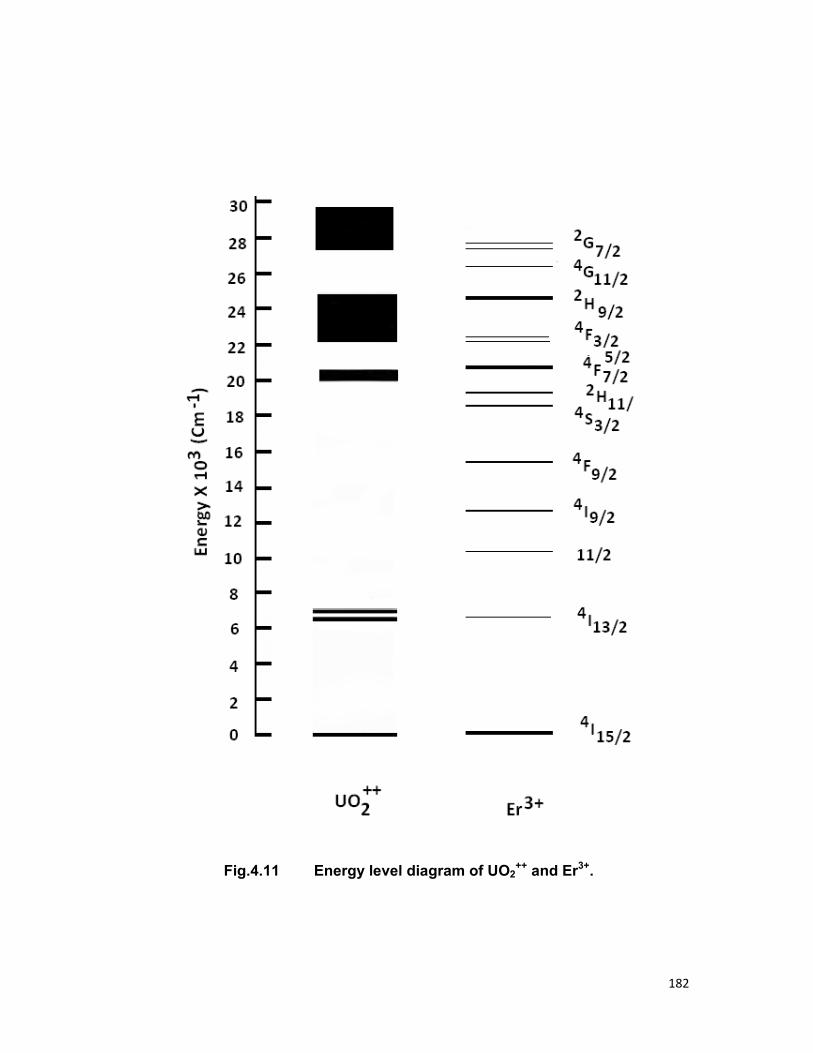
182
Fig.4.11 Energy level diagram of UO2++ and Er3+.
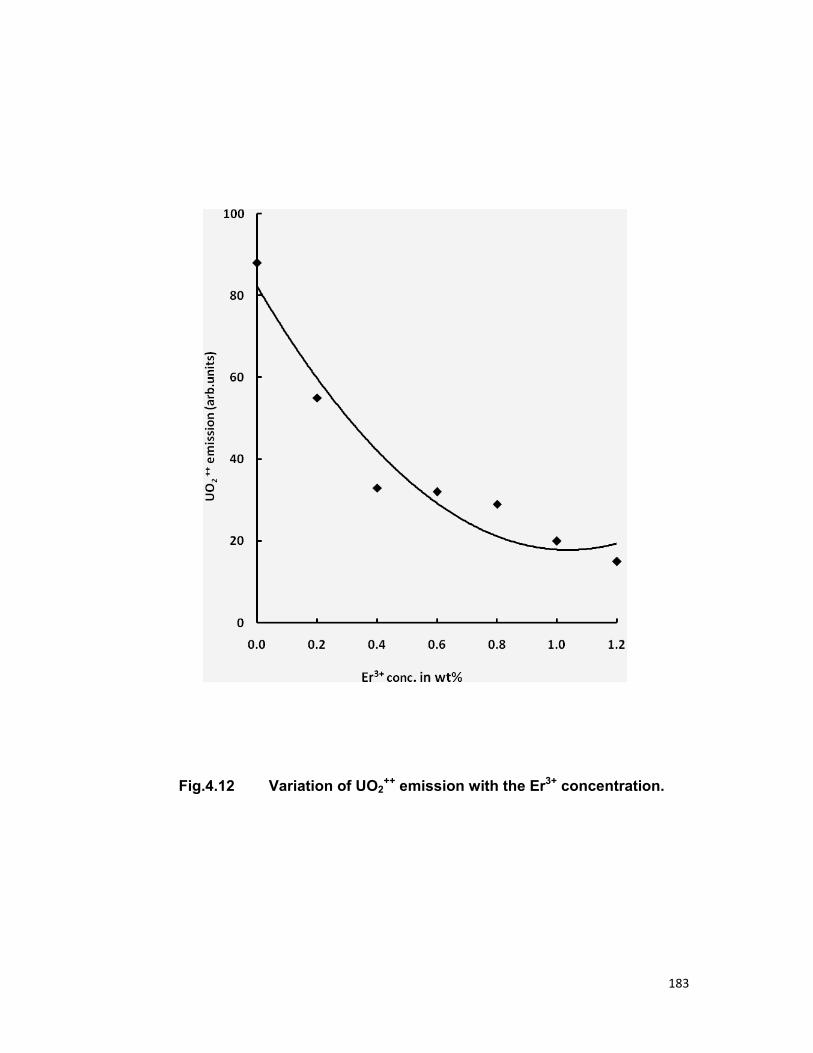
183
Fig.4.12 Variation of UO2++ emission with the Er3+ concentration.
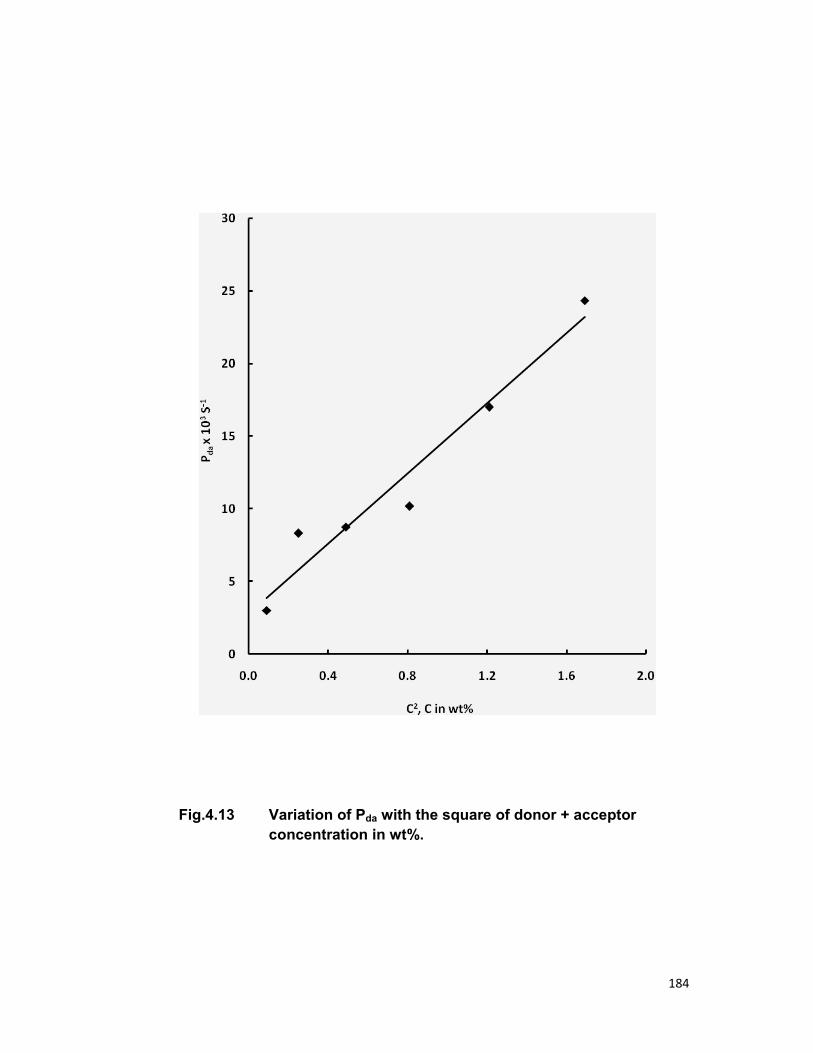
184
Fig.4.13 Variation of Pda with the square of donor + acceptor concentration in wt%.
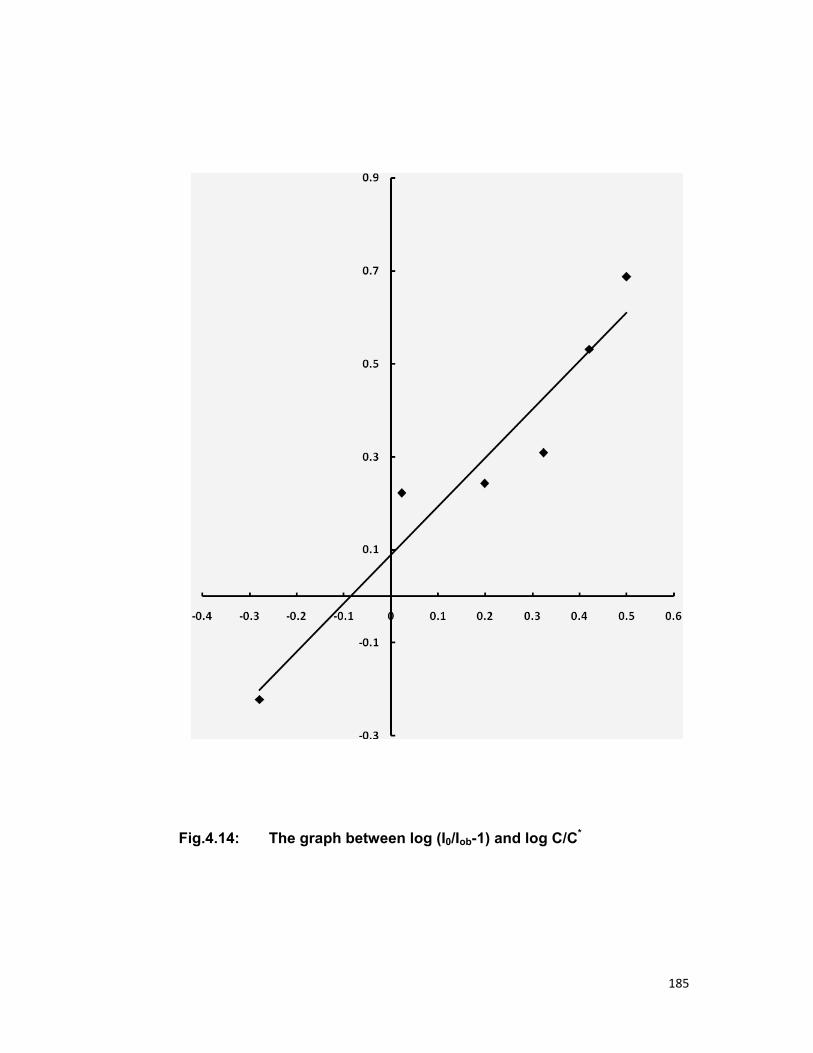
185
Fig.4.14: The graph between log (I0/Iob-1) and log C/C*
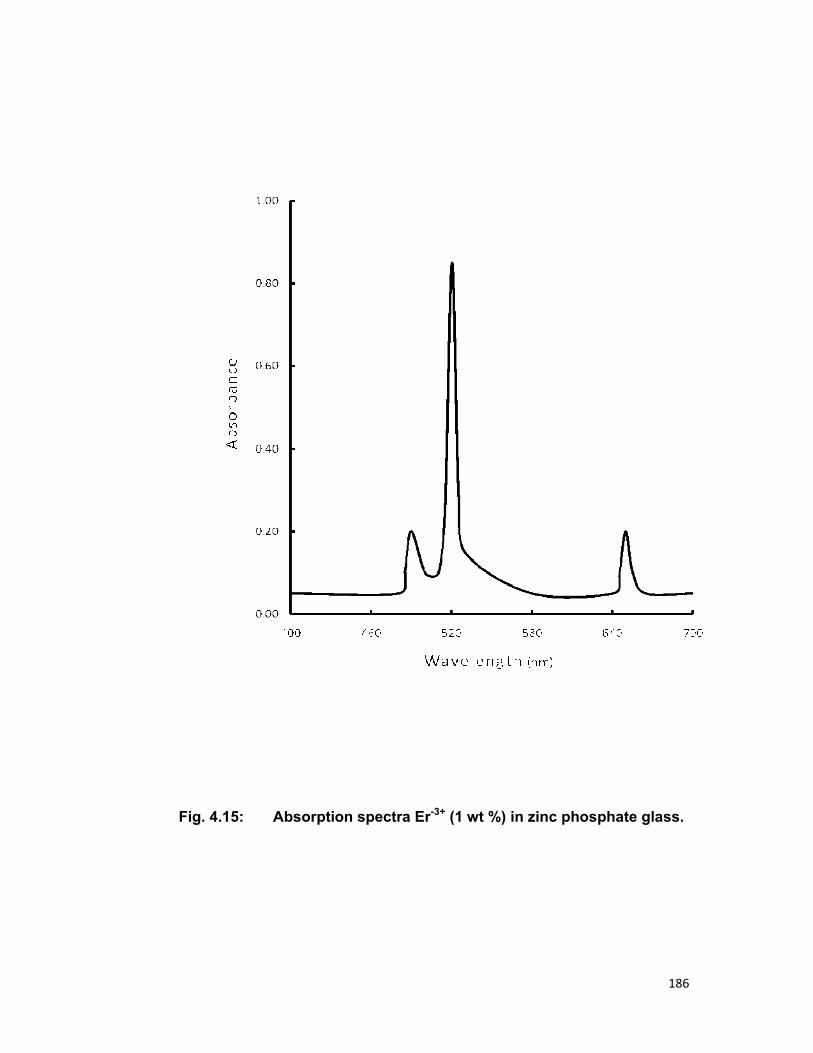
186
Fig. 4.15: Absorption spectra Er-3+ (1 wt %) in zinc phosphate glass.

187
CHAPTER 5
STUDY OF SENSITIZE LUMINESCENCE AND ENERGY TRANSFER PROCESS IN DY-PR
AND TM-ER SYSTEMS IN ZINC PHOSPHATE
GLASS
188
CHAPTER 5
STUDY OF SENSITIZE LUMINESCENCE AND ENERGY TRANSFER PROCESS IN Dy-Pr AND Tm-Er
SYSTEMS IN ZINC PHOSPHATE GLASS
5.1 INTRODUCTION
Optical properties of dysprosium doped glasses are now attracting a
practical interest because the 1.3 µm emission can be utilized for the optical
amplification in telecommunication systems [1-3]. Also the intense yellow
emission due to the 4F9/ 2 → 6H13/ 2 can be utilized as visible solid state laser
acting at novel wavelength [4].
The dysprosium ion in the trivalent state has a 4f9 electronic
configuration in it outermost electronic shell [5]. Generally, the luminescence
of Dy3+ ion is observed due to the transition from 6P7/2, 4I13/2 and 4F9/2 levels
to the ground 6H multiplets [6]. In glasses due to high phonon energy the
luminescence is observed only from 4F9/2 level.
The dysprosium (Dy3+) ion has been used as an energy donor in
transfer processes by many workers. Uitert & Dearborn [7] have observed a
non-radiative energy transfer from Dy3+ to Tb3+ in tungstates. Taking Dy3+ as
energy donor Joshi et. al. [8,9] have reported non-radiative energy transfer
from Dy3+ to Ho3+ and from Dy3+ to Er3+ in zinc phosphate glass. Joshi &
189
Joshi [10] have also studied diffusion limited energy transfer from Dy3+ to
Nd3+ in calibo glass.
Joshi et. al. [11] sensitized the praseodymium ion (Pr3+) by Mn2+ in
phosphate glass and reported that the energy transfer from Mn2+ to Pr3+
takes place non-radiatively and the mechanism of energy transfer observed
by them was electric dipole-dipole in nature. R.Lohani [12] has reported non-
radiative energy transfer from Sm3+ to Pr3+ in zinc phosphate glass. Some of
the workers studying properties of Pr3+ are cited in references [13-15].
A thulium ion with 4f12 is generally found in trivalent state. Reisfeld
and Eckstein [16, 17] have made the detailed study of thulium ion, alone as
well as codoped with erbium ions in many glassy matrices. Eyal et.al.[18]
found energy transfer from Mn2+ to low laying levels of Tm3+ in transition
metal fluoride glass. Joshi and Joshi [19] sensitize Pr3+ ions by Tm3+ ions in
sodium phosphate glasses.
In recent years, the erbium is the most studied RE ions in different
host materials [20-24]. Lohani [12] have reported the transfer of energy from
Mn2+ to Er3+ and energy transfer from Dy3+ to Er3+ in zinc phosphate glass.
Keeping above facts in mind, we have chosen the Dy3+ - Pr3+ and
Tm3+ - Er3+ systems in zinc phosphate glass to investigate the following
points:
(a) Nature of the energy transfer from Dy3+ to Pr3+ and Tm3+ to
Er3+.
190
(b) The mechanism of energy transfer between the ions in each of
the systems mentioned above.
(c) The levels between which the energy transfer takes place.
(d) Calculation of parameters related to energy transfer as a
function of concentration (e.g. average donor –acceptor
distance (DD-A), transfer probabilities (PDA), transfer efficiencies
(η) etc..
5.2 EXPERIMENTAL MATERIALS AND METHODS:
Sodium dihydrogen phosphate 2-hydrate (NaH2PO4 .2H2O) and
zinc oxide (ZnO), both of reagent grade, were used in a proportion of 3:1 by
weight, were used as the constituents of the glass matrix .The method for
preparing the glass pallets has already been discussed in chapter 2.
The following series of glasses were prepared by doping the above
mentioned rare earth ions for studying the energy transfer.
Series 3.I: This series consists of glasses doped with 1 wt % (fixed)
of Dy3+ codoped with 0.25 wt %, 0.50 wt% ,0.75
wt%,1.0 wt % ,1.25 wt% of Pr3+.
Series 3.II: This series consists of glasses doped with 1 wt % (fixed)
of Tm3+ codoped with 0.2 wt %, 0.4 wt% ,0.6 wt%,0.8 wt
% ,1.0 wt% and 1.2 wt% of Er3+.
Glass samples doped with 1 wt% of Er3+ and doped with 1 wt% of
Pr3+ are prepared to study the absorption spectra.
191
Emission & absorption spectra were taken according to the method
described in chapter 2.
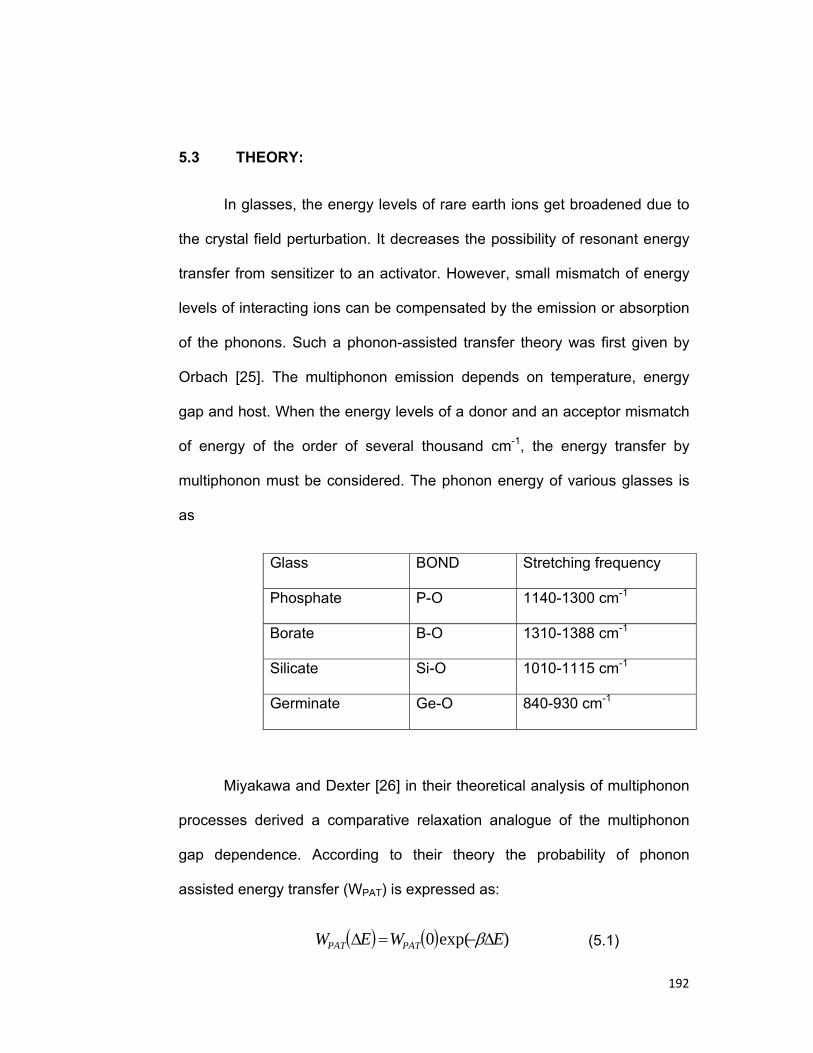
192
5.3 THEORY:
In glasses, the energy levels of rare earth ions get broadened due to
the crystal field perturbation. It decreases the possibility of resonant energy
transfer from sensitizer to an activator. However, small mismatch of energy
levels of interacting ions can be compensated by the emission or absorption
of the phonons. Such a phonon-assisted transfer theory was first given by
Orbach [25]. The multiphonon emission depends on temperature, energy
gap and host. When the energy levels of a donor and an acceptor mismatch
of energy of the order of several thousand cm-1, the energy transfer by
multiphonon must be considered. The phonon energy of various glasses is
as
Glass BOND Stretching frequency
Phosphate P-O 1140-1300 cm-1
Borate B-O 1310-1388 cm-1
Silicate Si-O 1010-1115 cm-1
Germinate Ge-O 840-930 cm-1
Miyakawa and Dexter [26] in their theoretical analysis of multiphonon
processes derived a comparative relaxation analogue of the multiphonon
gap dependence. According to their theory the probability of phonon
assisted energy transfer (WPAT) is expressed as:
( ) ( ) )exp(0 EWEW PATPAT ∆−=∆ β (5.1)
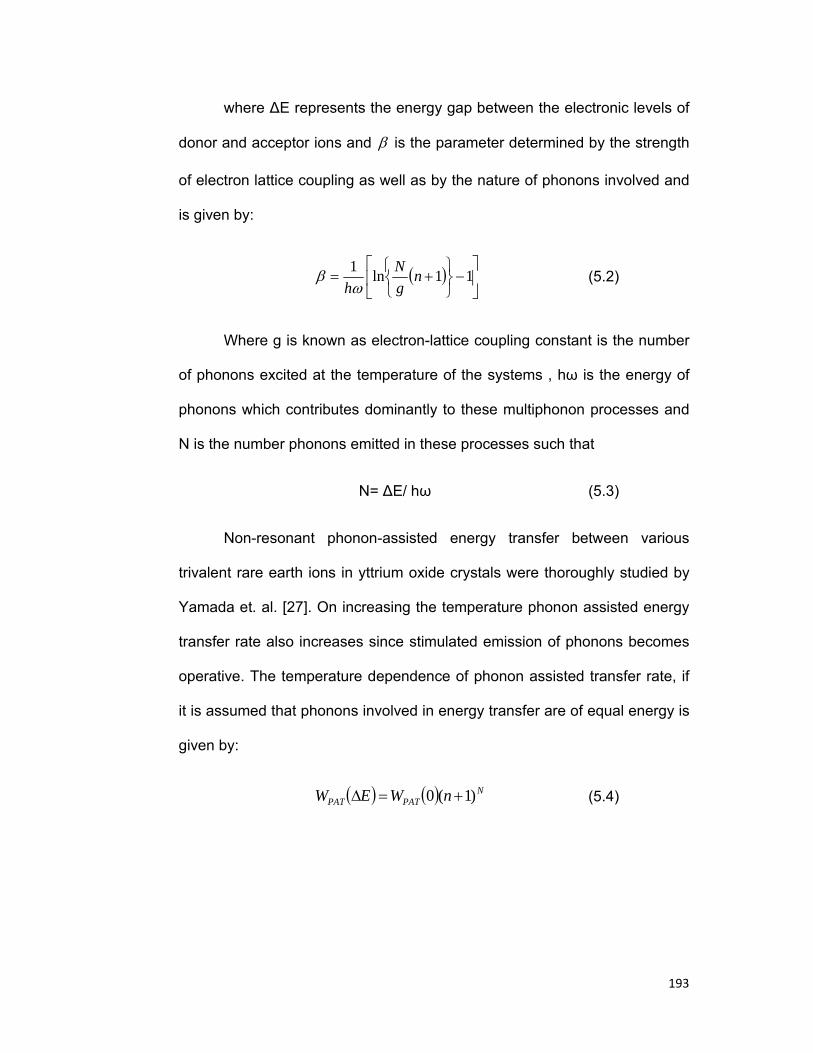
193
where ∆E represents the energy gap between the electronic levels of
donor and acceptor ions and β is the parameter determined by the strength
of electron lattice coupling as well as by the nature of phonons involved and
is given by:
( ) ⎥⎦
⎤⎢⎣
⎡−
⎭⎬⎫
⎩⎨⎧
+= 11ln1 ngN
hωβ (5.2)
Where g is known as electron-lattice coupling constant is the number
of phonons excited at the temperature of the systems , hω is the energy of
phonons which contributes dominantly to these multiphonon processes and
N is the number phonons emitted in these processes such that
N= ∆E/ hω (5.3)
Non-resonant phonon-assisted energy transfer between various
trivalent rare earth ions in yttrium oxide crystals were thoroughly studied by
Yamada et. al. [27]. On increasing the temperature phonon assisted energy
transfer rate also increases since stimulated emission of phonons becomes
operative. The temperature dependence of phonon assisted transfer rate, if
it is assumed that phonons involved in energy transfer are of equal energy is
given by:
( ) ( ) NPATPAT nWEW )1(0 +=∆ (5.4)
194
5.4 RESULTS AND DISCUSSION
5.4.A) The Dy - Pr system in zinc phosphate glass
Fluorescent spectra:
Emission spectra of Dy3+ (1wt %) and Dy3+ (1wt %) + Pr3+ (1wt %) are
shown in part ‘A’ and part ‘B’ of Fig. 5.1 respectively. Two peaks in Dy3+
emission spectra arise due to transition 4F9/2-6H15/2 and 4F9/2-6H13/2 lying at
482nm and 475nm respectively. When glass matrix is excited by 365 nm
group of mercury lines, Dysprosium ions rapidly depopulates to luminescent
4F9/2 level by non radiative decay and remains there for 570µs in zinc
phosphate glass.
Nature of energy transfer:
Fig.5.2 shows the variation of Dy3+ emission intensity with the varied
concentration of Pr3+ ions and in Fig. 5.2(B) shows the emission spectra of
Dy3+ (1wt%) + Pr3+ (1wt%). Both the observations indicate that there is
overall decrease of emission intensity of Dy3+. The overall decrease of the
emission intensity of Dy3+ ion suggests that there is non-radiative energy
transfer from Dy3+ to Pr3+ ion.
Energy transfer by exchange process is negligible in our case
because it needs acceptor-donor separation of about 0.3-0.4nm with overlap
of wavefunction, while in our case donor-acceptor separation varies from
1.36 nm to 1.68 nm. Fig.5.5 shows absorption spectra of Pr3+. Possibility of
195
radiative energy transfer from Dy3+ to Pr3+ is ruled out as absorption peaks
(Fig.5.5) of acceptor (Pr3+) ions do not falls at either emission peaks of donor
(Dy3+) ions.
Mechanism of energy transfer:
In order to find out the mechanism of energy transfer, we proceed
as follows:
Energy level diagrams of Dy3+ and Pr3+ are presented in Fig.5.3.
When glass matrix is excited by 365 nm group of mercury lines, Dysprosium
ions rapidly depopulate to luminescent 4F9/2 level by non radiative decay and
remain there for 570µs in zinc phosphate glass. A close examination of
energy level diagrams of Dy3+ and Pr3+ shows that 4F9/2 level of Dy3+
matches with 1P1 level of Pr3+. Hence sEnergy can non-radiatively transfer
from Dy3+ to Pr3+. The small mismatch of energy level is compensated by
some low energy phonons.
Multipolar term responsible for energy transfer:
To find out multipolar term responsible for energy transfer from Dy3+
to Pr3+, we plotted graph (Fig.5.4) between energy transfer probabilities Pda
and square of donor + acceptor concentration. It comes out as a straight
line. The linearity of the graph shows electric dipole-dipole interaction is
responsible for the energy transfer supporting the Fong-Diesler theory .
The critical donor-acceptor distance at which the probability of energy
transfer rate is equal to radiative decay is 1.37 nm in Dy3+-Pr3+ system which
196
can be compared with R0=1.88 nm in Dy3+-Er3+ in zinc phosphate Eyal
et.al. , Joshi et.al. R0=1.91 nm in Eu3+-Tm3+ system in zinc
phosphate glass.
Other parameters involved in the energy transfer:
In this series, the average donor acceptor distance along with the
energy transfer probabilities & transfer efficiencies are presented in table 3.1
which are calculated by using the following formulae:
DD→A = 1 / (Cd + Ca) 1/3
where Cd & Ca are donor and acceptor ion concentration per cm3 in
the host matrix.
Pda =1/τ0 (Id0/Id - 1),
η= 1 – Id/Id0.
5.4.B) The Tm - Er system in zinc phosphate glass
Fluorescent spectra:
Emission spectra of Tm3+ (1wt %) and Tm3+ (1wt %) + Er3+ (1wt %)
are shown in part ‘A’ and part ‘B’ of Fig. 5.6 respectively. The Tm3+ ions
when excited by 365 nm radiation in zinc phosphate glass gives emission in
blue-violet region of spectrum. The fluorescence spectrum of Tm3+ in zinc
phosphate glass shows two peaks at 454 nm and 475 nm. The peak at 454
nm corresponds to the transition 1D2-3H4 and peak at 475 nm to 1G4-3H6.
197
Emission spectrum shows that the peak due to the transition 1D2-3H4 is more
intense that of the transition 1G4-3H6.
Nature of energy transfer:
Fig.5.8 shows the variation of Tm3+ emission intensity with the
varied concentration of Er3+ ions and in Fig. 5.6(B) shows the emission
spectra of Tm3+ (1wt%) + Er3+ (1wt%). Both the observations indicate that
the incorporation of Er3+ ions to the Tm3+ ions decrease the Tm3+ emission.
The emissions of both the peaks decrease with the same proportion. From
the overall decrease of the emission intensity of Tm3+ ion we suggest that
there is non-radiative energy transfer from Tm3+ to Er3+ ion.
Energy transfer by exchange process is negligible in our case
because it needs acceptor-donor separation of about 0.3-0.4nm with overlap
of wavefunction, while in our case donor-acceptor separation varies from
1.42nm to 1.74nm.
Possibility of radiative energy transfer from Tm3+ to Er3+ is ruled out
as no absorption peaks (Fig.5.10) of acceptor (Er3+) ions falls at emission
peaks of donor (Tm3+) ions.
Mechanism of energy transfer:
In order to find out the mechanism of energy transfer, we proceed
as follows:
Tm3+ and Er3+ ions are randomly distributed in the glass matrix.
When the glass matrix is excited by the 365 nm radiation, the Tm3+ ions
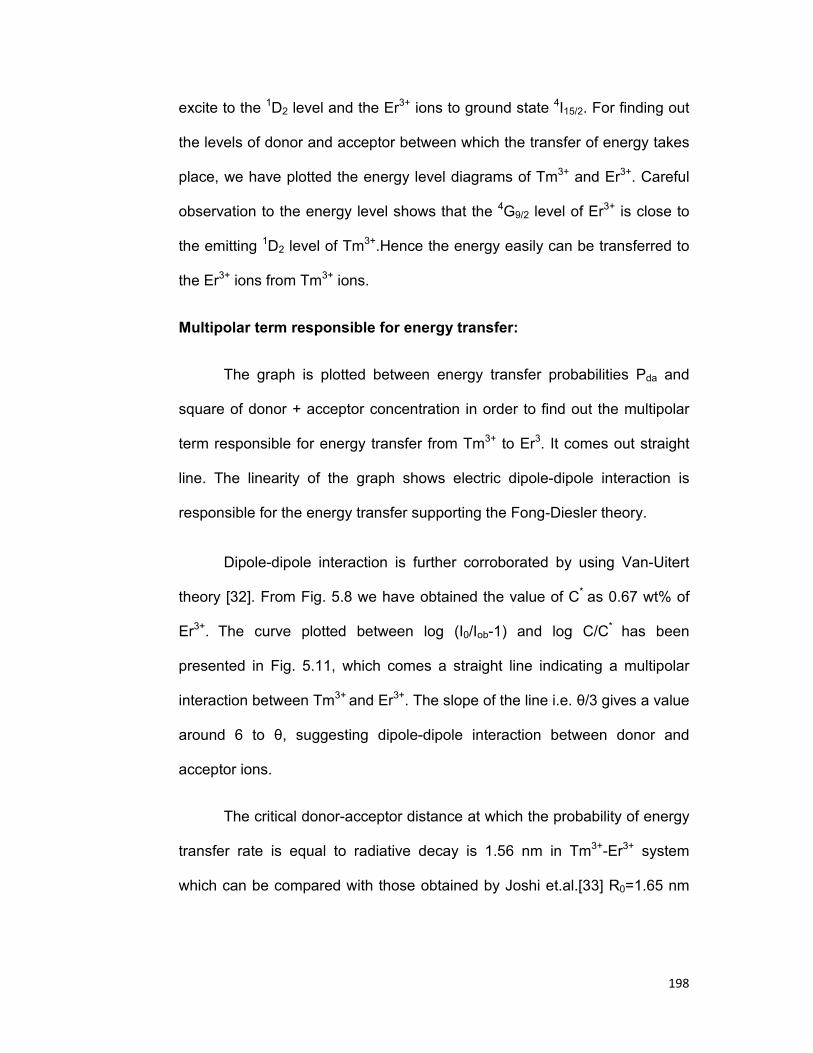
198
excite to the 1D2 level and the Er3+ ions to ground state 4I15/2. For finding out
the levels of donor and acceptor between which the transfer of energy takes
place, we have plotted the energy level diagrams of Tm3+ and Er3+. Careful
observation to the energy level shows that the 4G9/2 level of Er3+ is close to
the emitting 1D2 level of Tm3+.Hence the energy easily can be transferred to
the Er3+ ions from Tm3+ ions.
Multipolar term responsible for energy transfer:
The graph is plotted between energy transfer probabilities Pda and
square of donor + acceptor concentration in order to find out the multipolar
term responsible for energy transfer from Tm3+ to Er3. It comes out straight
line. The linearity of the graph shows electric dipole-dipole interaction is
responsible for the energy transfer supporting the Fong-Diesler theory.
Dipole-dipole interaction is further corroborated by using Van-Uitert
theory [32]. From Fig. 5.8 we have obtained the value of C* as 0.67 wt% of
Er3+. The curve plotted between log (I0/Iob-1) and log C/C* has been
presented in Fig. 5.11, which comes a straight line indicating a multipolar
interaction between Tm3+ and Er3+. The slope of the line i.e. θ/3 gives a value
around 6 to θ, suggesting dipole-dipole interaction between donor and
acceptor ions.
The critical donor-acceptor distance at which the probability of energy
transfer rate is equal to radiative decay is 1.56 nm in Tm3+-Er3+ system
which can be compared with those obtained by Joshi et.al.[33] R0=1.65 nm
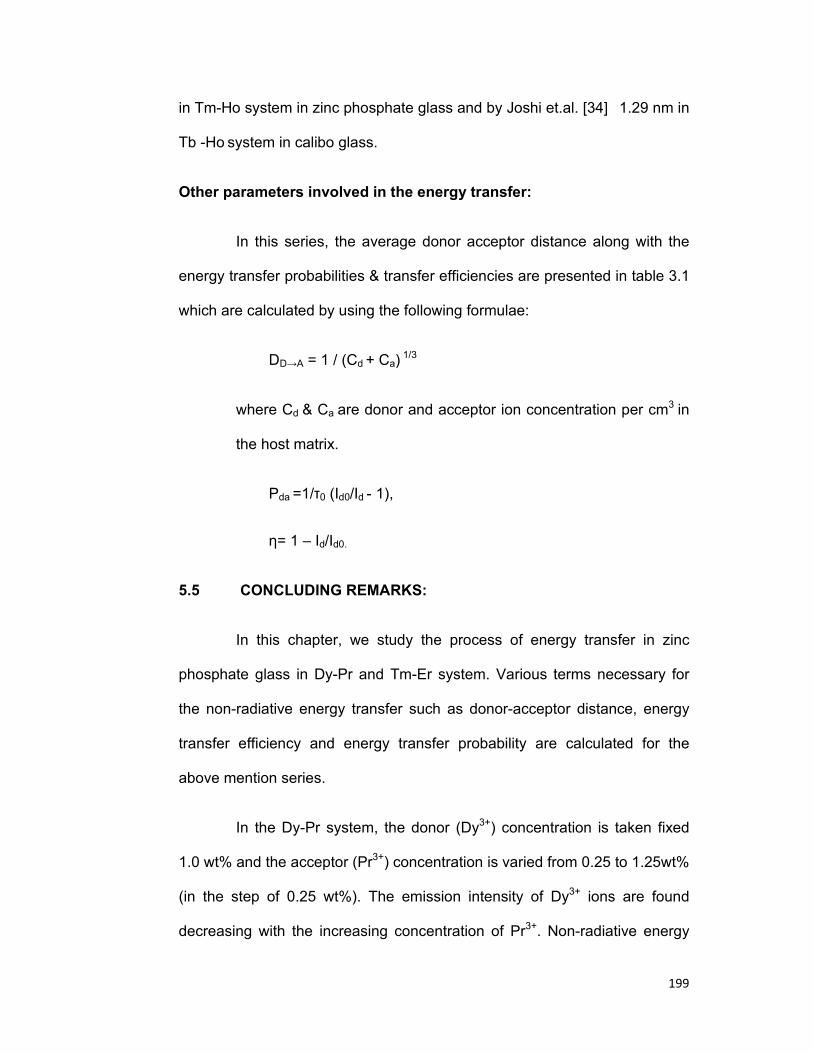
199
in Tm-Ho system in zinc phosphate glass and by Joshi et.al. [34] 1.29 nm in
Tb -Ho system in calibo glass.
Other parameters involved in the energy transfer:
In this series, the average donor acceptor distance along with the
energy transfer probabilities & transfer efficiencies are presented in table 3.1
which are calculated by using the following formulae:
DD→A = 1 / (Cd + Ca) 1/3
where Cd & Ca are donor and acceptor ion concentration per cm3 in
the host matrix.
Pda =1/τ0 (Id0/Id - 1),
η= 1 – Id/Id0.
5.5 CONCLUDING REMARKS:
In this chapter, we study the process of energy transfer in zinc
phosphate glass in Dy-Pr and Tm-Er system. Various terms necessary for
the non-radiative energy transfer such as donor-acceptor distance, energy
transfer efficiency and energy transfer probability are calculated for the
above mention series.
In the Dy-Pr system, the donor (Dy3+) concentration is taken fixed
1.0 wt% and the acceptor (Pr3+) concentration is varied from 0.25 to 1.25wt%
(in the step of 0.25 wt%). The emission intensity of Dy3+ ions are found
decreasing with the increasing concentration of Pr3+. Non-radiative energy

200
transfer from Dy3+ to Pr3+ions is mainly responsible for decreasing the Dy3+
emission. Fong-Diestler theory is used to find out the multipolar term
responsible for the transfer, it explain the dipole-dipole interaction is
responsible for the transfer which is further supported by Forster and Dexter
theory.
In Tm-Er system, the Tm3+ concentration is taken fixed 1.0 wt% and
the Er3+ concentration is varied from 0.2 to 1.2wt% (in the step of 0.2 wt %).
Decreases in Tm3+ emission with increasing concentration suggest that
there is non-radiative energy transfer from Tm3+ ions to Er3+ ions. Careful
observation to the energy level shows that the 4G9/2 level of Er3+ is close to
the emitting 1D2 level of Tm3+.Hence the energy easily can be transferred to
the Er3+ ions from Tm3+ ions. The graph is plotted between energy transfer
probabilities Pda and square of donor + acceptor concentration in order to
find out the multipolar term responsible for energy transfer from Tm3+ to Er3.
It comes out straight line. The linearity of the graph shows electric dipole-
dipole interaction is responsible for the energy transfer supporting the Fong-
Diesler theory.
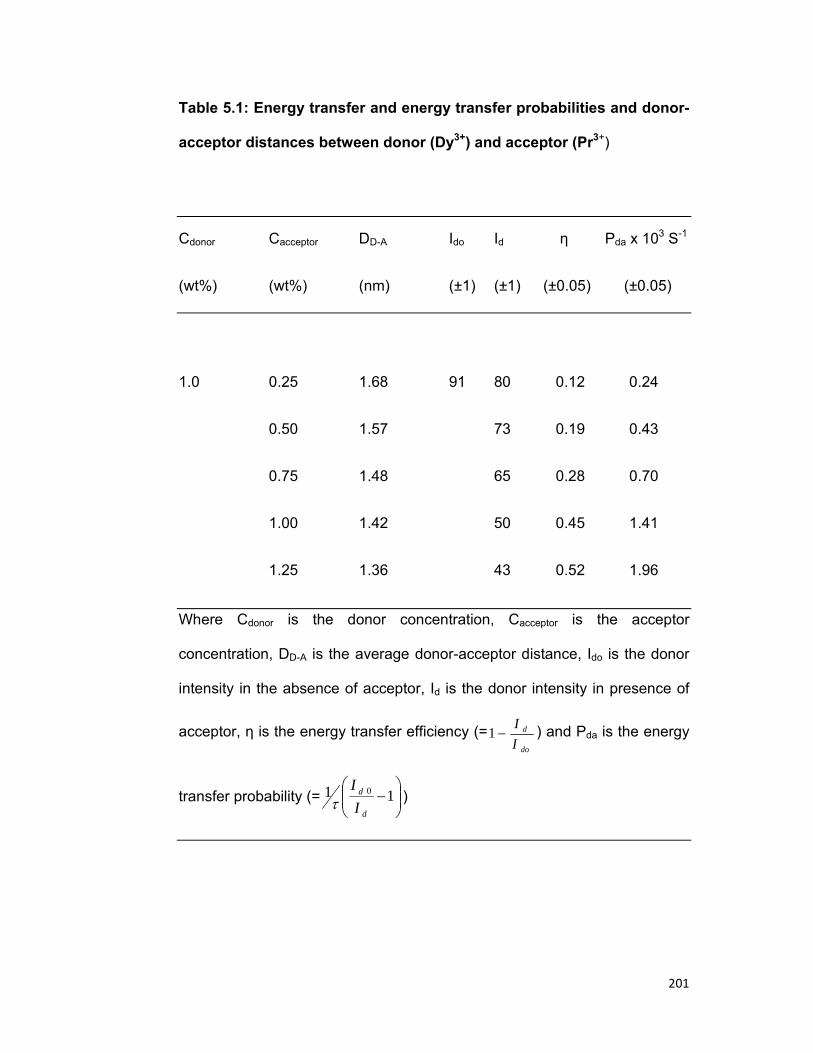
201
Table 5.1: Energy transfer and energy transfer probabilities and donor-
acceptor distances between donor (Dy3+) and acceptor (Pr3+)
Cdonor Cacceptor DD-A Ido Id η Pda x 103 S-1
(wt%) (wt%) (nm) (±1) (±1) (±0.05) (±0.05)
1.0 0.25 1.68 91 80 0.12 0.24
0.50 1.57 73 0.19 0.43
0.75 1.48 65 0.28 0.70
1.00 1.42 50 0.45 1.41
1.25 1.36 43 0.52 1.96
Where Cdonor is the donor concentration, Cacceptor is the acceptor
concentration, DD-A is the average donor-acceptor distance, Ido is the donor
intensity in the absence of acceptor, Id is the donor intensity in presence of
acceptor, η is the energy transfer efficiency (=do
d
II
−1 ) and Pda is the energy
transfer probability (= ⎟⎟⎠
⎞⎜⎜⎝
⎛−11 0
d
d
II
τ )
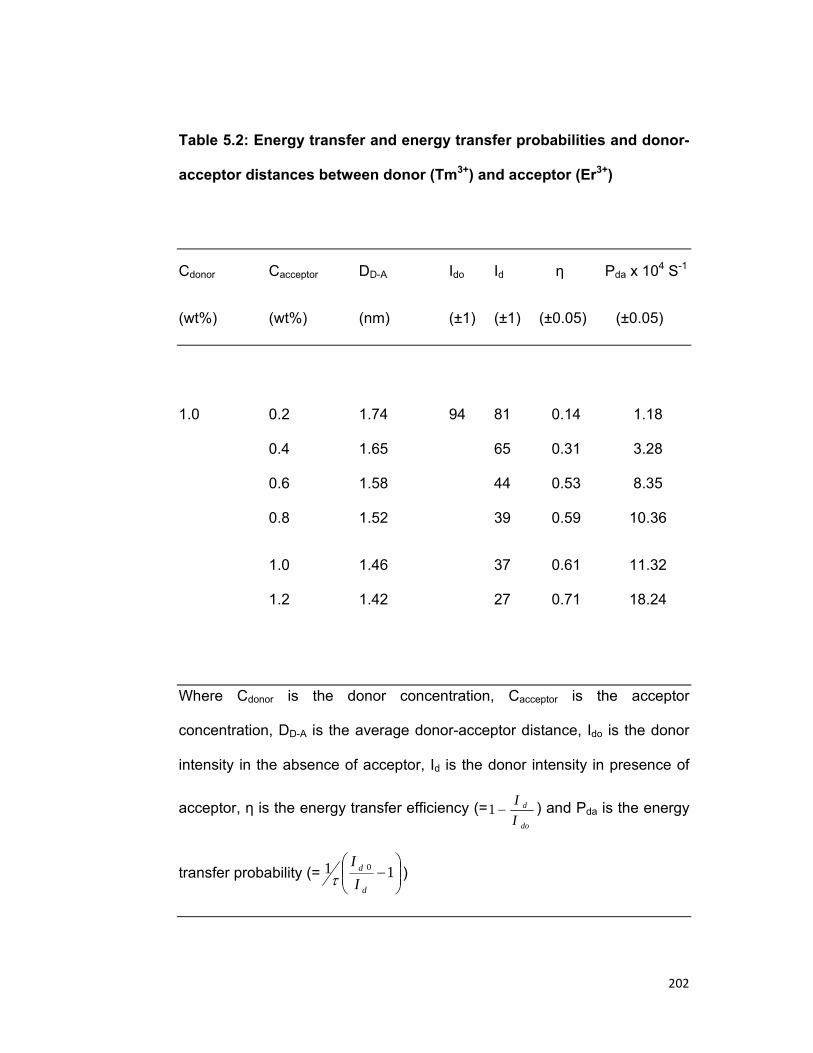
202
Table 5.2: Energy transfer and energy transfer probabilities and donor-
acceptor distances between donor (Tm3+) and acceptor (Er3+)
Cdonor Cacceptor DD-A Ido Id η Pda x 104 S-1
(wt%) (wt%) (nm) (±1) (±1) (±0.05) (±0.05)
1.0 0.2 1.74 94 81 0.14 1.18
0.4 1.65 65 0.31 3.28
0.6 1.58 44 0.53 8.35
0.8 1.52 39 0.59 10.36
1.0 1.46 37 0.61 11.32
1.2 1.42 27 0.71 18.24
Where Cdonor is the donor concentration, Cacceptor is the acceptor
concentration, DD-A is the average donor-acceptor distance, Ido is the donor
intensity in the absence of acceptor, Id is the donor intensity in presence of
acceptor, η is the energy transfer efficiency (=do
d
II
−1 ) and Pda is the energy
transfer probability (= ⎟⎟⎠
⎞⎜⎜⎝
⎛−11 0
d
d
II
τ )
203
BIBLIOGRAPHY
1. K.Wei,D.P.Machewirt J.Wenzel, E.Snitzer, G.H.sergen:
J.Opt.Lett., 19(12)(1994)904.
2. D.H.Hewak, B.N.Samson, J.A.Mederion Neto, R.T.Laming,
D.N.Payne: Electron Lett., 30(1994)968.
3. .Tanabe,T.Hanada,M.wattnabe,T.Hayshi,N.Sogo:
J.Am.Ceram.Soc., 78(1995) 2917.
4. S.Tanabe, J.Kang, T.Hanada:J.Non Cryst.Solids, 239(1998)170.
5. B.R.Judd: Phys.Rev., 127(1962)750.
6. G.H.Dieke: Spectra and energy levels of rare earths (Wiley
Interscience, New York) 1965.
7. L.G.VanUitert, E.F.Dearborn and J.T.Rubin: J chem. Phys.,
46(1967)3551.
8. B.C.Joshi & R. Lohani, Bimal Pandey: J. non-crystalline Solids,
337(2004) 97.
9. B.C.Joshi & R. Lohani: J. Non-crystalline Solids, 189(1995)242.
10. J.C.Joshi and B.C.Joshi: J Solid state chem., 26(1978)179.
11. B.C.Joshi and M.C.Joshi & B.D.Joshi:J. Phy. Chem. Solids, 52
(1991) 939.
12. R.K. Lohani: Unpublished Ph.D. thesis submitted to Kumaun
University, (2000).
13. Y.K. Sharma, R.K. Singh and S.S.L.Surana, International
Conference on disordered systems, Goa (India) Sept. 24 (2004).
14. N.Krasutsky and H.W.Moos: Phys.Rev., B8 (1973)1010.
204
15. W.T.Carnall, P.R.Fields and K.Rajanak: J.Chem.Phys.,
49(1968)4424.
16. R.Reisfeld & Y.Eckstein: J. Non-crystalline solids, 12(1973) 357.
17. R.Reisfeld & Y.Eckstein: J.Solid state Chem., 11(1973) 261.
18. M. Eyal, R. Reisfeld, A.Schiller, C.Jacobani &
C.K.Jorgenson:Chem. Phys. Lett. , 140 (1987)595.
19. B.C.Joshi & M.C.Joshi: J. Non-crystalline Solids, 142 (1992) 171.
20. M. Shojiya, M. Takahashi, R. Kanno, Appl. Phys. Lett., 65(1994)
1874.
21. K. Kojima, S. Yoshida, H. Shiraishi: Appl. Phys. Lett. , 67(1995)
3423.
22. J. J. Ju, T. Y. Kwon, S. I. Yun: Appl. Phys. Lett., 69(1996) 1358.
23. T.Gregorkiewicz, D.T.X.Yhao, J.M.Langer: Physica Status Solidi,
210(1999)735.
24. S.M.Karstriskii, Yu N.Kortisko, V.A.Fedorov, C.Sada: Physica
status solidi, 1(11) (2004)3158.
25. R.Orbach: Proc. Royal Soc. Am., 264 (1961)458.
26. T.M.Miyakawa and D.L.Dexter: Phys.Rev., B1(1970)2961.
27. N.S.Yamada, S.Shionoya and T.Kushida: J.Phys.Soc.Japan,
32(1972)1577.
28. K.K. Pandey : Indian Journal of Pure and Applied Physics,
29(1991) 362.
29. F.K. Fong Fong & D.J.Diestler: J Chem Phys 56(1972) 2875.
30. M. Eyal, R. Reisfeld: Chem Phys Lett 40(1987) 595.
205
31. B.C.Joshi & C.C.Dhondiyal: Indian J of pure & applied Phys
43(2005)918.
32. L.G. Van Uitert and L.F. Johnson: J.Chem.Phys., 44 (1966) 3514.
33. B.C.Joshi, R.Lohani: J. Non Cryst.Solids, 215(1997)103.
34. J.C.Joshi, N.C.Pandey, B.C.Joshi and Janardan Joshi: J. Non-
Crystalline Solids, 27(1978)173.
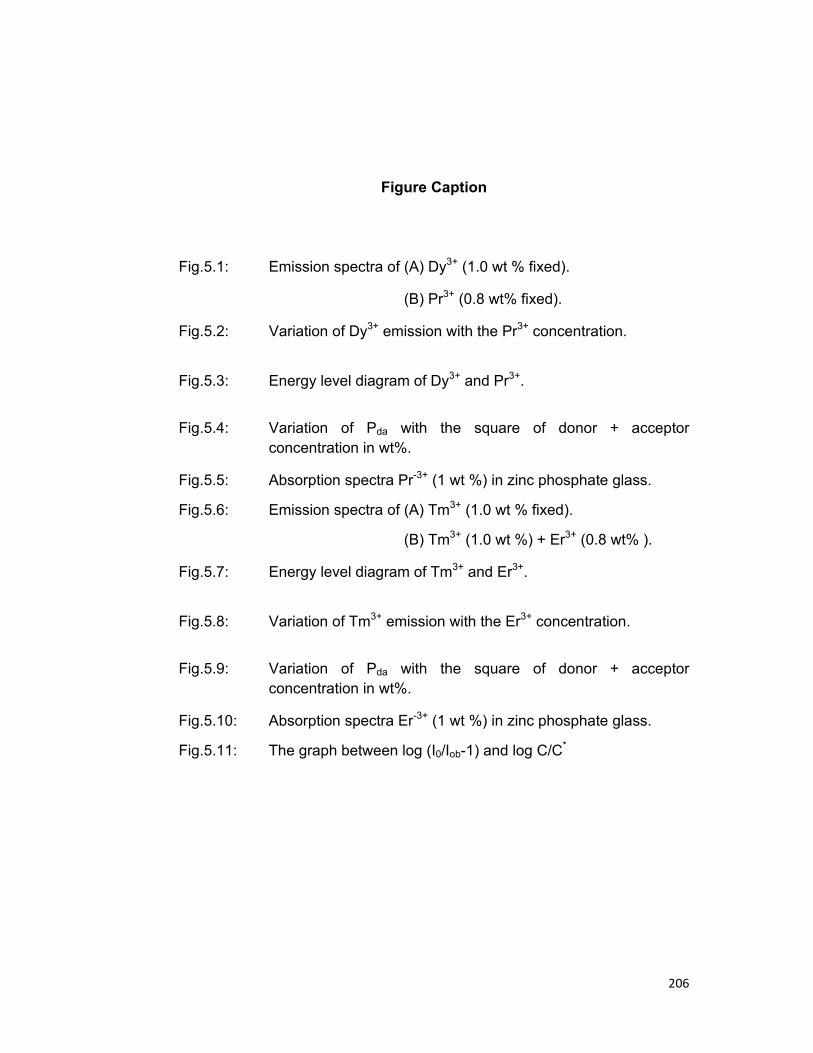
206
Figure Caption
Fig.5.1: Emission spectra of (A) Dy3+ (1.0 wt % fixed).
(B) Pr3+ (0.8 wt% fixed).
Fig.5.2: Variation of Dy3+ emission with the Pr3+ concentration.
Fig.5.3: Energy level diagram of Dy3+ and Pr3+.
Fig.5.4: Variation of Pda with the square of donor + acceptor concentration in wt%.
Fig.5.5: Absorption spectra Pr-3+ (1 wt %) in zinc phosphate glass.
Fig.5.6: Emission spectra of (A) Tm3+ (1.0 wt % fixed).
(B) Tm3+ (1.0 wt %) + Er3+ (0.8 wt% ).
Fig.5.7: Energy level diagram of Tm3+ and Er3+.
Fig.5.8: Variation of Tm3+ emission with the Er3+ concentration.
Fig.5.9: Variation of Pda with the square of donor + acceptor concentration in wt%.
Fig.5.10: Absorption spectra Er-3+ (1 wt %) in zinc phosphate glass.
Fig.5.11: The graph between log (I0/Iob-1) and log C/C*
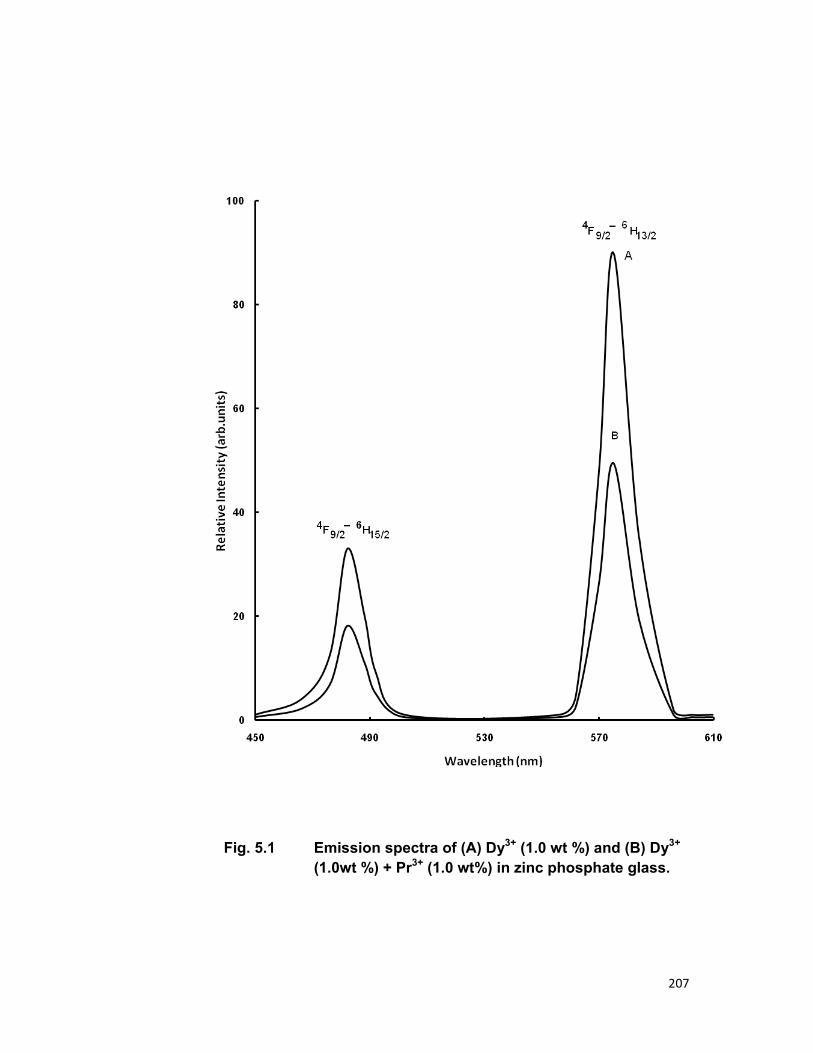
207
Fig. 5.1 Emission spectra of (A) Dy3+ (1.0 wt %) and (B) Dy3+ (1.0wt %) + Pr3+ (1.0 wt%) in zinc phosphate glass.
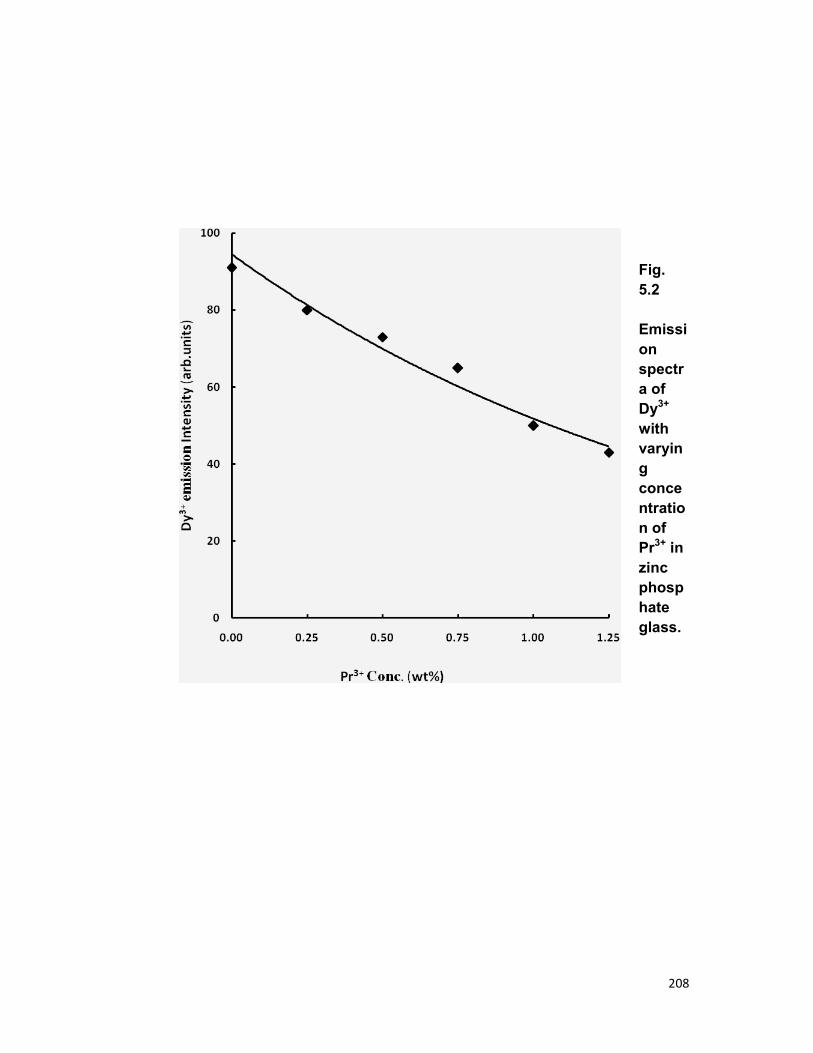
208
Fig. 5.2 Emission spectra of Dy3+ with varying concentration of Pr3+ in zinc phosphate glass.

209
Dy3+ Pr3+
Fig. 5.3 Energy level diagram of Dy3+ and Pr3+.
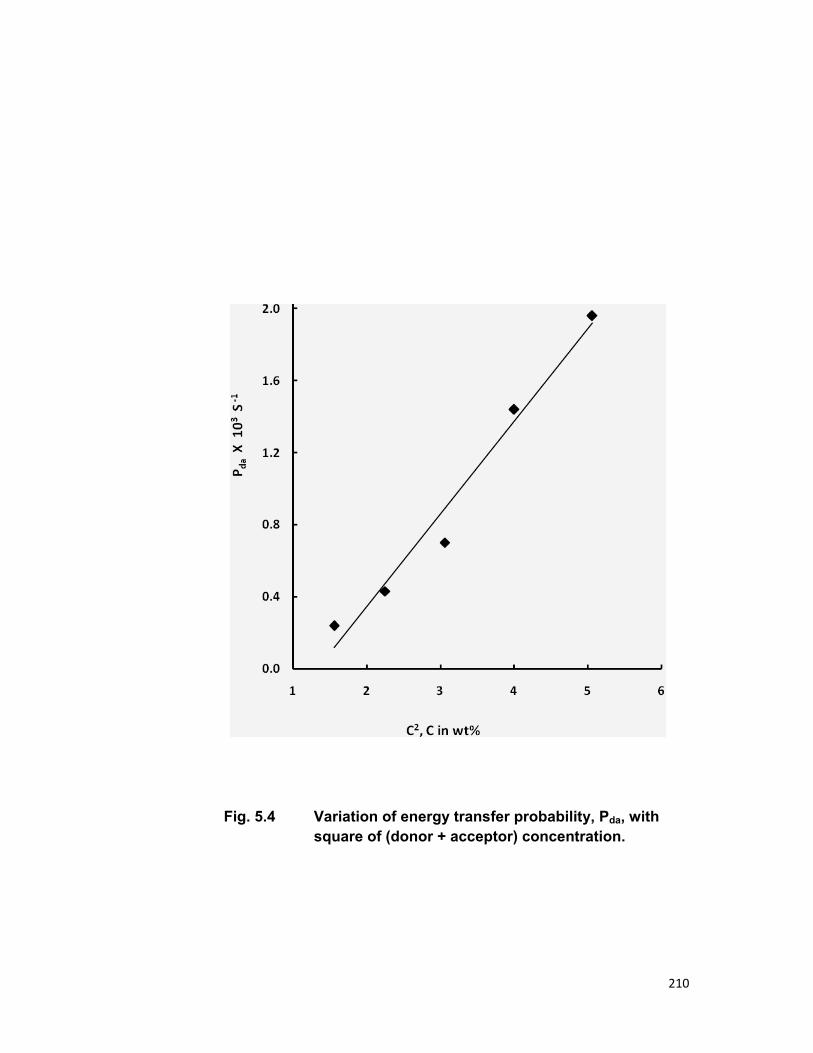
210
Fig. 5.4 Variation of energy transfer probability, Pda, with square of (donor + acceptor) concentration.
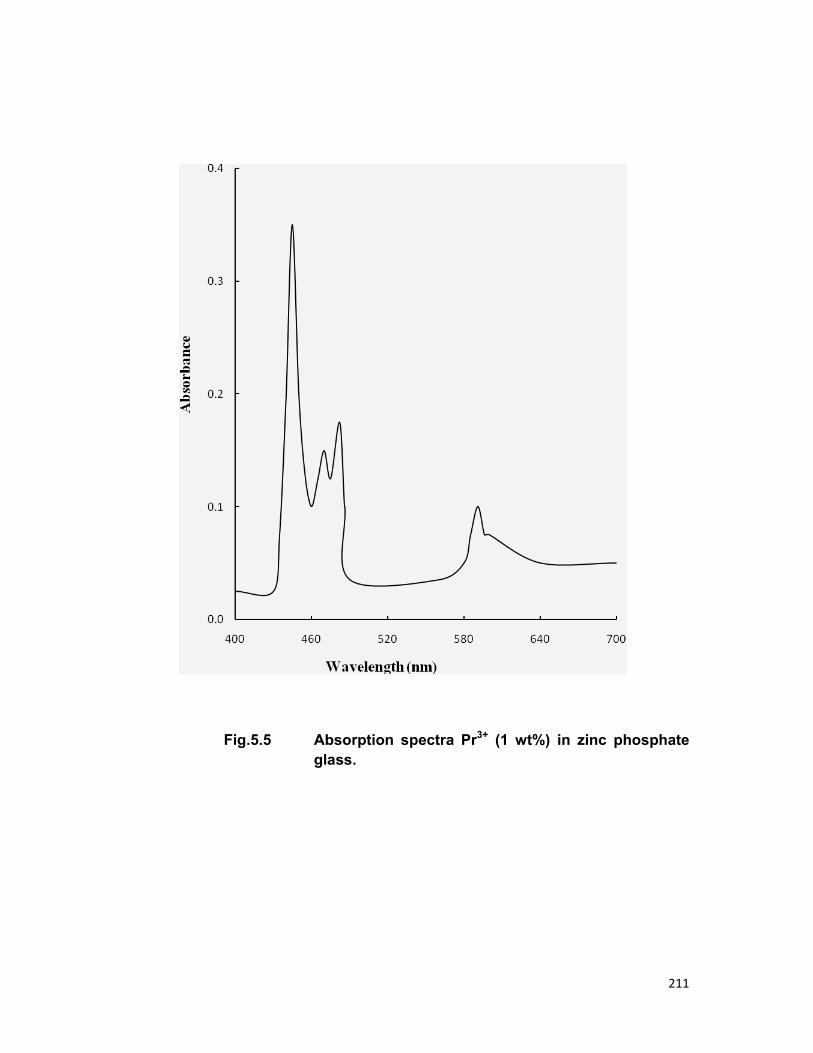
211
Fig.5.5 Absorption spectra Pr3+ (1 wt%) in zinc phosphate glass.

212
Fig.5.6: Emission spectra of (A) Tm3+ (1.0 wt % fixed).
(B) Er3+ (0.8 wt% fixed).
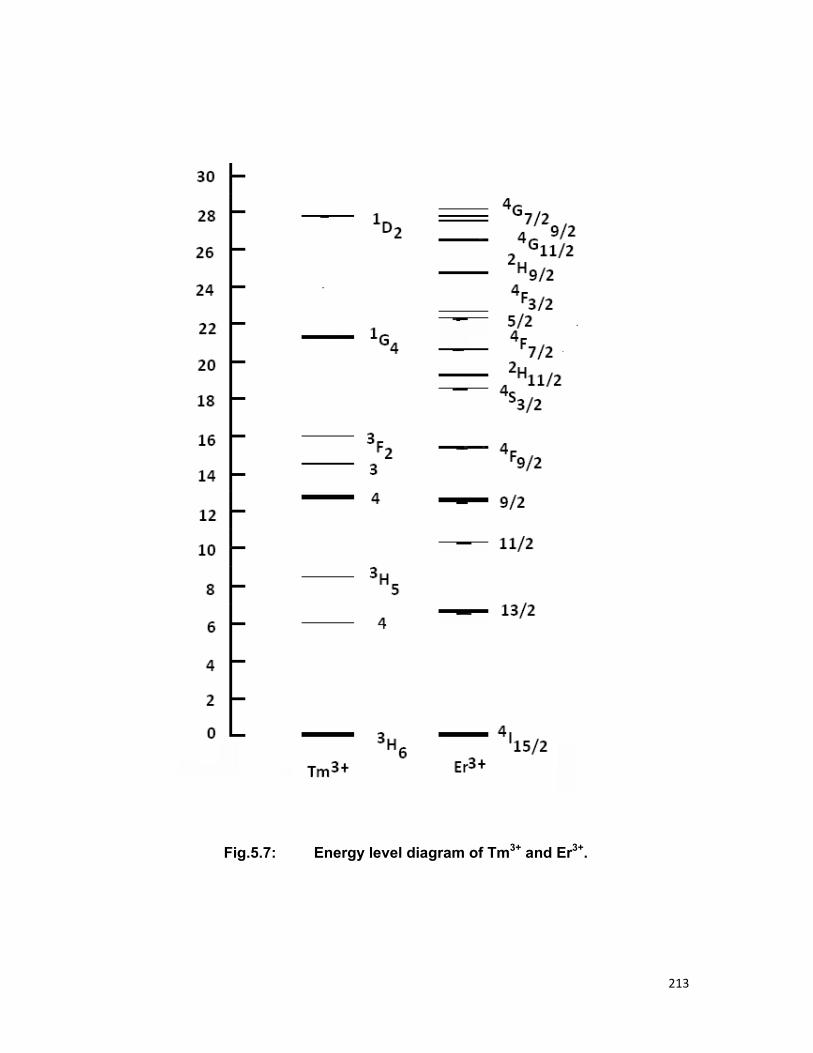
213
Fig.5.7: Energy level diagram of Tm3+ and Er3+.
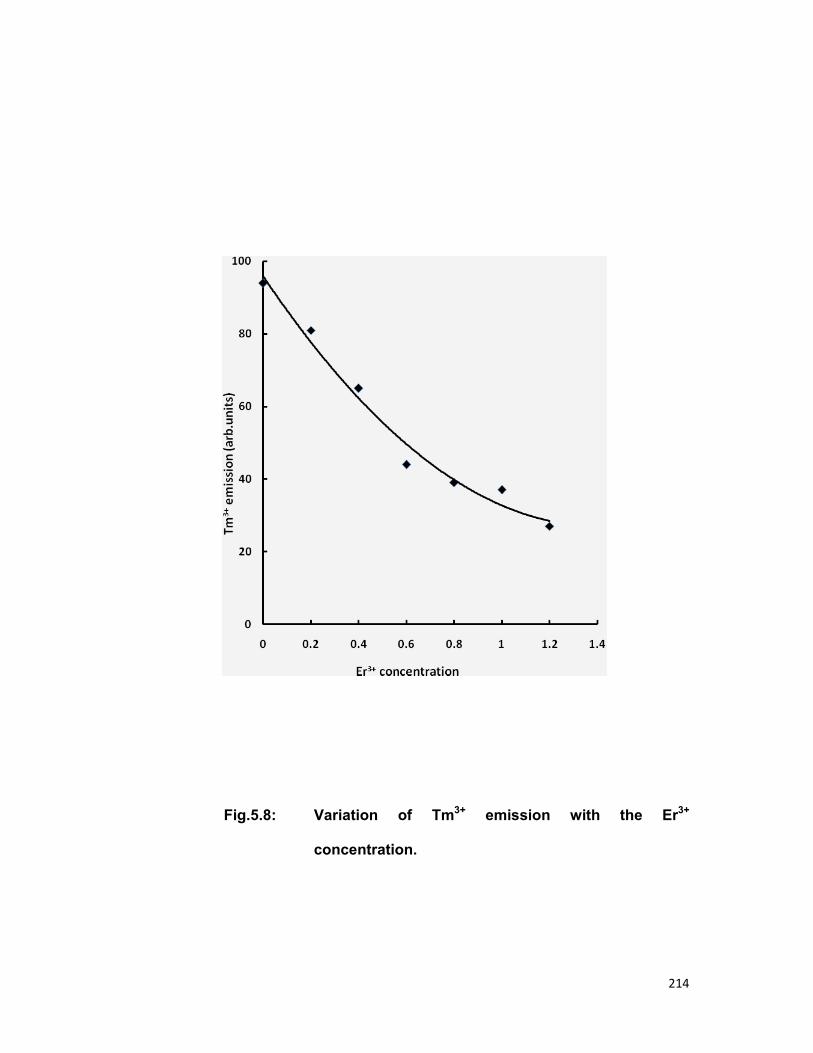
214
Fig.5.8: Variation of Tm3+ emission with the Er3+
concentration.

215
Fig.5.9: Variation of Pda with the square of donor + acceptor concentration in wt%.
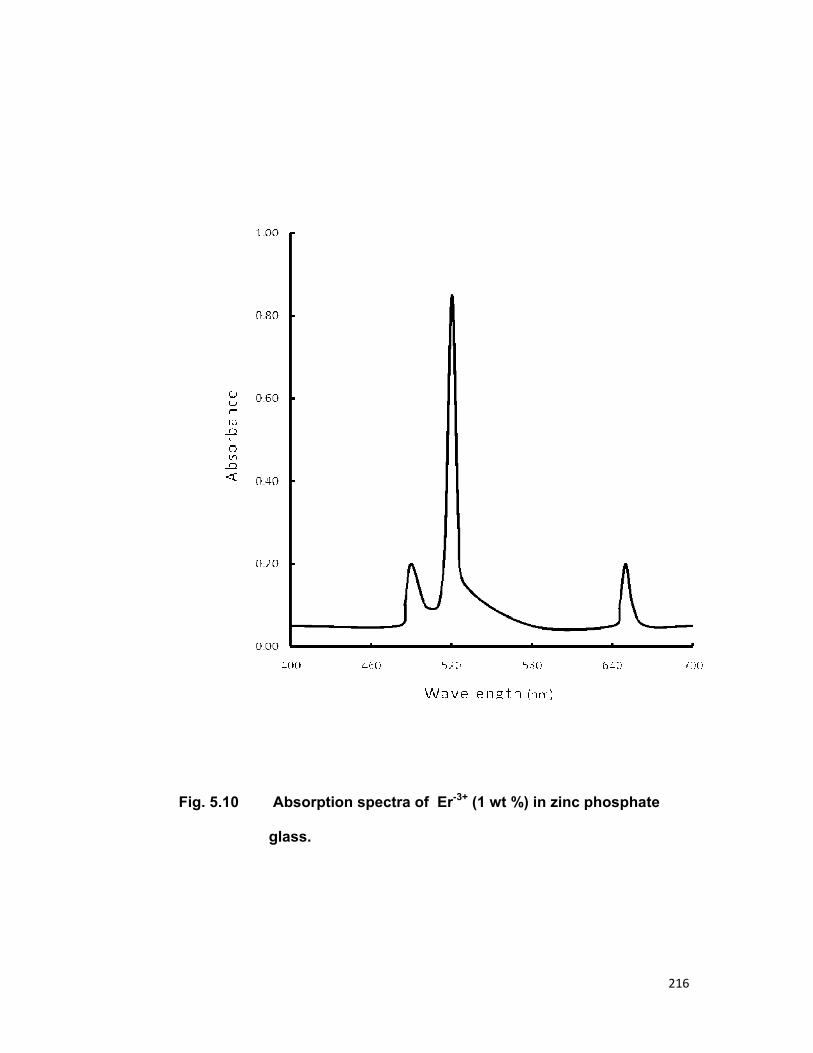
216
Fig. 5.10 Absorption spectra of Er-3+ (1 wt %) in zinc phosphate
glass.
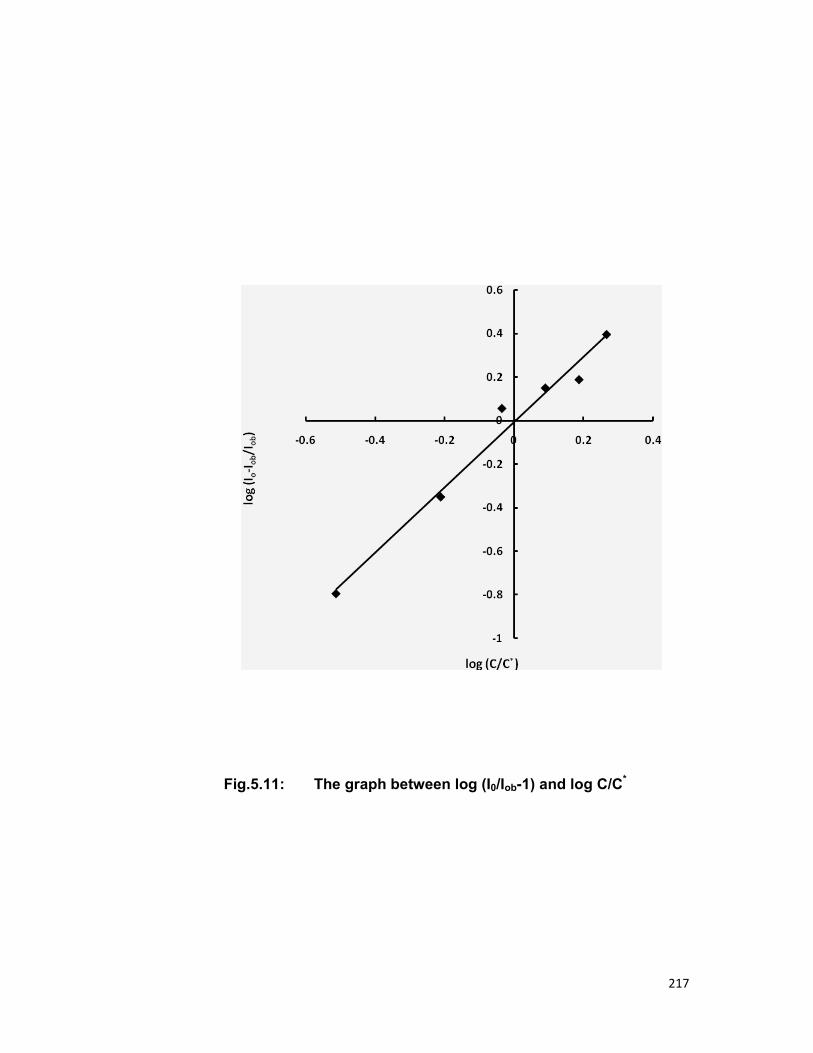
217
Fig.5.11: The graph between log (I0/Iob-1) and log C/C*

218
CHAPTER 6
STUDY OF EMISSION AND ABSORPTION SPECTRA OF SOME
DYES DOPED IN POLYMER AND
STUDY OF PROCESS OF ENERGY
TRANSFER FROM FLUORESCEIN TO ERYTHROSIN-B IN
POLY VINYL ALCOHOL

219
CHAPTER 6
STUDY OF EMISSION AND ABSORPTION SPECTRA OF SOME DYES DOPED IN POLYMER AND STUDY OF
PROCESS OF ENERGY TRANSFER FROM FLUORESCEIN TO ERYTHROSIN-B IN POLY VINYL
ALCOHAL
6.1 INTRODUCTION:
Luminescence is the emission of photons from electronically excited
states. Luminescence is divided into two types, depending upon the nature of the
ground state and excited states. In single excited state, the electron in the higher-
energy orbital has opposite spin orientation as the second electron in lower
orbital. These two electrons are said to be paired. In a triplet state these electrons
are unpaired i.e. there spins have the same orientation. Fluorescence is the
emission which results from the return to the lower orbital of paired electron. Such
transitions are quantum mechanically allowed and these having high emissive
rate with fluorescence lifetimes near 10-8sec or 10nsec. Phosphorescence is the
emission which results from transition between the states of different multiplicity,
generally a triple excited state returning to ground single state. Typical
phosphorescence lifetimes range from millisecond to second.
Recently, fluorescence sensors or optrodes have been found to gain
considerable interest in the direction of various analytes [1-8]. Optrodes have
advantages over conventional device because of their small size (micro sensor
220
can be fabricated), freedom from electrical interference, remote sensing etc.
Basically an optrodes consists of a fluorescent molecule embedded in a support
sensing matrix (polymers, porous glass etc.) deposited at the end of a bifurcated
optical fiber to carry the exciting and emitted radiation. For getting good response,
the support matrix should be such a nature that the fluorescence comes in
contact with the analyte in a very short time.
The xanthenes dyes are probably the most intensely studied class of
luminescent dyes, Interest has been spurred both by the special spectral
characteristics of the dyes and by their wide range of applications. Polymers
appropriately doped with dye molecule, emitting in the visible spectrum provide
stable sources of light for displays and illumination sources at a significantly lower
cost than semiconductor. Organic light emitting diodes may indeed evolve as the
most inexpensive alternatives to fluorescent light sources. Polymer fibers doped
with organic dyes have proved to be potential candidate for use in fiber lasers and
fiber amplifiers media of holographic recording and permanent optical memory,
solar energy converters etc. [9, 10].
One of the most known polymeric matrices for holographic recording is
poly vinyl alcohol (PVA), which is water soluble polymer that undergoes
crosslinking. The polymer is found with different molecular weights, which
determine its optical properties.
6.2 EXPERIMENTAL DETAILS AND MATERIALS:
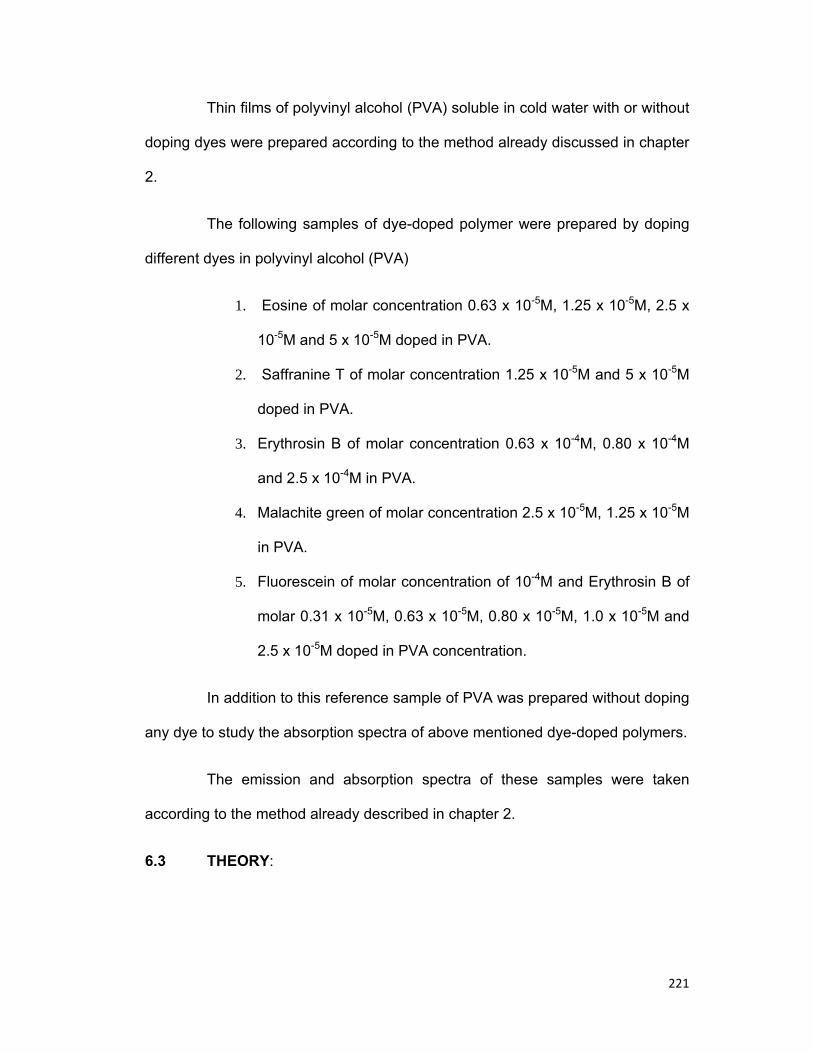
221
Thin films of polyvinyl alcohol (PVA) soluble in cold water with or without
doping dyes were prepared according to the method already discussed in chapter
2.
The following samples of dye-doped polymer were prepared by doping
different dyes in polyvinyl alcohol (PVA)
1. Eosine of molar concentration 0.63 x 10⁻⁵M, 1.25 x 10⁻⁵M, 2.5 x
10-5M and 5 x 10⁻⁵M doped in PVA.
2. Saffranine T of molar concentration 1.25 x 10⁻⁵M and 5 x 10⁻⁵M
doped in PVA.
3. Erythrosin B of molar concentration 0.63 x 10⁻⁴M, 0.80 x 10⁻⁴M
and 2.5 x 10⁻⁴M in PVA.
4. Malachite green of molar concentration 2.5 x 10⁻⁵M, 1.25 x 10⁻⁵M
in PVA.
5. Fluorescein of molar concentration of 10-4M and Erythrosin B of
molar 0.31 x 10⁻⁵M, 0.63 x 10⁻⁵M, 0.80 x 10⁻⁵M, 1.0 x 10⁻⁵M and
2.5 x 10⁻⁵M doped in PVA concentration.
In addition to this reference sample of PVA was prepared without doping
any dye to study the absorption spectra of above mentioned dye-doped polymers.
The emission and absorption spectra of these samples were taken
according to the method already described in chapter 2.
6.3 THEORY:
222
The absorption and emission spectra of dye molecules show broad bands
in UV/VIS region. The molar absorptivity at a given energy is computed from the
Beer-Lambert law
ε=1/cl (log I0/I) (6.1)
where c is the molar concentration of the absorbing ion per unit volume, l is the
path length and log (I0/I) is the absorptivity or optical density .
The intensities of absorption transitions are measured in terms of Pexp
which represents the number of classical oscillators present in one ion, more
commonly referred to as the probability for absorption of radiant energy or
oscillator strength. In the case of absorption band, it is given [11] by
Pexp=fnHK
nn max
2217
)2(1031.1
+× (6.2)
where ε max is oscillator strength, n is refractive index of medium (for calculation;
n is taken as 1.50 for PVA [12], fn is conc. of ion / cm3, maxK is absorption
coefficient in cm-1 at the peak and H is half width of the band in eV.
Excitation by light may initiate both intramolecular and intermolecular
transformation of a molecule. The most conspicuous intermolecular events are
electron, proton and energy transfer [13]. Fluorescence resonance energy
transfer (FRET) is a photophysical process and occur via intermolecular energy
transfer mechanism where energy that is absorbed by fluorescent molecule
(donor) is transferred non-radiatively to second fluorescent molecule (acceptor).
Forster energy transfer occurs for the very weak range of dipole-dipole interaction
energies (10-1-101 cm-1) and has a rate range of 106-1011 S-1. Forster [13] was the
223
first to consider theoretically the long range dipole-dipole interaction between two
dissimilar molecules leading to non-radiative transfer from initially excited (donor)
to an unexcited (acceptor). According to Forster’s theory, the rate of energy
transfer depends upon the following factors [1, 14-15]
1. The extent of spectral overlap between donor emission and acceptor
absorption.
2. The quantum yield of the donor ( Dφ ).
3. The relative orientation of the donor and acceptor transition dipoles. And
4. The distance between the donor and acceptor transition dipole.
Forster showed that the rate of energy transfer between donor (D) and
acceptor (A) is
6
12
23
⎟⎠⎞
⎜⎝⎛= −
RR
Kk OADDA τ (6.3)
where R is the distance between donor and acceptor, K2 is the orientation factor
(for random orientation K2 is 2/3), Dτ is the donor decay time in the absence of
the acceptor and ROA is the critical transfer distance.
The critical transfer distance ROA [16-18]is given by
4
256
)()1086.5(
nR DDA
OAΦΩ×
=−
(6.4)
where DAΩ is the overlap integral for overlapping fluorescence spectra
of donor, DΦ is quantum yield of standard donor, n is refractive index of medium.
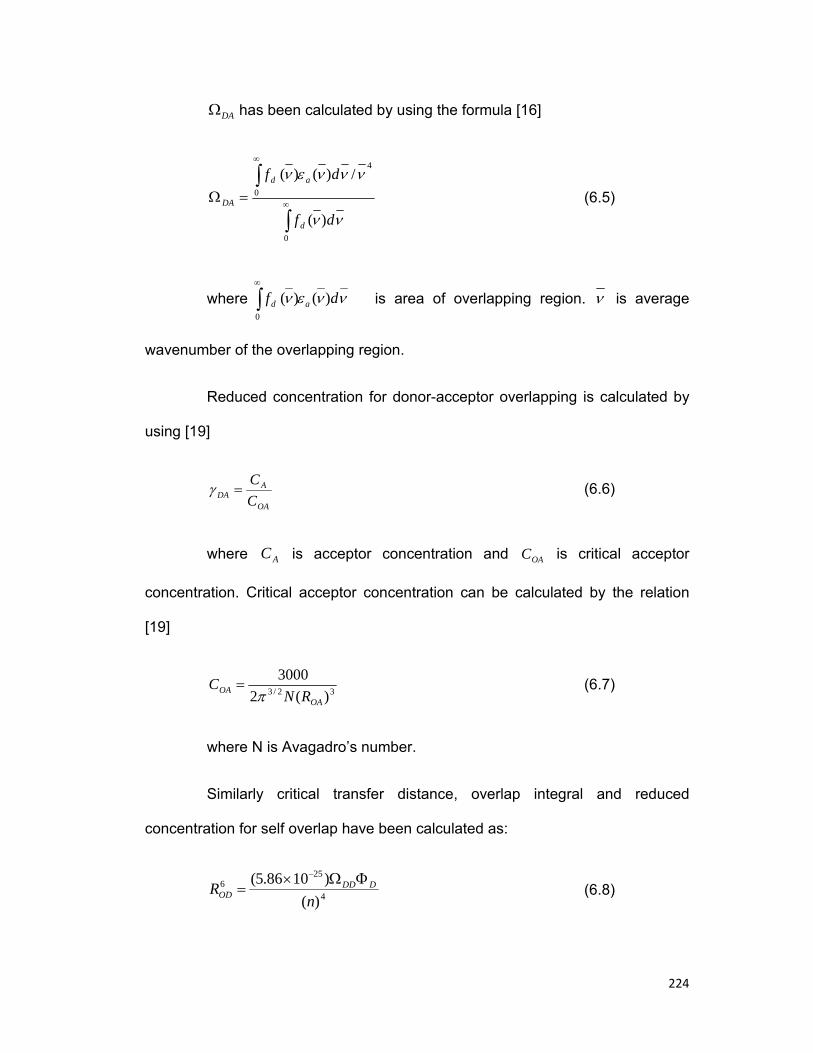
224
DAΩ has been calculated by using the formula [16]
νν
νννεν
df
df
d
ad
DA
)(
/)()(
0
4
0
∫
∫∞
∞
=Ω (6.5)
where ννεν df ad )()(0∫∞
is area of overlapping region. ν is average
wavenumber of the overlapping region.
Reduced concentration for donor-acceptor overlapping is calculated by
using [19]
OA
ADA C
C=γ (6.6)
where AC is acceptor concentration and OAC is critical acceptor
concentration. Critical acceptor concentration can be calculated by the relation
[19]
32/3 )(23000
OAOA RN
Cπ
= (6.7)
where N is Avagadro’s number.
Similarly critical transfer distance, overlap integral and reduced
concentration for self overlap have been calculated as:
4
256
)()1086.5(
nR DDD
ODΦΩ×
=−
(6.8)

225
νν
νννεν
df
df
d
Dd
DD
)(
/)()(
0
4
0
∫
∫∞
∞
=Ω (6.9)
OD
DDD C
C=γ (6.10)
6.4 MOLECULAR STRUCTURE OF DYES:
Fluorescein
Erythrosin B

226
Eosine
Malachite green
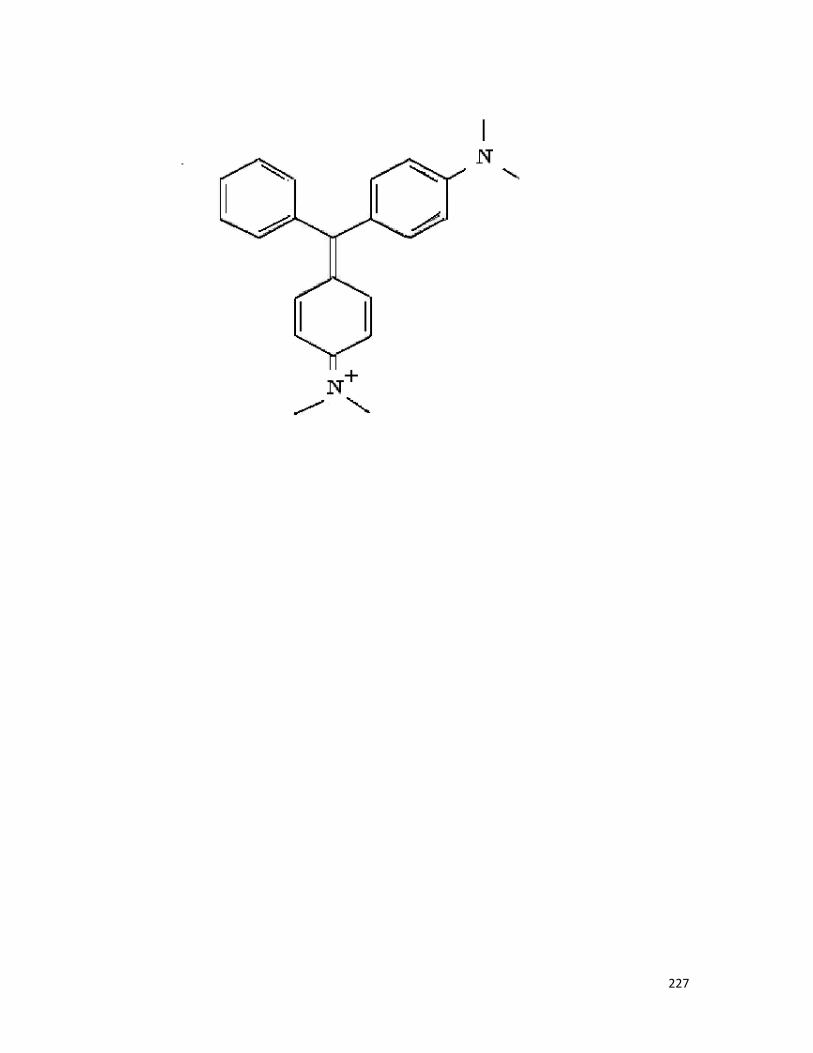
227

228
6.5 RESULTS AND DISCUSSION:
6.5.1 Emission and absorption spectra of different dyes doped in
polymers.
6.5.1(A) Saffranine T doped in polyvinyl alcohol: The emission and absorption
spectra of saffranine T (molar conc.= 5.0 x 10⁻⁵ M) is shown in Fig. 6.1 and Fig.
6.2. When excited by 500 nm wavelength saffranine T shows the peak at 562 nm
while the same sample shows absorption peak at 537 nm. Fig. 6.3 and Fig. 6.4
shows the emission and absorption spectra of saffranine T with two different
molar conc.. It shows a slight shift in maximum emission peak with concentration.
6.5.1(B) Erythrosin B doped in polyvinyl alcohol: The emission and absorption
spectra of erythrosin B (molar conc. = 2.5 x 10⁻⁴ M) is shown in Fig. 6.5 and Fig.
6.6. When excited by 535 nm wavelength erythrosin B shows the peak at 566 nm
while the same sample shows absorption peak at 531 nm. Fig. 6.7 and Fig. 6.8
show the emission and absorption spectra of erythrosin B with two different molar
concentrations. It shows a slight shift in maximum emission peak with
concentration.
6.5.1(C) Eosine doped in polyvinyl alcohol: The emission and absorption
spectra of eosine (molar conc. = 5 x 10⁻⁴ M) is shown in Fig. 6.9 and Fig. 6.10.
Fig. 6.11 shows the emission spectrum for different excitation, which gives
maximum emission intensity for the 470 nm excitation. When the eosine (molar
conc. = 5 x 10⁻⁴ M) is excited by 470nm wavelength of radiation, it shows the
emission peak at 546 nm. Fig. 6.12 and Fig. 6.13 show the emission and
229
absorption spectra of eosine with different molar concentration. It shows a slight
shift in maximum emission peak with concentration. The sample shows
absorption peak at 519 nm.
6.5.1(D) Malachite green doped in polyvinyl alcohol: The excitation spectra of
malachite green (molar conc. = 2.5x10⁻⁵ M) is shown in Fig.6.14. The emission
spectrum of the malachite green (molar conc. = 2.5x10⁻⁵ M) for different excitation
is shown in Fig.6.15, which shows that the emission intensity is maximum for the
excitation wavelength 590 nm. The sample shows the emission peak at 656 nm
when excited by wavelength 590 nm and the absorption peak comes out at
630nm. The emission spectra of malachite green for two different molar
concentrations are shown in Fig. 6.16.
6.5.2 Study of energy transfer from fluorescein to erythrosin B in Poly
vinyl alcohol (PVA).
The fluorescein is taken as donor and erythrosin B as acceptor. These
two are taken as so because the extent of overlap between the fluorescence
spectra of fluorescein and absorption spectra of erythrosin B have large zone.
The quantum yield ( Dφ ) of fluorescein is 0.91[20]. The orientation of donor and
acceptor transitions dipole in PVA is assumed random. So orientation factor is
taken 2/3.
Fig.6.24 represents the emission spectra of fluorescein and erythrosin B
in which the fluorescein concentration (10-4 M) is kept fixed while the erythrosin
concentration is varied from 0.31 x 10⁻⁵ M to 2.50 x 10⁻⁵M. Fig.6.24 (A) represent
the fluorescein (10-4M) emission, it shows emission peaks at 522 nm when
230
excited by 450 nm of visible radiation. Erythrosin B is also excited by 450 nm of
radiation and it shows emission peaks at 570 nm which is shown in Fig.6.24 (G).
Fig.6.24 [B, C, D, E, F] shows emission spectra of fluorescein in presence of
erythrosin B concentration varied from 0.31 x 10⁻⁵ M to 2.50 x 10⁻⁵M. From the
emission spectrum it is observed that the fluorescein emission intensity is
continuously decreases as erythrosin B concentration increases. So there is non-
radiative energy transfer energy transfer from fluorescein to erythrosin B. The
shift in emission peak of fluorescein is observed from 522 nm to 512 nm, while
the shift in emission peak of erythrosin B is observed from 566 nm to 550 nm. The
relative emission of fluorescein-erythrosin B series in PVA, when excited by 450
nm of visible radiation is presented in table 6.3. There is shift of fluorescein
(donor) emission peak to the shorter wavelength with increase concentration of
erythrosin B (acceptor), so the energy transfer appears as radiative also.
Different parameters such as overlap integral, critical concentration and
reduce concentration are calculated for the fluorescein- erythrosin B and are
presented in table 6.4.
6.6 CONCLUDING REMARKS:
In this chapter the study of emission and absorption spectra and energy
transfer in dye-dye system have been made. Saffranin T, Erythrosin B, Eosine
and malachite green doped in PVA have been used for the study of absorption
and emission spectra. Various parameters from emission and absorption spectra
have been computed. The energy transfer from fluorescein to erythrosin B have
been studied from the measurement of steady state emission. Overlap integral,

231
reduce concentration and critical transfer distances is calculated for the
fluorescein- erythrosin B series in PVA.
Table 6.1: Spectroscopic parameters of investigated dyes in PVA from
absorption spectra of single dye doped in PVA.
Dye Molar con. (λmax) ( ν∆ )1/2 maxε
(M) (nm) (nm) (lM-1cm-1)
Saffranine T 5 x 10⁻⁵ 539 58 1.18x10⁶
1.25 x 10⁻⁵ 539 52 1.18 x10⁶
Erythrosin B 2.5 x 10⁻⁵ 531 32 1.03 x10⁵
0.8 x 10⁻⁵ 538 30 0.84 x10⁵
0.63 x 10⁻⁵ 538 29 0.57 x10⁵
Eosine 5 x 10⁻⁴ 519 34 1.29 x10⁵
2.5 x 10⁻⁴ 519 34 1.75 x10⁵
1.25 x 10⁻⁴ 519 30 1.94 x10⁵
Malachite green 5 x 10⁻⁵ 630 54 0.08 x10⁶
1.25 x 10⁻⁵ 630 62 0.23 x10⁶

232

233
Table 6.2: Spectroscopic parameters of investigated dyes in PVA from
emission spectra of single dye doped in PVA.
Dye Molar con. (λexc.) (λmax) ν ( ν∆ )1/2 stoke shift
(M) (nm) (nm) (cm-1) (nm) (cm-1)
Saffrine T 5 x 10⁻⁵M 500 562 17790 33 759.28
Erythrosin B 2.5 x 10⁻⁴M 535 566 17670 32 1164.55
0.8 x 10⁻⁴M 535 560 17860 15 730.22
0.63 x 10⁻⁴M 535 560 17860 25 730.22
Eosine 5 x 10⁻⁴M 470 542 18450 47 817.64
2.5 x 10⁻⁴M 470 548 18590 47 1019.65
1.25 x 10⁻⁴M 470 532 18800 44 470.83
Malachite green
5 x 10⁻⁵M 590 660 15150 50 721.50
1.25 x 10⁻⁵M 590 656 15240 54 629.11

234
Table6.3: Relative emission intensity of fluorescein and erythrosin B in
fluorescein- erythrosin series in PVA, when excited by 450 nm of
visible radiation.
Donor Conc. (M/l) Acceptor Conc. (M/l) Emission Peaks Emission
Intensity (Fluorescein) (Erythrosin B) (nm) (arb.units)
10-4 ------------ 522, ---- 3876, -----
10-4 0.31 x 10⁻⁵ 516, 550 3201, 2511
10-4 0.63 x 10⁻⁵ 514, 554 2698, 2550
10-4 0.80 x 10⁻⁵ 514, 556 2494, 2573
10-4 1.00 x 10⁻⁵ 514, 562 2404, 2628
10-4 1.25 x 10⁻⁵ 512, 566 2264, 2686
----- 2.50 x 10⁻⁵ ---, 566 ------, 2194

235
Table6.4: Calculated values of spectroscopic parameter for fluorescein
-erythrocene B system in PVA.
Host Polymers Molar Conc. DAΩ OAR OAγ
(M/l) (10-13 cm6 M-1)(nm) (10-3)
PVA 0.31 x 10⁻⁴ 27.97 8.15 37.59
0.63 x 10⁻⁴ 38.38 8.59 89.45
0.80 x 10⁻⁴ 50.26 8.99 130.04
1.00 x 10⁻⁴ 58.73 9.23 175.72
2.50 x 10⁻⁴ 66.72 9.42 468.24
236
BIBLIOGRAPHY
1. J. R. Lokowicz (Ed.): Topic in fluorescence spectroscopy, Probe Design
and Chemical Sensor, Vol. 4, Plenum Press, New York (1996).
2. V. Mishra, H.Mishra, H.C. Pant and T. C. Pant: Sensors and Actuators B
Chem., 63 (2000) 18.
3. T. Warner, O.S. Wolfbeis and Fresenius: J. Anal. Chem., 346 (1993) 564.
4. V. Mishra, H.Mishra, H.C. Pant and T. C. Pant: Sensors and Actuators B
Chem., 82 (2002) 133.
5. O. S. Wolfbeis (Ed.): Fiber optic Chemical Sensors and
Biosensors, Vol. 1/2, CRC Press, Boca Raton, Boston, London (1991).
6. H. Offenbacher, O.S.Wolfbeis and E.Furlinger: Sensors
and Actuators B Chem., 9(1983)73.
7. J.I.Peterson, S.R.Goldstein, R.V. Fitzgerald and
D.K.Buckhold: Anl.Chem., 52(1980)864.
8. L.Tolose, H.Malak, G.Rao and J.R.Lakowicz: Sensors and
Actuators B Chem.,45(1993)1674.
9. X.Z.Jiang: Appl.Phys.Lett. , 76 (2000) 2985.
10. B.Carlson: J.An.Chem.Soc, 124 (2002) 14162.
11. K.K.Pandey: Chem.Phys.,165(1992)123.
12. R.Kumar, A.P.Singh and A.Kapoor and
K.N.Tripathi:43(2004)2134.
13. Th. Forster: Ann. Phys., 2 (1948) 55.

237
14. N. J. Turro: Modern Molecular Photochemistry, Benjamin / Cummings,
Menlo Park, CA (1978).
15. K. K. Rohatgi Mukherjee: Fundamentals of photochemistry, Wieley
Estern, New Delhi (1986).
16. K.K.Pandey and T.C.Pant: Chem.Phys.Lett.,170(1991)319.
17. J.B.Birks: Wiley interscience, NewYork, 1970.
18. V.Mishra, H.Mishra, H.C.Joshi, T.C.Pant: 63(2000) 18.
19. K.K.Pandey and T.C.Pant: Chem.Phys.Lett.,170(1990)244.
20. Sujan Chatterjee, Susantamay Nandi and Subhash Chandra Bhattacharya:
J. Photochemistry and Photobiology A Chemistry, 173 (2005) 221.
238
FIGURE CAPTION
Fig 6.1: Emission spectra of Saffranine T (5 x 10⁻⁵M) in PVA.
Fig 6.2: Absorption spectra of Saffranine T (5 x 10⁻⁵M) in PVA.
Fig 6.3: Emission spectra of A)Saffranine T (5 x 10⁻⁵M) ,B)Saffranine T
(1.25 x 10⁻⁵M) in PVA.
Fig 6.4: Absorption spectra of A)Saffranine T (5 x 10⁻⁵M), B)Saffranine
T (1.25 x 10⁻⁵M) in PVA.
Fig 6.5: Emission spectra of Erythrosin B (2.5 x 10⁻⁴M) in PVA.
Fig 6.6: Absorption spectra of Erythrosin B (2.5 x 10⁻⁴M) in PVA.
Fig 6.7: Emission spectra of Erythrosin B A) 2.5 x 10⁻⁴M,
B) 0.80 x 10⁻⁴M, C) 0.63 x 10⁻⁴M in PVA.
Fig 6.8: Absorption spectra of Erythrosin B A) 2.5 x 10⁻⁴M,
B) 0.80 x 10⁻⁴M,C) 0.63 x 10⁻⁴M in PVA.
Fig 6.9: Emission spectra of Eosine (5 x 10⁻⁴M) in PVA.
Fig 6.10: Absorption spectra of Eosine (5 x 10⁻⁴M) in PVA.
Fig 6.11: Emission spectra of Eosine (5 x 10⁻⁴M) for different excitation
wavelength in PVA.
Fig 6.12: Emission spectra of Eosine A) 5 x 10⁻⁴M, B) 2. 5 x 10⁻⁴M,
C) 1.25 x 10⁻⁴M in PVA.
Fig 6.13: Absorption spectra of Eosine A) 5 x 10⁻⁴M, B) 2. 5 x 10⁻⁴M,
C) 1.25 x 10⁻⁴M in PVA.
Fig 6.14: Excitation spectra of Malachite green (1. 2 5 x 10⁻⁴M) in PVA.
Fig.6.15: Emission spectra of Malachite green (1.25 x 10⁻⁴M) in PVA.
239
(A) λ excitation-590 nm
(B) λ excitation-580 nm
(C) λ excitation-560 nm
Fig 6.16: Emission spectra of Malachite green A) 5 x 10⁻⁴M, B) 1.25 x
10-4M in PVA.
Fig 6.17: Emission spectra of Fluorescein (5 x 10⁻⁴M) in PVA.
Fig 6.18: Absorption spectra of Fluorescein (5 x 10⁻⁴M) in PVA.
Fig 6.19: Overlap between Fluorescein (10-4M) and Erythrosin B (2.5 x
10-5M) in PVA.
Fig 6.20: Overlap between Fluorescein (10-4M) and Erythrosin B (1.0 x
10-5M) in PVA.
Fig 6.21: Overlap between Fluorescein (10-4M) and Erythrosin B (0.80
x 10-4M) in PVA.
Fig 6.22: Overlap between Fluorescein (10-4M) and Erythrosin B
(0.63 x 10⁻⁵M) in PVA.
Fig 6.23: Overlap between Fluorescein (10-4M) and Erythrosin B
(0.31 x 10⁻⁵M) in PVA.
Fig 6.24: Variation of fluorescence intensities of fluorescein (donor)-
erythrosin B (acceptor) system in PVA at fluorescein
concentration (A) 10 different erythrosin B concentration (B) 0.31
x 10-5M (C) 0.63 x 10⁻⁵M (D) 0.80 x 10⁻⁵M (E) 1.00 x 10⁻⁵M (F)
1.25 x 10⁻⁵M (G) 2.5 x 10⁻⁵M (Alone)

240
Fig 6.1: Emission spectra of Saffranine T (5 x 10⁻⁵M).
Fig 6.2: Absorption spectra of Saffranine T (5 x 10⁻⁵M).
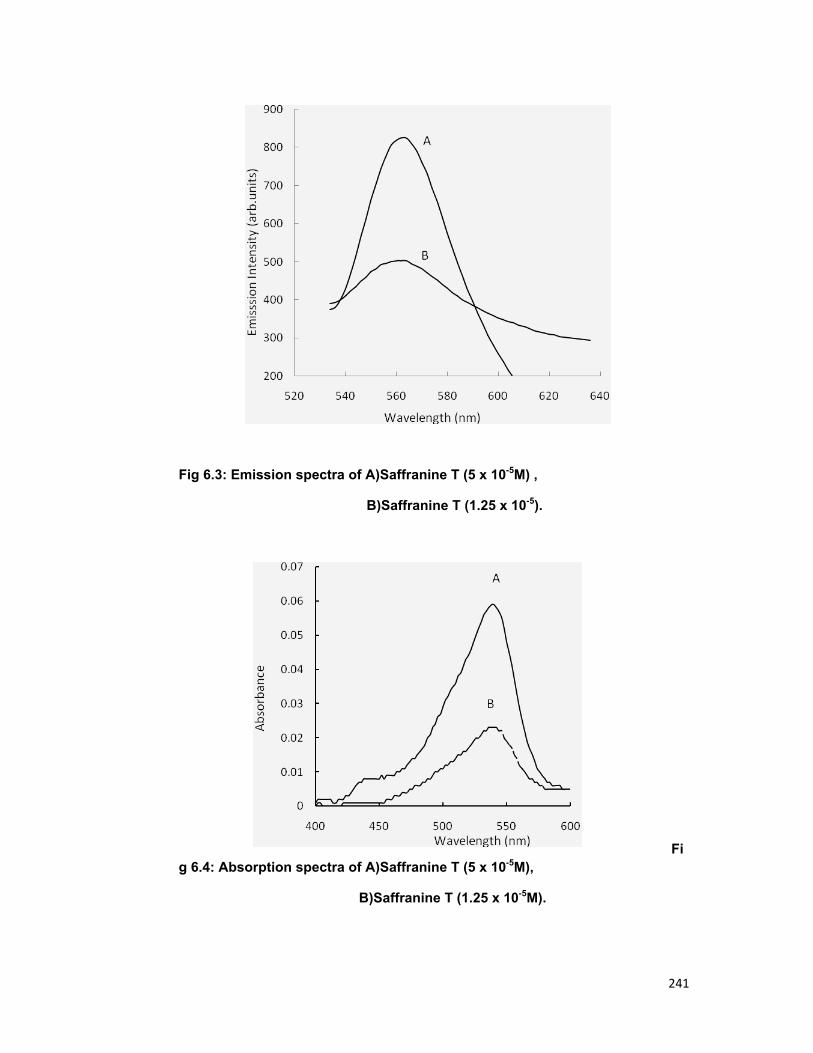
241
Fig 6.3: Emission spectra of A)Saffranine T (5 x 10⁻⁵M) ,
B)Saffranine T (1.25 x 10⁻⁵).
Fig 6.4: Absorption spectra of A)Saffranine T (5 x 10⁻⁵M),
B)Saffranine T (1.25 x 10⁻⁵M).
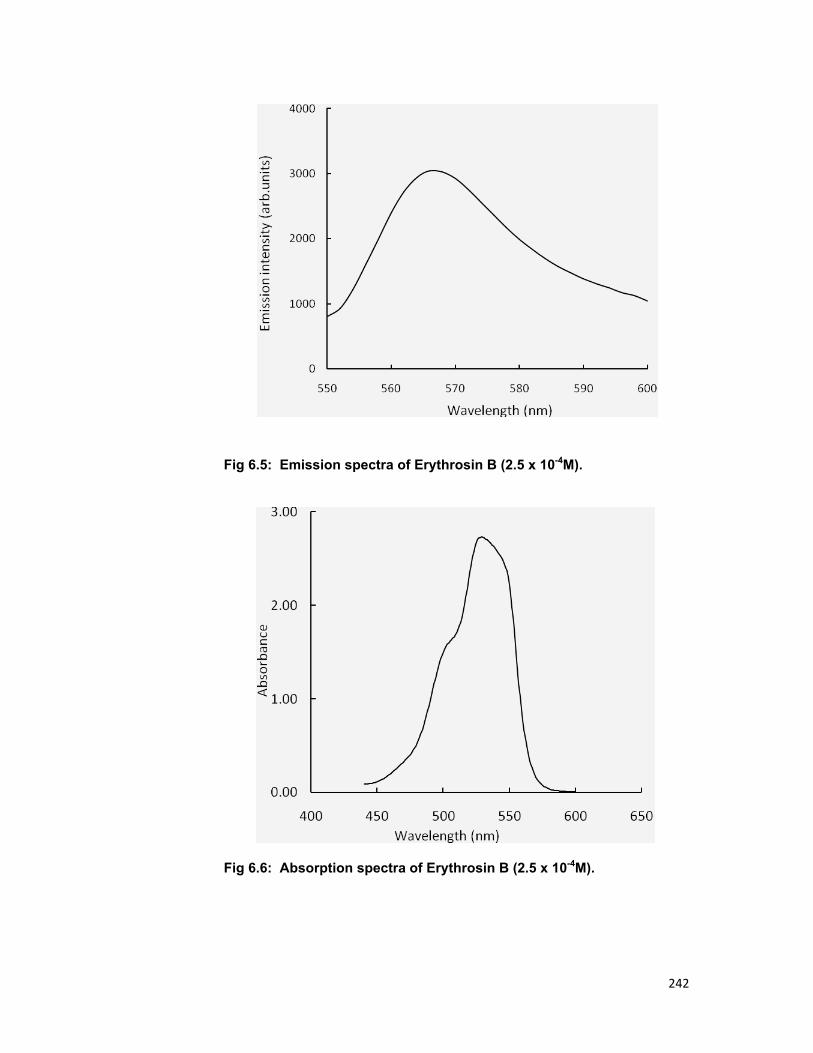
242
Fig 6.5: Emission spectra of Erythrosin B (2.5 x 10⁻⁴M).
Fig 6.6: Absorption spectra of Erythrosin B (2.5 x 10⁻⁴M).
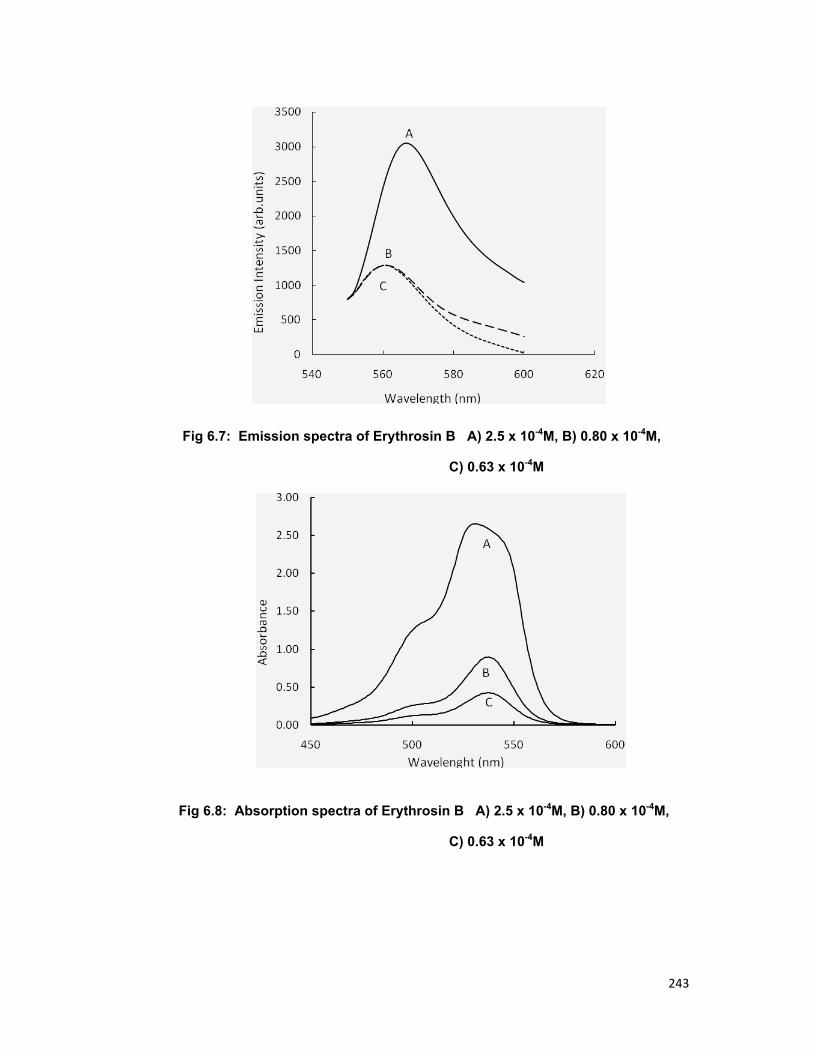
243
Fig 6.7: Emission spectra of Erythrosin B A) 2.5 x 10⁻⁴M, B) 0.80 x 10⁻⁴M,
C) 0.63 x 10⁻⁴M
Fig 6.8: Absorption spectra of Erythrosin B A) 2.5 x 10⁻⁴M, B) 0.80 x 10⁻⁴M,
C) 0.63 x 10⁻⁴M
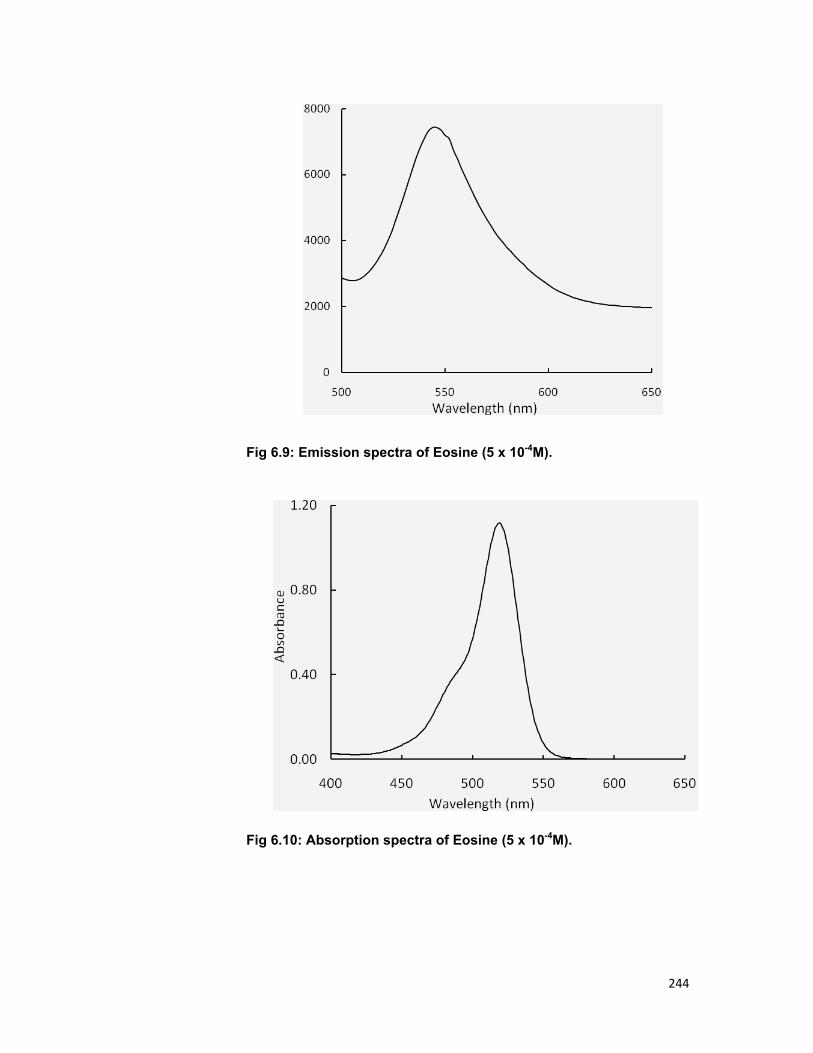
244
Fig 6.9: Emission spectra of Eosine (5 x 10⁻⁴M).
Fig 6.10: Absorption spectra of Eosine (5 x 10⁻⁴M).
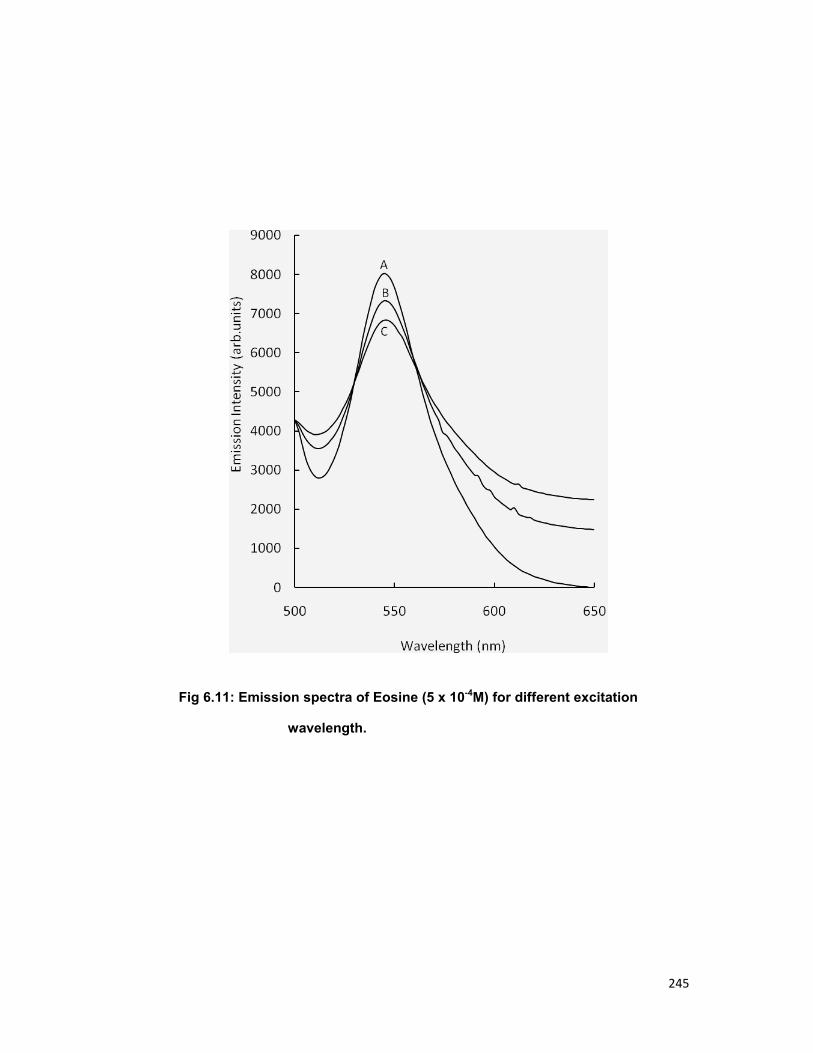
245
Fig 6.11: Emission spectra of Eosine (5 x 10⁻⁴M) for different excitation
wavelength.
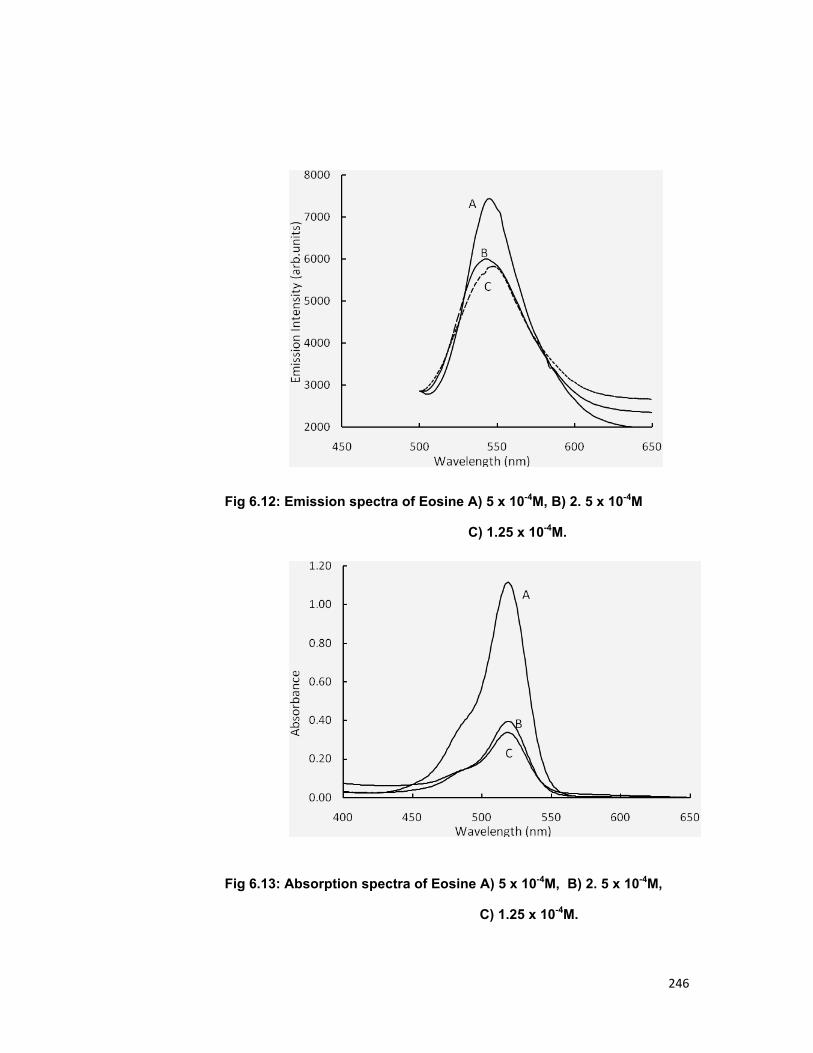
246
Fig 6.12: Emission spectra of Eosine A) 5 x 10⁻⁴M, B) 2. 5 x 10⁻⁴M
C) 1.25 x 10⁻⁴M.
Fig 6.13: Absorption spectra of Eosine A) 5 x 10⁻⁴M, B) 2. 5 x 10⁻⁴M,
C) 1.25 x 10⁻⁴M.

247
Fig 6.14: Excitation spectra of Malachite green (1. 2 5 x 10⁻⁴M) for λemission=500nm.

248
Fig.6.15: Emission spectra of Malachite green (1.25 x 10⁻⁴M)
(D) λ excitation-590 nm (E) λ excitation-580 nm (F) λ excitation-560 nm
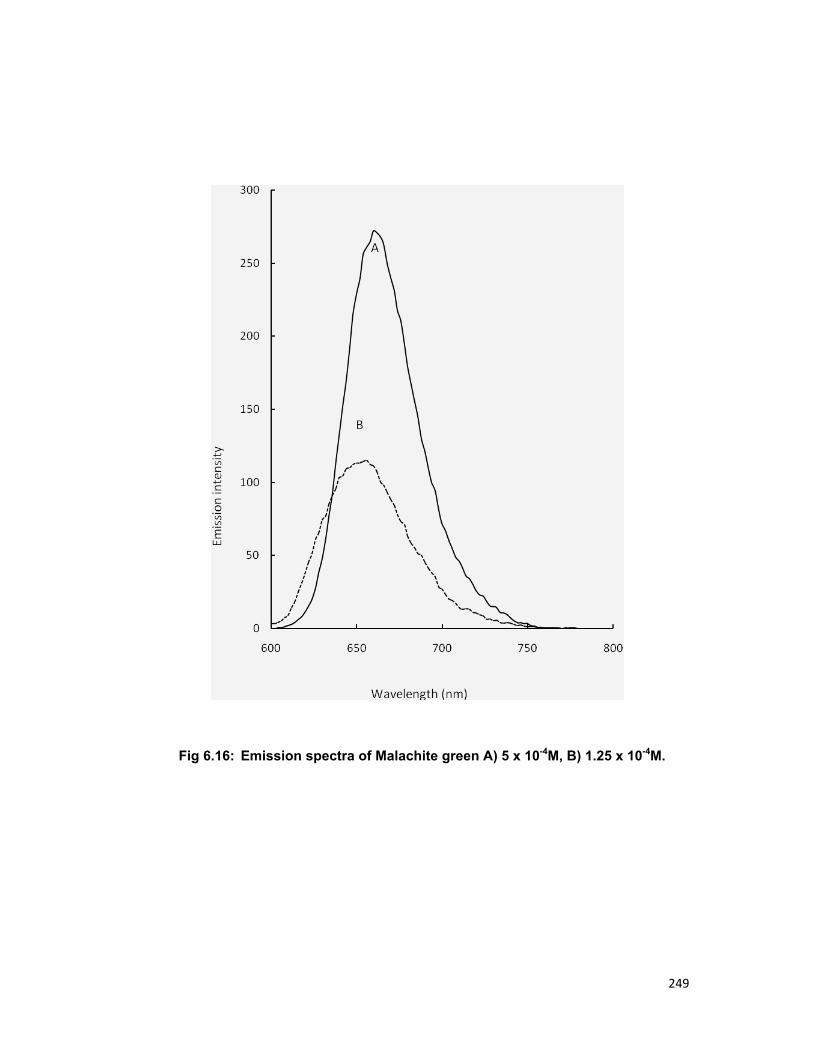
249
Fig 6.16: Emission spectra of Malachite green A) 5 x 10⁻⁴M, B) 1.25 x 10⁻⁴M.
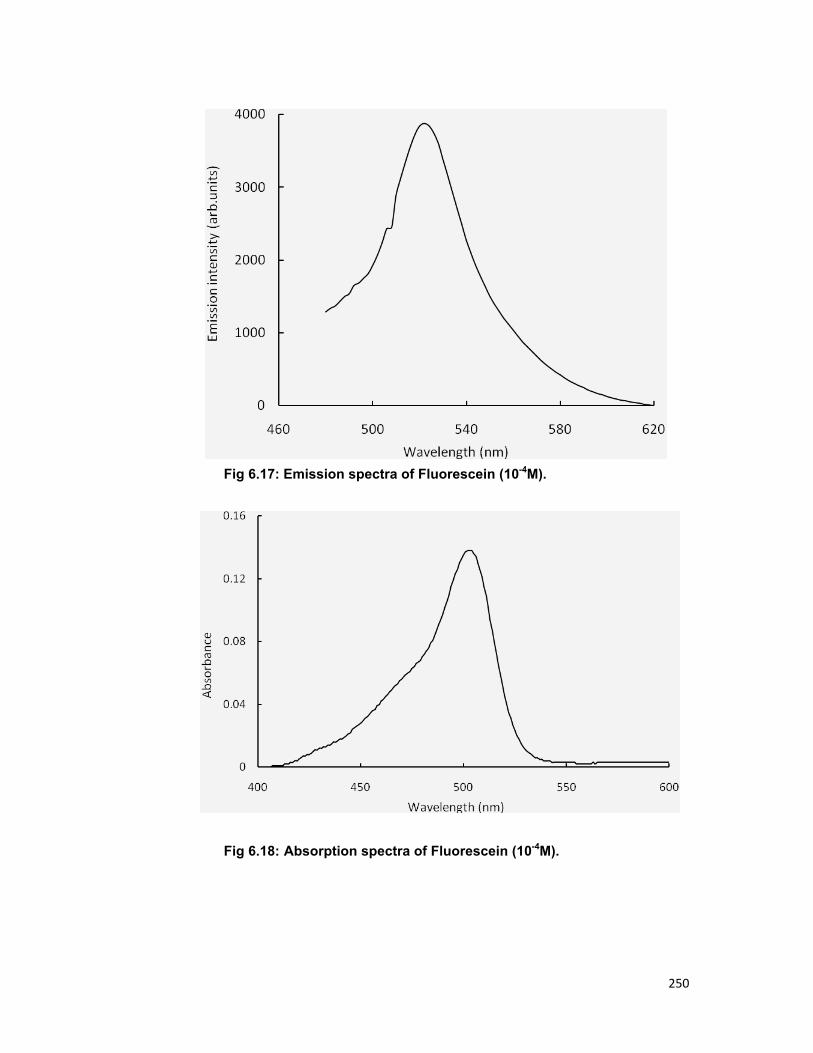
250
Fig 6.17: Emission spectra of Fluorescein (10-4M).
Fig 6.18: Absorption spectra of Fluorescein (10-4M).
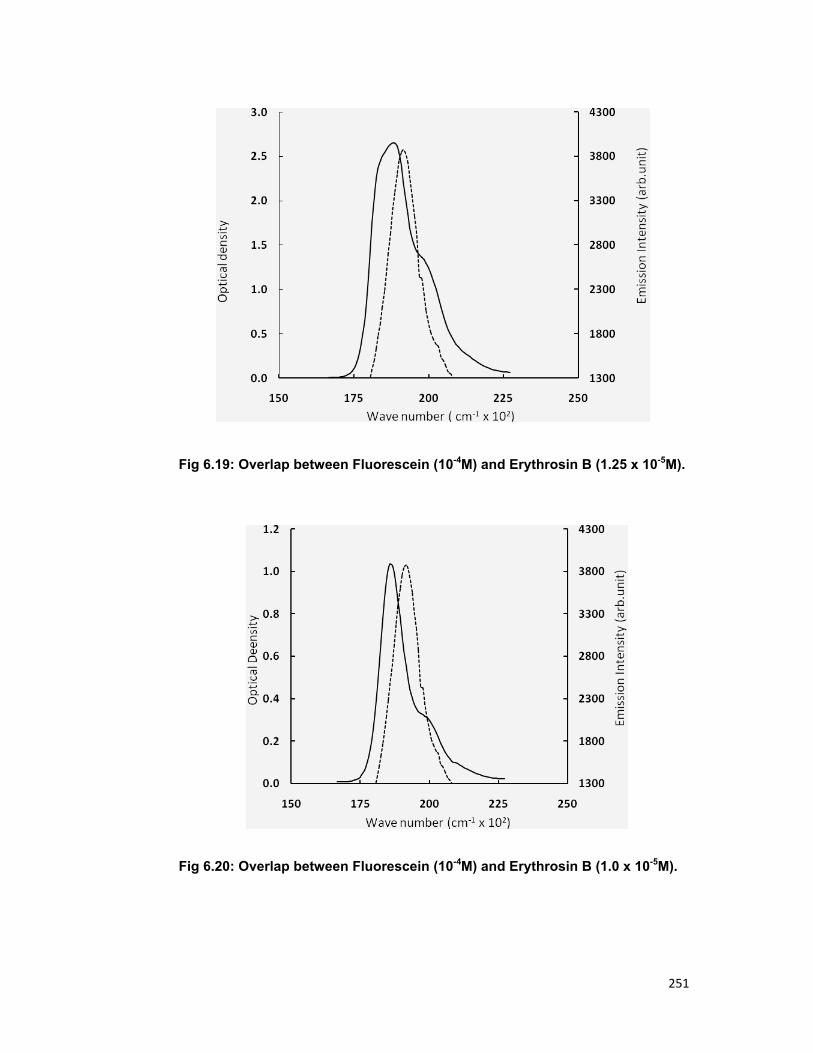
251
Fig 6.19: Overlap between Fluorescein (10-4M) and Erythrosin B (1.25 x 10⁻⁵M).
Fig 6.20: Overlap between Fluorescein (10-4M) and Erythrosin B (1.0 x 10⁻⁵M).

252
Fig 6.21: Overlap between Fluorescein (10-4M) and Erythrosin
B (0.80 x 10⁻⁵M).
Fig 6.22: Overlap between Fluorescein (10-4M) and Erythrosin
B (0.63 x 10⁻⁵M).

253
Fig 6.23: Overlap between Fluorescein (10-4M) and Erythrosin B (0.31 x 10⁻⁵M).
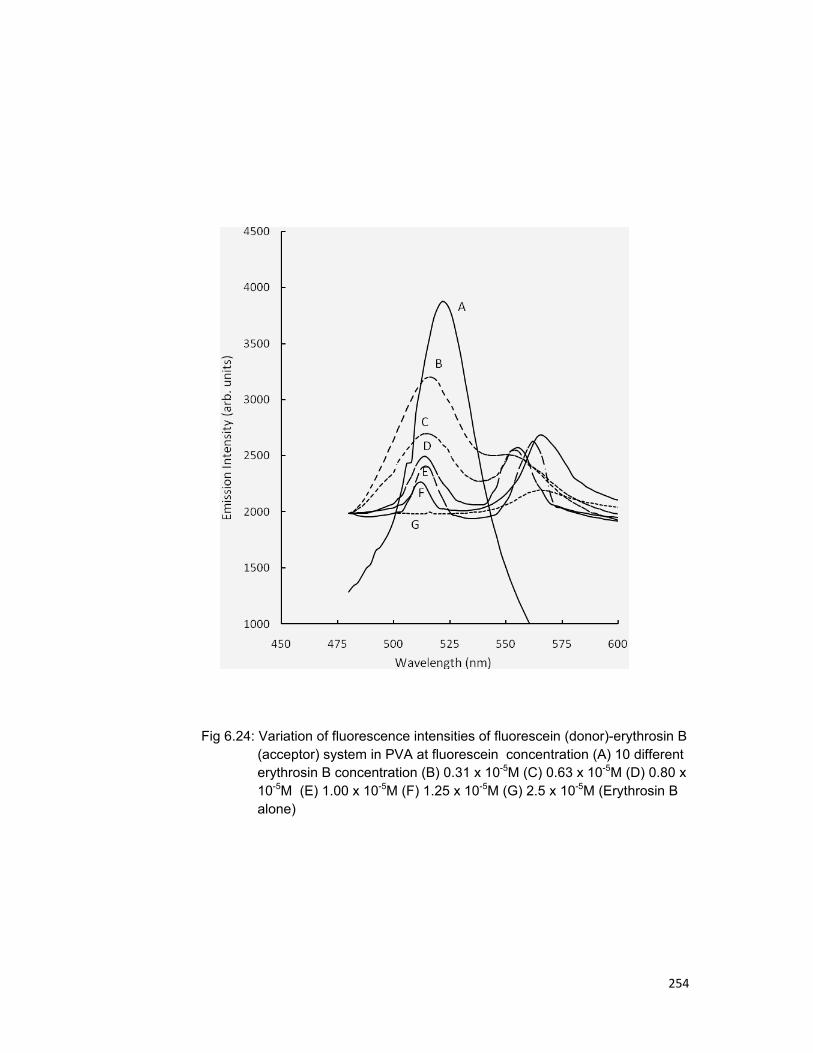
254
Fig 6.24: Variation of fluorescence intensities of fluorescein (donor)-erythrosin B (acceptor) system in PVA at fluorescein concentration (A) 10 different erythrosin B concentration (B) 0.31 x 10⁻⁵M (C) 0.63 x 10⁻⁵M (D) 0.80 x 10⁻⁵M (E) 1.00 x 10⁻⁵M (F) 1.25 x 10⁻⁵M (G) 2.5 x 10⁻⁵M (Erythrosin B alone)

255

256

257

258

259

260

261