Embed Size (px)
Citation preview

This article appeared in a journal published by Elsevier. The attachedcopy is furnished to the author for internal non-commercial researchand education use, including for instruction at the authors institution
and sharing with colleagues.
Other uses, including reproduction and distribution, or selling orlicensing copies, or posting to personal, institutional or third party
websites are prohibited.
In most cases authors are permitted to post their version of thearticle (e.g. in Word or Tex form) to their personal website orinstitutional repository. Authors requiring further information
regarding Elsevier’s archiving and manuscript policies areencouraged to visit:
http://www.elsevier.com/copyright
Author's personal copy
The effects of human movement on the persistence ofvector-borne diseases$
C. Cosner a, J.C. Beier b, R.S. Cantrell a, D. Impoinvil c, L. Kapitanski a, M.D. Potts d, A. Troyo e, S. Ruan a,�
a Department of Mathematics, University of Miami, Coral Gables, FL 33124, USAb Department of Epidemiology and Public Health, University of Miami, Miami, FL 33177, USAc LUCINDA Group, Veterinary Clinical Science, University of Liverpool, Neston, Cheshire CH64 7TE, UKd Department of Environmental Science, Policy and Management, University of California, Berkeley, CA 94720, USAe Centro de Investigacion en Enfermedades Tropicales, Departamento de Parasitologıa, Facultad de Microbiologıa, Universidad de Costa Rica, San Jose, Costa Rica
a r t i c l e i n f o
Article history:
Received 31 August 2008
Received in revised form
4 February 2009
Accepted 17 February 2009Available online 3 March 2009
Keywords:
Vector-borne disease
Human movement
Discrete diffusion
Basic reproduction number
Disease-free and endemic equilibria
Stability
a b s t r a c t
With the recent resurgence of vector-borne diseases due to urbanization and development there is an
urgent need to understand the dynamics of vector-borne diseases in rapidly changing urban
environments. For example, many empirical studies have produced the disturbing finding that diseases
continue to persist in modern city centers with zero or low rates of transmission. We develop spatial
models of vector-borne disease dynamics on a network of patches to examine how the movement of
humans in heterogeneous environments affects transmission. We show that the movement of humans
between patches is sufficient to maintain disease persistence in patches with zero transmission. We
construct two classes of models using different approaches: (i) Lagrangian models that mimic human
commuting behavior and (ii) Eulerian models that mimic human migration. We determine the basic
reproduction number R0 for both modeling approaches. We show that for both approaches that if the
disease-free equilibrium is stable ðR0o1Þ then it is globally stable and if the disease-free equilibrium is
unstable ðR041Þ then there exists a unique positive (endemic) equilibrium that is globally stable among
positive solutions. Finally, we prove in general that Lagrangian and Eulerian modeling approaches are
not equivalent. The modeling approaches presented provide a framework to explore spatial vector-
borne disease dynamics and control in heterogeneous environments. As an example, we consider two
patches in which the disease dies out in both patches when there is no movement between them.
Numerical simulations demonstrate that the disease becomes endemic in both patches when humans
move between the two patches.
& 2009 Elsevier Ltd. All rights reserved.
1. Introduction
Vector-borne diseases are a major public health problem(Gratz, 1999). They include long-established scourges, such asmalaria and dengue fever, as well as emerging and re-emergingdiseases such as West Nile virus. The maintenance and resurgenceof vector-borne diseases is related to ecological changes thatfavor increased vector densities or vector–host interactions,among other factors. There have been profound increases in themagnitude of vector-borne disease problems as the result ofurbanization, deforestation, globalization, economic development,among other factors. Experts recognize urbanization as one of themost important drivers of global change, and predict that rapid
increases in urban populations throughout the world will havemajor implications for human health in general and vector-bornediseases specifically (Sutherst, 2004).
Travel and transport have also contributed to the spread ofvector-borne diseases. There are reasons to believe that the spatialmovement of humans may be important for the epidemiology ofvector-borne diseases. One of the factors contributing to thereemergence of malaria is human migration (Martens and Hall,2000). Malaria remains surprisingly prevalent among residents ofsome urban areas where there are very few mosquitoes; however,many of those residents visit rural or periurban areas where thedisease is much more prevalent, so those visits might make thepersistence of malaria in the urban setting more likely. Empiricalstudies supporting the idea that travel outside urban areas is animportant factor in maintaining malaria in urban areas wheretransmission is low are described by Osorio et al. (2004), Domarleet al. (2006), and Ronald et al. (2006). Ronald et al. (2006) alsonoted that lower socioeconomic status was correlated withincreased risk of infection. The use of personal protection such
ARTICLE IN PRESS
Contents lists available at ScienceDirect
journal homepage: www.elsevier.com/locate/yjtbi
Journal of Theoretical Biology
0022-5193/$ - see front matter & 2009 Elsevier Ltd. All rights reserved.
doi:10.1016/j.jtbi.2009.02.016
$ Research was partially supported by NIH Grant P20-RR020770 (C.C., J.C.B.,
R.S.C., L.K., S.R.), NSF Grants DMS-0514839 and DMS-0816068 (C.C., R.S.C.), and NSF
Grant DMS-0715772 (S.R.).� Corresponding author.
E-mail address: [email protected] (S. Ruan).
Journal of Theoretical Biology 258 (2009) 550–560
Author's personal copy
as bednets may vary between locations or socio-economic classes;such an effect was explored using simple models by Kileen et al.(2003).
We use spatial models to examine how the movements ofhumans in heterogeneous environments affect the transmission ofvector-borne diseases. Specifically, we study how diseases can bemaintained in regions of low transmission by the movement ofhumans between regions of high and low transmission or theimmigration of humans into regions of low transmission fromregions of high transmission. Our study of this phenomenon ismotivated by the specific case of malaria but may be relevant toother vector-borne diseases. Our analysis is based on spatialversions of the classical Ross–Macdonald model. A review of thederivation of Ross–Macdonald models is given by Smith andMcKenzie (2004).
Although our goal is to understand spatial effects, ourmodeling approach could also be used to treat movementbetween different socio-economic classes or lifestyles. Becausewe want to consider the movement of humans we use thepopulations of infected humans and mosquitoes as state variablesrather than the proportions of the human and mosquito popula-tions that are infected. This is also how mosquito populations aretreated by Smith et al. (2004), where mosquitoes are assumed tomove but humans are not.
We model space as a network of patches and use two differentsorts of descriptions of movement. One description identifieshumans as resident in a given patch or belonging to a certainsocial group and assumes that they remain in that patch or groupmost of the time, but may visit other patches or groups oftenenough for pathogen transmission to occur there. In that case theinfection rate for humans in a given class or location depends onthe numbers of infectious vectors in other patches and thefraction of their time that individual humans spend in thosepatches but is not directly tied to an explicit description of humanmovement between classes or patches. This type of formulationhas been used by Dye and Hasibeder (1986), Hasibeder and Dye(1988), Rodriguez and Torres-Sorando (2001), and Ruan et al.(2006). This approach is related to the Lagrangian approach influid dynamics because it in effect labels individuals (by patch orclass) and tracks what happens to them. A type of movement weenvision this modeling approach as describing is where peopleand/or vectors are commuting between locations (or changingtheir activities) on a regularly scheduled basis, so that there is awell defined fraction of time that any given individual spends inany given location or state of activity.
Another description assumes that pathogen transmission tohumans in a given class or patch occurs only within that class orpatch but there is mobility between classes or patches that can beexplicitly described via something like discrete diffusion. Thistype of approach has been used by Allen et al. (2007), Arino andvan den Driessche (2003), Arino et al. (2005), Dhirasakdanon et al.(2007), Gaff and Gross (2007), Hsieh et al. (2007), Liu et al. (2006),Salmani and van den Driessche (2006), Smith et al. (2004), Wangand Mulone (2003), and Wang and Zhao (2004). It is related to theEulerian approach in fluid mechanics because it labels locations(or classes) and tracks what happens in them but does notdistinguish individuals by residence, only by current location.We envision this modeling approach as describing migrationfrom one location to another. Here discrete diffusion explicitlydescribes such movement and can result in changes in the totalnumber of individuals in a given patch, at least until a populationequilibrium is attained.
Sattenspiel and Dietz (1995) use a combined approach but donot consider vector-borne diseases. The models of Dye andHasibeder (1986), Hasibeder and Dye (1988), Rodriguez andTorres-Sorando (2001), Smith et al. (2004), and Liu et al. (2006)
describe various aspects of the transmission of vector-bornediseases in networks of patches or classes but are used to addressspecific questions that are different from those we consider here.
We would like to mention that the idea of using metapopula-tion models to describe spatial heterogeneities in diseasetransmission has been employed widely, see, for example, Bartlett(1956), Lajmanovich and Yorke (1976), Hethcote (1978), Hethcoteand Thieme (1985), Rvachev and Longini (1985), Travis andLenhart (1987), Dushoff and Levin (1995), Sattenspiel and Dietz(1995), Lloyd and May (1996), and Arino and van den Driessche(2003). For more details and references on modeling infectiousdiseases in metapopulations, we refer to the survey articles ofWang (2007) and Arino (2009).
Another remark we would like to make is that, after the initialsubmission of our paper, the article of Auger et al. (2008) came toour attention. Auger et al. (2008) generalize the Ross–Macdonaldmalaria model to n patches and incorporated the fact that somepatches can be vector free. They assume that the hosts canmigrate between patches, but not the vectors. The susceptible andinfectious individuals have the same dispersal rate. They computethe basic reproduction ratio and proved that if the basicreproduction ratio is less than or equal to the unity, then thedisease-free equilibrium is globally asymptotically stable. Whenthe basic reproduction ratio is greater than the unity, theyprove that there exists a unique endemic equilibrium, which isglobally asymptotically stable on the biological domain minus thedisease-free equilibrium. Their model is similar to our secondmodel, namely the patch model with migration using the Eulerapproach. While they assume that only hosts can migrate betweenpatches, we consider both cases: (a) both hosts and vectors canmigrate between patches, and (b) only hosts can migrate betweenpatches.
2. Modeling framework
2.1. A single-patch model
Within a single patch, we base our description of diseasedynamics on the Ross–Macdonald type model of Smith andMcKenzie (2004). Our notation is slightly different from theirsbut our model is equivalent to theirs. The model assumes thathuman and mosquito populations are fixed but there is turnoverin the mosquito population because of adult mortality. The statevariables in the model are the proportions xðtÞ and yðtÞ of thehuman and mosquito populations, respectively, consisting ofinfectious individuals. The parameters in the model are as follows:
a the human feeding rate of mosquitoes (number of biteson humans, per mosquito, per unit time),
b the transmission efficiency from infected mosquitoes tohumans,
c the transmission efficiency from infected humans tomosquitoes,
m the mortality rate of mosquitoes,r the recovery rate of humans,t the incubation period from the time a mosquito
becomes infected until it becomes infectious,M the ratio of mosquitoes to humans.
In our notation the basic model is
dx
dt¼ Mabyð1� xÞ � rx,
dy
dt¼ acxðe�mt � yÞ � my. (2.1)
ARTICLE IN PRESS
C. Cosner et al. / Journal of Theoretical Biology 258 (2009) 550–560 551

Author's personal copy
A detailed derivation of the model and a discussion of howthe parameters can be related to data and various indicessuch as the human blood index (HBI) and entomologicalinoculation rate (EIR) is given by Smith and McKenzie(2004). The term e�mt in the equation for the proportion ofinfectious mosquitoes arises because the rate of mosquito turn-over due to adult mortality is typically high enough that asignificant fraction of infected mosquitoes can be expected to diebefore they become infectious. Note that it is assumed thatinfected individuals become susceptible after they recovered frominfection.
We need to rewrite (2.1) in terms of populations rather thanfractions of populations for our derivation of spatial models. Inparts of the derivation we want to consider the human andmosquito populations in each patch that can change due to themovement of humans or mosquitoes. Furthermore, we find itconvenient to use the number of infected mosquitoes rather thanthe number of infectious mosquitoes as a state variable. To thatend we introduce the following variables:
H the total human population,X the number of infected humans,V the total mosquito population,Y the number of infected mosquitoes.
In a situation where H and V can vary, M will no longerbe a constant parameter, but in any case M ¼ V=H. In general,X ¼ xH and e�mtY ¼ yV . Using those relations we can rewrite(2.1) as
dX
dt¼
abe�mt
HYðH � XÞ � rX,
dY
dt¼
ac
HXðV � YÞ � mY . (2.2)
We use the formulation in (2.2) to build our spatial models. Inthose models we write parameters analogous to those appearingin (2.2) in condensed form, indexed by patch.
2.2. The spatial models
In our models we treat space as a network of connectedpatches. The patches (or nodes) typically represent differentgeographical locales such as rural areas, villages, or city districts,but the same modeling approach could be used to describenetworks of different groups within a population (school children,factory workers, night watchmen, etc.). We examine models basedon two different ways of describing the movement of humansand/or mosquitoes among the patches.
In the first type of model we label individuals as residents of aparticular patch and describe their interactions with individualsfrom their own or other patches in terms of the rate of exposure toinfection from residents of those patches. We assume thatindividuals do not move permanently from their patch ofresidence to another patch, but may visit other patches. The rateat which individuals become infected then depends upon thefraction of their time that they spend in each patch together withthe transmission rates in those patches. We sometimes refer tothis approach as Lagrangian in that it labels and in some sensetracks individual humans or mosquitoes. The Lagrangian approachhas been used by Dye and Hasibeder (1986), Hasibeder and Dye(1988), Rodriguez and Torres-Sorando (2001), and Ruan et al.(2006).
In the second type of model we assume that humans andmosquitoes can migrate between patches and thus do not have aspecified patch of residence. The rate at which individuals become
infected depends only on the patch where they are located. Werefer to this approach as Eulerian because we track what happensin a given location (patch) rather than what happens to labeledindividuals. The Eulerian approach has been used by Allen et al.(2007), Arino and van den Driessche (2003), Arino et al. (2005),Dhirasakdanon et al. (2007), Hsieh et al. (2007), Liu et al. (2006),Salmani and van den Driessche (2006), Smith et al. (2004), Wangand Mulone (2003), and Wang and Zhao (2004). Models using acombination of these approaches have been used in Sattenspieland Dietz (1995). Throughout our discussion we use the followingnotation:
N the total number of patches in the network.
In reality it is plausible that humans may move longerdistances than mosquitoes, so the patch networks for humansand mosquitoes might have different spatial scales. However, ourmodels will incorporate coefficients describing the rate of move-ment between patches or the fraction of time an individual spendsin patches other than his or her home patch. Those could beadjusted differently for humans and for mosquitoes. The coeffi-cients of movement between distant patches could be taken to besmall or zero for mosquitoes but large for humans. We willassume something of this sort in an important special case of themodels that we will treat in Section 3.2. Furthermore, since we aremainly interested in the effects of human movement, for ourpurpose the fine scale spatial structure of a mosquito metapopu-lation within a region that represents a single patch at the humanscale can be aggregated over that patch. Hence, using the samepatch networks for humans and mosquitoes is reasonable in thepresent context, although it might not be in others. It is worthnoting that Smith et al. (2004) use models where mosquitoesmove between patches but humans do not to study how spatialheterogeneity in mosquito populations can affect malaria trans-mission. We also assume that infection does not affect humanmovement greatly.
2.2.1. Lagrangian approach: patch models with commuting
To formulate spatial models using the Lagrangian approach, weneed to define transmission rates by averaging the rates acrosspatches weighted by the fractions of their time that individualsspend in each patch. We denote those as follows:
pij the fraction of time a human resident in patch i spendsvisiting patch j,
qij the fraction of time a mosquito resident in patch i spendsvisiting patch j.
Note that
XN
j¼1
pij ¼XN
j¼1
qij ¼ 1.
Let ai; bi; ci;mi; ri; ti;Hi;Vi denote the values of the parametersappearing in (2.2) in the case of the ith patch. Define
Aij ¼ajbjpije
�mjtj
Hj; Bij ¼
ajcjqij
Hj. (2.3)
Our Lagrangian model then has the form
dXi
dt¼
XN
j¼1
AijYj
0@
1AðHi � XiÞ � riXi,
dYi
dt¼
XN
j¼1
BijXj
0@
1AðVi � YiÞ � miYi; i ¼ 1; . . . ;N. (2.4)
ARTICLE IN PRESS
C. Cosner et al. / Journal of Theoretical Biology 258 (2009) 550–560552
Author's personal copy
It is clear that the set fðX1; . . . ;XN ;Y1; . . . ;YNÞ : 0pXipHi;0pYi
pVi; i ¼ 1; . . . ;Ng is invariant for (2.4). We always assume that0pXið0ÞpHi and 0pYið0ÞpVi for all i.
In some cases we may want to assume that the total vectorpopulations in one or more of the patches are zero, so that thenumbers of infected vectors in those patches are also zero (sothere is no equation for the number of infected vectors in thatpatch) and thus some of the transmission terms in (2.4) are zerosince some of the variables Yi are always zero. Such models can becast in the form
dXi
dt¼
XN1
j¼1
AijYj
0@
1AðHi � XiÞ � riXi for i ¼ 1; . . . ;N,
dYi
dt¼
XN
j¼1
BijXj
0@
1AðVi � YiÞ � miYi for i ¼ 1; . . . ;N1, (2.4A)
where N1oN.
2.2.2. Eulerian approach: patch models with migration
In deriving our Eulerian model we must address the issuethat the total human and/or vector populations in a givenpatch might change sufficiently over time to affect the model.We start by formulating a model where those populationsare viewed as dynamic variables, but then we make theassumption that those populations have come to the equilibriumpredicted by the migration rates, at least relative to the timescale on which we want to study the system. That allows us toexamine how vector-borne diseases might be propagated throughpopulations that are distributed in space in situations where amigration pattern is relatively stable over time. It would be ofinterest to study transient effects, and even systems wheremigration rates can vary over time, but we do not do that in thepresent article.
To derive the Eulerian model we initially use Hi and Vi todenote human and vector populations on the ith patch, but weconsider them as dynamic variables. We use Cij to denote themigration rate of humans from patches j to i and Dij to denote thecorresponding rate for vectors:
Cij the rate of human migration from patches j to i,Dij the rate of vector migration from patches j to i:
The movement model for migration then takes the form of adiscrete diffusion:
dHi
dt¼XN
jaij¼1
CijHj �XN
jaij¼1
Cji
0BB@
1CCAHi,
dVi
dt¼XN
jaij¼1
DijVj �XN
jaij¼1
Dji
0BB@
1CCAVi; i ¼ 1; . . . ;N. (2.5)
Define
Cii ¼ �XN
jaij¼1
Cji; Dii ¼ �XN
jaij¼1
Dji; i ¼ 1; . . . ;N, (2.6)
and
H ¼XN
i¼1
Hi; V ¼XN
i¼1
Vi.
By summing up the equations for Hi in (2.5) we can see thatdH=dt ¼ 0, and similarly dV=dt ¼ 0. Thus, HðtÞ ¼ Hð0Þ andVðtÞ ¼ Vð0Þ. Also, ð1; . . . ;1ÞððCijÞÞ ¼ 0, so zero is an eigenvalue ofððCijÞÞ, and similarly for ððDijÞÞ. Under an additional assumption ofirreducibility, zero can be seen to be principal eigenvalue of ððCijÞÞ
and ððDijÞÞ by the Perron–Frobenius theorem (because it has apositive left eigenvector), so it is simple and any other eigenvaluehas real part less than zero (see for example, Berman andPlemmons, 1979; Graham, 1987). Thus we have:
Lemma 1. Suppose that the matrix with off-diagonal entries Cij and
diagonal entries equal to 0 is irreducible. If ðH1ðtÞ; . . . ;HNðtÞÞ is a
solution to the first system of equations in (2.5) with Hið0ÞX0 for
i ¼ 1; . . . ;N and Hið0Þ40 for some i, then HiðtÞ ! H�i as t!1 for
i ¼ 1; . . . ;N, where ðH�1; . . . ;H�NÞ is the solution to
XN
j¼1
CijH�j ¼ 0;
XN
j¼1
H�j ¼ Hð0Þ. (2.7)
(In other words, ðH�1; . . . ;H�NÞ
T is the right eigenvector of ððCijÞÞ
corresponding to the eigenvalue 0 normalized so that its components
sum to H(0).) Similarly, suppose that the matrix with off-diagonal
entries Dij and diagonal entries equal to 0 is irreducible. If
ðV1ðtÞ; . . . ;VNðtÞÞ is a solution to the second system of equations in
(2.5) with Við0ÞX0 for i ¼ 1; . . . ;N and Við0Þ40 for some i, then
ViðtÞ ! V�i as t!1 for i ¼ 1; . . . ;N, where ðV�1; . . . ;V�NÞ is the
solution to
XN
j¼1
DijV�j ¼ 0;
XN
j¼1
V�j ¼ Vð0Þ. (2.8)
Proof. See Appendix.
In formulating our Eulerian model we assume that themigration process has reached a steady state, so that there maybe exchange of individuals between patches but there is no netchange in the total human or vector population in each patch.Thus, we assume that HiðtÞ ¼ H�i and ViðtÞ ¼ V�i with H�i and V�i areas in Lemma 1 for i ¼ 1; . . . ;N. We assume that disease transmis-sion occurs only between individuals that are in the same patch atthe same time. Let
Ai ¼aibie
�miti
H�i; Bi ¼
aici
H�i. (2.9)
Our Eulerian model with infected individuals present would takethe form
dXi
dt¼ AiYiðH
�i � XiÞ � riXi þ
XN
jaij¼1
CijXj �XN
jaij¼1
Cji
0BB@
1CCAXi,
dYi
dt¼ BiXiðV
�i � YiÞ � miYi þ
XN
jaij¼1
DijYj �XN
jaij¼1
Dji
0BB@
1CCAYi; i ¼ 1; . . . ;N.
(2.10)
It is clear from (2.7) and (2.8) that the set fðX1; . . . ;XN ;Y1;
. . . ;YNÞ : 0pXipH�i ;0pYipV�i ; i ¼ 1; . . . ;Ng is invariant for (2.10).We always assume that 0pXið0ÞpH�i and 0pYið0ÞpV�i forall i.
To address the issue of how diseases can be maintained inregions of low transmission by the movement of humans betweenregions of high and low transmission, we again want to considercases where there are no vectors and thus no transmission in
ARTICLE IN PRESS
C. Cosner et al. / Journal of Theoretical Biology 258 (2009) 550–560 553
Author's personal copy
certain patches. Then (2.10) becomes
dXi
dt¼ AiYiðH
�i � XiÞ � riXi þ
XN
jaij¼1
CijXj �XN
jaij¼1
Cji
0BB@
1CCAXi
for i ¼ 0; . . . ;N1,
dXi
dt¼ �riXi þ
XN
jaij¼1
CijXj �XN
jaij¼1
Cji
0BB@
1CCAXi for i ¼ N1 þ 1; . . . ;N,
dYi
dt¼ BiXiðV
�i � YiÞ � miYi þ
XN1
jaij¼1
DijYj �XN1
jaij¼1
Dji
0BB@
1CCAYi
for i ¼ 0; . . . ;N1, (2.10A)
where again as in (2.4A) we have N1oN.
2.2.3. Relationship between Langrangian and Eulerian models
It is natural to ask whether it is possible to translate modelsbetween the forms (2.4) and (2.10). Suppose we denote thenumber of infected human residents of patch i in (2.4) as Xi, thatis, let the variables Xi correspond to the state variables for humansin (2.4). Denote the number of infected humans currently locatedin patch i as Xi, that is, let the variables Xi correspond to the statevariables for humans in (2.10). Similarly, denote the number ofinfected vector residents of patch i as Yi and the number ofinfected vectors currently located in patch i as Y i. Since theinfected humans currently in patch i could be from any patch, buthuman residents of patch j spend a fraction pji of their time inpatch i, and similarly for vectors with pji replaced by qji, we shouldhave
Xi ¼XN
j¼1
pjiXj and Y i ¼XN
j¼1
qjiYj.
Clearly we generally cannot solve this system unless thematrices ððpjiÞÞ and ððqijÞÞ are invertible, but that need not bethe case under the assumptions of our models. In cases where thematrices are invertible, the system resulting from translatingthe model (2.4) into a model with state variables Xi;Yi into asystem in terms of Xi; Y i is generally not of the form (2.10).Except in special cases where the amount of time individualsspend in patches other than their patch of residence is small,it is not even approximately of the form (2.10). Thus, the twomodeling formulations are not equivalent, although in somecases they might both be reasonable as approximate descriptionsof a given system. Hence, we want to analyze both types ofmodels.
3. Analysis and application of the models
3.1. General properties
The models (2.4) and (2.10) are cooperative systems onthe invariant sets fðX1; . . . ;XN ;Y1; . . . ;YNÞ : 0pXipHi;0pYipVi;
i ¼ 1; . . . ;Ng and fðX1; . . . ;XN ;Y1; . . . ;YNÞ : 0pXipH�i ;0pYipV�i ;
i ¼ 1; . . . ;Ng, respectively, so they generate flows that are orderpreserving on those sets; see for example Smith (1995). Sincethe models are epidemiological in character it is sensible todescribe the stability or instability of the disease-free equilibriumXi ¼ Yi ¼ 0; i ¼ 1; . . . ;N in terms of a basic reproductionnumber R0. That number can be computed by the methods ofvan den Driessche and Watmough (2002). (Since the modelsdescribe vector-borne diseases that require the two-step
process of a human transmitting the disease to a vector and thevector transmitting the disease to another human to achievetransmission from one human to another, some authorswould consider the basic reproduction number for such modelsto be R2
0 if R0 were the value computed as in van den Driesscheand Watmough, 2002). We use that convention here. In thecase of (2.4), a formula for R0 and a description of the dynamicsof the model were already obtained by Hasibeder and Dye(1988), partly on the basis of results of Lajmanovich and Yorke(1976). We consider that case first. Throughout our discussion weuse rðMÞ to denote the spectral radius of the matrix M. In somecases, for example if M is primitive,rðMÞ is the principaleigenvalue of M.
Theorem 1 (Hasibeder and Dye, 1988). Let A ¼ ððAijHi=mjÞÞ,B ¼ ððBijVi=rjÞÞ, where the entries in A and B are taken from
(2.4). Assume that the matrices A;B are irreducible. Then for (2.4)we may take R2
0 ¼ rðABÞ. If R0o1 then the disease-free equilibrium
in (2.4) is stable while if R041 it is unstable. If the disease-free
equilibrium in (2.4) is stable then there is no positive equilibrium
and the disease-free equilibrium is globally stable among non-
negative solutions. If the disease-free equilibrium is unstable there is
a unique positive equilibrium which is globally stable among positive
solutions.
It follows from the theory of monotone dynamical systems thatin the case of Theorem 1 where the disease-free equilibrium isunstable there is a monotone trajectory connecting the disease-free equilibrium to the positive equilibrium; see Smith (1995).Furthermore, ðH1; . . . ;HN ;V1; . . . ;VNÞ is a super-solution to theequilibrium problem for (2.4) so a solution of (2.4) with thatinitial data will decrease toward an equilibrium. Thus, when itexists, the positive equilibrium is globally stable in the setfðX1; . . . ;XN ;Y1; . . . ;YNÞ : 0pXipHi;0pYipVi; i ¼ 1; . . . ;Ng. It fol-lows from the structure of A and Bthat if one of the parametersAij;Bij;Hi; or Vi is increased then R0 will increase but if ri or mi isincreased then R0 will decrease. This is sensible biologically sinceincreasing transmission rates or the initial number of susceptibleindividuals typically increase R0 while increasing recovery ormortality rates typically decrease it.
Theorem 2. Consider the system (2.10) restricted to the invariant
region fðX1; . . . ;XN ;Y1; . . . ;YNÞ : 0pXipH�i ;0pYipV�i ; i ¼ 1; . . . ;Ng:Let C ¼ ððCijÞÞ and D ¼ ððDijÞÞ. Let A� ¼ ððAiH
�i dijÞÞ;B
�¼ ððBiM
�i dijÞÞ;
C� ¼ ððCij � ridijÞÞ, and D� ¼ ððDij � midijÞÞ, where dij is the Kronecker
delta. Assume that the matrices C and D are irreducible. Then for
(2.10) we may take R20 ¼ rðA�D��1B�C��1
Þ. If R0o1 then the
disease-free equilibrium in (2.10) is stable while if R041 it is
unstable. If the disease-free equilibrium in (2.10) is stable then there
is no positive equilibrium and the disease-free equilibrium is globally
stable among non-negative solutions. If the disease-free equilibrium
is unstable there is a unique positive equilibrium which is globally
stable among positive solutions.
Proof. See Appendix.
The proof for Theorem 2 could be adapted to give an alternateproof of Theorem 1. A related result giving a similar formula for R0
in a discrete-diffusion type model for a disease with directtransmission in a patchy environment was obtained by Dhirasak-danon et al. (2007). The proof of Theorem 2 shows that the matrixA�D��1B�C��1 is non-negative. Increasing the transmission ratesand populations Ai;Bi;H
�i or V�i will increase some of its entries
and thus R0 will be monotone increasing in those parameters. Inthe proof of Theorem 2 it is also shown that the matrices �C� ¼�C þ ððridijÞÞ and �D� ¼ �Dþ ððmidijÞÞ are non-singular M-ma-trices. It follows that they are invertible with non-negativeinverses (see Berman and Plemmons, 1979). To see how their
ARTICLE IN PRESS
C. Cosner et al. / Journal of Theoretical Biology 258 (2009) 550–560554
Author's personal copy
entries depend on ri and mi, suppose that Ri40 for i ¼ 1; . . . ;N andobserve that
½�C þ ððRidijÞÞ��1 � ½�C þ ððridijÞÞ�
�1
¼ ½�C þ ððRidijÞÞ��1ðð½ri � Ri�dijÞÞ½�C þ ððridijÞÞ�
�1.
Hence, if riXRi for all i then ½�C þ ððRidijÞÞ��1 � ½�C þ ððridijÞÞ�
�1 isnon-negative. Thus, the entries in A�D��1B�C��1
¼
A�ð�D��1ÞB�ð�C��1
Þ are monotone decreasing with respectto the recovery rates ri. Similarly, they are also monotonedecreasing with respect to the mortality rates mi. It follows thatrðA�D��1B�C��1
Þ and hence R0 are monotone decreasing inthose parameters. The dependence on the movement rates Cij;Dij
is more subtle in general but sometimes can be determined inparticular cases. We will return to that point later.
The analysis used to prove Theorems 1 and 2 also applies tomodels such as (2.4A) and (2.10A) where vectors are presentonly in some patches and the equations for the infected vectors inthe patches where vectors are absent are dropped from the model.In such cases the dimensions of the matrices A or A� aredifferent from those of B or B� so the short formulations for R0
given in those theorems cannot be used; however, we can stillcompute R0 as the spectral radius of an appropriate matrix byusing the methods of van den Driessche and Watmough (2002), orperhaps directly, and the arguments for the existence anduniqueness, or non-existence, of a positive equilibrium areunchanged. In particular, for (2.4A) we can define the matricesA and B as in Theorem 1, except that A is N � N1 and B isN1 � N; then the results of van den Driessche and Watmough(2002) imply that
R0 ¼ r0 A
B 0
� �. (3.1)
For (2.10A) we can define the entries in A�, B�, C�, and D� asbefore, but with A�, B�, and D� now being N1 � N1 matrices.Define the N � N matrix A� by
A� ¼0 A�
0 0
!. (3.2)
We can then compute R0 by the methods of van den Driesscheand Watmough (2002) as
R0 ¼ r 0 A�
B� 0
!�C� 0
0 �D�
!�124
35. (3.3)
3.2. Two-patch models with no transmission in one patch
It is known (Carter et al., 2000) that malaria transmissionis strongly associated with location in two main features. First,the disease is focused around specific mosquito breeding sitesand can normally be transmitted only within certain dis-tances from them: in Africa these are typically between a fewhundred meters and a kilometer and rarely exceed 2–3 km.Second, there is a marked clustering of persons with malariaparasites and clinical symptoms at particular sites, usuallyhouseholds. To understand how movement between patchesmight sustain infection in patches with no transmission westudy models with two patches but with transmission only inone patch. We denote the patch with no transmission as patchnumber 2. We assume that there is no movement of vectorsbetween patches, so that there are no infected vectors in patchnumber 2, that is, Y2 ¼ 0. Since Y2 ¼ 0 we omit the equation forY2 from the models.
3.2.1. The Langrangian model
The first such model we consider has the form (2.4A) withN ¼ 2 and N1 ¼ 1, that is
dX1
dt¼ A11Y1ðH1 � X1Þ � r1X1,
dX2
dt¼ A21Y1ðH2 � X2Þ � r2X2,
dY1
dt¼ ðB11X1 þ B12X2ÞðV1 � Y1Þ � m1Y1. (3.4)
Computing R0 by the method of van den Driessche andWatmough (2002) as described in the previous subsection yields
R20 ¼
A11B11H1V1
r1m1
þA21B12H2V1
r2m1
. (3.5)
The first term on the right in (3.5) is the value of R20 that would
result if patch number 1 were isolated. Note that it is possible tohave that value less than 1, so that the disease would not persist inpatch number 1 in the absence of patch number 2, but still haveR2
041 in (3.5). If R041 in (3.5) then (3.4) has a unique positiveequilibrium ðX�1;X
�2;Y�1Þ that is globally stable among positive
solutions.Suppose that R041 in (3.5). The components X�1 and X�2 satisfy
X�1 ¼A11H1Y�1
A11Y�1 þ r1; X�2 ¼
A21H2Y�1A21Y�1 þ r2
. (3.6)
The component Y�1 satisfies
A11B11H1V1
A11Y�1 þ r1þ
A21B12H2V1
A21Y�1 þ r2¼
m1
V1 � Y�1. (3.7)
It is possible to compute Y�1 explicitly by solving (3.7), but thatyields a quadratic equation with coefficients depending on theparameters of the model in a complicated way, so the result is notvery illuminating. For our purposes we can obtain reasonablysatisfactory results by making some simple observations andestimates.
If A11B11H1V1=r1m141 so that the disease could persist inpatch 1 if that patch were isolated, then it follows from the formof (3.7) that Y�1XY��1 where Y��1 is the equilibrium that wouldresult if patch number 1 were isolated (equivalently if the secondterm on the left were dropped from (3.7)). We would then have
Y�1XY��1 ¼A11B11H1V1 � r1m1
A11ðB11H1 þ m1Þ, (3.8)
which yields a lower bound on X�2 in (3.6). However, our primaryinterest is in comparing X�1 and X�2.
Suppose that p11=p21Xr1=r2. (Recall that pij denotes thefraction of his or her time that a human resident of patch i
spends in patch j, so if r1 ¼ r2 this assumption would mean thatresidents of patch 1 spend a larger fraction of their time in patch 1than do residents of patch 2, which is reasonable.) By (2.3) wethen have A11Y�1=r1XA21Y�1=r2. In that case it follows from (2.3)and (3.6) that
X�2X�1¼
A21H2
A21Y� þ r2�
A11Y�1 þ r1
A11H1X
A21H2r1
A11H1r2¼
p21H2r1
p11H1r2. (3.9)
If the human populations and recovery rates are equal in thetwo patches then the last expression in (3.7) reduces to the ratioof the fractions of time spent in patch 1 by residents of patches 2and 1, respectively. In any case, the model predicts that diseasecan indeed be maintained in patch 2 without transmission there,at a level that is proportional to the fraction of their time thatresidents of patch 2 spend in patch 1 relative to residents ofpatch 1.
ARTICLE IN PRESS
C. Cosner et al. / Journal of Theoretical Biology 258 (2009) 550–560 555

Author's personal copy
3.2.2. The Eulerian model
Next we consider the case of models of the form (2.10A), againwith transmission only in patch 1, and no movement ofmosquitoes between patches, so that we do not include anequation for infected vectors in patch 2. This leads to models ofthe form
dX1
dt¼ A1Y1ðH
�1 � X1Þ � r1X1 þ C12X2 � C21X1,
dX2
dt¼ C21X1 � C12X2 � r2X2,
dY1
dt¼ B1X1ðV
�1 � Y1Þ � m1Y1. (3.10)
In this case R0 is given by
R20 ¼
A1B1H�1V�1m1
�C12 þ r2
C12r1 þ C21r2 þ r1r2(3.11)
with coefficients as in (2.7)–(2.9). Note that H�1pHð0Þ where Hð0Þis the total initial human population in the two patches, so that if
C21 is sufficiently large we have R0o1 in (3.11). Recall that theparameter C21 represents the rate of migration from the patchwith transmission to the patch without transmission. Thus, asufficiently high rate of migration from the patch with transmis-sion into the patch without it can cause the disease to beeliminated. A similar observation was made by Hsieh et al. (2007)for diseases that are directly transmitted between humans.
For R041 in (3.11) the equilibrium ðX�1;X�2;Y�1Þ of (3.10) satisfies
X�2 ¼C21X�1
C12 þ r2,
Y�1 ¼B1V�1X�1
B1X�1 þ m1
,
X�1 ¼A1B1V�1H�1 � Qm1
B1ðA1V�1 þ Q Þ¼ðR2
0 � 1ÞQm1
B1ðA1V�1 þ Q Þ, (3.12)
where
Q ¼C12r1 þ C21r2 þ r1r2
C12 þ r2.
ARTICLE IN PRESS
0.005
0.01
0.015
0.02
0.025
0.03
0 50 100 150 200 250 300 350 400 450 500t - time
x1
y1
0.002
0.004
0.006
0.008
0.01
0.012
0.014
0.016
0 50 100 150 200 250 300 350 400 450 500t - time
x2
y2
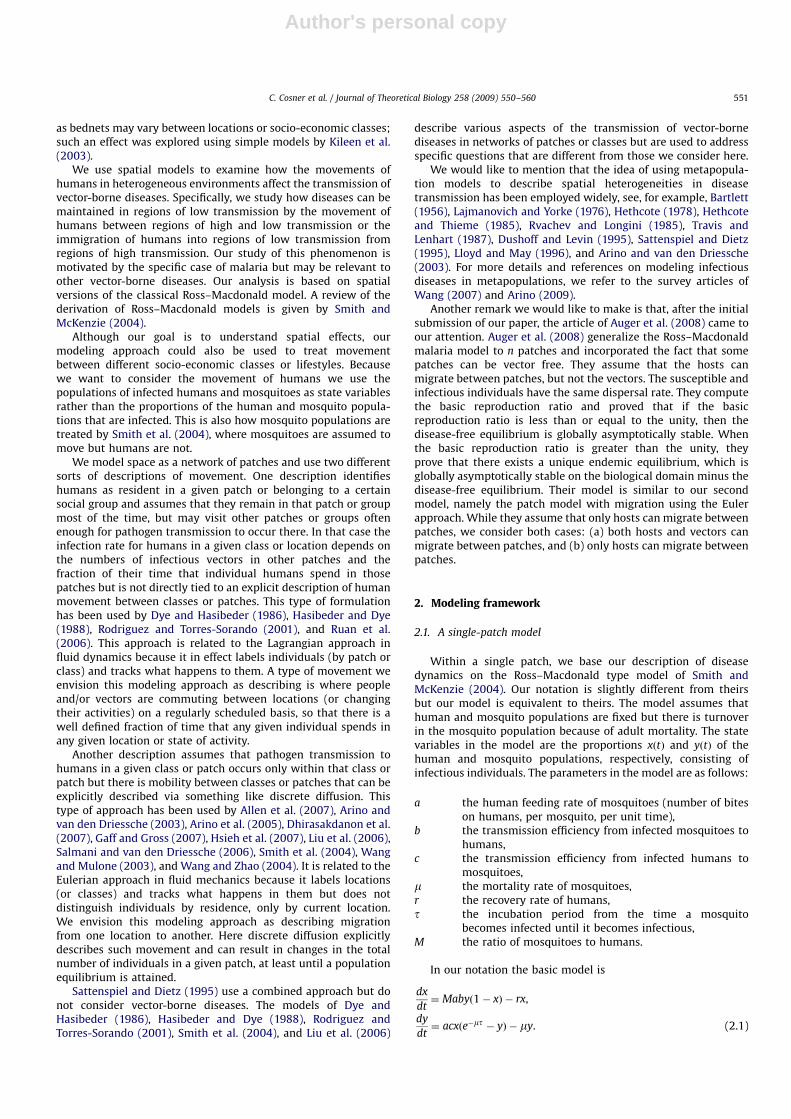
Fig. 1. When there is no movement between the two patches, the disease dies out in both patches (top: patch 1; bottom: patch 2). Here a12 ¼ a21 ¼ 0.
C. Cosner et al. / Journal of Theoretical Biology 258 (2009) 550–560556

Author's personal copy
It is clear from the first equation in (3.12) that if the rates of migra-tion as reflected by the size of the coefficients C12 and C21 are com-parable to the recovery rate in patch 2 then disease can be sustained inpatch 2 even though there is no transmission in that patch.
4. Numerical simulations
To carry out numerical simulations, we consider the Langran-gian model with two patches such as two villages. For simplicity,we use xiðtÞ and yiðtÞ to denote the fractions of infectious host andvector populations in patch i ði ¼ 1;2Þ: Assume that there is novector movement between these two patches (i.e. b12 ¼ b21 ¼ 0),only humans can move between these two patches:
dx1
dt¼ ða11y1 þ a12y2Þð1� x1Þ � r1x1,
dy1
dt¼ b11x1ð1� y1Þ � m1y1,
dx2
dt¼ ða21y1 þ a22y2Þð1� x2Þ � r2x2,
dy2
dt¼ b22x2ð1� y2Þ � m2y2.
First, consider the case when there is no human movementbetween these two patches; that is, these two patches are iso-lated ða12 ¼ a21 ¼ 0Þ. Choose parameters as follows: a11 ¼ 0:12;r1 ¼ 0:07; b11 ¼ 0:05;m1 ¼ 0:09; a22 ¼ 0:1; r2 ¼ 0:09; b22 ¼ 0:12;m2 ¼ 0:15: We can see the basic reproduction numbers in patches1 and 2 are R1;0 ¼ 0:9524o1 and R2;0 ¼ 0:8888o1; respectively. Sothe disease dies out in both patches (see Fig. 1).
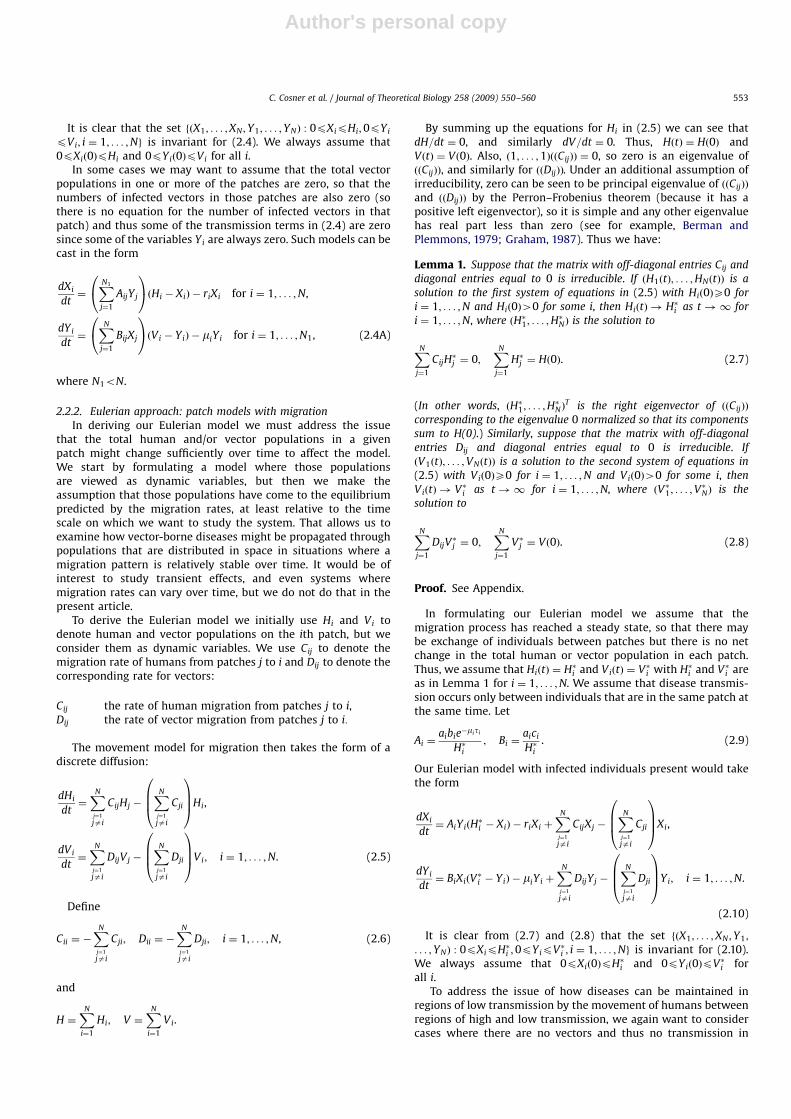
Now we want to see how the disease becomes endemic in bothpatches when humans move between these two patches. Noticethat aij relates to the fraction of time a human resident in patch i
spends visiting patch j; during that time he can be infected inpatch j and becomes infectious once he returns to patch i: We cansee that the disease becomes endemic in both patches (see Fig. 2)when humans move back and forth between these two patches.
ARTICLE IN PRESS
0
0.05
0.1
0.15
0.2
0.25
0.3
0 50 100 150 200 250 300 350 400 450 500t - time
x1
y1
0
0.05
0.1
0.15
0 50 100 150 200 250 300 350 400 450 500t - time
x2
y2
Fig. 2. When humans move between the two patches, the disease becomes endemic in both patches (top: patch 1; bottom: patch 2). Here a12 ¼ 0:1; a21 ¼ 0:05.
C. Cosner et al. / Journal of Theoretical Biology 258 (2009) 550–560 557

Author's personal copy
5. Conclusions
The models in (2.4), (2.4A), (2.10), (2.10A) describe vector-borne disease systems on networks of patches. Those patches mayreflect physical locations, socio-economic-behavioral classes, orother features that distinguish subpopulations of people orvectors. The models include terms describing the movement ofhumans and vectors between patches. The models can beparameterized in terms of coefficients that have clear biologicalinterpretations and which in principle could be measured.The mathematical analysis shows that the models are coopera-tive systems with simple dynamics. They predict that either thedisease will disappear or that it will become establishedat a unique stable equilibrium, depending on the parameters.Which of these two possibilities will actually occur willdepend on the basic reproduction number R0, which iswell defined for the models. The value of R0 for any of themodels can be characterized as the spectral radius of anassociated matrix and can be explicitly calculated in simple cases.Finally, since the modeling framework presented here is basedon systems of coupled ordinary differential equations it may beeasily expanded to explore optimal disease control in spatialenvironment using well established additional mathematicallytechniques.
Analysis of models with two patches but with pathogentransmission only in one patch shows that if there is sufficientmovement of humans between patches the disease can besustained in the patch with no transmission. This suggests thata possible explanation for observations that vector-borne diseasespersist in some patches where mosquito densities and hencedisease transmission rates are very low is that there is eitherimmigration of humans from patches with higher transmission orthat humans residing in patches with low transmission commuteto patches with high transmission. The strength of those effectsdepends on the rate of migration or the fraction of time spent bycommuters in patches with high transmission rates.
Acknowledgment
We would like to thank the referee for his/her helpfulcomments.
Appendix A
Proof of Lemma 1. Choose c04maxf�Cii : i ¼ 1; . . . ;Ng. Thematrix ððCijÞÞ þ c0I is irreducible with positive diagonal elements,so it is primitive (see Graham, 1987, pp. 137–138) and hence thePerron–Frobenius theorem applies to it. It follows that ððCijÞÞ þ c0I
has a principal eigenvalue characterized by having a positiveeigenvector, and all other eigenvalues have real parts smaller thanthat principal eigenvalue. By the definition of the entries Cii, thevector ð1; . . . ;1Þ is a left eigenvector of ððCijÞÞ þ c0I correspondingto the eigenvalue c0, so c0 must be the principal eigenvalue ofððCijÞÞ þ c0I. Since every eigenvalue of ððCijÞÞ is equal to l� c0,where l is an eigenvalue of ððCijÞÞ þ c0I, it follows that 0 is aneigenvalue of ððCijÞÞ with positive left and right eigenvectors andthat all other eigenvalues of ððCijÞÞ must have real parts less thanzero. Any non-negative non-trivial initial data ðH1ð0Þ; . . . ;HNð0ÞÞhas a positive component in the direction of the right eigenvectorðH�1; . . . ;H
�NÞ corresponding to the eigenvalue 0 of ððCijÞÞ. Since all
other eigenvalues of ððCijÞÞ have negative real parts andHðtÞ ¼
PNi¼1 HiðtÞ ¼ Hð0Þ, the conclusion of the lemma follows for
ðH1; . . . ;HNÞ. The proof for ðV1; . . . ;VNÞ is the same. &
Proof of Theorem 2. The proof will make use of results and ideasfrom van den Driessche and Watmough (2002) as well as someother results on matrices and monotone dynamical systems. Wewill briefly review the key ideas from van den Driessche andWatmough (2002) as they apply in this context. The modelstreated by van den Driessche and Watmough (2002) areformulated as
dxi
dt¼ f iðxiÞ ¼FiðxÞ �ViðxÞ, (A.1)
where x ¼ ðx1; . . . ; xnÞ, Fi is the rate at which new infections occurin compartment i and �Vi is the rate of movement of individualsinto or out of that compartment by other means. The rate Vi isbroken down further as Vi ¼Vþi �V�i where Vþi ;V
�
i are ratesof individuals entering and leaving compartment i, respectively.The linearizations of F and V at the disease-free equilibrium aredenoted by F and V , respectively. In our situation, n ¼ 2N and eachcompartment describes the number of infected humans or vectorson one of the N patches. All compartments contain only infectedindividuals. We have x ¼ ðX1; . . . ;XN ;Y1; . . . ;YNÞ. Then FiðxÞ ¼
AiYiðH�i � XiÞ for i ¼ 1; . . . ;N and FiðxÞ ¼ Bi�NXi�NðV
�i�N � Yi�NÞ for
i ¼ N þ 1; . . . ;2N; Vþi ¼PN
jaij¼1 CijXj for i ¼ 1; . . . ;N and Vþi ¼PN
jai�Nj¼1 Dði�NÞjYj for i ¼ N þ 1; . . . ;2N; and V�i ¼ ðri þ ð
PN
jaij¼1 CjiÞÞXi
for i ¼ 1; . . . ;N and V�i ¼ ðmi�N þ ðPN
jai�Nj¼1 Djði�NÞÞÞYi�N for
i ¼ N þ 1; . . . ;2N.
The disease-free equilibrium in our models is ð0; . . . ;0Þ. The
hypotheses A1–A4 of van den Driessche and Watmough (2002)
can be readily verified, at least for ðX;YÞ in the invariant region
fðX1; . . . ;XN ;Y1; . . . ;YNÞ : 0pXipH�i ;0pYipV�i ; i ¼ 1; . . . ;Ng, from
the forms of F and V. The key hypothesis (A5) of van den
Driessche and Watmough (2002) is that if F is set to zero then all
the eigenvalues of the Jacobian of what remains in f ðxÞ evaluated
at the disease-free equilibrium have negative real parts. In our
case the eigenvalues in question are those of �V . The matrix V
consists of two N � N blocks on the diagonal and zeroes
elsewhere. The blocks are ððCij � ridijÞÞ and ððDij � midijÞÞ where dij
is the Kronecker delta. Let C ¼ ððCijÞÞ. It follows as in the proof of
Lemma 1 that C � ððridijÞÞ has an eigenvalue s0 that is real,
characterized by having a positive eigenvector ~f, and is larger
than the real part of any other eigenvalue of C � ððridijÞÞ. Let
r0 ¼ minfri : i ¼ 1; . . . ;Ng. We have ð½C � ððridijÞ�~fÞi ¼ s0fi so
that ðC~fÞi ¼ ðri þ s0Þ~f, so componentwise C~fXðr0 þ s0Þ
~f. It
follows from Lemma 2 of Cantrell et al. (2007) that C has a real
eigenvalue greater than or equal to r0 þ s0 with non-
negative non-zero eigenvector. If r0 þ s040 that would contradict
the fact that 0 is the eigenvalue of C with largest real part, as
established in the proof of Lemma 1. It follows that we must have
s0p� r0o0 so the eigenvalues of C � ððridijÞÞ must all have
negative real parts, as required. (It then follows from Berman and
Plemmons (1979, p. 135, G20) that �C þ ððridijÞÞ is a non-singular
M-matrix.)
A similar analysis yields the corresponding conclusion for
�Dþ ððmidijÞÞ. Thus, Lemma 1 and Theorem 2 of van den Driessche
and Watmough (2002) apply to our model (2.10). In particular, V is
a non-singular M-matrix, and the basic reproduction number is
the spectral radius of FV�1, that is, R0 ¼ rðFV�1Þ. Using
A� ¼ ððAiH�i dijÞÞ;B
�¼ ððBiM
�i dijÞÞ;C
�¼ ððCij � ridijÞÞ, and
D� ¼ ððDij � midijÞÞ, we have that
F ¼0 A�
B� 0
!(A.2)
ARTICLE IN PRESS
C. Cosner et al. / Journal of Theoretical Biology 258 (2009) 550–560558
Author's personal copy
and
V ¼�C� 0
0 �D�
!. (A.3)
It follows that
FV�1¼
0 �A�D��1
�B�C��1 0
!. (A.4)
To obtain a formulation analogous to that given by Hasibeder and
Dye (1988) and quoted in Theorem 1, observe that
ðFV�1Þ2¼
A�D��1B�C��1 0
0 B�C��1A�D��1
!, (A.5)
so that R20 ¼ rðA�D��1B�C��1
Þ.
If R041 then the disease-free equilibrium is unstable. The
Jacobian of linearization of the model (2.10) around the disease-
free equilibrium is J ¼ F � V . Again, the proof of Lemma 1 implies
that F � V has a principal eigenvalue s0 that is real, larger than the
real part of any other eigenvalue, and which has a positive
eigenvector. In the case where (0,y,0) is unstable, we have s040.
It is easy to see in that case that if ~c is a positive eigenvector for s0
then for the model (2.10) written in the notation of (A.1) we have
f ið�~cÞ40 for all i as long as �40 is sufficiently small. It then
follows by the order preserving property of (2.10) that a solution
to (2.10) with initial data �~c will increase componentwise toward
an equilibrium ðX�;Y�Þ ¼ ðX�1; . . . ;X�N ;Y
�1; . . . ;Y
�NÞ of (2.10) that is
the minimal positive equilibrium of (2.10) in the invariant set
fðX1; . . . ;XN ;Y1; . . . ;YNÞ : 0pXipH�i ;0pYipV�i ; i ¼ 1; . . . ;Ng. (See
Cantrell and Cosner, 2003, Section 3.6 for further discussion and
references.) Similarly, if we let~x ¼ ðH�1; . . . ;H�N ;V
�1; . . . ;V
�NÞwe have
f ið~xÞo0 for all i, so that the solution to (2.10) with initial data ~x
will decrease componentwise toward an equilibrium ðX��;Y��Þ
that is the maximal equilibrium of (2.10) in the invariant set
fðX1; . . . ;XN ;Y1; . . . ;YNÞ : 0pXipH�i ;0pYipV�i ; i ¼ 1; . . . ;Ng.
The equilibrium ðX�;Y�Þ (and any other positive equilibrium)
must satisfy
C� ððAiðH�i � X�i ÞdijÞÞ
ððBiðV�i � Y�i ÞdijÞÞ D�
!X�
Y�
� �¼
0
0
� �. (A.6)
In the invariant region for (2.10) the off-diagonal terms in the
matrix in (A.6) are non-negative, and the matrices C�;D� are
irreducible, so again as in the Proof of Lemma 1 the matrix in (A.6)
has a principal eigenvalue that is characterized by having a
positive eigenvector. In this case ðX�;Y�ÞT is the eigenvector and
the eigenvalue is 0. For any other positive equilibrium ðX���;Y���Þ
the relation analogous to (A.6) with ðX�;Y�Þ replaced by ðX���;Y���Þ
would necessarily hold, implying that the matrix
C� ððAiðH�i � X���i ÞdijÞÞ
ððBiðV�i � Y���i ÞdijÞÞ D�
!(A.7)
would also have principal eigenvalue 0. However, unless ðX�;Y�Þ ¼
ðX���;Y���Þ that is impossible because the principal eigenvalue is
increasing relative to the entries of the matrix. Hence the minimal
equilibrium ðX�;Y�Þmust be the unique equilibrium. (This proof is
entirely analogous to that of the corresponding result in
continuous space as in Cantrell and Cosner, 2003, Proposition
3.3.) In particular, the minimal and maximal equilibria must be
the same, so that the unique positive equilibrium is globally stable
for solutions of (2.10) with positive initial data in the invariant set
fðX1; . . . ;XN ;Y1; . . . ;YNÞ : 0pXipH�i ;0pYipV�i ; i ¼ 1; . . . ;Ng.
If R0o1 then the disease-free equilibrium is stable and the
principal eigenvalue s0 of the Jacobian of linearization of the
model (2.10) around the disease-free equilibrium is negative. It
follows that since the entries of the matrix in (A.7) at any positive
equilibrium ðX���;Y���Þ are less than or equal to those of the
linearization around the disease-free equilibrium ð0; . . . ;0Þ, the
matrix in (A.7) also must have a principal eigenvalue that is
negative. On the other hand, any positive equilibrium ðX���;Y���Þ
must satisfy (A.6) with ðX�;Y�Þ replaced by ðX���;Y���Þ, so if such
an equilibrium exists then the principal eigenvalue of the matrix
in (A.7) must be zero, which is a contradiction. Thus, there can be
no positive equilibrium, so the solution to (2.10) with initial data~xwill decrease toward the disease-free equilibrium. It then follows
from the order preserving property of the system that the disease-
free equilibrium is globally stable in the invariant set
fðX1; . . . ;XN ;Y1; . . . ;YNÞ : 0pXipH�i ;0pYipV�i ; i ¼ 1; . . . ;Ng. &
References
Allen, L.J.S., Bolker, B.M., Lou, Y., Nevai, A.L., 2007. Asymptotic profiles of the steadystates for an SIS epidemic patch model. SIAM Journal of Applied Mathematics67, 1283–1309.
Arino, J., 2009. Diseases in metapopulations. In: Ma, Z., Zhou, Y., Wu, J. (Eds.),Modeling and Dynamics of Infectious Diseases. Series in ContemporaryApplied Mathematics, vol. 11. World Scientific, Singapore, pp. 65–123.
Arino, J., van den Driessche, P., 2003. A multi-city epidemic model. MathematicalPopulation Studies 10, 175–193.
Arino, J., Davis, J.R., Hartley, D., Jordan, R., Miller, J.M., van den Driessche, P., 2005. Amulti-species epidemic model with spatial dynamics. Mathematical Medicineand Biology 22, 129–142.
Auger, P., Kouokam, E., Sallet, G., Tchuente, M., Tsanou, B., 2008. The Ross–Macdo-nald model in a patchy environment. Mathematical Biosciences 216, 123–131.
Bartlett, M.S., 1956. Deterministic and stochastic models for recurrent epidemics.In: Proceedings of the Third Berkeley Symposium on Mathematical Statisticsand Probability, vol. IV. University of California Press, pp. 81–109.
Berman, A., Plemmons, J., 1979. Nonnegative Matrices in the MathematicalSciences. Academic Press, New York.
Cantrell, R.S., Cosner, C., 2003. Spatial Ecology via Reaction-Diffusion Equations.Series in Mathematical and Computational Biology. Wiley, Chichester, UK.
Cantrell, R.S., Cosner, C., DeAngelis, D., Padron, V., 2007. The ideal free distributionas an evolutionarily stable strategy. Journal of Biological Dynamics 1, 249–271.
Carter, R., Mendis, K.N., Roberts, D., 2000. Spatial targeting of interventions againstmalaria. Bulletin of the World Health Organization 78 (12), 1401–1411.
Dhirasakdanon, T., Thieme, H., van den Driessche, P., 2007. A sharp threshold fordisease persistence in host metapopulations. Journal of Biological Dynamics 1,363–378.
Domarle, O., Razakandrainibe, R., Rakotomalala, E., Jolivet, L., Randremanana, R.V.,Rakotomanana, F., Ramarokoto, C.E., Soares, J.-L., Ariey, F., 2006. Seroprevalenceof malaria in inhabitants of the urban zone of Antananarivo, Madagascar.Malaria Journal 5, 106 hhttp://www.malariajournal.com/content/5/1/106i.
Dushoff, J., Levin, S.A., 1995. The effects of population heterogeneity on diseasespread. Mathematical Biosciences 128, 25–40.
Dye, C., Hasibeder, G., 1986. Population dynamics of mosquito-borne disease:effects of flies which bite some people more frequently than others.Transactions of the Royal Society of Tropical Medicine and Hygiene 80, 69–77.
Gaff, H.D., Gross, L.J., 2007. Modeling tick-borne disease: a metapopulation model.Bulletin of Mathematical Biology 69, 265–288.
Graham, A., 1987. Nonnegative Matrices and Applicable Topics in Linear Algebra.Wiley, New York.
Gratz, N.G., 1999. Emerging and resurging vector-borne diseases. Annual Review ofEntomology 44, 51–75.
Hasibeder, G., Dye, C., 1988. Population dynamics of mosquito-borne disease:persistence in a completely heterogeneous environment. Theoretical Popula-tion Biology 33, 31–53.
Hethcote, H.W., 1978. An immunization model for a heterogeneous population.Theoretical Population Biology 14, 338–349.
Hethcote, H.W., Thieme, H.R., 1985. Stability of endemic equilibrium in epidemicmodels with subpopulations. Mathematical Biosciences 75, 205–227.
Hsieh, Y.-H., van den Driessche, P., Wang, L., 2007. Impact of travel between patchesfor spatial spread of disease. Bulletin of Mathematical Biology 69, 1355–1375.
Kileen, G.F., Knols, B.G., Gu, W., 2003. Taking malaria transmission out of thebottle: implications of mosquito dispersal for vector-control interventions. TheLancet Infectious Diseases 3, 297–303.
Lajmanovich, A., Yorke, J.A., 1976. A deterministic model for gonorrhea in anonhomogeneous population. Mathematical Biosciences 28, 221–236.
Liu, R., Shuai, J., Wu, J., Zhu, H., 2006. Modeling spatial spread of West Nile virusand impact of directional dispersal of birds. Mathematical Biosciences andEngineering 3, 145–160.
ARTICLE IN PRESS
C. Cosner et al. / Journal of Theoretical Biology 258 (2009) 550–560 559

Author's personal copy
Lloyd, A.L., May, R.M., 1996. Spatial heterogeneity in epidemic models. Journal ofTheoretical Biology 179, 1–11.
Martens, P., Hall, L., 2000. Malaria on the move: human population movement andmalaria transmission. Emerging Infectious Diseases 6, 103–109.
Osorio, O., Todd, J., Bradley, D.J., 2004. Travel histories as risk factors in the analysisof urban malaria in Colombia. American Journal of Tropical Medicine andHygiene 71, 380–386.
Rodriguez, D.J., Torres-Sorando, L., 2001. Models for infectious diseases in spatiallyheterogeneous environments. Bulletin of Mathematical Biology 63, 547–571.
Ronald, L.A., Kenny, S.L., Klinkenberg, E., Akoto, A.O., Boakye, I., Barnish, G.,Donnelly, M.J., 2006. Malaria and anaemia among children in two communitiesof Kusami, Ghana: a cross-sectional survey. Malaria Journal 5, 105 hhttp://www.malariajournal.com/content/5/1/105i.
Ruan, S., Wang, W., Levin, S.A., 2006. The effect of global travel on the spread ofSARS. Mathematical Biosciences and Engineering 3, 205–218.
Rvachev, L.A., Longini, I.M., 1985. A mathematical model for the global spread ofinfluenza. Mathematical Biosciences 75, 3–22.
Salmani, M., van den Driessche, P., 2006. A model for disease transmission in apatchy environment. Discrete and Continuous Dynamical Systems—Series B 6,185–202.
Sattenspiel, L., Dietz, K., 1995. A structured epidemic model incorporatinggeographic mobility among regions. Mathematical Biosciences 128, 71–91.
Smith, D.L., McKenzie, F.E., 2004. Statics and dynamics of malaria infection inAnopheles mosquitoes. Malaria Journal 3, 13 hhttp://www.malariajournal.com/content/3/1/13i.
Smith, D.L., Dushoff, J., McKenzie, F.E., 2004. The risk of a mosquito-borne infectionin a heterogeneous environment. PLoS Biology 2, 1957–1963, e368.
Smith, H.L., 1995. Monotone Dynamical Systems. American Mathematical Society,Providence, RI.
Sutherst, R.W., 2004. Global change and human vulnerability to vector-bornedisease. Clinical Microbiology Review 17, 136–173.
Travis, C.C., Lenhart, S.M., 1987. Eradication of infectious diseases in heterogeneouspopulations. Mathematical Biosciences 83, 191–198.
van den Driessche, P., Watmough, J., 2002. Reproduction numbers and sub-threshold endemic equilibria for compartmental models of disease transmis-sion. Mathematical Biosciences 180, 29–48.
Wang, W., 2007. Epidemic models with population dispersal. In: Takeuchi, Y., Sato,K., Iwasa, Y. (Eds.), Mathematics for Life Science and Medicine. Springer, Berlin,pp. 67–95.
Wang, W., Mulone, G., 2003. Threshold of disease transmission in a patchenvironment. Journal of Mathematical Analysis and Applications 285,321–335.
Wang, W., Zhao, X.-Q., 2004. An epidemic model in a patchy environment.Mathematical Biosciences 190, 97–112.
ARTICLE IN PRESS
C. Cosner et al. / Journal of Theoretical Biology 258 (2009) 550–560560


![ROBERT STEPHEN CANTRELL, CHRIS COSNER, …arXiv:1608.08314v2 [q-bio.PE] 3 Nov 2016 EVOLUTION OF NATAL DISPERSAL IN SPATIALLY HETEROGENOUS ENVIRONMENTS ROBERT STEPHEN CANTRELL, CHRIS](https://img.pdfslide.net/doc/110x75/5e3fc2294dbdec20d96c1bf9/robert-stephen-cantrell-chris-cosner-arxiv160808314v2-q-biope-3-nov-2016.jpg)