Embed Size (px)
Citation preview

This article appeared in a journal published by Elsevier. The attachedcopy is furnished to the author for internal non-commercial researchand education use, including for instruction at the authors institution
and sharing with colleagues.
Other uses, including reproduction and distribution, or selling orlicensing copies, or posting to personal, institutional or third party
websites are prohibited.
In most cases authors are permitted to post their version of thearticle (e.g. in Word or Tex form) to their personal website orinstitutional repository. Authors requiring further information
regarding Elsevier’s archiving and manuscript policies areencouraged to visit:
http://www.elsevier.com/copyright
Author's personal copy
Analysis of the impact of the forest fires in August 2007 on air qualityof Athens using multi-sensor aerosol remote sensing data,meteorology and surface observations
Yang Liu c,*, Ralph A. Kahn a, Archontoula Chaloulakou b, Petros Koutrakis c
a NASA Goddard Space Flight Center, Greenbelt, MD 20771, USAb National Technical University of Athens, Department of Chemical Engineering, Heroon Polytechniou 9, GR-15780 Zografos, Athens, Greecec Department of Environmental and Health, Harvard University, School of Public Health, Boston, MA 02215, USA
a r t i c l e i n f o
Article history:Received 3 October 2008Received in revised form6 April 2009Accepted 6 April 2009
Keywords:MISR plume heightMODISAODOMIGreek forest firesHYSPLIT
a b s t r a c t
Data from multiple satellite remote sensors are integrated with ground measurements and meteoro-logical data to study the impact of Greek forest fires in August 2007 on the air quality in Athens. Twopollution episodes were identified by ground PM10 measurements between August 23 and September 4.In the first episode, Evia and Peloponnese fires contributed substantially to the air pollution levels inAthens. In the second episode, transport of industrial pollution from Italy and Western Europe as well asforest fires in Albania contributed substantially to the air pollution levels in Athens. Local air pollutionsources also contributed to the observed particle levels during these episodes. Satellite data providevaluable insights into the spatial distribution of particle concentrations, thus they can be used identifypollution sources. In spite of a few weaknesses in current satellite data products identified in thisanalysis, combining satellite aerosol remote sensing data with trajectory models and ground measure-ments is a powerful tool to study intensive particle pollution events such as forest fires.
� 2009 Elsevier Ltd. All rights reserved.
1. Introduction
From late August to early September 2007, Greece suffered theworst forest fires in the past 50 years. A total of 2700 square kilo-meters of forest, olive groves and farmland were destroyed by thefires, and 84 people, including firefighters, lost their lives. In addi-tion to the direct fire damage, these devastating fires producedlarge quantities of gaseous air pollutants and particles (PM10 andPM2.5, airborne particles smaller than 10 mm and 2.5 mm in size,respectively) dispersed over the region. Athens, the capital ofGreece with a population of over four million inhabitants, wasaffected by both the Peloponnese and Evia fires. In addition tocausing deterioration of air quality, fire smoke has adverse healtheffects on exposed populations, such as increased respiratorydiseases, asthma, bronchitis, and eye irritation (Kunzli et al., 2006;Naeher et al., 2007). Exposure severity depends upon wind direc-tion, fire intensity, and precipitation, and forest fire emissions can
also be mixed with those from other air pollution sources. There-fore, it is often difficult to reliably assess the spatial and temporalextent of population exposure to smoke emissions solely fromground-based air quality measurements.
Beginning in 1999, the National Aeronautics and Space Admin-istration (NASA) launched a series of Earth Observing System (EOS)satellite sensors, including the Multiangle Imaging SpectroRadi-ometer (MISR) (Diner et al., 2002) and the Moderate ResolutionImaging Spectroradiometer (MODIS) (Salomonson et al., 1989).Both sensors can measure aerosol abundance and size over bothland and water with nearly global coverage at moderate spatialresolutions. In addition, MISR is able to provide information onaerosol type and plume top heights (Kahn et al., 2008). Particleinformation retrieved by satellite sensors may be suitable formonitoring the spatial and temporal trends of particle concentra-tions over large geographical areas. Dense aerosol plumes are easilyobservable and visualized through satellite remote sensing, makingit possible to monitor their transport and transformations. Theextensive spatial coverage satellite imaging offers is of particularbenefit in areas with limited numbers of surface observations.Aerosol information retrieved by MISR and MODIS can providea quantitative measure of aerosol event severity and potential airquality impact. The Ozone Monitoring Instrument (OMI), which
* Corresponding author. Present address: Department of Environmental andOccupational Health, Emory University, Rollins School of Public Health, 1518 CliftonRoad NE, Atlanta, GA 30322, USA. Tel.: þ1 404 7272131; fax: þ1 404 7278744.
E-mail address: [email protected] (Y. Liu).
Contents lists available at ScienceDirect
Atmospheric Environment
journal homepage: www.elsevier .com/locate/a tmosenv
1352-2310/$ – see front matter � 2009 Elsevier Ltd. All rights reserved.doi:10.1016/j.atmosenv.2009.04.010
Atmospheric Environment 43 (2009) 3310–3318
Author's personal copy
continues the Total Ozone Mapping Spectrometer (TOMS)measurements, was launched in 2004 aboard the EOS Aura satellitewith daytime equator crossing at approximately 1:30 p.m. localtime (Schoeberl et al., 2006). The OMI instrument can distinguishbetween aerosol types, such as smoke, dust, and sulfates, andmeasures cloud pressure and coverage, which provide data toderive tropospheric ozone. OMI, in conjunction with other Aurainstruments, provides global mapping of several key troposphericconstituents including aerosols. Together with surface observationsand meteorological information, these satellite sensors providea better understanding of the spatial, temporal and chemicalcharacteristics of the aerosol than can any single remote or surface-based observation. In this paper, we combine aerosol and meteo-rological measurements from multiple sources to characterize twoparticle pollution episodes identified by ground measurementsbetween August 23 and September 3, 2007 in Athens. The objec-tives of this study are: (1) to assess the contribution of the Greekforest fires to particle pollution levels during these two episodes inAthens by combining satellite aerosol data, meteorological modeling,and ground measurements; and (2) to evaluate the accuracy andvalue of various satellite data products under these conditions.
2. Data and methods
The data used in this analysis consist of satellite images, satel-lite-retrieved aerosol optical depth and plume top heights, groundobservations of particulate matter concentrations, and air masstrajectories calculated from assimilated meteorology. Each datasource is described briefly below.
2.1. Ground air quality monitoring data
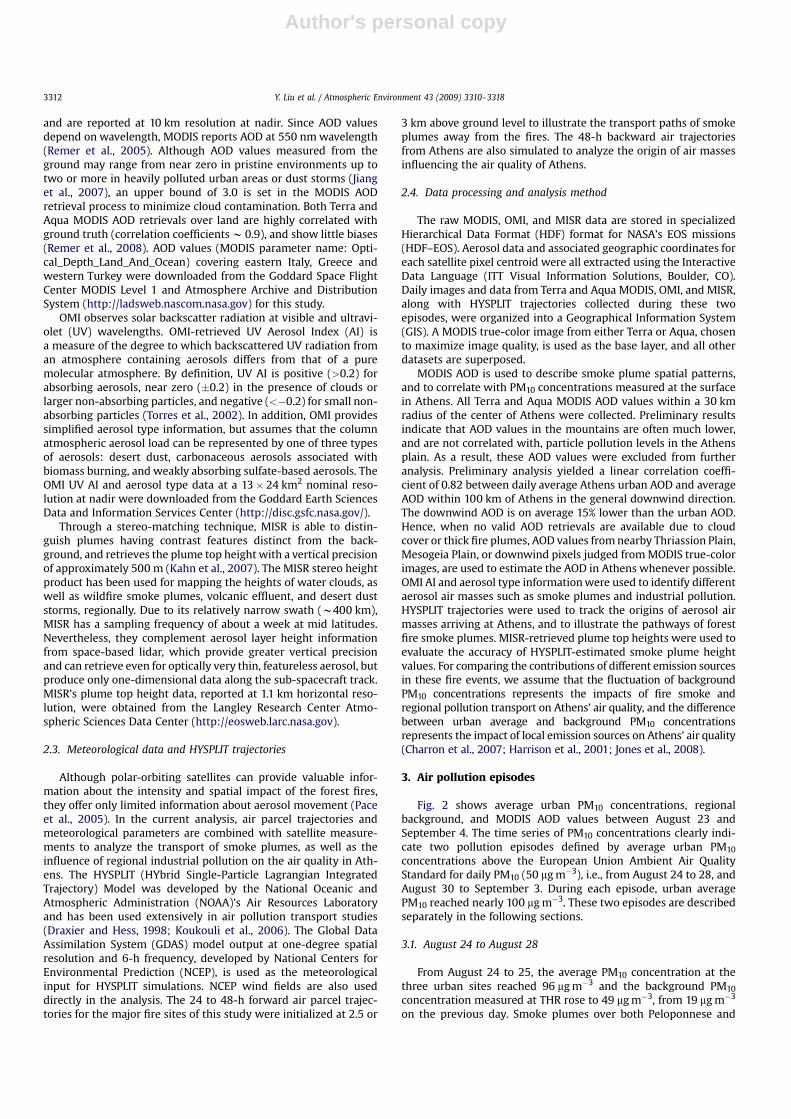
The Athens Basin is surrounded by high altitude terrain(over 1000 m asl) to the north, east, and southeast. Daily PM10
concentrations were collected at four sites (ARI, LYK, MAR, andTHR) in this region (Fig. 1). A detailed description of these sites isgiven elsewhere (Grivas et al., 2008). Briefly, the background
station of THR is located in a remote area to the north. LYK, ARI andMAR measure suburban and urban air pollution levels. Calculationsbased on data of 2001–2004 show that the three sites have similarmedian daily PM10 concentrations, with MAR being slightly cleanerthan LYK and ARI (Grivas et al., 2008). Previous research indicatesthat traffic emissions are the dominant air pollution source inAthens (Chaloulakou et al., 2003; Grivas et al., 2008). Since MODISAOD represents the average particle concentration within the10�10 km2 pixel cell, it is more appropriate to compare itwith regional average PM10 concentrations. Therefore, PM10
concentrations from the three traffic-affected sites were averaged,to represent urban pollution levels over existing backgroundconcentrations produced by local primary emissions.
2.2. Satellite datasets
The MODIS instruments, aboard both the EOS Terra and Aquasatellites, cross the equator on the day side at approximately10:30 a.m. and 1:30 p.m. local time, respectively (Remer et al.,2005). MODIS red–green–blue true-color images at 250 m resolu-tion were downloaded from the MODIS Rapid Response Systemwebsite (http://rapidfire.sci.gsfc.nasa.gov/subsets/). Active firelocations at 1-km resolution, derived from MODIS 4 mm radiances,are indicated as black polygons on the images (Giglio et al., 2003).These images are a valuable resource for tracking fires, as they aregenerated in near-real-time over Earth’s landmasses. A dimen-sionless indicator of particle abundance, AOD is defined as theintegral of aerosol extinction coefficients along the vertical atmo-spheric column from the ground to top of the atmosphere. Whenparticle composition, vertical profiles, and atmospheric humidityare constant, AOD varies linearly with ground level particle massloading (Liu et al., 2005). The currently operating MODIS aerosolretrieval algorithm uses its blue (440 nm), red (670 nm), andthermal infrared (2.13 mm) wavelength bands to identify DenseDark Vegetation pixels, where it preferentially performs aerosolretrievals over land. AOD and other aerosol information are calcu-lated based on simplified assumptions about particle composition,
Fig. 1. Overview of Athens and surrounding areas. Four PM10 monitoring sites (black dots) are labeled.
Y. Liu et al. / Atmospheric Environment 43 (2009) 3310–3318 3311
Author's personal copy
and are reported at 10 km resolution at nadir. Since AOD valuesdepend on wavelength, MODIS reports AOD at 550 nm wavelength(Remer et al., 2005). Although AOD values measured from theground may range from near zero in pristine environments up totwo or more in heavily polluted urban areas or dust storms (Jianget al., 2007), an upper bound of 3.0 is set in the MODIS AODretrieval process to minimize cloud contamination. Both Terra andAqua MODIS AOD retrievals over land are highly correlated withground truth (correlation coefficients w 0.9), and show little biases(Remer et al., 2008). AOD values (MODIS parameter name: Opti-cal_Depth_Land_And_Ocean) covering eastern Italy, Greece andwestern Turkey were downloaded from the Goddard Space FlightCenter MODIS Level 1 and Atmosphere Archive and DistributionSystem (http://ladsweb.nascom.nasa.gov) for this study.
OMI observes solar backscatter radiation at visible and ultravi-olet (UV) wavelengths. OMI-retrieved UV Aerosol Index (AI) isa measure of the degree to which backscattered UV radiation froman atmosphere containing aerosols differs from that of a puremolecular atmosphere. By definition, UV AI is positive (>0.2) forabsorbing aerosols, near zero (�0.2) in the presence of clouds orlarger non-absorbing particles, and negative (<�0.2) for small non-absorbing particles (Torres et al., 2002). In addition, OMI providessimplified aerosol type information, but assumes that the columnatmospheric aerosol load can be represented by one of three typesof aerosols: desert dust, carbonaceous aerosols associated withbiomass burning, and weakly absorbing sulfate-based aerosols. TheOMI UV AI and aerosol type data at a 13� 24 km2 nominal reso-lution at nadir were downloaded from the Goddard Earth SciencesData and Information Services Center (http://disc.gsfc.nasa.gov/).
Through a stereo-matching technique, MISR is able to distin-guish plumes having contrast features distinct from the back-ground, and retrieves the plume top height with a vertical precisionof approximately 500 m (Kahn et al., 2007). The MISR stereo heightproduct has been used for mapping the heights of water clouds, aswell as wildfire smoke plumes, volcanic effluent, and desert duststorms, regionally. Due to its relatively narrow swath (w400 km),MISR has a sampling frequency of about a week at mid latitudes.Nevertheless, they complement aerosol layer height informationfrom space-based lidar, which provide greater vertical precisionand can retrieve even for optically very thin, featureless aerosol, butproduce only one-dimensional data along the sub-spacecraft track.MISR’s plume top height data, reported at 1.1 km horizontal reso-lution, were obtained from the Langley Research Center Atmo-spheric Sciences Data Center (http://eosweb.larc.nasa.gov).
2.3. Meteorological data and HYSPLIT trajectories
Although polar-orbiting satellites can provide valuable infor-mation about the intensity and spatial impact of the forest fires,they offer only limited information about aerosol movement (Paceet al., 2005). In the current analysis, air parcel trajectories andmeteorological parameters are combined with satellite measure-ments to analyze the transport of smoke plumes, as well as theinfluence of regional industrial pollution on the air quality in Ath-ens. The HYSPLIT (HYbrid Single-Particle Lagrangian IntegratedTrajectory) Model was developed by the National Oceanic andAtmospheric Administration (NOAA)’s Air Resources Laboratoryand has been used extensively in air pollution transport studies(Draxier and Hess, 1998; Koukouli et al., 2006). The Global DataAssimilation System (GDAS) model output at one-degree spatialresolution and 6-h frequency, developed by National Centers forEnvironmental Prediction (NCEP), is used as the meteorologicalinput for HYSPLIT simulations. NCEP wind fields are also useddirectly in the analysis. The 24 to 48-h forward air parcel trajec-tories for the major fire sites of this study were initialized at 2.5 or
3 km above ground level to illustrate the transport paths of smokeplumes away from the fires. The 48-h backward air trajectoriesfrom Athens are also simulated to analyze the origin of air massesinfluencing the air quality of Athens.
2.4. Data processing and analysis method
The raw MODIS, OMI, and MISR data are stored in specializedHierarchical Data Format (HDF) format for NASA’s EOS missions(HDF–EOS). Aerosol data and associated geographic coordinates foreach satellite pixel centroid were all extracted using the InteractiveData Language (ITT Visual Information Solutions, Boulder, CO).Daily images and data from Terra and Aqua MODIS, OMI, and MISR,along with HYSPLIT trajectories collected during these twoepisodes, were organized into a Geographical Information System(GIS). A MODIS true-color image from either Terra or Aqua, chosento maximize image quality, is used as the base layer, and all otherdatasets are superposed.
MODIS AOD is used to describe smoke plume spatial patterns,and to correlate with PM10 concentrations measured at the surfacein Athens. All Terra and Aqua MODIS AOD values within a 30 kmradius of the center of Athens were collected. Preliminary resultsindicate that AOD values in the mountains are often much lower,and are not correlated with, particle pollution levels in the Athensplain. As a result, these AOD values were excluded from furtheranalysis. Preliminary analysis yielded a linear correlation coeffi-cient of 0.82 between daily average Athens urban AOD and averageAOD within 100 km of Athens in the general downwind direction.The downwind AOD is on average 15% lower than the urban AOD.Hence, when no valid AOD retrievals are available due to cloudcover or thick fire plumes, AOD values from nearby Thriassion Plain,Mesogeia Plain, or downwind pixels judged from MODIS true-colorimages, are used to estimate the AOD in Athens whenever possible.OMI AI and aerosol type information were used to identify differentaerosol air masses such as smoke plumes and industrial pollution.HYSPLIT trajectories were used to track the origins of aerosol airmasses arriving at Athens, and to illustrate the pathways of forestfire smoke plumes. MISR-retrieved plume top heights were used toevaluate the accuracy of HYSPLIT-estimated smoke plume heightvalues. For comparing the contributions of different emission sourcesin these fire events, we assume that the fluctuation of backgroundPM10 concentrations represents the impacts of fire smoke andregional pollution transport on Athens’ air quality, and the differencebetween urban average and background PM10 concentrationsrepresents the impact of local emission sources on Athens’ air quality(Charron et al., 2007; Harrison et al., 2001; Jones et al., 2008).
3. Air pollution episodes
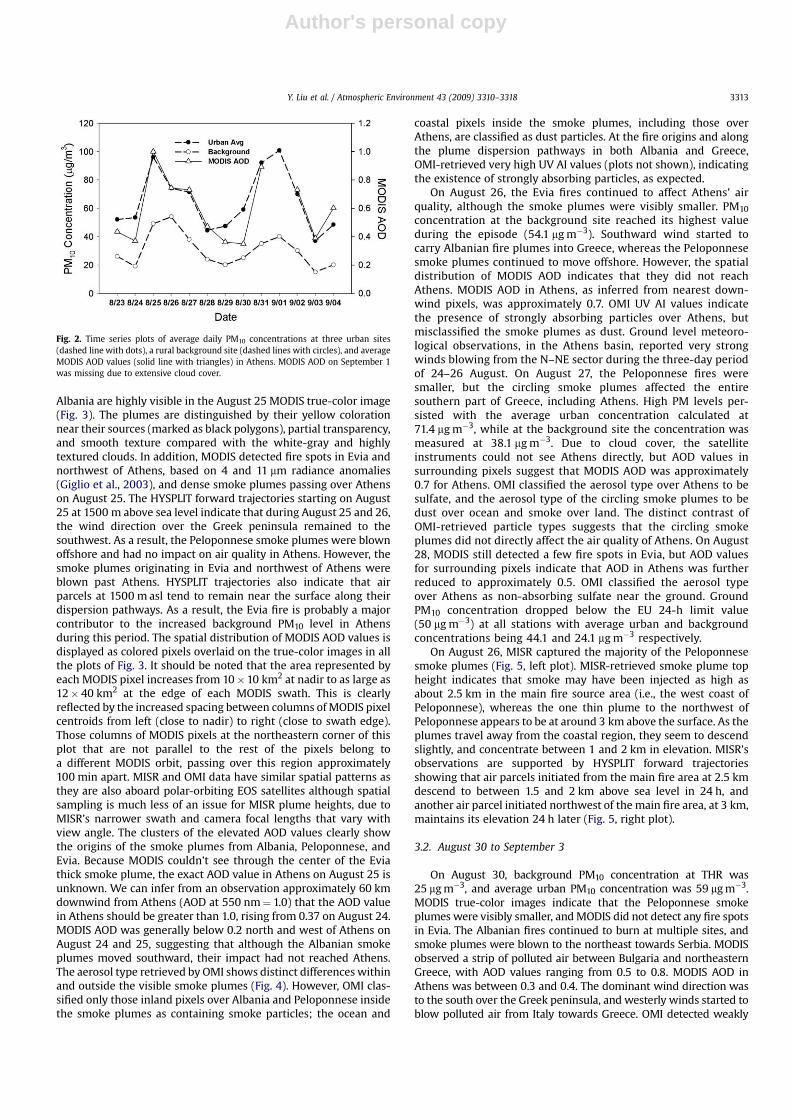
Fig. 2 shows average urban PM10 concentrations, regionalbackground, and MODIS AOD values between August 23 andSeptember 4. The time series of PM10 concentrations clearly indi-cate two pollution episodes defined by average urban PM10
concentrations above the European Union Ambient Air QualityStandard for daily PM10 (50 mg m�3), i.e., from August 24 to 28, andAugust 30 to September 3. During each episode, urban averagePM10 reached nearly 100 mg m�3. These two episodes are describedseparately in the following sections.
3.1. August 24 to August 28
From August 24 to 25, the average PM10 concentration at thethree urban sites reached 96 mg m�3 and the background PM10
concentration measured at THR rose to 49 mg m�3, from 19 mg m�3
on the previous day. Smoke plumes over both Peloponnese and
Y. Liu et al. / Atmospheric Environment 43 (2009) 3310–33183312
Author's personal copy
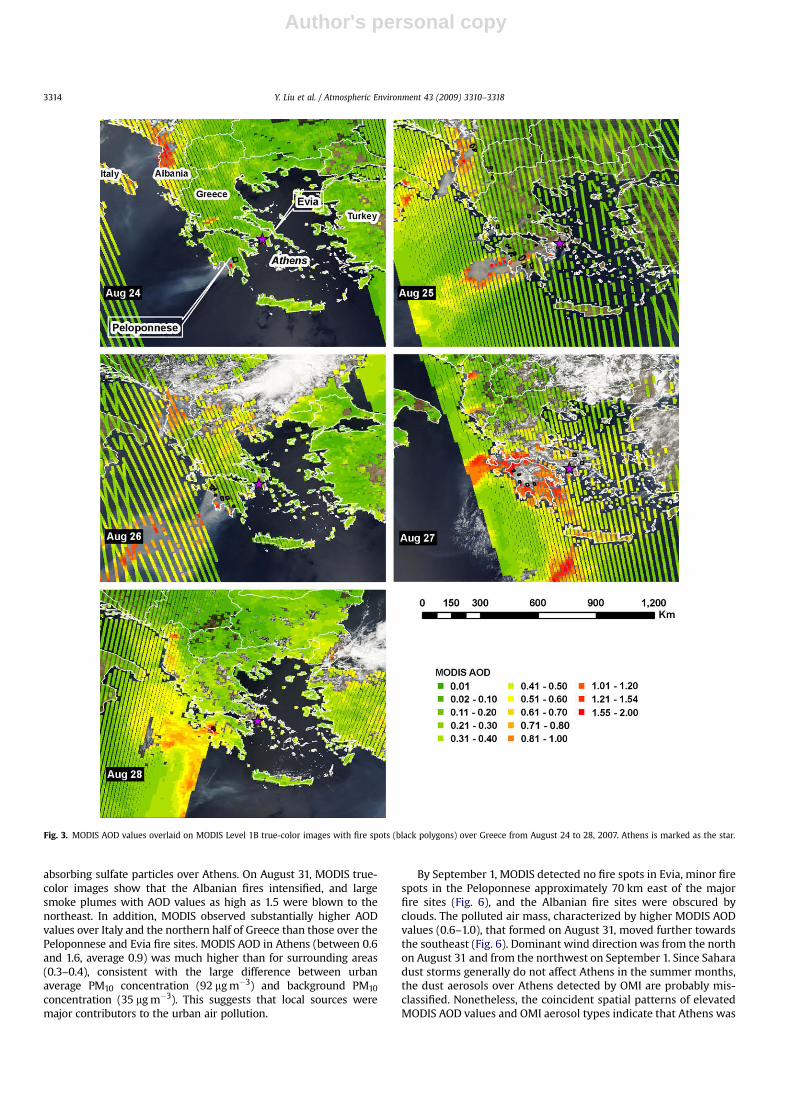
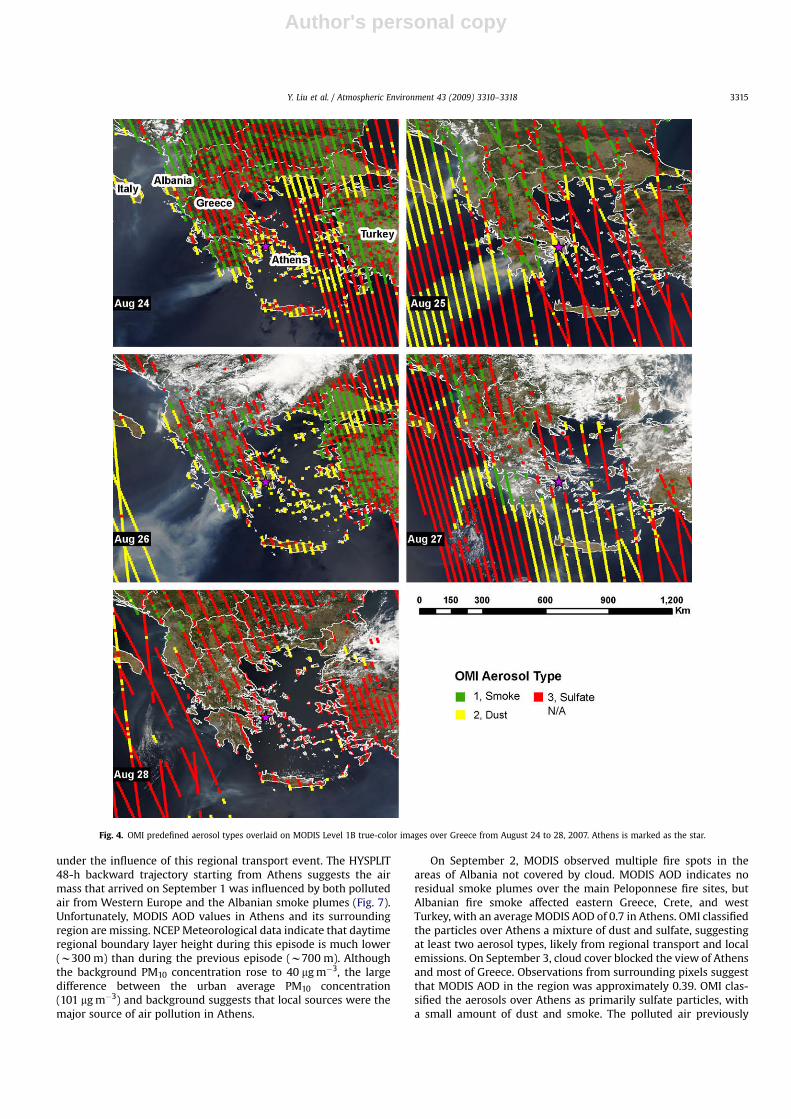
Albania are highly visible in the August 25 MODIS true-color image(Fig. 3). The plumes are distinguished by their yellow colorationnear their sources (marked as black polygons), partial transparency,and smooth texture compared with the white-gray and highlytextured clouds. In addition, MODIS detected fire spots in Evia andnorthwest of Athens, based on 4 and 11 mm radiance anomalies(Giglio et al., 2003), and dense smoke plumes passing over Athenson August 25. The HYSPLIT forward trajectories starting on August25 at 1500 m above sea level indicate that during August 25 and 26,the wind direction over the Greek peninsula remained to thesouthwest. As a result, the Peloponnese smoke plumes were blownoffshore and had no impact on air quality in Athens. However, thesmoke plumes originating in Evia and northwest of Athens wereblown past Athens. HYSPLIT trajectories also indicate that airparcels at 1500 m asl tend to remain near the surface along theirdispersion pathways. As a result, the Evia fire is probably a majorcontributor to the increased background PM10 level in Athensduring this period. The spatial distribution of MODIS AOD values isdisplayed as colored pixels overlaid on the true-color images in allthe plots of Fig. 3. It should be noted that the area represented byeach MODIS pixel increases from 10�10 km2 at nadir to as large as12� 40 km2 at the edge of each MODIS swath. This is clearlyreflected by the increased spacing between columns of MODIS pixelcentroids from left (close to nadir) to right (close to swath edge).Those columns of MODIS pixels at the northeastern corner of thisplot that are not parallel to the rest of the pixels belong toa different MODIS orbit, passing over this region approximately100 min apart. MISR and OMI data have similar spatial patterns asthey are also aboard polar-orbiting EOS satellites although spatialsampling is much less of an issue for MISR plume heights, due toMISR’s narrower swath and camera focal lengths that vary withview angle. The clusters of the elevated AOD values clearly showthe origins of the smoke plumes from Albania, Peloponnese, andEvia. Because MODIS couldn’t see through the center of the Eviathick smoke plume, the exact AOD value in Athens on August 25 isunknown. We can infer from an observation approximately 60 kmdownwind from Athens (AOD at 550 nm¼ 1.0) that the AOD valuein Athens should be greater than 1.0, rising from 0.37 on August 24.MODIS AOD was generally below 0.2 north and west of Athens onAugust 24 and 25, suggesting that although the Albanian smokeplumes moved southward, their impact had not reached Athens.The aerosol type retrieved by OMI shows distinct differences withinand outside the visible smoke plumes (Fig. 4). However, OMI clas-sified only those inland pixels over Albania and Peloponnese insidethe smoke plumes as containing smoke particles; the ocean and
coastal pixels inside the smoke plumes, including those overAthens, are classified as dust particles. At the fire origins and alongthe plume dispersion pathways in both Albania and Greece,OMI-retrieved very high UV AI values (plots not shown), indicatingthe existence of strongly absorbing particles, as expected.
On August 26, the Evia fires continued to affect Athens’ airquality, although the smoke plumes were visibly smaller. PM10
concentration at the background site reached its highest valueduring the episode (54.1 mg m�3). Southward wind started tocarry Albanian fire plumes into Greece, whereas the Peloponnesesmoke plumes continued to move offshore. However, the spatialdistribution of MODIS AOD indicates that they did not reachAthens. MODIS AOD in Athens, as inferred from nearest down-wind pixels, was approximately 0.7. OMI UV AI values indicatethe presence of strongly absorbing particles over Athens, butmisclassified the smoke plumes as dust. Ground level meteoro-logical observations, in the Athens basin, reported very strongwinds blowing from the N–NE sector during the three-day periodof 24–26 August. On August 27, the Peloponnese fires weresmaller, but the circling smoke plumes affected the entiresouthern part of Greece, including Athens. High PM levels per-sisted with the average urban concentration calculated at71.4 mg m�3, while at the background site the concentration wasmeasured at 38.1 mg m�3. Due to cloud cover, the satelliteinstruments could not see Athens directly, but AOD values insurrounding pixels suggest that MODIS AOD was approximately0.7 for Athens. OMI classified the aerosol type over Athens to besulfate, and the aerosol type of the circling smoke plumes to bedust over ocean and smoke over land. The distinct contrast ofOMI-retrieved particle types suggests that the circling smokeplumes did not directly affect the air quality of Athens. On August28, MODIS still detected a few fire spots in Evia, but AOD valuesfor surrounding pixels indicate that AOD in Athens was furtherreduced to approximately 0.5. OMI classified the aerosol typeover Athens as non-absorbing sulfate near the ground. GroundPM10 concentration dropped below the EU 24-h limit value(50 mg m�3) at all stations with average urban and backgroundconcentrations being 44.1 and 24.1 mg m�3 respectively.
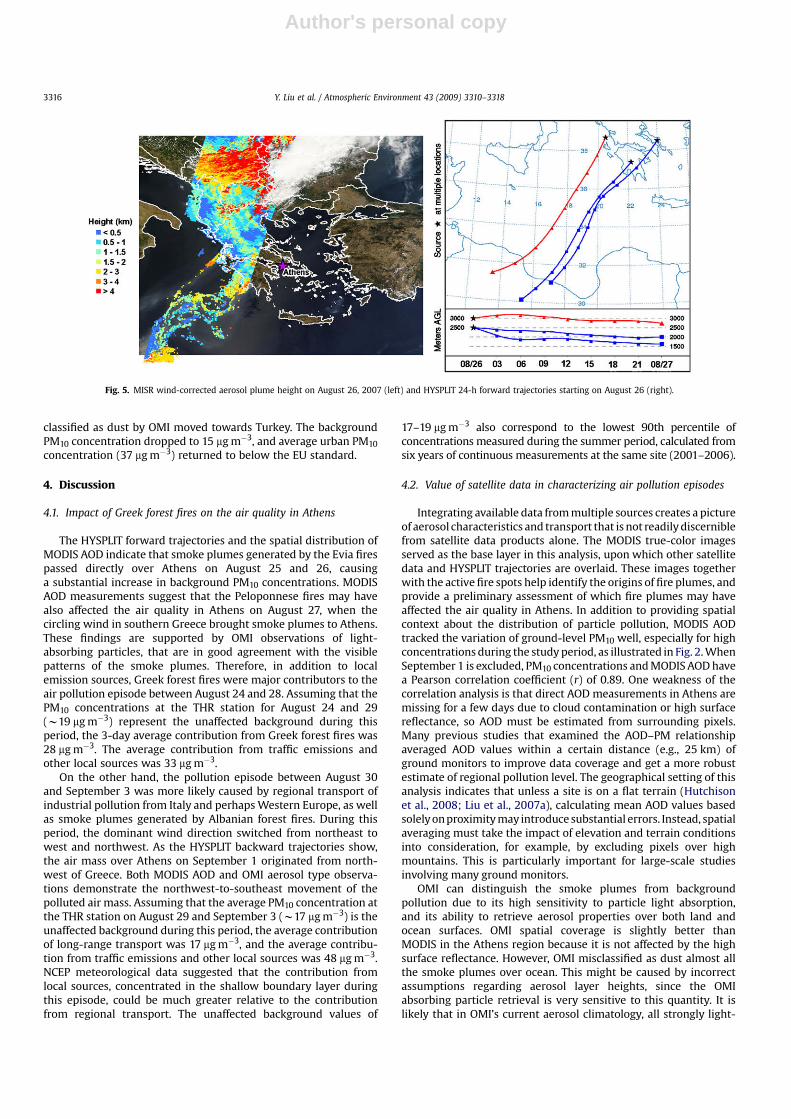
On August 26, MISR captured the majority of the Peloponnesesmoke plumes (Fig. 5, left plot). MISR-retrieved smoke plume topheight indicates that smoke may have been injected as high asabout 2.5 km in the main fire source area (i.e., the west coast ofPeloponnese), whereas the one thin plume to the northwest ofPeloponnese appears to be at around 3 km above the surface. As theplumes travel away from the coastal region, they seem to descendslightly, and concentrate between 1 and 2 km in elevation. MISR’sobservations are supported by HYSPLIT forward trajectoriesshowing that air parcels initiated from the main fire area at 2.5 kmdescend to between 1.5 and 2 km above sea level in 24 h, andanother air parcel initiated northwest of the main fire area, at 3 km,maintains its elevation 24 h later (Fig. 5, right plot).
3.2. August 30 to September 3
On August 30, background PM10 concentration at THR was25 mg m�3, and average urban PM10 concentration was 59 mg m�3.MODIS true-color images indicate that the Peloponnese smokeplumes were visibly smaller, and MODIS did not detect any fire spotsin Evia. The Albanian fires continued to burn at multiple sites, andsmoke plumes were blown to the northeast towards Serbia. MODISobserved a strip of polluted air between Bulgaria and northeasternGreece, with AOD values ranging from 0.5 to 0.8. MODIS AOD inAthens was between 0.3 and 0.4. The dominant wind direction wasto the south over the Greek peninsula, and westerly winds started toblow polluted air from Italy towards Greece. OMI detected weakly
Fig. 2. Time series plots of average daily PM10 concentrations at three urban sites(dashed line with dots), a rural background site (dashed lines with circles), and averageMODIS AOD values (solid line with triangles) in Athens. MODIS AOD on September 1was missing due to extensive cloud cover.
Y. Liu et al. / Atmospheric Environment 43 (2009) 3310–3318 3313
Author's personal copy
absorbing sulfate particles over Athens. On August 31, MODIS true-color images show that the Albanian fires intensified, and largesmoke plumes with AOD values as high as 1.5 were blown to thenortheast. In addition, MODIS observed substantially higher AODvalues over Italy and the northern half of Greece than those over thePeloponnese and Evia fire sites. MODIS AOD in Athens (between 0.6and 1.6, average 0.9) was much higher than for surrounding areas(0.3–0.4), consistent with the large difference between urbanaverage PM10 concentration (92 mg m�3) and background PM10
concentration (35 mg m�3). This suggests that local sources weremajor contributors to the urban air pollution.
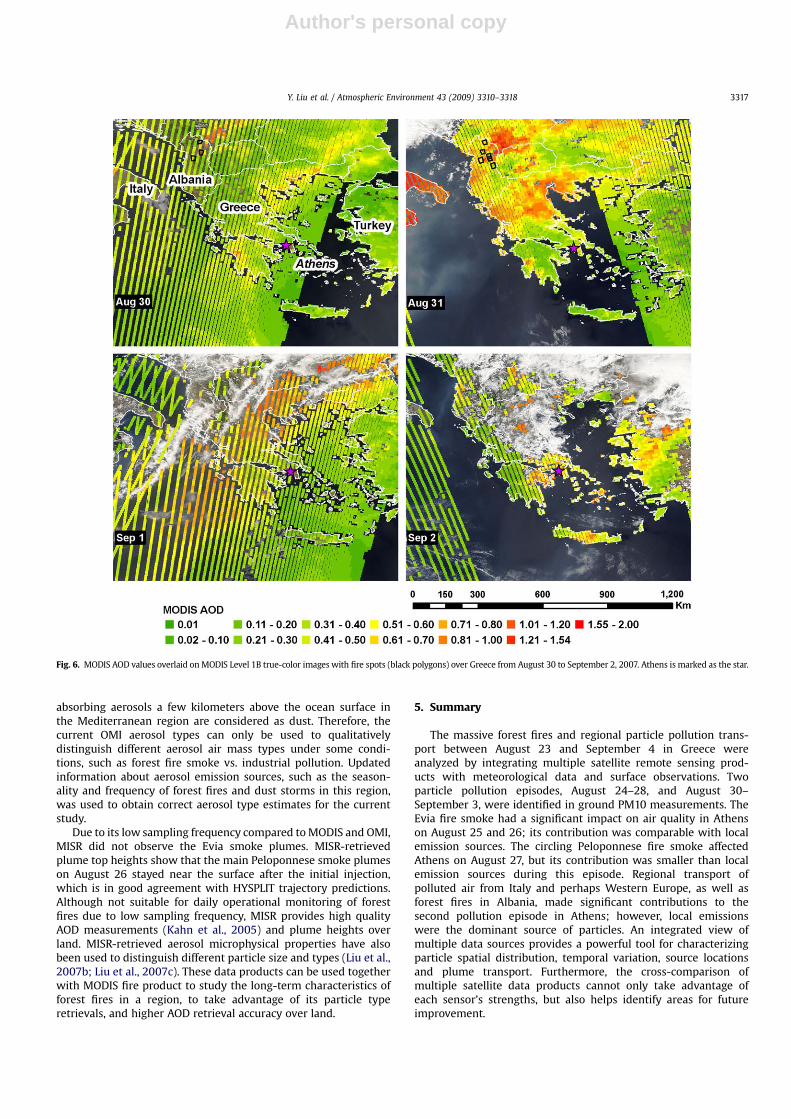
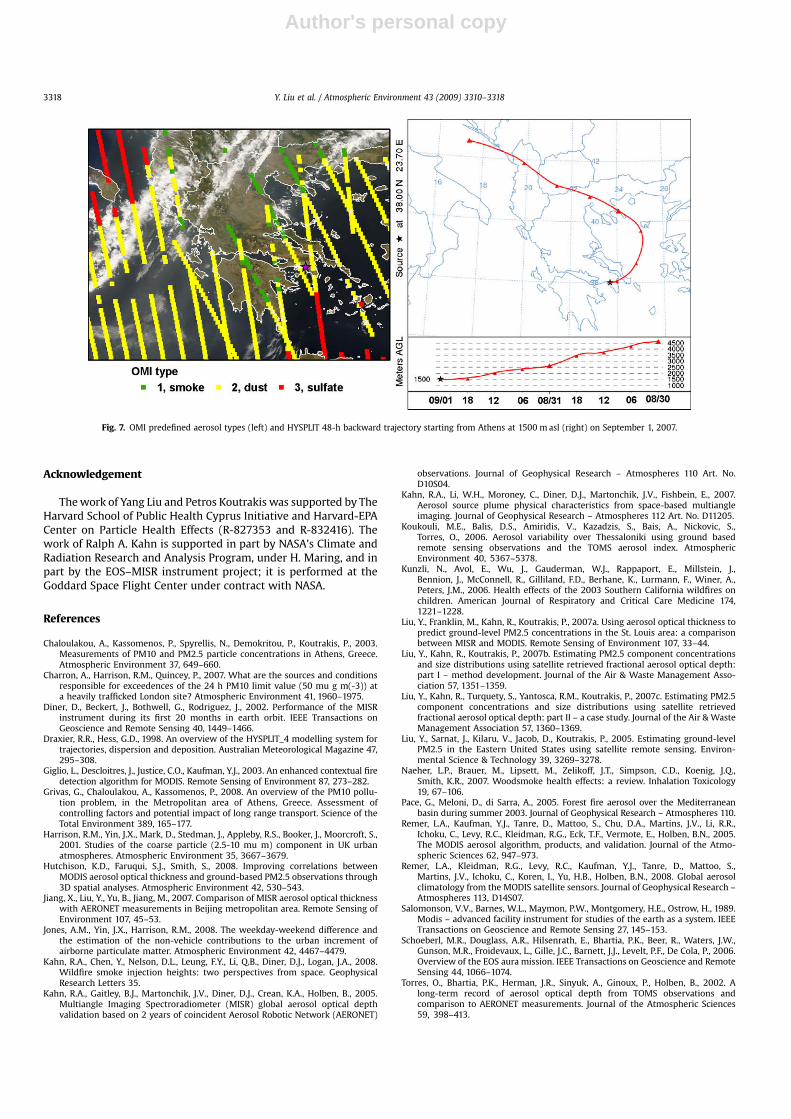
By September 1, MODIS detected no fire spots in Evia, minor firespots in the Peloponnese approximately 70 km east of the majorfire sites (Fig. 6), and the Albanian fire sites were obscured byclouds. The polluted air mass, characterized by higher MODIS AODvalues (0.6–1.0), that formed on August 31, moved further towardsthe southeast (Fig. 6). Dominant wind direction was from the northon August 31 and from the northwest on September 1. Since Saharadust storms generally do not affect Athens in the summer months,the dust aerosols over Athens detected by OMI are probably mis-classified. Nonetheless, the coincident spatial patterns of elevatedMODIS AOD values and OMI aerosol types indicate that Athens was
Fig. 3. MODIS AOD values overlaid on MODIS Level 1B true-color images with fire spots (black polygons) over Greece from August 24 to 28, 2007. Athens is marked as the star.
Y. Liu et al. / Atmospheric Environment 43 (2009) 3310–33183314
Author's personal copy
under the influence of this regional transport event. The HYSPLIT48-h backward trajectory starting from Athens suggests the airmass that arrived on September 1 was influenced by both pollutedair from Western Europe and the Albanian smoke plumes (Fig. 7).Unfortunately, MODIS AOD values in Athens and its surroundingregion are missing. NCEP Meteorological data indicate that daytimeregional boundary layer height during this episode is much lower(w300 m) than during the previous episode (w700 m). Althoughthe background PM10 concentration rose to 40 mg m�3, the largedifference between the urban average PM10 concentration(101 mg m�3) and background suggests that local sources were themajor source of air pollution in Athens.
On September 2, MODIS observed multiple fire spots in theareas of Albania not covered by cloud. MODIS AOD indicates noresidual smoke plumes over the main Peloponnese fire sites, butAlbanian fire smoke affected eastern Greece, Crete, and westTurkey, with an average MODIS AOD of 0.7 in Athens. OMI classifiedthe particles over Athens a mixture of dust and sulfate, suggestingat least two aerosol types, likely from regional transport and localemissions. On September 3, cloud cover blocked the view of Athensand most of Greece. Observations from surrounding pixels suggestthat MODIS AOD in the region was approximately 0.39. OMI clas-sified the aerosols over Athens as primarily sulfate particles, witha small amount of dust and smoke. The polluted air previously
Fig. 4. OMI predefined aerosol types overlaid on MODIS Level 1B true-color images over Greece from August 24 to 28, 2007. Athens is marked as the star.
Y. Liu et al. / Atmospheric Environment 43 (2009) 3310–3318 3315
Author's personal copy
classified as dust by OMI moved towards Turkey. The backgroundPM10 concentration dropped to 15 mg m�3, and average urban PM10
concentration (37 mg m�3) returned to below the EU standard.
4. Discussion
4.1. Impact of Greek forest fires on the air quality in Athens
The HYSPLIT forward trajectories and the spatial distribution ofMODIS AOD indicate that smoke plumes generated by the Evia firespassed directly over Athens on August 25 and 26, causinga substantial increase in background PM10 concentrations. MODISAOD measurements suggest that the Peloponnese fires may havealso affected the air quality in Athens on August 27, when thecircling wind in southern Greece brought smoke plumes to Athens.These findings are supported by OMI observations of light-absorbing particles, that are in good agreement with the visiblepatterns of the smoke plumes. Therefore, in addition to localemission sources, Greek forest fires were major contributors to theair pollution episode between August 24 and 28. Assuming that thePM10 concentrations at the THR station for August 24 and 29(w19 mg m�3) represent the unaffected background during thisperiod, the 3-day average contribution from Greek forest fires was28 mg m�3. The average contribution from traffic emissions andother local sources was 33 mg m�3.
On the other hand, the pollution episode between August 30and September 3 was more likely caused by regional transport ofindustrial pollution from Italy and perhaps Western Europe, as wellas smoke plumes generated by Albanian forest fires. During thisperiod, the dominant wind direction switched from northeast towest and northwest. As the HYSPLIT backward trajectories show,the air mass over Athens on September 1 originated from north-west of Greece. Both MODIS AOD and OMI aerosol type observa-tions demonstrate the northwest-to-southeast movement of thepolluted air mass. Assuming that the average PM10 concentration atthe THR station on August 29 and September 3 (w17 mg m�3) is theunaffected background during this period, the average contributionof long-range transport was 17 mg m�3, and the average contribu-tion from traffic emissions and other local sources was 48 mg m�3.NCEP meteorological data suggested that the contribution fromlocal sources, concentrated in the shallow boundary layer duringthis episode, could be much greater relative to the contributionfrom regional transport. The unaffected background values of
17–19 mg m�3 also correspond to the lowest 90th percentile ofconcentrations measured during the summer period, calculated fromsix years of continuous measurements at the same site (2001–2006).
4.2. Value of satellite data in characterizing air pollution episodes
Integrating available data from multiple sources creates a pictureof aerosol characteristics and transport that is not readily discerniblefrom satellite data products alone. The MODIS true-color imagesserved as the base layer in this analysis, upon which other satellitedata and HYSPLIT trajectories are overlaid. These images togetherwith the active fire spots help identify the origins of fire plumes, andprovide a preliminary assessment of which fire plumes may haveaffected the air quality in Athens. In addition to providing spatialcontext about the distribution of particle pollution, MODIS AODtracked the variation of ground-level PM10 well, especially for highconcentrations during the study period, as illustrated in Fig. 2. WhenSeptember 1 is excluded, PM10 concentrations and MODIS AOD havea Pearson correlation coefficient (r) of 0.89. One weakness of thecorrelation analysis is that direct AOD measurements in Athens aremissing for a few days due to cloud contamination or high surfacereflectance, so AOD must be estimated from surrounding pixels.Many previous studies that examined the AOD–PM relationshipaveraged AOD values within a certain distance (e.g., 25 km) ofground monitors to improve data coverage and get a more robustestimate of regional pollution level. The geographical setting of thisanalysis indicates that unless a site is on a flat terrain (Hutchisonet al., 2008; Liu et al., 2007a), calculating mean AOD values basedsolely on proximity may introduce substantial errors. Instead, spatialaveraging must take the impact of elevation and terrain conditionsinto consideration, for example, by excluding pixels over highmountains. This is particularly important for large-scale studiesinvolving many ground monitors.
OMI can distinguish the smoke plumes from backgroundpollution due to its high sensitivity to particle light absorption,and its ability to retrieve aerosol properties over both land andocean surfaces. OMI spatial coverage is slightly better thanMODIS in the Athens region because it is not affected by the highsurface reflectance. However, OMI misclassified as dust almost allthe smoke plumes over ocean. This might be caused by incorrectassumptions regarding aerosol layer heights, since the OMIabsorbing particle retrieval is very sensitive to this quantity. It islikely that in OMI’s current aerosol climatology, all strongly light-
Fig. 5. MISR wind-corrected aerosol plume height on August 26, 2007 (left) and HYSPLIT 24-h forward trajectories starting on August 26 (right).
Y. Liu et al. / Atmospheric Environment 43 (2009) 3310–33183316
Author's personal copy
absorbing aerosols a few kilometers above the ocean surface inthe Mediterranean region are considered as dust. Therefore, thecurrent OMI aerosol types can only be used to qualitativelydistinguish different aerosol air mass types under some condi-tions, such as forest fire smoke vs. industrial pollution. Updatedinformation about aerosol emission sources, such as the season-ality and frequency of forest fires and dust storms in this region,was used to obtain correct aerosol type estimates for the currentstudy.
Due to its low sampling frequency compared to MODIS and OMI,MISR did not observe the Evia smoke plumes. MISR-retrievedplume top heights show that the main Peloponnese smoke plumeson August 26 stayed near the surface after the initial injection,which is in good agreement with HYSPLIT trajectory predictions.Although not suitable for daily operational monitoring of forestfires due to low sampling frequency, MISR provides high qualityAOD measurements (Kahn et al., 2005) and plume heights overland. MISR-retrieved aerosol microphysical properties have alsobeen used to distinguish different particle size and types (Liu et al.,2007b; Liu et al., 2007c). These data products can be used togetherwith MODIS fire product to study the long-term characteristics offorest fires in a region, to take advantage of its particle typeretrievals, and higher AOD retrieval accuracy over land.
5. Summary
The massive forest fires and regional particle pollution trans-port between August 23 and September 4 in Greece wereanalyzed by integrating multiple satellite remote sensing prod-ucts with meteorological data and surface observations. Twoparticle pollution episodes, August 24–28, and August 30–September 3, were identified in ground PM10 measurements. TheEvia fire smoke had a significant impact on air quality in Athenson August 25 and 26; its contribution was comparable with localemission sources. The circling Peloponnese fire smoke affectedAthens on August 27, but its contribution was smaller than localemission sources during this episode. Regional transport ofpolluted air from Italy and perhaps Western Europe, as well asforest fires in Albania, made significant contributions to thesecond pollution episode in Athens; however, local emissionswere the dominant source of particles. An integrated view ofmultiple data sources provides a powerful tool for characterizingparticle spatial distribution, temporal variation, source locationsand plume transport. Furthermore, the cross-comparison ofmultiple satellite data products cannot only take advantage ofeach sensor’s strengths, but also helps identify areas for futureimprovement.
Fig. 6. MODIS AOD values overlaid on MODIS Level 1B true-color images with fire spots (black polygons) over Greece from August 30 to September 2, 2007. Athens is marked as the star.
Y. Liu et al. / Atmospheric Environment 43 (2009) 3310–3318 3317
Author's personal copy
Acknowledgement
The work of Yang Liu and Petros Koutrakis was supported by TheHarvard School of Public Health Cyprus Initiative and Harvard-EPACenter on Particle Health Effects (R-827353 and R-832416). Thework of Ralph A. Kahn is supported in part by NASA’s Climate andRadiation Research and Analysis Program, under H. Maring, and inpart by the EOS–MISR instrument project; it is performed at theGoddard Space Flight Center under contract with NASA.
References
Chaloulakou, A., Kassomenos, P., Spyrellis, N., Demokritou, P., Koutrakis, P., 2003.Measurements of PM10 and PM2.5 particle concentrations in Athens, Greece.Atmospheric Environment 37, 649–660.
Charron, A., Harrison, R.M., Quincey, P., 2007. What are the sources and conditionsresponsible for exceedences of the 24 h PM10 limit value (50 mu g m(-3)) ata heavily trafficked London site? Atmospheric Environment 41, 1960–1975.
Diner, D., Beckert, J., Bothwell, G., Rodriguez, J., 2002. Performance of the MISRinstrument during its first 20 months in earth orbit. IEEE Transactions onGeoscience and Remote Sensing 40, 1449–1466.
Draxier, R.R., Hess, G.D., 1998. An overview of the HYSPLIT_4 modelling system fortrajectories, dispersion and deposition. Australian Meteorological Magazine 47,295–308.
Giglio, L., Descloitres, J., Justice, C.O., Kaufman, Y.J., 2003. An enhanced contextual firedetection algorithm for MODIS. Remote Sensing of Environment 87, 273–282.
Grivas, G., Chaloulakou, A., Kassomenos, P., 2008. An overview of the PM10 pollu-tion problem, in the Metropolitan area of Athens, Greece. Assessment ofcontrolling factors and potential impact of long range transport. Science of theTotal Environment 389, 165–177.
Harrison, R.M., Yin, J.X., Mark, D., Stedman, J., Appleby, R.S., Booker, J., Moorcroft, S.,2001. Studies of the coarse particle (2.5-10 mu m) component in UK urbanatmospheres. Atmospheric Environment 35, 3667–3679.
Hutchison, K.D., Faruqui, S.J., Smith, S., 2008. Improving correlations betweenMODIS aerosol optical thickness and ground-based PM2.5 observations through3D spatial analyses. Atmospheric Environment 42, 530–543.
Jiang, X., Liu, Y., Yu, B., Jiang, M., 2007. Comparison of MISR aerosol optical thicknesswith AERONET measurements in Beijing metropolitan area. Remote Sensing ofEnvironment 107, 45–53.
Jones, A.M., Yin, J.X., Harrison, R.M., 2008. The weekday-weekend difference andthe estimation of the non-vehicle contributions to the urban increment ofairborne particulate matter. Atmospheric Environment 42, 4467–4479.
Kahn, R.A., Chen, Y., Nelson, D.L., Leung, F.Y., Li, Q.B., Diner, D.J., Logan, J.A., 2008.Wildfire smoke injection heights: two perspectives from space. GeophysicalResearch Letters 35.
Kahn, R.A., Gaitley, B.J., Martonchik, J.V., Diner, D.J., Crean, K.A., Holben, B., 2005.Multiangle Imaging Spectroradiometer (MISR) global aerosol optical depthvalidation based on 2 years of coincident Aerosol Robotic Network (AERONET)
observations. Journal of Geophysical Research – Atmospheres 110 Art. No.D10S04.
Kahn, R.A., Li, W.H., Moroney, C., Diner, D.J., Martonchik, J.V., Fishbein, E., 2007.Aerosol source plume physical characteristics from space-based multiangleimaging. Journal of Geophysical Research – Atmospheres 112 Art. No. D11205.
Koukouli, M.E., Balis, D.S., Amiridis, V., Kazadzis, S., Bais, A., Nickovic, S.,Torres, O., 2006. Aerosol variability over Thessaloniki using ground basedremote sensing observations and the TOMS aerosol index. AtmosphericEnvironment 40, 5367–5378.
Kunzli, N., Avol, E., Wu, J., Gauderman, W.J., Rappaport, E., Millstein, J.,Bennion, J., McConnell, R., Gilliland, F.D., Berhane, K., Lurmann, F., Winer, A.,Peters, J.M., 2006. Health effects of the 2003 Southern California wildfires onchildren. American Journal of Respiratory and Critical Care Medicine 174,1221–1228.
Liu, Y., Franklin, M., Kahn, R., Koutrakis, P., 2007a. Using aerosol optical thickness topredict ground-level PM2.5 concentrations in the St. Louis area: a comparisonbetween MISR and MODIS. Remote Sensing of Environment 107, 33–44.
Liu, Y., Kahn, R., Koutrakis, P., 2007b. Estimating PM2.5 component concentrationsand size distributions using satellite retrieved fractional aerosol optical depth:part I – method development. Journal of the Air & Waste Management Asso-ciation 57, 1351–1359.
Liu, Y., Kahn, R., Turquety, S., Yantosca, R.M., Koutrakis, P., 2007c. Estimating PM2.5component concentrations and size distributions using satellite retrievedfractional aerosol optical depth: part II – a case study. Journal of the Air & WasteManagement Association 57, 1360–1369.
Liu, Y., Sarnat, J., Kilaru, V., Jacob, D., Koutrakis, P., 2005. Estimating ground-levelPM2.5 in the Eastern United States using satellite remote sensing. Environ-mental Science & Technology 39, 3269–3278.
Naeher, L.P., Brauer, M., Lipsett, M., Zelikoff, J.T., Simpson, C.D., Koenig, J.Q.,Smith, K.R., 2007. Woodsmoke health effects: a review. Inhalation Toxicology19, 67–106.
Pace, G., Meloni, D., di Sarra, A., 2005. Forest fire aerosol over the Mediterraneanbasin during summer 2003. Journal of Geophysical Research – Atmospheres 110.
Remer, L.A., Kaufman, Y.J., Tanre, D., Mattoo, S., Chu, D.A., Martins, J.V., Li, R.R.,Ichoku, C., Levy, R.C., Kleidman, R.G., Eck, T.F., Vermote, E., Holben, B.N., 2005.The MODIS aerosol algorithm, products, and validation. Journal of the Atmo-spheric Sciences 62, 947–973.
Remer, L.A., Kleidman, R.G., Levy, R.C., Kaufman, Y.J., Tanre, D., Mattoo, S.,Martins, J.V., Ichoku, C., Koren, I., Yu, H.B., Holben, B.N., 2008. Global aerosolclimatology from the MODIS satellite sensors. Journal of Geophysical Research –Atmospheres 113, D14S07.
Salomonson, V.V., Barnes, W.L., Maymon, P.W., Montgomery, H.E., Ostrow, H., 1989.Modis – advanced facility instrument for studies of the earth as a system. IEEETransactions on Geoscience and Remote Sensing 27, 145–153.
Schoeberl, M.R., Douglass, A.R., Hilsenrath, E., Bhartia, P.K., Beer, R., Waters, J.W.,Gunson, M.R., Froidevaux, L., Gille, J.C., Barnett, J.J., Levelt, P.F., De Cola, P., 2006.Overview of the EOS aura mission. IEEE Transactions on Geoscience and RemoteSensing 44, 1066–1074.
Torres, O., Bhartia, P.K., Herman, J.R., Sinyuk, A., Ginoux, P., Holben, B., 2002. Along-term record of aerosol optical depth from TOMS observations andcomparison to AERONET measurements. Journal of the Atmospheric Sciences59, 398–413.
Fig. 7. OMI predefined aerosol types (left) and HYSPLIT 48-h backward trajectory starting from Athens at 1500 m asl (right) on September 1, 2007.
Y. Liu et al. / Atmospheric Environment 43 (2009) 3310–33183318