Embed Size (px)
Citation preview
Author's personal copy
Measurement of mechanical properties of electronic materials at temperaturesdown to 4.2 K
M. Fink a,*, Th. Fabing a, M. Scheerer a, E. Semerad a, B. Dunn b
a ARC Seibersdorf Research GmbH, 2444 Seibersdorf, Austriab ESA/ESTEC, 2200 AG Noordwijk, The Netherlands
a r t i c l e i n f o
Article history:Received 30 October 2007Received in revised form 25 June 2008Accepted 16 July 2008
Keywords:SolderPCBConformal coatingMaterial characterisationTensile test
a b s t r a c t
Operating temperatures of spacecraft components in the ‘subzero’ range are encountered during solareclipse periods or when voyaging on deep-space missions. Moreover some spacecraft instruments orparts of them, e.g. sensors, have to be cooled to obtain an improved performance, e.g. in spacecraft mis-sions like the infrared space observatory (ISO) and CryoSat. Materials utilized in the assembly of elec-tronic circuits can be subjected to mechanical loading at cryogenic temperatures. [Semerad E, ScholzeP, Schmidt M, Wendrinsky W. Effect of new cleaning liquids on electronic materials and parts. ESA met-allurgy report no. 3275; January 2002, [1]].
Within the present work the mechanical properties of electronic materials at cryogenic temperaturesdown to liquid helium temperature were analysed. Specifically the tensile properties of solders(63Sn37Pb, 62Sn36Pb2Ag, 60Sn40Pb, 96Sn4Ag, 50In50Pb, 70Pb30In, 96.8Pb1.5Ag1.7Sn,96.5Sn3Ag0.5Cu), PC boards (MLB polyimide glass fibre, MLB epoxy glass fibre, MLB Thermount), confor-mal coatings (Arathane 5750, Sylgard 184, Scotchcast 280, Solithane 113, CV-1144-0, Mapsil 213, Cona-thane EN4/EN11) as well as OFE Cu were characterised at room temperature, at liquid nitrogen and atliquid helium temperature by tensile tests.
The fracture surface of tested samples was examined by means of optical microscope and if necessarywith scanning electron microscope.
� 2008 Elsevier Ltd. All rights reserved.
1. Introduction
The objective of the present work was to check the reliability ofOFE Cu, solders, PC boards, and conformal coatings at low operat-ing temperatures.
Specifically the temperature dependence from room tempera-ture (RT) down to 4.2 K (LHe) of following materials propertieswas characterised
� Young’s modulus.� Proof stress.� Elongation at rupture.� Ultimate tensile strength.
OFE copper was delivered from Goodfellow GmbH [12] in formof an as drawn rod (diameter: 12.7 mm, length: 1000 mm, purity:better than 99.95%). The rod was cut into pieces of about 80 mm.These specimens were machined according to ASTM-E8. The roundtensile specimen had a reduced length of 30 mm with a diameter
of 5 mm and threaded ends of M9x1.5. The single specimens weretaken arbitrarily for the tests at room temperature, at LN2- and atLHe temperature.
The solders (except of 96.5Sn3Ag0.5Cu) delivered from JL GoslarGmbH had a length of about 400 mm and a triangle profile. To getsamples having the same geometry like the OFE copper specimens,the raw solder bars had to be melt to a rod with a length of at least70 mm. The raw solder materials were squeezed to a roughlyround form that fits in glass tubes with an inner diameter of10 mm and a length of 100 mm. To avoid hollows in the casted sol-der rods and to get comparable results with previous investiga-tions [2,3], the melting process took place under vacuum (10E-2mbar) at casting temperatures shown in Table 1. The melting tem-peratures of the solders are also given in this table. The parametersfor casting were chosen in accordance to previous investigations[2] and [3] to ensure comparable results. In Fig. 1 a typical solderrod after casting is shown.
The cast rods were cleaned, identified as well as end trimmedand machined according to ASTM-E8. The round tensile testspecimens had a reduced length of 30 mm with a diameter of5 mm and threaded ends of M9x1.5 like the OFE Cu samples.The solder 96.5Sn3Ag0.5Cu was delivered in form of a bar(48 � 4 � 2 cm3). From this bar the round tensile test samples
0011-2275/$ - see front matter � 2008 Elsevier Ltd. All rights reserved.doi:10.1016/j.cryogenics.2008.07.006
* Corresponding author. Tel.: +43 505503384; fax: +43 505503366.E-mail address: [email protected] (M. Fink).
Cryogenics 48 (2008) 497–510
Contents lists available at ScienceDirect
Cryogenics
journal homepage: www.elsevier .com/locate /cryogenics

Author's personal copy
could be cut directly. Thus, a direct comparison of the measuredvalues of 96.5Sn3Ag0.5Cu with the other solders should be re-garded carefully. In Fig. 2 a solder tensile test specimen is shown.The tensile specimens were checked by means of ultrasonic inspec-tion. Samples with any hollows were rejected.
The PCB’s were delivered from GPV Printca A/S. The dimensionsof all specimens were nearly identical, i.e. approx. 200 mm inlength, 20 mm in width and 1.6 mm in thickness. The core materialis 0.2 mm thick. It is pressed into a 1.6 mm sandwich (due to a realboard contain several layers). For clamping in the specimen holderthe thickness of the samples should be about 8 mm. Due to thethickness of the samples of 1.6 mm and to assure that they arenot harmed when clamping them, their ends were taped with a40 mm long glass fibre reinforced polymer. In Fig. 3 a sample ofevery PCB material prepared for tensile test is shown.
The conformal coatings consisted of three silicones, three poly-urethanes and one epoxy system, which where evaluated forspacecraft applications in previous technical notes [4]. These con-formal coatings have either an extensive usage in the fabricationof spacecraft or are expected to pass the ESA requirements for out-gassing, offgassing, toxicity and flammability. The materials deliv-ered from ESA had a form of 20 � 20 cm2.
The samples had to be trumped by means of a special formed cut-ter. A photo of a Solithane 113 tensile specimen is shown in Fig. 4.
Before clamping the specimens in the sample holder, they weretaped with spare material of Solithane 113 to assure that they arenot harmed when clamping.
2. Experimental details
The tests included
� Ultrasonic Inspection of the samples.� Tensile tests at room temperature as well as at cryogenic tem-
peratures down to 4.2 K.� Visual inspection and surface analysis by optical microscope and
scanning electron microscope (SEM).
Before tensile tests started, all samples were checked withultrasonic inspection which was done by means of a automatedscanning ultrasonic testing facility type panametrics multiscanwith an immersion tank using a 20 MHz focused immersion trans-ducer type: V317/188237 with a focal length of 28 mm in impulse-echo mode. For scanning the transducer was placed 23 mm abovethe surface of the sample – that means the focal point of the trans-ducer was adjusted to the axis of the sample. The samples were ro-tated around their axis and the transducer was moved along theaxis giving a rectangular winding-up c-scan of the whole cylindri-cal part of the sample. To prove the detectable pore size, holes ofdifferent diameters were drilled in the samples and the pre-dam-aged samples were inspected. Defects > 0.4 mm could be detected.Samples with any failure larger than the minimum detectable sizewere rejected.
The test campaigns were carried out on a class I universal test-ing machine. The load cells and the extensometers have been cal-ibrated on site by the certified calibration service of MessphysikLaborgeräte GmbH/Austria based on standards issued by BEF, thesupreme Austrian authority for standards and calibration. The cal-ibration certificates state accuracies of ±0.5% of the selected load
Fig. 1. Vacuum casted solder rod.
Fig. 2. Solder tensile test specimen.
Fig. 3. Taped PCB samples.
Fig. 4. Conformal Coating tensile test specimen.
Table 1
Solder Melting range (�C) Casting temperature (�C)
Solid Liquid
63Sn37Pb 183 183 24062Sn36Pb2Ag 180 190 24060Sn40Pb 183 190 24096Sn4Ag 221 221 24050In50Pb 180 209 24070Pb30In 220 255 27096.8Pbl.5Agl.7Sn 304 310 34096.5Sn3Ag0.5Cu Tested in as-received condition!
498 M. Fink et al. / Cryogenics 48 (2008) 497–510

Author's personal copy
range, ±0.005 mm of the machines stroke indicator and ±0.5% ofthe extensometers gauge length.
Tests were performed with a constant cross-head speed of1 mm/min and a tensile preload of 10–20 N. The extensometerwas calibrated and ‘‘zeroed” at preload level prior of each test.The mechanical properties calculated after completion of each testwere based on the recorded signals of the load cell, the cross-headposition sensor and the extensometer. Measurements at roomtemperature were performed with a video extensometer.
Tensile tests at 77 K (LN2 temperature) were performed bymeans of a liquid nitrogen bath mounted in the tensile test ma-chine. Measurements at cryogenic temperature were made witha special low temperature extensometer.
Tensile properties at 4.2 K (LHe temperature) were measured bymeans of a LHe – cryostat mounted in a mechanical testing ma-chine (Fig. 5). The cryostat is described in detail in [5]. By meansof this experimental setup tensile measurements with a maximumload of 200 kN at cryogenic temperatures down to 4.2 K can be per-
Fig. 5. Arrangement for tensile testing at 4.2 K in LHe featuring the 4 column testing machine, the LHe – cryostat containing the specimen (black cylindrical object).
Fig. 6. Stress/strain diagram as recorded by means of a PC. Fig. 7. Solder sample before and after tensile test at 4.2 K.
M. Fink et al. / Cryogenics 48 (2008) 497–510 499

Author's personal copy
formed. A special top loading mechanism enables a quick change ofthe samples. Therefore, no heating up of the cryostat between thetests is warranted and so, the cooling down time of specimen isless than 2 h (big samples, like PCB’s) and less than 1 h (smallersamples, like OFE copper, solders and conformal coatings).
During each tensile test a stress/strain diagram is plotted, fromwhich the tensile properties were evaluated. Fig. 6 shows a typicalone.
3. Test results
At least 3 tensile specimens of each material and each temper-ature were tested. In Fig. 7 a solder sample, in Fig. 8 a PCB sample,and in Fig. 9 a conformal coating sample mounted in sample holderbefore and after tensile test at 4.2 K are shown.
The data are given in Tables 2–20. In Figs. 10–13 the averagevalues of the temperature dependence of Young’s modulus E, ulti-mate tensile strength Rm, proof stress Rp0.2, and elongation atrupture A are plotted. An exception is the elongation at ruptureof OFE Cu at room temperature (Fig. 13). Due to fracture outsideof the extensometer of Test Nos. 24 and 26, it is expected that onlythe elongation of test 147 is a valid factor. So, this value is shown inFig. 13. For this reason the A-values of Test Nos. 24 and 26 in Table2 are marked with a red exclamation mark.
Before each tensile test, the samples were measured by meansof a micrometer screw (accuracy: +/�0.01 mm). Applying the low
Fig. 8. PCB sample before and after tensile test at 4.2 K.
Fig. 9. Conformal Coating sample before and after tensile test at 4.2 K.
Table 2OFE Cu
Testno.
Ch-No
E (kN/mm2)
Fmax (N) Rm (N/mm2)
Rp0.2 (N/mm2)
A (%)
RT24 1-1 108.024 7287.6 388.00 386.79 0.25526 1-3 109.649 7317.0 381.80 381.03 0.453147 1-7 108.284 7528.0 389.61 388.14 15.876Average 108.652 7377.530 386.470 385.320 5.528Standard
deviation0.873 131.138 4.124 3.776 8.962
77 K50 1-4 123.700 9939.0 508.20 456.50 16.75051 1-5 121.900 9872.0 515.00 464.20 11.76052 1-6 124.600 98200 5124.0 452.90 12.330Average 123.400 9877.000 511.867 457.867 13.613Standard
deviation1.375 59.657 3.431 5.773 2.731
4.2 K18 1-1 137.200 9472.0 490.20 298.70 24.85019 1-2 129.500 9315.0 488.00 307.90 28.34082 1-3 127.200 11259.0 582.70 494.30 44.760Average 131.300 10015.333 520.300 366.967 32.650Standard
deviation5237 1079.904 54.051 110.370 10.632
Table 363Sn 37Pb
Testno.
Ch-No
E (kN/mm2)
Fmax (N) Rm (N/mm2)
Rp0.2 (N/mm2)
A (%)
RT32 2–3 16.120 562.0 28.74 27.38 73.74134 2–5 18.997 559.4 28.60 27.75 57.62835 2–6 20.584 553.3 28.29 27.56 24.650Average 18.567 558.233 28.543 27.563 52.006Standard
deviation2.263 4.466 0.230 0.185 25.024
77 K56 2–7 38.820 2210.0 115.80 87.85 1.08357 2–8 35.970 2179.0 113.30 83.08 1.18958 2–9 38.930 1923.0 101.60 93.36 0.408Average 37.907 2104.000 110.233 88.030 0.893Standard
deviation1.678 157.515 7.580 5.151 0.424
4.2 K21 2–1 43.820 2698.0 138.00 122.10 0.26223 2–3 41.440 2753.0 140.80 111.50 0.41387 2–5 43.410 2497.0 129.00 115.10 0.267Average 42.890 2649.333 135.933 116.233 0.314Standard
deviation1.272 134.760 6.165 5.390 0.086
500 M. Fink et al. / Cryogenics 48 (2008) 497–510

Author's personal copy
of error propagation a deviation of the measurements of +/�5% isroughly estimated.
The Young’s modulus of OFE Cu is superior to all other testedmaterials. For the conformal coatings the lowest values werefound.
The temperature dependence of the elastic modulus is for alltested PCB’s the same. The Young’s modulus increases at lowertemperatures. PCB 2301 MLB epoxy glass fibre has the highestYoung’s modulus of the PC boards, PCB Thermount the lowestone at all temperatures investigated.
The Young’s modulus of the conformal coatings increases from afew thousandth GPa at RT to a few GPa at low temperatures. Anexception is Arathane 5750 as well as Scotchcast 280. Their stiff-ness is at RT not so low. At 4.2 K the elastic modulus of Solithane113 is superior to the rest of the tested conformal coatings.
The In-based solders have the lowest elastic modulus of alltested solders.
OFE Cu- and PCB-values of the ultimate tensile strength are supe-rior to all tested solders and conformal coatings. The Sn-based sol-ders show relative high Rm-values, accept of the Ag-dotedmaterials, their strength is in the range of 50In50Pb. 96.5Sn3Ag0.5-Cu is an exception, probably due to the Cu-content.
At RT and at 77 K (=LN2) the strength of PCB 2301 MLB epoxyglass fibre is the highest one of the tested PC boards, at 4.2 K PCB2302 MLB polyimide glass fibre shows the highest ultimate tensilestrength of the 3 PCB’s. The tensile strength of PCB Thermount is atall temperatures investigated the lowest one compared with theother 2 PCB’s.
The temperature dependence of the tensile strength of Arathane5750, Sylgard 284, Scotchcast 280, Solithane 113 and ConathaneEN4/EN11 shows a maximum at 77 K and a minimum at RT. Thisdevolution is in high gear with Conathane EN4/EN11 and not sostrong with Sylgard 184. The strength of CV-1144-0 and Mapsil213 increases clearly at 4.2 K. For low temperatures the strength
Table 560Sn 40Pb
Testno.
Ch-No
E (kN/mm2)
Fmax (N) Rm (N/mm2)
Rp0.2 (N/mm2)
A (%)
RT21 4-1 25.050 832.3 42.73 39.61 11.53022 4-2 25.980 820.4 42.46 39.73 15.18023 4-3 25.690 807.3 41.78 38.99 21.590Average 25.573 820.000 42.323 39.443 16.110Standard
deviation0.476 12.505 0.490 0.397 5.093
77 K47 4-4 42.770 2030.0 105.10 75.68 1.37748 4-5 40.470 2100.0 109.10 74.62 2.26349 4-6 38.070 1908.0 99.14 81.09 1.050Average 40.437 2012.667 104.447 77.130 1.563Standard
deviation2.350 97.167 5.012 3.470 0.628
4.2 K28 4-2 42.500 2708.0 143.60 119.70 0.52929 4-3 42.730 2735.0 144.40 108.70 0.77388 4-4 44.560 2697.0 139.00 115.70 0.882Average 43.263 2713.333 142.333 114.700 0.728Standard
deviation1.129 19.553 2.914 5.568 0.181
Table 462Sn 36Pb 2Ag
Testno.
Ch-No
E (kN/mm2)
Fmax (N) Rm (N/mm2)
Rp0.2 (N/mm2)
A (%)
RT15 3-1 38.517 838.5 43.05 40.69 8.14216 3-2 39.164 853.9 43.84 42.30 5.87117 3-3 32.640 798.4 41.00 39.30 10.340Average 36.774 830.267 42.630 40.763 8.118Standard
deviation3.594 28.651 1.466 1.501 2.235
77 K38 3-4 41.230 2065.0 105.60 80.67 1.02439 3-5 38.560 2067.0 105.70 83.77 0.52240 3-6 38.830 2186.0 112.20 87.64 0.682Average 39.540 2106.000 107.833 84.027 0.743Standard
deviation1.470 69.289 3.782 3.492 0.256
4.2 K24 3-1 39.650 3187.0 164.90 109.00 0.50725 3-2 38.630 2598.0 134.40 120.10 0.38826 3-3 30.840 2815.0 145.10 106.60 0.774Average 36.373 2833.667 148.133 111.900 0.556Standard
deviation4.819 297.880 15.475 7.202 0.198
Table 696Sn 4Ag
Testno.
Ch-No
E (kN/mm2)
Fmax (N) Rm (N/mm2)
Rp0.2 (N/mm2)
A (%)
RT67 5-7 58.346 590.6 30.94 18.97 29.83069 5-9 57.020 656.2 33.83 32.51 2.011151 5-10 66.432 636.0 32.52 26.73 44.326Average 60.599 627.590 32.430 26.070 25.389Standard
deviation5.095 33.593 1.447 6.794 21.504
77 K59 5-1 33.420 1477.0 76.43 50.37 0.91260 5-2 35.550 1455.0 75.33 60.05 0.50761 5-3 34.280 1346.0 70.23 62.48 0.295Average 34.417 1426.000 73.997 57.633 0.571Standard
deviation1.072 70.150 3.308 6.406 0.313
4.2 K16 5-2 46.480 1615.0 84.24 n.a. 0.10038 5-5 42.380 1563.0 79.61 n.a. 0.01144 5-6 42.600 1609.0 82.27 n.a. 0.056Average 43.820 1595.667 82.040 0.056Standard
deviation2.306 28.449 2.324 0.045
Table 750In 50Pb
Testno.
Ch-No
E (kN/mm2)
Fmax (N) Rm (N/mm2)
Rp0.2 (N/mm2)
A (%)
RT12 6-1 7.361 635.3 33.69 21.03 8.86914 6-3 7.860 639.3 33.08 22.61 8.83787 6-11 6.197 556.4 28.91 19.48 9.319Average 7.139 610.333 31.893 21.040 9.008Standard
deviation0.853 46.750 2.602 1.585 0.270
77 K42 6-7 11.590 1145.0 58.76 34.05 25.15043 6-8 10.320 1126.0 58.29 31.96 34.070153 6-12 14.524 1142.4 59.89 33.40 41.100Average 12.145 1137.800 58.980 33.137 33.440Standard
deviation2.156 10.301 0.822 1.070 7.994
4.2 K31 6-1 14.440 1329.0 69.07 37.77 26.72033 6-3 14.720 1331.0 70.00 39.80 22.95085 6-5 13.400 1735.0 88.38 21.41 12.730Average 14.187 1465.000 75.817 32.993 20.800Standard
deviation0.696 233.829 10.890 10.083 7.239
M. Fink et al. / Cryogenics 48 (2008) 497–510 501

Author's personal copy
of Solithane 113 is superior to the other conformal coatings and itis in the range of the values found for most solders.
The proof stress of OFE Cu is superior to all other materialstested. The Sn-based solders show similar temperature depen-dence. The proof stress of 96Sn4Ag was not detectable at 4.2 K be-cause of its peculiar stress/strain diagram. The proof stress at lowtemperatures, particularly at 4.2 K, of 96.5Sn3Ag0.5Cu is superiorto the rest of the solders.
The proof stress of PCB 2302 MLB polyimide glass fibre is thesame for RT and low temperatures, PCB 2301 MLB epoxy glass fibrehas the highest proof stress of the three tested PCB’s, particularly at4.2 K. The proof stress of PCB Thermount is in the range of PCB2302 MLB polyimide glass fibre.
The proof stress at room temperature is very low (between 0.1and 1 MPa) for all conformal coatings tested. It has a clear maxi-mum value at 77 K (between 41 and 83 MPa). The values found
at 4.2 K are in between. At 4.2 K the proof stress of Solithane 113is superior to the rest of the tested conformal coatings.
The elongation at rupture of all Sn-based solders is at low tem-peratures very low. OFE Cu and the Pb-based solders show a higherelongation at rupture at cryogenic temperatures.
For the PC boards the elongation is in the range of a few p.c. Atroom temperature the elongation of PCB 2301 MLB epoxy glass fi-bre is superior to the rest of the PCB’s. At low temperatures theelongation of PCB 2302 MLB polyimide glass fibre is the highestone of all tested PC boards.
The conformal coatings show very high elongations at RT, at lowtemperatures the elongation decreases rapidly. At 77 K Mapsil 213has the highest elongation, at 4.2 K the elongation of Arathane5750 is superior to the rest of the conformal coatings.
Table 870Pb 30In
Testno.
Ch-No
E (kN/mm2)
Fmax (N) Rm (N/mm2)
Rp0.2 (N/mm2)
A (%)
RT71 7-4 12.170 508.0 26.29 21.50 3.50272 7-5 11.063 431.0 22.30 n.a. 0.17188 7-7 12.663 473.0 23.99 19.98 4.654Average 11.965 470.667 24.193 20.740 2.776Standard
deviation0.819 38.553 2.003 1.075 2.328
77 K62 7-1 20.110 528.8 27.15 21.10 4.53163 7-2 19.450 727.8 37.67 26.66 7.13073 7-6 17.580 865.8 44.99 25.89 27.060Average 19.047 707.467 36.603 24.550 12.907Standard
deviation1.312 169.418 8.968 3.012 12.326
4.2 K34 7-1 11.510 687.6 36.02 30.63 6.40735 7-2 13.560 856.6 45.43 35.75 6.71543 7-4 12.740 710.8 36.79 35.08 0.423Average 12.603 751.667 39.413 33.820 4.515Standard
deviation1.032 91.612 5.225 2.783 3.547
Table 996.8Pb 1.5Ag 1.7Sn
Testno.
Ch-No
E (kN/mm2)
Fmax (N) Rm (N/mm2)
Rp0.2 (N/mm2)
A (%)
RT18 8-1 22.665 549.6 28.21 20.53 34.61020 8-3 18.554 466.6 23.95 12.10 39.310154 8-3 22.490 606.8 31.40 22.87 23.716Average 21.233 540.987 27.853 18.500 32.545Standard
deviation2.330 70.476 3.738 5.665 7.999
77 K44 8-4 37.770 1033.0 52.62 19.18 11.33045 8-5 38.910 1015.0 52.34 17.27 12.06046 8-6 35.560 1071.0 54.98 16.80 25.050Average 37.413 1039.667 53.313 17.750 16.147Standard
deviation1.703 28.589 1.450 1.261 7.719
4.2 K41 8-2 32.150 1405.0 71.28 17.42 16.08042 8-3 29.980 1643.0 83.34 19.08 17.03046 8-4 30.610 2020.0 104.50 17.47 16.660Average 30.913 1689.333 86.373 17.990 16.590Standard
deviation1.116 310.107 16.816 0.944 0.479
Table 1096.5Sn 3Ag 0.5Cu
Testno.
Ch-No
E (kN/mm2)
Fmax (N) Rm (N/mm2)
Rp0.2 (N/mm2)
A (%)
RT89 19-7 15.484 564.2 29.20 25.92 48.270148 19-8 15.207 594.1 20.38 25.35 46.875149 19-9 14.626 656.3 33.29 28.51 42.245Average 15.106 604.837 27.623 26.593 45.797Standard
deviation0.438 46.962 6.598 1.684 3.154
77 K53 19-4 34.960 2440.0 128.30 92.97 0.71154 19-5 34.700 2126.0 110.50 84.76 0.53555 19-6 29.020 2672.0 138.30 88.68 0.916Average 32.893 2412.667 125.700 88.803 0.721Standard
deviation3.357 274.024 14.081 4.106 0.191
4.2 K12 19-1 41.770 1951.0 99.36 n.a. 0.01213 19-2 39.730 2892.0 146.10 132.50 0.31483 19-5 41.590 3156.0 160.70 151.20 0.218Average 41.030 2666.333 135.387 141.850 0.181Standard
deviation1.129 633.404 32.043 13.223 0.154
Table 11PCB 2302 MLB polyimide glass fibre
Testno.
Ch-No E (kN/mm2)
Fmax (N) Rm (N/mm2)
Rp0.2 (N/mm2)
A (%)
RT1 PCB 9/1 23.510 8682.0 242.30 159.00 0.6424 PCB 9/3 22.960 8268.0 223.90 154.20 0.549142 PCB 9/
1022.614 8243.1 216.02 168.14 0.416
Average 23.028 8397.700 227.407 160.447 0.536Standard
deviation0.452 246.526 13.486 7.082 0.114
77 K130 PCB 9/4 25.940 15458.0 397.80 154.10 3.719131 PCB 9/5 25.860 15732.0 403.40 160.10 3.546159 PCB 9/6-
325.878 15381.0 392.52 166.16 2.135
Average 25.893 15523.667 397.907 160.120 3.133Standard
deviation0.042 184.484 5.441 6.030 0.869
4.2 K1 PCB 9/7 30.520 14910.0 398.60 158.30 1.4842 PCB 9/8 31.490 15127.0 413.30 165.20 1.3503 PCB 9/9 28.320 16012.0 417.20 158.10 1.997Average 30.110 15349.667 409.700 160.533 1.610Standard
deviation1.624 583.769 9.809 4.043 0.342
502 M. Fink et al. / Cryogenics 48 (2008) 497–510
Author's personal copy
For PCB bare materials and conformal coatings we found thefollowing:
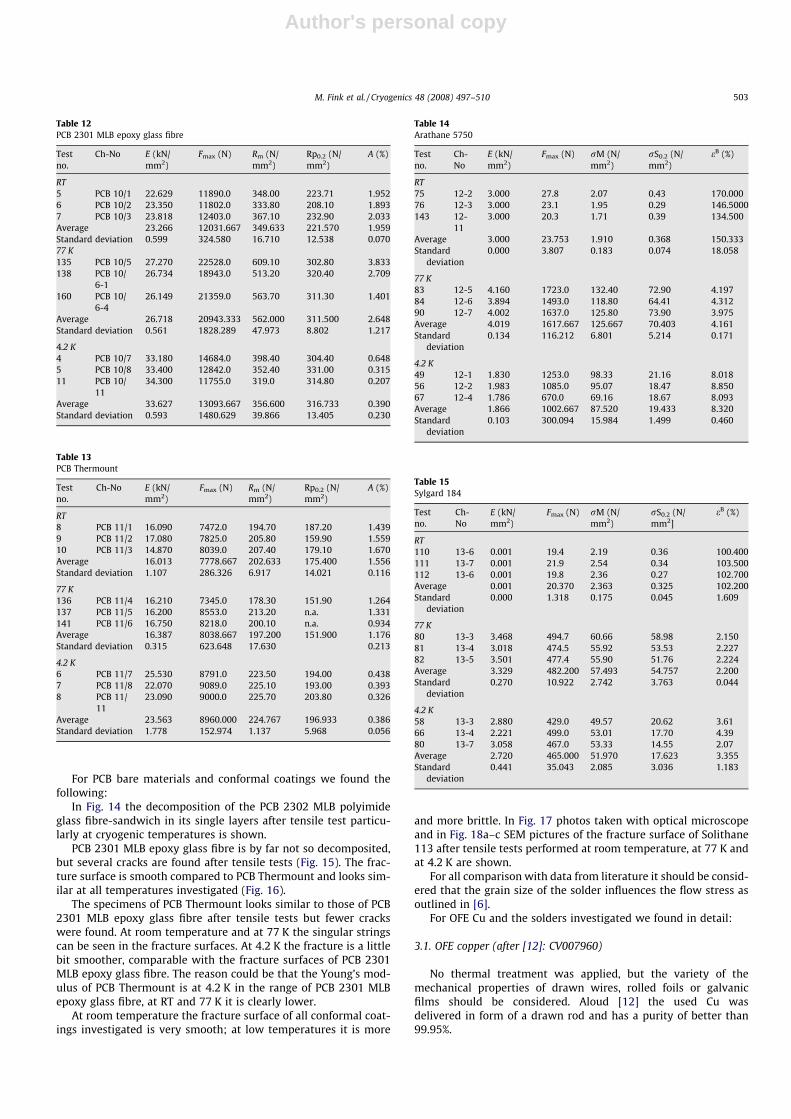
In Fig. 14 the decomposition of the PCB 2302 MLB polyimideglass fibre-sandwich in its single layers after tensile test particu-larly at cryogenic temperatures is shown.
PCB 2301 MLB epoxy glass fibre is by far not so decomposited,but several cracks are found after tensile tests (Fig. 15). The frac-ture surface is smooth compared to PCB Thermount and looks sim-ilar at all temperatures investigated (Fig. 16).
The specimens of PCB Thermount looks similar to those of PCB2301 MLB epoxy glass fibre after tensile tests but fewer crackswere found. At room temperature and at 77 K the singular stringscan be seen in the fracture surfaces. At 4.2 K the fracture is a littlebit smoother, comparable with the fracture surfaces of PCB 2301MLB epoxy glass fibre. The reason could be that the Young’s mod-ulus of PCB Thermount is at 4.2 K in the range of PCB 2301 MLBepoxy glass fibre, at RT and 77 K it is clearly lower.
At room temperature the fracture surface of all conformal coat-ings investigated is very smooth; at low temperatures it is more
and more brittle. In Fig. 17 photos taken with optical microscopeand in Fig. 18a–c SEM pictures of the fracture surface of Solithane113 after tensile tests performed at room temperature, at 77 K andat 4.2 K are shown.
For all comparison with data from literature it should be consid-ered that the grain size of the solder influences the flow stress asoutlined in [6].
For OFE Cu and the solders investigated we found in detail:
3.1. OFE copper (after [12]: CV007960)
No thermal treatment was applied, but the variety of themechanical properties of drawn wires, rolled foils or galvanicfilms should be considered. Aloud [12] the used Cu wasdelivered in form of a drawn rod and has a purity of better than99.95%.
Table 12PCB 2301 MLB epoxy glass fibre
Testno.
Ch-No E (kN/mm2)
Fmax (N) Rm (N/mm2)
Rp0.2 (N/mm2)
A (%)
RT5 PCB 10/1 22.629 11890.0 348.00 223.71 1.9526 PCB 10/2 23.350 11802.0 333.80 208.10 1.8937 PCB 10/3 23.818 12403.0 367.10 232.90 2.033Average 23.266 12031.667 349.633 221.570 1.959Standard deviation 0.599 324.580 16.710 12.538 0.07077 K135 PCB 10/5 27.270 22528.0 609.10 302.80 3.833138 PCB 10/
6-126.734 18943.0 513.20 320.40 2.709
160 PCB 10/6-4
26.149 21359.0 563.70 311.30 1.401
Average 26.718 20943.333 562.000 311.500 2.648Standard deviation 0.561 1828.289 47.973 8.802 1.217
4.2 K4 PCB 10/7 33.180 14684.0 398.40 304.40 0.6485 PCB 10/8 33.400 12842.0 352.40 331.00 0.31511 PCB 10/
1134.300 11755.0 319.0 314.80 0.207
Average 33.627 13093.667 356.600 316.733 0.390Standard deviation 0.593 1480.629 39.866 13.405 0.230
Table 13PCB Thermount
Testno.
Ch-No E (kN/mm2)
Fmax (N) Rm (N/mm2)
Rp0.2 (N/mm2)
A (%)
RT8 PCB 11/1 16.090 7472.0 194.70 187.20 1.4399 PCB 11/2 17.080 7825.0 205.80 159.90 1.55910 PCB 11/3 14.870 8039.0 207.40 179.10 1.670Average 16.013 7778.667 202.633 175.400 1.556Standard deviation 1.107 286.326 6.917 14.021 0.116
77 K136 PCB 11/4 16.210 7345.0 178.30 151.90 1.264137 PCB 11/5 16.200 8553.0 213.20 n.a. 1.331141 PCB 11/6 16.750 8218.0 200.10 n.a. 0.934Average 16.387 8038.667 197.200 151.900 1.176Standard deviation 0.315 623.648 17.630 0.213
4.2 K6 PCB 11/7 25.530 8791.0 223.50 194.00 0.4387 PCB 11/8 22.070 9089.0 225.10 193.00 0.3938 PCB 11/
1123.090 9000.0 225.70 203.80 0.326
Average 23.563 8960.000 224.767 196.933 0.386Standard deviation 1.778 152.974 1.137 5.968 0.056
Table 14Arathane 5750
Testno.
Ch-No
E (kN/mm2)
Fmax (N) rM (N/mm2)
rS0.2 (N/mm2)
eB (%)
RT75 12-2 3.000 27.8 2.07 0.43 170.00076 12-3 3.000 23.1 1.95 0.29 146.5000143 12-
113.000 20.3 1.71 0.39 134.500
Average 3.000 23.753 1.910 0.368 150.333Standard
deviation0.000 3.807 0.183 0.074 18.058
77 K83 12-5 4.160 1723.0 132.40 72.90 4.19784 12-6 3.894 1493.0 118.80 64.41 4.31290 12-7 4.002 1637.0 125.80 73.90 3.975Average 4.019 1617.667 125.667 70.403 4.161Standard
deviation0.134 116.212 6.801 5.214 0.171
4.2 K49 12-1 1.830 1253.0 98.33 21.16 8.01856 12-2 1.983 1085.0 95.07 18.47 8.85067 12-4 1.786 670.0 69.16 18.67 8.093Average 1.866 1002.667 87.520 19.433 8.320Standard
deviation0.103 300.094 15.984 1.499 0.460
Table 15Sylgard 184
Testno.
Ch-No
E (kN/mm2)
Fmax (N) rM (N/mm2)
rS0.2 (N/mm2]
eB (%)
RT110 13-6 0.001 19.4 2.19 0.36 100.400111 13-7 0.001 21.9 2.54 0.34 103.500112 13-6 0.001 19.8 2.36 0.27 102.700Average 0.001 20.370 2.363 0.325 102.200Standard
deviation0.000 1.318 0.175 0.045 1.609
77 K80 13-3 3.468 494.7 60.66 58.98 2.15081 13-4 3.018 474.5 55.92 53.53 2.22782 13-5 3.501 477.4 55.90 51.76 2.224Average 3.329 482.200 57.493 54.757 2.200Standard
deviation0.270 10.922 2.742 3.763 0.044
4.2 K58 13-3 2.880 429.0 49.57 20.62 3.6166 13-4 2.221 499.0 53.01 17.70 4.3980 13-7 3.058 467.0 53.33 14.55 2.07Average 2.720 465.000 51.970 17.623 3.355Standard
deviation0.441 35.043 2.085 3.036 1.183
M. Fink et al. / Cryogenics 48 (2008) 497–510 503
Author's personal copy
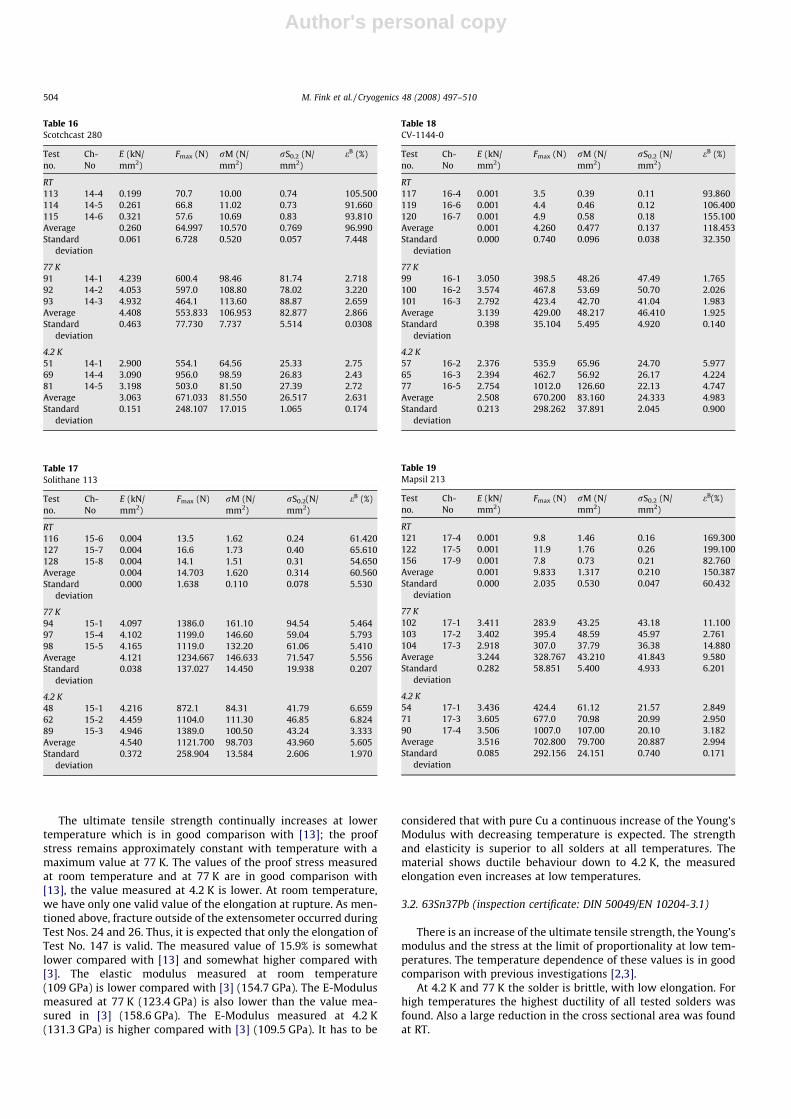
The ultimate tensile strength continually increases at lowertemperature which is in good comparison with [13]; the proofstress remains approximately constant with temperature with amaximum value at 77 K. The values of the proof stress measuredat room temperature and at 77 K are in good comparison with[13], the value measured at 4.2 K is lower. At room temperature,we have only one valid value of the elongation at rupture. As men-tioned above, fracture outside of the extensometer occurred duringTest Nos. 24 and 26. Thus, it is expected that only the elongation ofTest No. 147 is valid. The measured value of 15.9% is somewhatlower compared with [13] and somewhat higher compared with[3]. The elastic modulus measured at room temperature(109 GPa) is lower compared with [3] (154.7 GPa). The E-Modulusmeasured at 77 K (123.4 GPa) is also lower than the value mea-sured in [3] (158.6 GPa). The E-Modulus measured at 4.2 K(131.3 GPa) is higher compared with [3] (109.5 GPa). It has to be
considered that with pure Cu a continuous increase of the Young’sModulus with decreasing temperature is expected. The strengthand elasticity is superior to all solders at all temperatures. Thematerial shows ductile behaviour down to 4.2 K, the measuredelongation even increases at low temperatures.
3.2. 63Sn37Pb (inspection certificate: DIN 50049/EN 10204-3.1)
There is an increase of the ultimate tensile strength, the Young’smodulus and the stress at the limit of proportionality at low tem-peratures. The temperature dependence of these values is in goodcomparison with previous investigations [2,3].
At 4.2 K and 77 K the solder is brittle, with low elongation. Forhigh temperatures the highest ductility of all tested solders wasfound. Also a large reduction in the cross sectional area was foundat RT.
Table 16Scotchcast 280
Testno.
Ch-No
E (kN/mm2)
Fmax (N) rM (N/mm2)
rS0.2 (N/mm2)
eB (%)
RT113 14-4 0.199 70.7 10.00 0.74 105.500114 14-5 0.261 66.8 11.02 0.73 91.660115 14-6 0.321 57.6 10.69 0.83 93.810Average 0.260 64.997 10.570 0.769 96.990Standard
deviation0.061 6.728 0.520 0.057 7.448
77 K91 14-1 4.239 600.4 98.46 81.74 2.71892 14-2 4.053 597.0 108.80 78.02 3.22093 14-3 4.932 464.1 113.60 88.87 2.659Average 4.408 553.833 106.953 82.877 2.866Standard
deviation0.463 77.730 7.737 5.514 0.0308
4.2 K51 14-1 2.900 554.1 64.56 25.33 2.7569 14-4 3.090 956.0 98.59 26.83 2.4381 14-5 3.198 503.0 81.50 27.39 2.72Average 3.063 671.033 81.550 26.517 2.631Standard
deviation0.151 248.107 17.015 1.065 0.174
Table 17Solithane 113
Testno.
Ch-No
E (kN/mm2)
Fmax (N) rM (N/mm2)
rS0.2(N/mm2)
eB (%)
RT116 15-6 0.004 13.5 1.62 0.24 61.420127 15-7 0.004 16.6 1.73 0.40 65.610128 15-8 0.004 14.1 1.51 0.31 54.650Average 0.004 14.703 1.620 0.314 60.560Standard
deviation0.000 1.638 0.110 0.078 5.530
77 K94 15-1 4.097 1386.0 161.10 94.54 5.46497 15-4 4.102 1199.0 146.60 59.04 5.79398 15-5 4.165 1119.0 132.20 61.06 5.410Average 4.121 1234.667 146.633 71.547 5.556Standard
deviation0.038 137.027 14.450 19.938 0.207
4.2 K48 15-1 4.216 872.1 84.31 41.79 6.65962 15-2 4.459 1104.0 111.30 46.85 6.82489 15-3 4.946 1389.0 100.50 43.24 3.333Average 4.540 1121.700 98.703 43.960 5.605Standard
deviation0.372 258.904 13.584 2.606 1.970
Table 18CV-1144-0
Testno.
Ch-No
E (kN/mm2)
Fmax (N) rM (N/mm2)
rS0.2 (N/mm2)
eB (%)
RT117 16-4 0.001 3.5 0.39 0.11 93.860119 16-6 0.001 4.4 0.46 0.12 106.400120 16-7 0.001 4.9 0.58 0.18 155.100Average 0.001 4.260 0.477 0.137 118.453Standard
deviation0.000 0.740 0.096 0.038 32.350
77 K99 16-1 3.050 398.5 48.26 47.49 1.765100 16-2 3.574 467.8 53.69 50.70 2.026101 16-3 2.792 423.4 42.70 41.04 1.983Average 3.139 429.00 48.217 46.410 1.925Standard
deviation0.398 35.104 5.495 4.920 0.140
4.2 K57 16-2 2.376 535.9 65.96 24.70 5.97765 16-3 2.394 462.7 56.92 26.17 4.22477 16-5 2.754 1012.0 126.60 22.13 4.747Average 2.508 670.200 83.160 24.333 4.983Standard
deviation0.213 298.262 37.891 2.045 0.900
Table 19Mapsil 213
Testno.
Ch-No
E (kN/mm2)
Fmax (N) rM (N/mm2)
rS0.2 (N/mm2)
eB(%)
RT121 17-4 0.001 9.8 1.46 0.16 169.300122 17-5 0.001 11.9 1.76 0.26 199.100156 17-9 0.001 7.8 0.73 0.21 82.760Average 0.001 9.833 1.317 0.210 150.387Standard
deviation0.000 2.035 0.530 0.047 60.432
77 K102 17-1 3.411 283.9 43.25 43.18 11.100103 17-2 3.402 395.4 48.59 45.97 2.761104 17-3 2.918 307.0 37.79 36.38 14.880Average 3.244 328.767 43.210 41.843 9.580Standard
deviation0.282 58.851 5.400 4.933 6.201
4.2 K54 17-1 3.436 424.4 61.12 21.57 2.84971 17-3 3.605 677.0 70.98 20.99 2.95090 17-4 3.506 1007.0 107.00 20.10 3.182Average 3.516 702.800 79.700 20.887 2.994Standard
deviation0.085 292.156 24.151 0.740 0.171
504 M. Fink et al. / Cryogenics 48 (2008) 497–510

Author's personal copy
3.3. 62Sn36Pb2Ag (inspection certificate: DIN 50049/EN 10204-3.1)
The silver content improves the strength of the solder with re-spect to 63Sn37Pb for a little bit. The temperature dependence issimilar to 63Sn37Pb. Also for 4.2 K and 77 K a brittle fracture withlow elongation and for RT dimple fracture with higher elongationwas found.
Compared with data of [3] the values of Young’s modulusare about the same. Those of the ultimate tensile strength,the proof stress as well as the total elongation are a little bitlower.
3.4. 60Sn40Pb (inspection certificate: DIN 50049/EN 10204-3.1)
Generally the tensile properties are similar to those of the eu-tectic composition 63Sn37Pb. Small elongations and brittle frac-tures are obtained at 4.2 K and 77 K. At higher temperatures thesolder is ductile with high elongation ratios.
Compared with [7] the proof stress, the ultimate tensilestrength and the elongation at rupture are somewhat lower atcryogenic temperature. Compared with [8] and [9] the ultimatetensile strength is somewhat lower at room temperature and sameat cryogenic temperatures. The elongation is lower at cryogenictemperature; nevertheless this is in good comparison with previ-ous investigations [2,3].
3.5. 96Sn4Ag (inspection certificate: DIN 50049/EN 10204-3.1)
At room temperature the modulus of elasticity is superior to therest of the solders. The proof stress is at RT and at 77 K somewhatlower than the values found for the rest of the Sn-based solders. At4.2 K no proof stress could be found because of its peculiar stress/strain diagram.
The fracture of the solder is brittle at low temperatures withlow elongations. At RT the solder is ductile and the fracture showsa high reduction in area.
3.6. 50In50Pb (inspection certificate: DIN 50049/EN 10204-3.1)
At 4.2 K the solder remains extremely soft with a verylow Young’s modulus and high ductility compared with the other
solders. The fracture surfaces of this ductile solder are shown inFig. 19 (photos taken after tensile test at different temperatures).
3.7. 70Pb30In (inspection certificate: DIN 50049/EN 10204-3.1)
Generally, this solder shows similar strength and elastic proper-ties as the 50Pb 50In solder. The elongation is somewhat lowercompared with the 50Pb 50In solder. The fracture shows a littlereduction area at RT, at low temperatures the fracture is not sobrittle compared with the other tested solders.
Table 20Conathane EN4/EN11
Testno.
Ch-No
E (kN/mm2)
Fmax (N) rM (N/mm2)
rS0.2 (N/mm2)
eB(%)
RT124 18-4 0.003 22.6 2.88 0.49 259.400125 18-5 0.003 16.9 2.37 0.36 184.200126 18-6 0.003 13.7 2.07 0.42 161.400Average 0.003 17.749 2.440 0.423 201.667Standard
deviation0.000 4.485 0.410 0.065 51.282
77 K105 18-1 4.100 894.0 114.80 80.91 5.475106 18-2 4.046 790.4 114.90 92.18 5.505107 18-3 3.955 947.8 113.70 69.83 5.027Average 4.034 877.400 114.467 80.973 5.336Standard
deviation0.073 80.002 0.666 11.175 0.268
4.2 K55 18-1 1.708 794.2 85.96 6.74 6.12161 18-2 1.648 179.9 18.28 6.93 1.45979 18-3 1.546 232.0 28.60 7.78 2.077Average 1.634 402.033 44.280 7.148 3.219Standard
deviation0.082 340.624 36.463 0.559 2.532
Fig. 10. Elastic Modulus at room temperature, 77 K and 4.2 K.
M. Fink et al. / Cryogenics 48 (2008) 497–510 505

Author's personal copy
3.8. 96.8Pb1.5Ag1.7Sn (inspection certificate: DIN 50049/EN 10204-3.1)
Beside the high melting point which makes the solder suitablefor sequential soldering the solder shows interesting mechanicalproperties. The stiffness lies in between the Sn-based and In/Pbsolders. The ultimate tensile strength is in the area of the In/Pb sol-
ders, at 4.2 K somewhat higher. Compared with [10,11] the mea-sured values are lower. The proof stress is the lowest one of allsolders investigated at all temperatures. The elongation is thehighest one beside 50In50Pb at low temperatures. It is in goodcomparison with [10,11] at room temperature, at cryogenic tem-perature the elongation is lower. The fracture shows a high reduc-tion area at RT and at 77 K, at 4.2 K the fracture shows also areduction.
Fig. 11. Ultimate tensile strength at room temperature, 77 K and 4.2 K. Fig. 12. Proof stress at room temperature, 77 K and 4.2 K.
506 M. Fink et al. / Cryogenics 48 (2008) 497–510

Author's personal copy
3.9. 96.5Sn3Ag0.5Cu (inspection certificate: DIN 50049/EN 10204-3.1)
The temperature dependence of the ultimate tensile strength issimilar to the other Sn-based solders, except of 96Sn4Ag. The stressat the limit of proportionality is superior to the rest of the soldersat 4.2 K. The temperature dependence of the Young’s modulus aswell as of the elongation is similar to 63Sn37Pb. In the cross sec-tional area a reduction was found. For 4.2 K and 77 K brittle frac-ture with low elongation were found. The fracture surfaces of
this brittle solder are shown in Fig. 20 (photos taken after tensiletest at different temperatures).
As mentioned above, this solder could be tested in the as-re-ceived condition. Thus, a direct comparison of the measured valueswith the other solders should be regarded carefully.
4. Conclusions
4.1. Solder alloys
The measurements of the tensile properties of bulk solder de-pend greatly on conditions of casting (getting pore-free samples).
With decreasing temperature, Sn-based solders show a strongincrease in tensile strength (Rm � 135–149 MPa) and proof stress(Rp0.2 � 112–142 MPa), they are brittle with small elongations.Among them 96.5Sn3Ag0.5Cu shows the highest proof stress. For77 K and 4.2 K this solders are brittle with small elongations(A � 0.2–1.5 p.c.).
Comparing the Cu-content solder with 96Sn4Ag, for roomtemperature nearly the same tensile strength and proof stressare found. The elongation is clearly higher; the Young’s modulusis clearly lower. For low temperatures the elongation isnearly the same. The values found for the tensile strength and
Fig. 13. Elongation at rupture at room temperature, 77 K and 4.2 K.
Fig. 14. PCB 2302 MLB polyimide glass fibre - samples after tensile test at roomtemperature, 77 K, 4.2 K.
Fig. 15. PCB 2301 MLB epoxy glass fibre - samples after tensile test at roomtemperature, 77 K, 4.2 K.
M. Fink et al. / Cryogenics 48 (2008) 497–510 507

Author's personal copy
the proof stress are clearly higher. The proof stress of 96Sn4Ag at4.2 K could not be investigated. The Young’s modulus is somewhatlower.
In/Pb solders remain soft (E � 12–14 GPa) and ductile (A � 4.5–20 p.c.) at 4.2 K, but they have low strength (Rm � 29–76 MPa) andlow proof stress (Rp0.2 � 33 MPa).
The Pb-based solder combines medium strength with goodstiffness at superior ductility, but low proof stress.
4.2. PCB–bare materials
At 4.2 K the elasticity (E � 33 GPa) and the proof stress(Rp0.2 � 317 MPa) of PCB 2301 MLB epoxy glass fibre are superiorto the other tested PCB’s. PCB Thermount has the lowest elasticityand strength, its elongation is at low temperatures the smallest oneof the tested PCB’s.
4.3. Conformal coatings
At cryogenic temperatures all tested conformal coatings show astrong increase of strength, proof stress and elasticity, their elonga-tion decreases very strong. An exception is Arathane 5750 whichhas a high elasticity at all temperatures. The Young’s modulus,the strength and the proof stress of Solithane 113 is superior tothe other tested conformal coatings.
At room temperature the fracture surface of all investigatedconformal coatings is very smooth with extremely high elongation(up to 200 p.c. for Conathane EN4/EN11), at low temperatures it isbrittle, the elongation decreases to less than 10 p.c. At 4.2 K theelongation of Arathane 5750 (8.3 p.c.) is superior to the rest ofthe conformal coatings.
4.4. OFE copper
At cryogenic temperatures the proof stress, the elasticity andthe ductility of OFE Cu is superior to all other materials tested.
4.5. Overall findings
The selection of a solder for use at cryogenic temperatures willdepend on its mechanical properties, fatigue and the specific appli-cation like soldering temperature, possible dissolution of Au or Agfrom plated components or wires, etc. The mechanical propertiesof the tested solders offer a wide range from stiff and brittle to softand ductile materials. The differences in the strength and stiffnessof the solders increase at low temperatures so the mechanicalproperties should be considered carefully for the selection of onematerial.
The elasticity of all PCB materials is for all temperatures fromthe same order of magnitude like the values found for the solders.
Fig. 16. PCB Thermount fracture surfaces after tensile test at room temperature, 77 K, 4.2 K.
Fig. 17. Fracture surfaces of Solithane 113 - samples after tensile test at room temperature, 77 K, 4.2 K.
508 M. Fink et al. / Cryogenics 48 (2008) 497–510

Author's personal copy
Strength and proof stress of the PCB materials is always higherthan those of the solders. Generally, at room temperature the elon-gation of solders is higher than the elongation of PC boards, at 4.2 Konly the elongation of the In/Pb as well as the Pb-based solders ishigher.
For all temperatures the modulus of elasticity, the strength andthe proof stress of PCB materials is higher compared with thevalues found for conformal coatings. At all temperatures theelongation of the conformal coatings is superior to the elongation
of the PCB’s, but the relative differences diminish with respect to4.2 K.
At 77 K the tensile strength of Solithane 113 exceeds those ofthe solders; at 4.2 K it is lower. The stiffness of most conformalcoatings increases relatively to the solders (typically 1/20 at4.2 K, 1/5000 at room temperature). In combination with the largethermal expansion of the conformal coating the coating will im-pose considerable loads to the solder joints and have to be avoidedat cryogenic temperatures. An exception is Arathane 5750, its stiff-ness is at all temperatures investigated in the same order of mag-nitude (1.9–4 GPa).
Fig. 18. Solithane 113 fracture surfaces (SEM).
Fig. 19. Fracture surfaces of ductile solder (50In50Pb) performed with opticalmicroscope.
M. Fink et al. / Cryogenics 48 (2008) 497–510 509

Author's personal copy
References
[1] Semerad E, Scholze P, Schmidt M, Wendrinsky W. Effect of new cleaningliquids on electronic materials and parts. ESA metallurgy report no 3275;January 2002.
[2] Dunn BD. The properties of near-eutectic tin/lead solder alloys tested between+70 and �60 �C and the use of such alloys in spacecraft electronics. ESA TM-162 1975.
[3] Semerad E, Reithmayr P, Hahn P, Scholze P. Mechanical testing at cryogenictemperatures. WO 1990;7(July).
[4] Dunn BD, Desplat P. Evaluation of conformal coatings for future spacecraftapplications. ESA SP-1173 1994. August.
[5] Tschegg E, Kubasta E, Steiner W. A top loading 200 kN tensile testing cryostat.Cryogenics 1979. May.
[6] Rack HJ, Maurin JK. Mechanical properties of const tin-lead solder. J TestEvaluat 1974;2(5):351–3. September.
[7] Fast RW, Craddock WW, Kobayashi M, Mruzek MT. Electrical and mechanicalproperties of lead/tin solders and splices for superconducting cables.Cryogenics 1988;28(1):7–9.
[8] Metals handbook, vol. 9, American Society for Metals; 1985.[9] C. Lea. A scientific guide to surface mount technology, Electrochemical
Publications Ltd., 1988 Referenced: M.H. Manko; ‘‘Solders and soldering”.New York: McGraw-Hill; 1979.
[10] Ainsworth PA. The formation and properties of soft soldered joints. Metals andMaterials 1979:374–9.
[11] Ainsworth PA. Soft Soldering Gold Coated Surfaces, ITRI; 1971. pp. 1–4.[12] <www.goodfellow.com>.[13] Material data sheet of ‘‘Deutsches Kupferinstitut e.V., Am Bonneshof 5, D-
40474 Düsseldorf”: <http://www.kupfer-institut.de/front_frame/pdf/Cu-OFE.pdf>.
Fig. 20. Fracture surfaces of brittle solder (96.5Sn3Ag0.5Cu) performed with opticalmicroscope.
510 M. Fink et al. / Cryogenics 48 (2008) 497–510