Embed Size (px)
Citation preview
ORIGINAL PAPER
Spectral Signatures of Saccade Target Selection
Christine Carl • Joerg F. Hipp • Peter Konig •
Andreas K. Engel
Received: 27 June 2014 / Accepted: 2 February 2015 / Published online: 18 February 2015
� Springer Science+Business Media New York 2015
Abstract Action generation relies on a widely distributed
network of brain areas. However, little is known about the
spatiotemporal dynamics of neuronal activity in the net-
work that gives rise to voluntary action in humans. Here,
we used magnetoencephalography (MEG) and source
analysis (n = 15, 7 female subjects) to investigate the
spectral signatures of human cortical networks engaged in
active and intrinsically motivated viewing behavior. We
compared neuronal activity of externally cued saccades
with saccades to freely chosen targets. For planning and
execution of both saccade types, we found an increase in
gamma band (*64–128 Hz) activity and a concurrent
decrease in beta band (*12–32 Hz) activity in saccadic
control areas, including the intraparietal sulcus and the
frontal eye fields. Guided compared to voluntary actions
were accompanied by stronger transient increases in the
gamma and low frequency (\16 Hz) range immediately
following the instructional cue. In contrast, action selection
between competing alternatives was reflected by stronger
sustained fronto-parietal gamma increases that occurred
later in time and persisted until movement execution. This
sustained enhancement for free target selection was ac-
companied by a spatially widespread reduction of lower
frequency power (*8–45 Hz) in parietal and extrastriate
areas. Our results suggest that neuronal population activity
in the gamma frequency band in a distributed network of
fronto-parietal areas reflects the intrinsically driven process
of selection among competing behavioral alternatives.
Keywords Cortical saccade generation � Action
selection � Gamma band activity � Intraparietal sulcus �Frontal eye fields � MEG
Introduction
In everyday life we constantly face the challenge of se-
lecting between several action alternatives. For example, a
player in a soccer game acquiring the ball could either pass
it on to a team member or take a shot at the goal. Also he
has to re-adjust his choices both rapidly and flexibly to
account for the continuous changes in player constellations
resulting from his own movements and those of the others.
Increasing evidence suggests that this form of action se-
lection is not a sequential process where first the sensory
input is acquired, followed by a decision and subsequent
planning of an action. Rather, dynamic goal oriented be-
havior might be achieved by continuously encoding, up-
dating, and weighting sensory evidence, action goals and
plans for potential movements in parallel, so that different
action alternatives are constantly at hand (Shadlen and
Newsome 2001; Cisek and Kalaska 2010; Engel et al.
2013). These simultaneously evolving and competing ac-
tion plans may form an integral part of a distributed and
C. Carl � J. F. Hipp � P. Konig � A. K. Engel (&)
Department of Neurophysiology and Pathophysiology,
University Medical Center Hamburg-Eppendorf, Martinistrasse
52, 20246 Hamburg, Germany
e-mail: [email protected]
C. Carl � P. Konig
Institute of Cognitive Science, University of Osnabruck,
Albrechtstraße 28, 49069 Osnabruck, Germany
J. F. Hipp
Centre for Integrative Neuroscience, University of Tubingen,
Paul-Ehrlich-Str. 17, 72076 Tubingen, Germany
J. F. Hipp
MEG-Center, University of Tubingen, 72076 Tubingen,
Germany
123
Brain Topogr (2016) 29:130–148
DOI 10.1007/s10548-015-0426-6
Author's personal copy
emergent decision process that integrates perceptual, cog-
nitive and motor functions (Cisek and Kalaska 2010). In
support of this view, neural correlates of decision variables
have been observed in various cortical and subcortical re-
gions distributed across the brain, particularly including
those structures that are specific for sensorimotor pro-
cessing (Shadlen and Newsome 2001; Glimcher 2003;
Cisek 2007; Cui and Andersen 2007; Gold and Shadlen
2007; Hoshi and Tanji 2007; Pesaran et al. 2008; Andersen
and Cui 2009).
Physiological signatures of action selection have been
studied extensively in non-human primates and implicate
various areas of fronto-parietal sensorimotor association
cortex in voluntary action selection in the presence of
competing options (Haggard 2008; Kable and Glimcher
2009; Cisek and Kalaska 2010). These areas include ef-
fector specific regions in posterior parietal cortex and
frontal premotor areas (Lawrence and Snyder 2006; Cui
and Andersen 2007; Andersen and Cui 2009), which en-
gage in oscillatory coupling during internally motivated
choices (Pesaran et al. 2008). In humans, functional mag-
netic resonance imaging (fMRI), transcranial magnetic
stimulation (TMS), or clinical lesion studies have provided
evidence for distributed cortical substrates of action se-
lection including parietal and premotor areas (Milea et al.
2007; Coulthard et al. 2008; Beudel and de Jong 2009;
Oliveira et al. 2010; de Jong 2011; Hare et al. 2011). While
investigations of perceptual decisions have emphasized the
importance of oscillatory population activity mainly in the
beta and gamma frequency range in such sensorimotor
areas (Donner et al. 2009; Siegel et al. 2011; Gould et al.
2012; Wyart et al. 2012), the role of oscillatory dynamics
in human voluntary action selection between competing
behavioral alternatives remains largely unknown.
We here investigated oscillatory dynamics of voluntary
action selection in the human brain. In particular, we used
saccade target selection as a test case, which is a type of
action selection where selection of sensory input and motor
behavior are particularly tightly coupled. In order to ad-
dress fast oscillatory dynamics of saccade selection in
humans, we used MEG and source analysis, with a special
focus on the cortical oculomotor network. Cortical areas of
the human oculomotor network as known from various
fMRI studies include frontal and supplementary eye fields,
the parietal eye fields within the intraparietal sulcus, and
dorsolateral prefrontal cortex (Sweeney et al. 2007;
McDowell et al. 2008; Kagan et al. 2010; Anderson et al.
2012). Within this network, the parietal and frontal eye
fields have been attributed to spatial aspects of orienting
behavior and sensorimotor transformations from stimulus
encoding to motor planning of the saccade (Medendorp
et al. 2011). To study voluntary action selection we com-
pared spectral signatures for selecting a saccade target
among equally valuable targets with externally cued de-
layed saccades. While instructed saccades require only one
action plan, free action selection among equal targets in-
duces maximal competition between behavioral alterna-
tives and may engage enhanced competition also at the
neural level reflected in frequency specific power changes.
Indeed, we could differentiate fast orienting responses for
external saccade guidance from long lasting presumably
competitive processes where a decision about an action
emerges intrinsically, independent of any external in-
struction. More specifically, we found that oscillatory
population activity of a fronto-parietal network within
gamma and alpha—beta frequency range is associated with
internally driven action selection between competing be-
havioral alternatives. This signature of neuronal activity
within sensorimotor structures supports models suggesting
that the selection of action emerges in a distributed way
integrated with sensory and motor processes.
Materials and Methods
Participants
Fifteen healthy volunteers recruited mainly among uni-
versity students participated in this study (seven female,
eight male, mean age 25.7 ± 3.3). Participants received
monetary compensation for their participation. All par-
ticipants had normal or corrected-to-normal vision and had
no history of neurological or psychiatric illness. According
to self-report all subjects were right-handed.
Stimulation and Behavioral Task
Participants performed a delayed saccade task with sac-
cades of two different amplitudes and 8 different directions
(16 targets, Fig. 1). The delayed saccade task consisted of
two experimental task conditions: In the memory-guided
saccade condition, participants were asked to perform a
guided saccade to one of the 16 targets indicated by a brief
visual cue before the delay period. In the decision condi-
tion subjects could freely chose a saccade target out of the
same 16 target positions (we will refer to these conditions
as guided and free saccades, respectively).
At the beginning of each trial, subjects fixated for 800 ms
a blue asterisk presented in the center of the screen. Sur-
rounding the asterisk, 16 Gaussian patches were regularly
arranged (width: 0.34�) on an inner and outer circle (distance
from the asterisk: 5� and 10� respectively) serving as saccade
targets. The background was grey, the peak of the Gaussian
patches was white. Following fixation, the asterisk under-
went a 200 ms isoluminant color change to either green (free
saccade) or green with a red marker (guided saccade) that
Brain Topogr (2016) 29:130–148 131
123
Author's personal copy

indicated the task for each trial and served as a spatial cue. In
the guided saccade condition the position of the red marker
defined the direction of saccade target and instructed par-
ticipants to prepare a saccade to this location. Moreover, the
marker indicated a small saccade or a large saccade by being
displayed at the inner or the outer part of the asterisk’s
branch, respectively. In the free decision task, a color change
to a fully green asterisk instructed subjects to immediately
choose one out of the 16 target alternatives and prepare a
saccade to the freely chosen location. In both conditions
participants had to maintain fixation during the following
delay period of 1 s. Then, the asterisk disappeared instruct-
ing the subjects to perform the saccade. Subjects were told to
maintain fixation at saccade target until it disappeared after
1.25 s. In between trials, a blank screen was presented for
1 s. In total each subject performed 702 trials (352 for free
decision and guided saccade task, respectively; for the
guided saccade task all 16 targets were cued equally often).
Trials of all experimental conditions (guided and free sac-
cades, as well as saccade targets in the guided saccade con-
dition) were randomly presented. Each recoding was divided
in two experimental blocks of approximately 33 min
duration.
During the experiment, participants were seated in the
MEG chamber. Stimuli were back-projected onto a screen
at 60 cm distance with an LCD video projector (Sanyo Pro
Xtrax PLC-XP51) and a two-mirror system. Stimuli were
presented using the software Presentation (Neurobehav-
ioral Systems, Albany, CA).
Analysis Software
All data analyses were performed in R (R Core Team 2013)
and Matlab (MathWorks, Natick, MA) with custom im-
plementations and the open source toolboxes Fieldtrip
(Oostenveld et al. 2011), and SPM2 (http://www.fil.ion.ucl.
ac.uk/spm/).
MEG Data Acquisition
We recorded MEG continuously with a 275-channel (axial
gradiometer) whole-head system (Omega 2000, CTF Sys-
tems) in a magnetically shielded room. MEG data were
digitized at 1200 Hz sampling rate (300 Hz low-pass fil-
ter). Off-line, we removed line-noise with notch-filters (at
50, 100, and 150 Hz), high- and low-pass filtered the data
to 1 Hz and 170 Hz respectively (zero phase Butterworth
IIR filter, filter order 4), and down-sampled it to 400 Hz.
Electrooculogram (EOG) Recordings
Along with the MEG, we recorded the EOG using the
electroencephalography (EEG) channels of the CTF MEG
system. Data were collected from AG/AGCL sintered flat
electrodes (Easycap GmbH, Herrsching, Germany) with an
analog passband of 0.16–300 Hz at a sampling rate of
1200 Hz. 7 EOG electrodes were placed over the nose,
above and below each eye at the outer canthi, and below
the left and right eye next to the nose. Data were referenced
to an electrode placed at the tip of the nose during the
recording. All electrode impedances were below 10 kX.
Off-line, the EOG were high- and low-pass filtered (cut-off
1 and 170 Hz respectively, zero phase Butterworth IIR
filter, filter order 4) and down-sampled to 400 Hz.
Structural MRI Acquisition
We acquired individual T1-weighted 1 mm3 high-resolu-
tion structural images (MRIs) of each subject with a 3T
Siemens MAGNETOM Trio Scanner using a coronal
a b
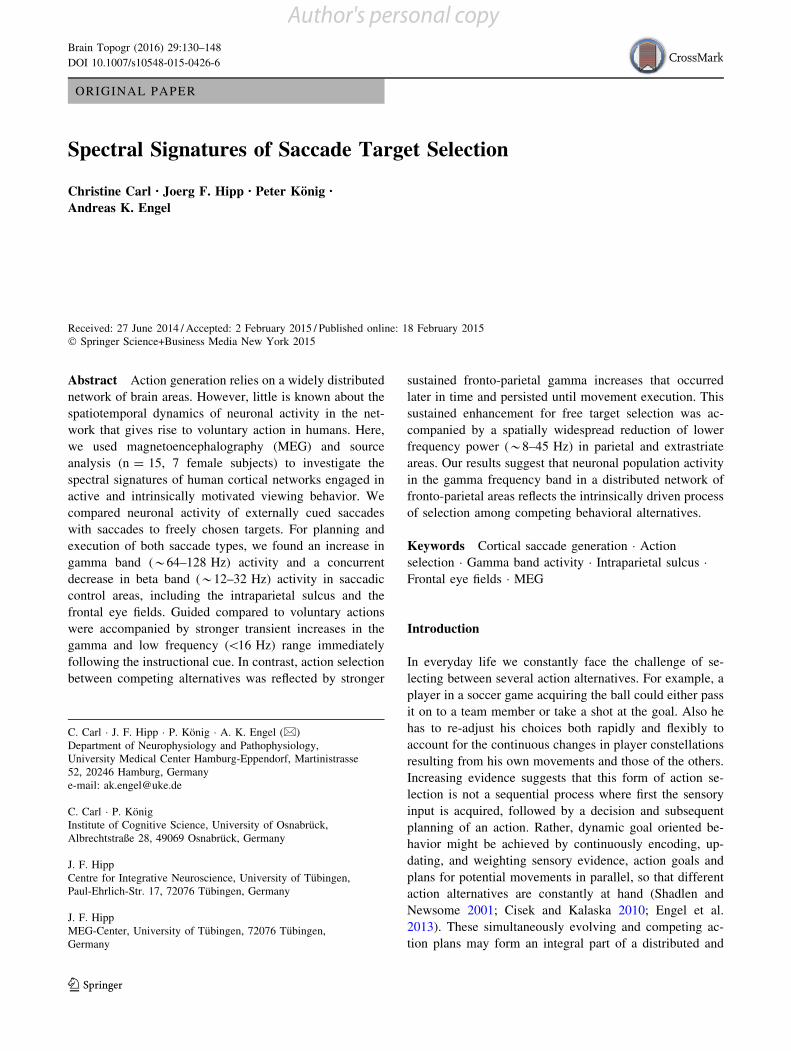
Fig. 1 Experimental task. a At trial onset subjects fixated a blue
asterisk presented in the center of the screen. After a delay of 800 ms
an isoluminant color change to green with a red marker instructed the
target location of guided saccade trials. In half of the trials, a change
to green without red marker instructed the subjects to freely choose
one of the 16 targets. In the displayed example, the red marker
instructed the subject to plan a short saccade to the right. After a delay
of 1 s the asterisk disappeared and instructed the subject to execute
the saccade. Top Representative eye traces of one participant over the
first 9 trials for the displayed condition (guided short saccade to the
upper right target). b Cue examples for guided and free saccade trials
132 Brain Topogr (2016) 29:130–148
123
Author's personal copy
magnetization-prepared rapid gradient echo sequence.
These MRIs were used to construct individual head models
for source analysis.
Eye Tracker Recording
Along with the neurophysiological data we recorded the
eye position using an MEG compatible remote eye tracker
system (iView X MEG 50 Hz, SMI, Berlin, Germany). The
system monitored the right eye with an infrared camera to
detect the pupil center and the corneal reflection of the
infrared light source. After calibration (9 points) the system
determined the gaze direction from the relative position of
pupil and the corneal reflection at a rate of 50 Hz. Addi-
tionally, eye traces were digital to analog converted and fed
to the MEG system on-line. This on-line procedure intro-
duced temporal offsets on the order of 10th of milliseconds
between eye tracker signal and MEG/EOG data and was
characterized by undesirable ringing artifacts but served as
a coarse reference for the first alignment of the eye tracker
and MEG/EOG signals.
Off-line, we aligned the digital eye tracking data to the
MEG/EOG in a 2-step procedure: First, we interpolated the
50 Hz signal to 400 Hz using cubic smoothing splines and
computed the cross-correlation of the interpolated digital
eye tracker signal with the analog version recorded with the
MEG acquisition system. Then, we accounted for the offset
identified by the latency of the peak in the cross-cor-
relogram. In a second step, we refined the alignment and
corrected for the offset between the EOG and the aligned
eye tracker signal. To this end, we smoothed the data with a
Savitzky-Golay filter (4th order, 102.5 ms), rectified and
averaged all channels of both the EOG and the eye tracker
signals, and estimated the offset from the peak of the cross-
correlation.
To improve the range of validity of the eye tracker
signal, we interpolated missing data. We detected periods
with loss of eye tracking signal characterized by pupil size
and gaze positions values close to zero. If these data seg-
ments were not identified as blinks (see ‘‘Artifact rejec-
tion’’ section), we interpolated the missing data by
piecewise constant interpolation.
Artifact Rejection
Trials contaminated with muscle artifacts, signal jumps, or
distortions of the magnetic field due to, for example, cars
passing in front of the building were rejected off-line using
semi-automated threshold procedures applied to the MEG
signals. Since eye movements are part of the experimental
design standard EOG based procedures to detect eye blinks
fail. We detected eye blinks within each trial (-1.7 to
3.65 s from cue onset) by threshold-based procedures of
the eye tracker and EOG signal in combination with visual
inspection. For the eye tracker, data with vanishing pupil
diameter coinciding with a small gaze parameter value for
at least 60 ms were detected as potential blink artifacts.
Blink detection within the EOG signal was based on a
Fieldtrip function that detects high amplitudes in the
z-transformed (across trials per condition) and band-passed
(1–15 Hz) EOG data. If the sum of z-values divided by the
square route of the number of channels exceeded 1 the
period was marked as potential artifact. Trials were then
rejected by visual inspection, if the actual trials of -0.4 s
before to 2.3 s after the cue were contaminated by con-
current blink detection in the EOG and eye tracker data.
Finally, we reviewed all MEG, eye tracker, and EOG sig-
nals to ensure good artifact rejection performance. On
average across subjects, 17.0 ± 9.2 % (mean ± SD) of the
trials were rejected.
Cleaning of Eye Movement Artifacts
Saccades induce two major kinds of eye movement arti-
facts: the corneo-retinal artifact, resulting from the rotation
of the eyeball, and the saccadic spike artifact, which ori-
ginates from the contraction of the extraocular muscles at
saccade onset. Since we investigated MEG signals during
the execution of regular saccades it is especially important
to account for these artifacts. However, even during fixa-
tion periods eye movements occur in form of microsac-
cades and related artifacts can seriously distort the EEG or
MEG signal (Yuval-Greenberg et al. 2008; Carl et al.
2012).
To clean the MEG signal from eye movement artifacts,
while preserving all neuronal activity, we performed a two-
step process. First, corneo-retinal artifacts were removed
by linear regression based on the EOG signals. Second, we
attenuated the saccadic spike artifact and possibly re-
maining eye movement related artifacts using independent
component analysis (ICA). Note, that by applying these
cleaning procedures throughout all analyzed data periods,
we did not only suppress the artifacts originating from
regular saccades but also those from microsaccades during
fixation periods.
In order to remove corneo-retinal artifacts we used an
EOG based linear regression technique (Gratton et al.
1983; Croft and Barry 2000; Schlogl et al. 2007). To obtain
the appropriate subject-specific regression coefficients, we
recorded 3 min of voluntary eye movements on a grey
screen before and after each experimental block. In order to
derive regression coefficients that capture the relation be-
tween EOG and MEG signals for all saccade directions, we
instructed subjects to look actively around on the grey
screen and confirmed good spatial coverage of viewing
behavior by online visual inspection. The resulting
Brain Topogr (2016) 29:130–148 133
123
Author's personal copy

calibration signals were cleaned from non-saccadic arti-
facts, preprocessed, and then served to compute the linear
relation between the EOG sensors (7 EOG electrodes ref-
erenced against an electrode at the nose, and reduced to 3
dimensions using principal component analysis) and each
MEG channel (cf. Schlogl et al. 2007). MEG data were
then cleaned by subtracting the weighted EOG signal.
EOG based regression without a radial component with
posterior reference—although otherwise superior in per-
formance to regressions based on such a component—
performs weak in removing the saccadic spike artifact (cf.
Plochl et al. 2012). Because ICA has been shown to be
especially suited to attenuate the saccadic spike artifact for
EEG (Keren et al. 2010; Hassler et al. 2011; Kovach et al.
2011; Plochl et al. 2012; Hipp and Siegel 2013), we sub-
sequently applied ICA on the cleaned data (Hyvarinen and
Oja 2000, Jung et al. 2000). ICA aims at finding a linear
transformation of the sensor signal that separates the pu-
tative underlying sources by maximizing their statistical
independence. Because the number of sources that can be
separated by ICA is limited to the number of sensor
channels, its performance for artifact suppression depends
strongly on the data selection used for computation. To
better isolate the saccadic spike artifact from the cerebral
sources, it was proposed to augment it’s contribution to the
overall variance of the signal by restricting the signal to the
dominant spectral range of the artifact (Kovach et al.
2011), selecting relevant data periods that emphasize the
artifact but still include all cerebral sources of interest
(Keren et al. 2010), or including additional ‘virtual’
channels that focus on the saccadic spike artifact (Hassler
et al. 2011). A clear separation of eye movement artifacts
from any other cortical signal related to the saccade is
especially important when studying the cortical signals of
saccade generation themselves. In the present study, we
therefore maximized this separation by combining ap-
proaches of the above-cited EEG studies to our ICA
analysis.
In detail, we computed a two-step ICA separately for
each subject using the extended infomax algorithm (Lee
et al. 1999). In order to remove saccadic spike artifacts, we
computed an ICA on the band limited data of 24–160 Hz, a
spectral band that includes the characteristic spectral range
of the saccadic spike artifact (Jerbi et al. 2009; Keren et al.
2010; Kovach et al. 2011; Carl et al. 2012). The ICA was
computed for each subject on the concatenated data of the
trial periods and additional perisaccadic time intervals of
each trial (50 ms before and after the saccade onset). Ar-
tifact components were selected based on visual inspection
of their topography, the spectral power and the single trial
saccade related response of the independent components
(cf. Carl et al. 2012, for a spatial distribution of the sac-
cadic spike artifact in MEG). To further reduce cardiac
artifact components and possibly remaining eye movement
artifacts we rerun the ICA analysis on the broadband
cleaned signal including EOG channels normalized to the
standard deviation of the MEG channels. With this 2-step
approach, we found on average one saccadic spike com-
ponent per subject and 1–2 other artifactual components.
Note that we performed all comparisons of experimental
conditions in source space, thereby further reducing the
risk of artifactual contamination by saccade related arti-
facts (cf. Hipp and Siegel 2013).
Behavioral Analysis
For detection of regular saccades we employed a velocity
threshold based algorithm on the eye tracker data. If cou-
pled with a minimum saccade duration criterion, this al-
gorithm has very few parameters and is accurate in the face
of stereotypical eye movements such as those analyzed
here (Salvucci and Goldberg 2000). Because the optimal
velocity threshold parameter depends on preprocessing and
sampling of the recorded data, as well as on saccade am-
plitudes, we defined the velocity threshold in a data-driven
approach. We adapted the thresholds manually for the
saccade amplitudes in our task (58 and 108) so that sac-
cades were detected while the number of false positives
was minimized. We achieved this by visual inspection of
the data, taking into account a priori knowledge on saccade
timing. We defined periods as regular saccades in which
the eye movement velocity was higher than 26.9�/s for a
duration of at least 22.5 ms. Periods where the saccade
velocity exceeded 67.1�/s were defined as saccades irre-
spective of saccade duration. We combined all saccade
intervals that were less than 7.5 ms apart from each other
into a single saccade interval. All other periods were la-
beled as fixations.
We aligned all trials either to the cue or to saccade
onset. Precise alignment to saccade onset relied on the
EOG signal with higher temporal resolution than the eye
tracker signal.
The behavioral analysis revealed that subjects showed a
considerable variability in saccade onset and also initiated
saccades before the ‘go’ signal. To maximize the number of
trials for analysis and at the same time ensure sufficient data
length of the saccade planning and re-fixation period, we
accepted trials with saccades that were performed within a
broad time window from 250 ms before to 450 ms after the
‘go’ signal. In a next step, we rejected all trials with incorrect
saccade orientation or amplitude. For saccade categorization
we applied drift correction at the fixation period before the
cue onset (-300 to -100 ms) and ensured that the subjects
fixated the asterisk before saccade onset within a tolerance
angle of 2.5�. In the guided saccade condition saccade target
was considered correct if the closest location was the cued
134 Brain Topogr (2016) 29:130–148
123
Author's personal copy

one, for free decision trials chosen saccade target was defined
as the closest of the 16 target points if it was maximally 2.5�away from it. Overall we discarded 15.8 ± 9.2 %
(mean ± SD) of the trials because of faulty behavioral
performance.
For the decision contrast we modified the definition of
valid trials. Neuronal signatures of free target selection can
occur within the whole delay period. Consequently, for all
decision related contrasts (free vs. guided saccades, free or
guided saccades vs. baseline respectively) we analyzed the
entire delay period of 1.2 s. For these analyses, we rejected
all premature saccades that were performed before the ‘go’
signal. For 2 out of the 15 subjects less than 25 % of the
trials remained after rejecting these premature saccades.
We excluded these two subjects in the analyses of decision
processes.
To test for significant differences between free and
guided saccades in saccade metrics like saccade latency,
velocity, duration, or accuracy, we performed random
permutation tests: For each saccade metric of interest (or
the variance thereof), we computed the mean difference
between free and guided trials, averaged across subjects
and compared this value to the null hypothesis distribution
generated by randomly permuting free and guided condi-
tion labels within each subject and computing the same
difference for 10,000 iterations.
If subjects systematically preferred left or right target
sides in the free decision condition, this may have led to
systematic power changes due to lateralized power changes
related to saccade preparation confounding decision related
contrasts. To test if subjects had a preference in selecting
specific saccade targets in the free decision condition we
tested for such a bias within subjects and across subjects in
an analysis that mirrored the fixed effects analysis of
conditional spectral power differences. In both cases, we
encoded chosen saccade targets as 8 directional vectors of
unit length from the initial fixation position at the screen
center to the direction of the Gaussian blobs. We then
computed the average direction vector across trials within
each subject. If all saccade target directions are chosen
equally often this vector results in zero. In the single
subject analysis we tested if the average direction vector
for chosen targets in the free saccade condition was sig-
nificantly different from a distribution of average vectors
generated by 10,000 times drawing from a uniform distri-
bution of saccade target directions. Equivalent to the sta-
tistical comparisons of spectral power between free and
guided trials we also tested for a significant difference in
target distribution of the trials between free and guided
saccades across subjects: We computed the mean differ-
ence of the average saccade direction vector for free and
guided saccades (free-guided) across subjects and com-
pared this difference to a random permutation distribution.
This distribution was generated by 10,000 times permuting
condition labels of free and guided saccades within each
subject, computing the difference in average direction be-
tween these conditions and calculating the average of these
values across subjects.
Free target selection might further be influenced by the
history of previous saccade targets. In order to evaluate
whether the saccade target of the previous trial influenced
the choice of the next trial, we calculated the frequency of
free decision trials with the same saccade target as the
preceding trial, irrespective of whether this trial was a free
or guided saccade. We tested whether the frequency of
choosing the same saccade target was significantly differ-
ent from a binomial distribution with the probability of
choosing the same target p = 1/16 within each subject.
Spectral Analysis
We estimated spectral power using the multi-taper method
based on discrete prolate spheroidal (slepian) sequences
(Thomson 1982; Mitra and Pesaran 1999). Spectral esti-
mates were computed across 19 logarithmically scaled
equidistant frequencies from 5.7 to 128 Hz (in 0.25 octave
steps) and up to 34 points in time from -1.25 to 0.4 s for
the saccade-aligned data (-0.05 to 1.6 s for the cue-
aligned data, 0.05 s steps). We adjusted the temporal and
spectral smoothing using the multi-taper method so that it
matched approximately 250 ms and 3/4 octaves, respec-
tively. For frequencies C16 Hz we used temporal windows
of 250 ms and adjusted the number of slepian tapers ac-
cordingly to the spectral smoothing of 3/4 octaves. For
frequencies\16 Hz we adjusted the time window to yield
a frequency smoothing of 3/4 octaves with a single taper.
To estimate signal power, we multiplied the complex
spectrum with its complex conjugate and averaged this
across trials and tapers. We characterized the power re-
sponse relative to the pre-stimulus baseline.
To derive the baseline power estimate, we selected ana-
lysis windows that stopped at the onset of the instruction cue,
where possible (for frequencies [10 Hz). For frequencies
C16 this resulted in a baseline at t = -0.125 s. Owned to the
size of the analysis window for low frequencies, and given
that valid data started-400 ms before the presentation of the
instruction cue, the baseline reached into the presentation of
the instruction cue for frequenciesB9.5 Hz (9.5 Hz: 0.015 s,
8 Hz: 0.093 s, 6.7 Hz: 0.185 s, 5.6 Hz: 0.298 s).
Source Analysis
Estimating the neural activity at the source level requires a
physical forward model or leadfield that describes the
electromagnetic relations between sources and sensors. To
derive this physical relation we employed a single-shell
Brain Topogr (2016) 29:130–148 135
123
Author's personal copy

volume conductor model (Nolte 2003). We computed two
physical forward models for each subject that differed in
spatial resolution and distribution of source locations.
Sources of one model covered the whole brain with a
regular grid in MNI space of 1 cm resolution resulting in
3648 sources. Sources of the second model were distributed
with a spacing of 1 cm on a shell lying 1 cm beneath the
skull (for a detailed description of the source grid see Hipp
et al. 2011). This model comprises only 400 source loca-
tions and samples the source space more sparsely than the
first model. However, the second model still ensures ho-
mogeneous coverage across the cortex. To derive the in-
dividual physical forward models for each subject, we
affine transformed source locations into individual head
space using the participants’ individual T1-weighted
structural MRI and aligned the MEG sensors to the head
geometry based on 3 fiducial points (nasion, left and right
ear, defined in the MEG by 3 head localization coils).
We used adaptive linear spatial filtering (‘beamforming’
Van Veen et al. 1997; Gross et al. 2001) to estimate the
amplitude of neural population signals at cortical source
level. In short, for each source location, three orthogonal
linear filters (for the three orientations at each source) were
computed that pass activity from that location with unit
gain, while maximally suppressing activity from any other
source. Subsequently, the filters were linearly combined to
a single filter that points to the direction of the dominant
dipole. For each experimental contrast (e.g., activation
versus baseline or left versus right saccades), we derived a
separate filter estimation from the real part of the cross-
spectral-density matrix at each point in time and frequency.
To avoid a bias of the filter, we randomly choose trials to
equalize the trial number between the experimental con-
trasts at hand before computing the filter. To derive the
complex source estimates, the complex frequency domain
data were then multiplied with the real-valued filter. To
estimate power in source space we multiplied the complex
spectral estimate with its conjugate and averaged across all
trials and tapers.
For illustration of the sources we overlaid the functional
data onto the structural MRIs of the segmented surface or
cut surface of the ‘colin27’ MRI T1 average (Holmes et al.
1998), masked non-significant values (see ‘‘Statistical
analysis of spectral power’’ section), and interpolated the
source data to 1 mm resolution. We express changes of
spectral power either as percentage change (relative to
baseline), as contrast, or as z-scores (cf. Medendorp et al.
2007).
Definition of Regions of Interest
To further investigate neuronal activity in areas of the
cortical oculomotor network (Sweeney et al. 2007;
McDowell et al. 2008; Anderson et al. 2012), we defined
regions of interest (ROIs) based on coordinates of areas
identified in an fMRI study that examined cortical areas
involved in saccade planning and execution in a similar
delayed saccade task (Kagan et al. 2010). We adapted the
selection and labeling of ROIs to better suit the spatially
coarser resolution of MEG. We defined 3 regions along the
intraparietal sulcus: the posterior intraparietal sulcus (pIPS;
V7 in Kagan et al. 2010), middle intraparietal sulcus
(mIPS; union of areas IPS2 and retIPS in Kagan et al.
2010), and anterior intraparietal sulcus (aIPS). The ROI for
the frontal eye fields (FEF) was defined as the union of
lateral and medial frontal eye fields (cf. Kagan et al. 2010).
We further defined a ROI for the supplementary eye fields
(SEF) and the dorsolateral prefrontal cortex (dLPFC).
Furthermore, we created a ROI for early visual areas (V1).
For defining the frontal and parietal ROIs we trans-
formed Talairach coordinates of ROI centers reported in
Kagan et al. (2010) into MNI space using the transform
functions suggested by Lancaster et al. (2007) and identi-
fied nearest neighbors of this MNI coordinate to the source
location of the used leadfield (1 nearest neighbor for the
single shell leadfield and 7 nearest neighbors for the fine
grained leadfield covering the whole cortex). The position
of V1 was defined as all nearest neighbors of the source
locations of the used leadfield to the template of Brodman
area 17 provided by MRIcroN. Using this ROI definition
for the template brain, employed ROI labels may not de-
note exact anatomical regions within the single subjects.
However, it should be noted that source analysis of MEG
data is an ill-posed problem and results at best in a spatially
blurred image of the true brain activity. We therefore de-
fined ROIs considering these limits in spatial resolution of
the MEG.
Statistical Analysis of Spectral Power
For statistical testing of differences in spectral power be-
tween conditions, we first log-transformed the power val-
ues to render the distributions more normal. For each
subject, we then computed a 2-sided paired t test of spectral
power between conditions for each source or ROI at each
time and frequency window, transformed t-values into
z-scores, averaged across subjects, and multiplied with the
square root of the number of subjects. This procedure im-
plements fixed-effects statistics for each time–frequency-
voxel volume, a test of the typicality of an effect within a
relatively homogeneous subset of the population.
We made little a priori assumptions and tested for
spectral power effects throughout the cortex and resolved
in time and frequency. More specifically, we investigated
power differences at 5 continuous frequency ranges cor-
responding approximately to the classical frequency bands
136 Brain Topogr (2016) 29:130–148
123
Author's personal copy
known from EEG and MEG (theta 5.7–8 Hz, alpha
8–16 Hz, beta 16–32 Hz, low gamma 32–64 Hz, and high
gamma 64–128 Hz) and time intervals of 100 ms length in
100 ms steps if not indicated otherwise. The high dimen-
sional time–frequency-voxel space results in substantial
multiple comparisons that need to be accounted for. We
differentiated two cases in our analysis, strong baseline
effects and more subtle condition contrasts:
Since the comparison of activation against baseline
generally yields strong effects, we computed these power
differences on the more detailed regular source grid cov-
ering the whole cortex (3648 sources) and accounted for
multiple comparisons across the time–frequency-voxel
space using false discovery rate (FDR) correction (Ben-
jamini and Hochberg 1995; Genovese et al. 2002) with
q = 0.05.
For comparing the smaller signal differences between
free versus guided saccades or between horizontal saccade
directions we employed the forward model that covers the
cortex in a single shell at 1 cm below the skull’s surface
comprising 400 sources or an adapted subset thereof. We
accounted for multiple comparison correction within this
4 dimensional time–frequency-voxel space (2 dimensions
for space because of the planar geometry of the source
grid) by a cluster based random permutation approach. In
particular, we identified bins in the time–frequency-voxel
space whose t-statistic exceeded a threshold correspond-
ing to a significance level of p\ 0.05, resulting in a bi-
nary matrix with values of 1 for bins larger than the
threshold. For each time and frequency bin separately, we
identified clusters in voxels of this binary matrix that are
linked through direct neighborhood relations (neighboring
voxels with 1). Such a cluster corresponds to a network of
cortical regions with different spectral power between
conditions that is continuous across space. For each
cluster, we defined its size as the integral of the statistical
z-scores of the power differences between conditions
across the volume of the cluster and tested its statistical
significance using a random permutation statistic: For
each separate time and frequency bin, we repeated the
cluster identification 1000 times (starting with the t-s-
tatistic between conditions) with shuffled condition labels
to create an empirical distribution of cluster sizes under
the null-hypothesis of no difference between conditions.
The null-distribution was constructed from the largest
clusters (two-tailed) of each resample across all time and
frequency bins, therefore accounting for multiple com-
parisons across space, time, and frequency bins (Nichols
and Holmes 2002).
Note that, direction specific neuronal activity for sac-
cades to the left and the right can be assumed to be largely
mirror symmetric and hemispherically lateralized (cf.
Medendorp et al. 2007; Van Der Werf et al. 2008).
Therefore, we combined data for the direction specific
contrast by subtracting power of right from left ho-
mologous source locations and dividing this by 2. Data was
then visualized only on the left hemisphere.
To further elucidate the spectro-temporal evolution of
signal power at a finer scale, we show time frequency
spectra at selected ROIs across all time frequency points
computed in the source analysis (see ‘‘Spectral analysis’’
section). In order to visualize the extent of important
spectral changes in frequency bands and latencies, we mask
spectra statistically, using an uncorrected threshold at a
significance level of p\ 0.05. Direction specific neuronal
activity for saccades to the left and the right can be as-
sumed to be largely mirror symmetric and lateralized to the
contralateral hemisphere. Therefore, we combined data for
the direction specific contrast by subtracting power of right
from left homologous ROIs and dividing this by 2. In order
to illustrate the directional specificity for free and guided
saccades separately, we computed the Michelson contrast:
We subtracted average of left from average of right sac-
cades divided by the mean sum of the power of both
conditions and subsequently averaged mirrored left and
right ROIs. For all other investigations, where lateraliza-
tion of direction independent saccade related activity was
weak, we averaged spectral power of homologous ROIs of
the two hemispheres.
Results
We investigated neuronal activity related to human saccade
target selection, planning, and execution by measuring
MEG and gaze position in a delayed saccade task (Fig. 1)
using a fixed-effects analysis (15 subjects, mean age
25.7 ± 3.3, for decision related contrasts 2 subjects out of
these 15 were excluded). In each experimental trial, sub-
jects either performed a cued saccade to one of 16 targets
or were free to choose a target. We first studied general
signatures of saccade planning and execution. Then, by
contrasting free and guided saccades we differentiated
voluntary action selection processes between competing
alternatives from guided saccade selection.
Oscillatory Signatures During Saccade Planning
and Execution
We pooled data of guided and free saccades across all
directions and amplitudes, to investigate changes in local
population activity relative to a pre-cue baseline reflecting
processes of saccade planning and execution. In particular,
we analyzed changes in spectral power of saccade-aligned
signals in 6 time windows ranging from 600 ms before to
400 ms after saccade onset and in 5 frequency bands from
Brain Topogr (2016) 29:130–148 137
123
Author's personal copy

the theta (5.7–8 Hz) to the high gamma range (64–128 Hz)
(Fig. 2).
We found sustained and spatially widespread changes
in spectral power during saccade planning and execution
in fronto-parietal areas (t test, p\ 0.05, FDR corrected
for number of sources, time, and frequency windows,
n = 3648 9 6 9 5, maximal absolute percentage change
of significant voxels across time and space: theta:
74.89 %; alpha: 50.90 %; beta: 69.74 %; low gamma:
28.68 %; high gamma: 15.01 %). During the delay peri-
od, before saccade execution, we identified a sustained
increase in high gamma power (64–128 Hz) in posterior
and medial parietal areas along the intraparietal sulcus
and precuneus. This activity extended to anterior regions
of intraparietal sulcus and to the frontal and supplemen-
tary eye fields before the upcoming saccade. Following
the saccade, gamma power further increased in posterior
and medial parietal areas. In the beta frequency range
(16–32 Hz), spectral power was reduced along the intra-
parietal sulcus in the superior parietal lobe during the
delay period. Shortly before saccade execution the de-
crease in beta power extended to frontal regions around
the frontal eye fields and the supramarginal gyrus, where
it persisted during re-fixation. After saccade execution,
also power in the alpha frequency band (8–16 Hz win-
dow) reduced in posterior portions of the parietal and
occipital cortex. After saccade onset a transient broadband
spectral power increase (all frequency windows up to
64 Hz) originated from early visual areas. The medial
portion of extrastriate visual areas also showed a sus-
tained increase in alpha power during the delay period.
To resolve the time-courses and bandwidth of the ob-
served spectral power changes, we computed time–fre-
quency spectrograms with a high resolution for selected
ROIs of the fronto-parietal saccade related network (see
‘‘Materials and Methods’’ section, Fig. 3). Increases in the
gamma band in the fronto-parietal regions (FEF, aIPS,
mIPS, and pIPS) were sustained throughout the delay pe-
riod (from time t = -600 to 0 ms) and ranged from 45 to
128 Hz. Increases intensified at saccade onset in all these
ROIs and persisted in parietal ROIs and early visual areas
(V1) during the whole re-fixation period that was analyzed
(up to 400 ms after saccade onset). The decrease in beta
power, strongest at 16–23 Hz, was sustained in frontal and
parietal ROIs (FEF, aIPS and mIPS) throughout the ana-
lysis window (starting 600 ms before saccade onset) and
appeared in SEF approximately 300 ms before the saccade.
A sustained alpha increase throughout the delay was
strongest in posterior areas (pIPS, V1). pIPS and V1 also
showed strong spectral changes during re-fixation: The
transient broadband increase around 32 Hz at ap-
proximately 100 ms after saccade onset was followed
50 ms later by a decrease in intermediate frequency range
at 8–23 Hz. Power in the low frequency range of theta
below 8 Hz was increased and probably reflected visual
evoked event related responses.
In summary, these results revealed a dichotomy of
oscillatory activity in widespread fronto-parietal networks
Fig. 2 Spectral power changes during saccade planning and execu-
tion. Average change in spectral power relative to pre-cue baseline
(*52–125 ms before cue onset, depending on the frequency) across
free and guided saccades. Average power changes are shown for
different points in time and frequency resolved in cortical space. Data
are aligned to saccade onset (at time t = 0 ms). The color bar limits
are adapted to the specific range of power changes for each frequency
(denoted by m, e.g. for the beta band the color map shows relative
frequency changes compared to baseline from -24 to ?24 %). Power
changes are statistically masked for significant difference from zero
(t test, p\ 0.05, FDR corrected)
138 Brain Topogr (2016) 29:130–148
123
Author's personal copy

associated with delayed saccades, with increases of high
frequency (gamma) activity and decreases of low fre-
quency (beta) activity. Furthermore, visual areas were
characterized by strong broadband power changes after the
saccade.
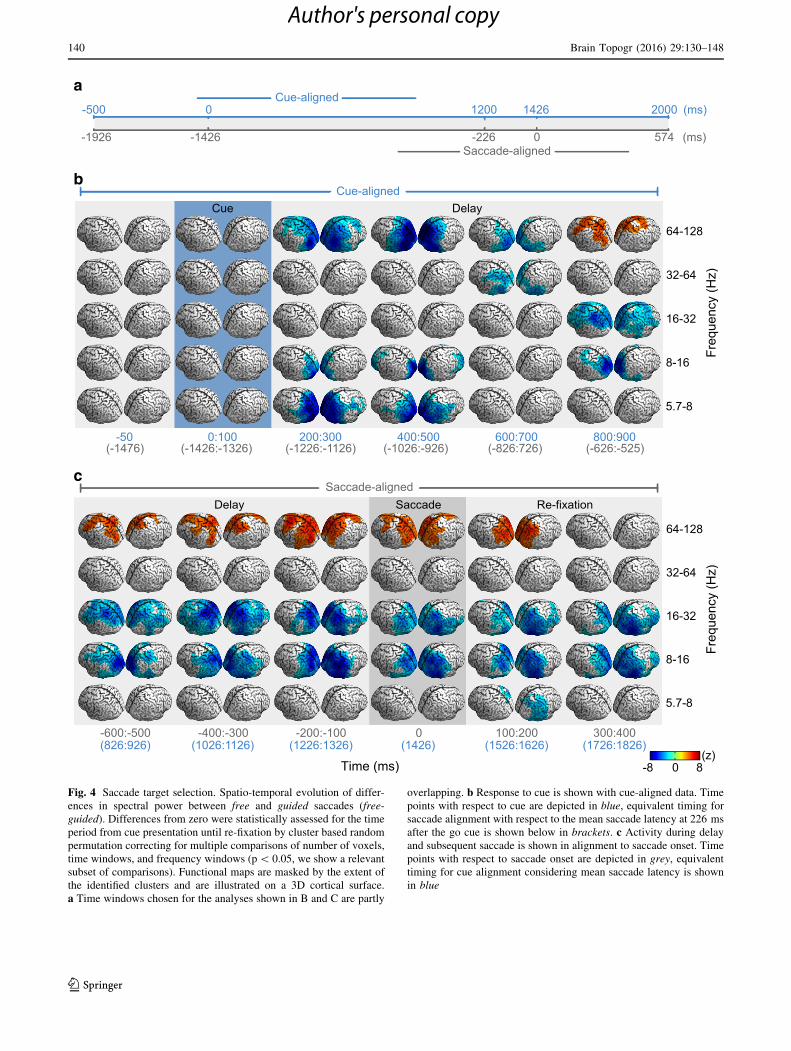
Oscillatory Signatures of Saccade Target Selection
Next, we investigated oscillatory activity specifically re-
lated to the selection of saccade targets. To this end, we
contrasted spectral power between free and guided saccade
trials. The reasoning was that, in guided trials, the spatial
cue immediately leads to the selection of a specific motor
plan while in free saccade trials subjects were required to
choose between 16 possible targets. Consequently, early
cue-related activity should capture the instructed selection
of a specific motor action in guided trials, while we ex-
pected a prolonged signature of the action selection process
for free trials.
Therefore, we analyzed power differences between free
and guided trials for cue (Fig. 4b) as well as saccade-
aligned data (Fig. 4c) across the whole delay phase in 10
time windows starting 50 ms before cue onset until 400 ms
after the go signal for the cue-aligned data (time windows
for saccade-aligned data were chosen equivalently).
In response to the cue, we found more gamma
(64–128 Hz) and theta power (5.7–8 Hz) in occipital and
posterior parietal cortex for guided compared to free sac-
cade trials (cluster based random permutation test,
p\ 0.05, corrected for multiple comparisons of number of
sources, time, and frequency windows, n = 400 9 10 9 5,
20.97 % (theta) and 6.61 % (gamma) maximal reduction of
free compared to guided saccades, Fig. 4b). In the delay
phase before saccade initiation until re-fixation (from
600 ms before to 200 ms after saccade onset) high gamma
power was stronger in a fronto-parietal network when
freely choosing saccade targets compared to guided sac-
cade trials (cluster based random permutation test,
p\ 0.05, corrected for multiple comparisons of number of
sources, time, and frequency windows, n = 400 9 10 9 5,
Fig. 4c, 4.87 % maximal increase). This network com-
prised frontal and supplementary eye fields as well as
parietal areas around precuneus and along the intraparietal
sulcus from its anterior-medial to posterior parts. For lower
frequencies in the alpha and beta frequency range
(8–16 Hz and 16–32 Hz) we found a significant reduction
of power during the delay period in widespread regions of
posterior parietal cortex for free saccades compared to
guided saccades. During execution and re-fixation this re-
duction was strongest at infero-temporal areas (16.42 %
FEF
dLPFC
SEF
V1
aIPSmIPS
pIPS pIPS
SEFFEF
dLPFC
aIPS ba
Fig. 3 Spectral power changes during saccade planning and execu-
tion in selected ROIs. a Encircled areas indicate the spatial location
of each ROI on the inflated template brain (dLPFC dorsal lateral
prefrontal cortex, SEF putative human homologue of supplementary
eye field, FEF putative human homologue of lateral and medial
frontal eye field, aIPS, mIPS, pIPS anterior, medial and posterior
intraparietal sulcus, V1 early visual cortex). b Relative spectral power
changes of saccade-aligned data (saccade onset at time t = 0 ms,
dotted line) for the ROIs relative to baseline (*52–125 ms before cue
onset, depending on the frequency). Data are pooled across
homologous areas in the two hemispheres. Unmasked regions denote
significant difference from zero (t test, p\ 0.05, uncorrected for
multiple comparisons)
Brain Topogr (2016) 29:130–148 139
123
Author's personal copy
a
b
c
Fig. 4 Saccade target selection. Spatio-temporal evolution of differ-
ences in spectral power between free and guided saccades (free-
guided). Differences from zero were statistically assessed for the time
period from cue presentation until re-fixation by cluster based random
permutation correcting for multiple comparisons of number of voxels,
time windows, and frequency windows (p\ 0.05, we show a relevant
subset of comparisons). Functional maps are masked by the extent of
the identified clusters and are illustrated on a 3D cortical surface.
a Time windows chosen for the analyses shown in B and C are partly
overlapping. b Response to cue is shown with cue-aligned data. Time
points with respect to cue are depicted in blue, equivalent timing for
saccade alignment with respect to the mean saccade latency at 226 ms
after the go cue is shown below in brackets. c Activity during delay
and subsequent saccade is shown in alignment to saccade onset. Time
points with respect to saccade onset are depicted in grey, equivalent
timing for cue alignment considering mean saccade latency is shown
in blue
140 Brain Topogr (2016) 29:130–148
123
Author's personal copy

(alpha) and 13.34 % (beta) maximal reduction of free
compared to guided saccades).
To understand the origin of the differences between free
and guided saccades we analyzed power changes relative to
pre-cue baseline separately for both conditions at several
locations within the fronto-parietal network (Fig. 5). The
analysis revealed that the difference in gamma power in the
fronto-parietal network during the delay interval before
saccade onset (starting approximately 600 ms before sac-
cade onset) was caused by a gamma power increase in free
saccade trials relative to baseline rather than a power de-
crease in guided saccade trials. The reductions in alpha and
beta power relative to pre-cue baseline appeared to result
from a stronger decrease in beta power in the free saccade
compared to the guided saccade condition and a stronger
increase in alpha power in the guided saccade condition.
Behavioral Analysis of Saccade Metrics
These findings suggest sustained increased gamma power
accompanied by reduced alpha to beta power in a fronto-
parietal network during the delay reflecting the selection
between different possible motor plans in free saccade
trials. A potential confound of the observed effects may be
systematic differences in saccade statistics between free
and guided saccades that might induce the observed power
differences between conditions. To test for this possible
confound, we compared chosen target frequencies and
saccade metrics between conditions.
In a subject specific analysis six out of the 13 subjects
showed a significant bias in choosing specific saccade
targets more frequently than others in the free decision
trials. However, a random permutation test of the average
direction difference of saccade targets across subjects be-
tween free and guided condition (see Materials and
Methods section), which mirrored the statistical analyses in
spectral power differences between free and guided sac-
cades, did not show a significant condition specific pref-
erence of saccade target direction (p = 0.3902). This
suggests that the observed selection specific differences in
power are not a mere reflection of saccade metrics but
reflect differences in the neuronal processes related to ac-
tion selection.
We further characterized saccade metrics and their
condition specific differences. Across conditions saccades
lasted on average 61.70 ± 29.01 ms (mean ± SD), and
had a velocity of 230.59 ± 97.538/s (mean ± SD). Sac-
cades occurred on average 225.81 ± 72.67 ms
(mean ± SD) after the go cue presentation. Mean accuracy
of saccade target was 1.04 ± 2.10 8 (mean ± SD, distance
of fixation after saccade from the center of the Gaussian
blobs).
We found that average saccade latencies of free selec-
tion trials were 5.31 ms larger than those of guided sac-
cades (p = 0.0058, random permutation test) and showed
slightly higher variance (difference between free and
guided latency variance: 0.52 ms, p = 0.02, random per-
mutation test). Although significant, these differences be-
tween conditions are negligible with respect to the spectral
power comparison since they cover only *2 % (*0.2 %
for the difference in variance) of even the shortest analysis
window for the frequency transform. While saccade ac-
curacy and duration did not differ significantly between
conditions (mean accuracy difference = -0.00058,
Fig. 5 Spectral power changes for free and guided saccades in
fronto-parietal ROIs. Power changes relative to baseline
(*52–125 ms before cue onset, depending on the frequency) of
guided (upper row) and free (lower row) saccades during saccade
planning, saccade execution, and re-fixation in FEF, SEF, mIPS and
pIPS averaged over both hemispheres. Data are aligned to cue onset
(t = 0 ms, dotted line) for the left part of the spectrogram and to
saccade onset (t = 0 ms, dotted line) for the right part of the
spectrogram. Power changes are represented as statistical z-values,
unmasked regions show significant differences from zero (t test,
p\ 0.05, uncorrected for multiple comparisons)
Brain Topogr (2016) 29:130–148 141
123
Author's personal copy

p = 0.5117, mean duration difference = -0.56 ms,
p = 0.6989, both random permutation test), free saccades
were on average 8.828/s faster than guided saccades
(p = 0.0047, random permutation test).
Evaluation of whether subjects employed a specific
behavioral strategy for target selection revealed that 10 out
of 13 subjects showed a significant inhibition in performing
the saccade to the same target as in the previous trial (bi-
nomial test within each subject, p\ 0.05).
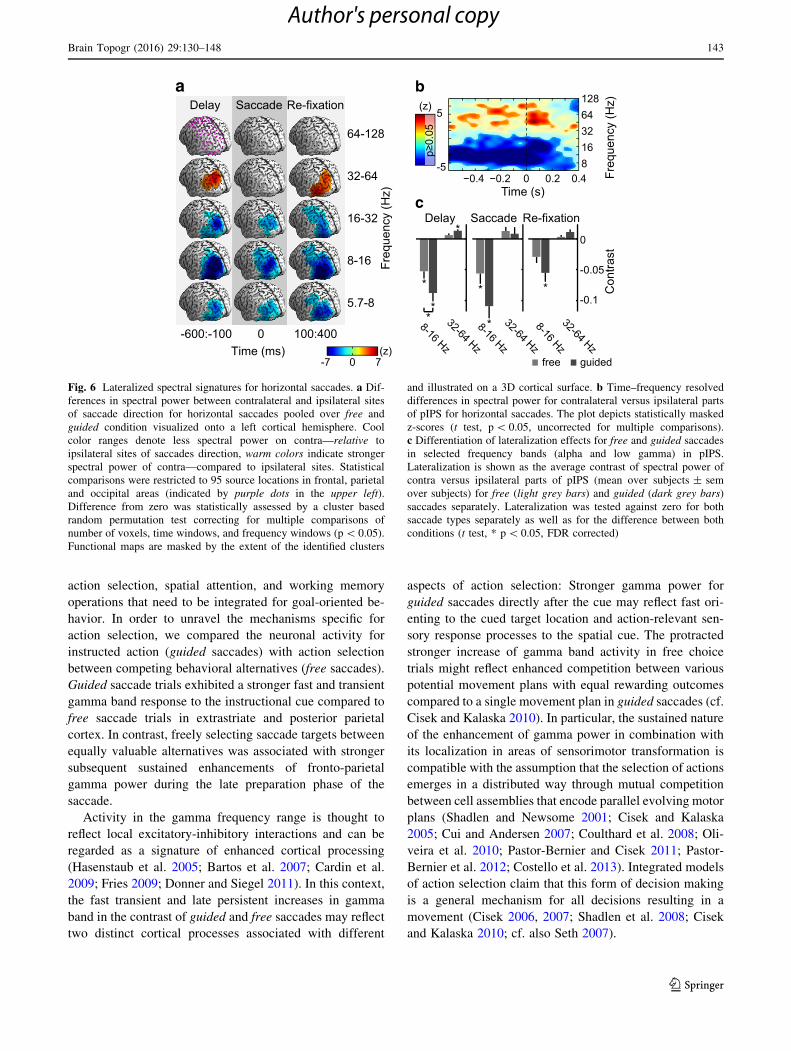
Encoding of Saccade Direction
In the above analysis, we pooled the data for saccades to
different spatial locations. This identifies processes involved
in selection, planning, and execution of saccades indepen-
dent of the saccade metrics. Despite its limited spatial
resolution, hemispheric specificity to the left and right visual
hemifields is accessible with MEG. In order to study neu-
ronal processes encoding saccade metrics, we exploited this
property and compared the difference in neuronal activity
between the left and right hemispheres for trials with left- and
rightward saccades closest to the horizontal midline of the
monitor. More specifically, we pooled free and guided sac-
cades and analyzed spectral power of the difference of left-
from rightwards saccades. By averaging hemispheres
through mirroring homologous sources across the midline
(cf. ‘‘Statistical analysis of spectral power’’ section) we
compared spectral power contralateral and ipsilateral to
saccade direction. We restricted the analysis to fronto-pari-
etal and visual sources that we found to be related to saccade
preparation (Fig. 6a, cf. Fig. 2) and to 3 time windows. These
time windows separated the delay phase from 600 to 100 ms
before saccade onset from the saccade execution at time
t = 0 ms and re-fixation from 100 to 400 ms after saccade
onset. We employed cluster based random permutation tests
(p\ 0.05, corrected for multiple comparisons of number of
sources, time, and frequency windows, n = 95 9 3 9 5,
Fig. 6a).
During preparation of saccades, we found significantly
stronger power in the low gamma frequency range
(32–64 Hz window) for sites in pIPS contralateral to sac-
cade direction. During re-fixation low gamma power was
stronger contralateral to saccade direction at extrastriate
regions around the junctions of lateral occipital sulcus and
inferior temporal sulcus and around pIPS. During saccade
execution we did not find significant lateralization effects
in the gamma range. Power in all lower frequency windows
(theta 5.7–8 Hz, alpha 8–16 Hz, beta 16–31 Hz) was sig-
nificantly lower for sites contralateral than for sites ipsi-
lateral to saccade direction during delay, execution, and re-
fixation at extended regions of the posterior cortex. This
difference was largest in the alpha range around pIPS
during delay and at extrastriate areas at the junctions of
lateral occipital sulcus and inferior temporal sulcus during
re-fixation.
To resolve the time-courses and bandwidth of the ob-
served differences in spectral power, we computed a time–
frequency spectrogram with a high resolution for pIPS
(Fig. 6b). The lateralized change in gamma power ex-
tended into higher gamma frequencies above 64 Hz.
In a next step we investigated if the identified saccade-
metric specific signatures in pIPS differed between guided
and free saccades (Fig. 6c). There was a significant dif-
ference in alpha power between hemifields contra- and
ipsilateral to saccade direction for free as well as guided
saccade trials during delay and saccade execution. This
saccade direction specific effect was stronger for guided
than free saccades during the delay period (t test, p\ 0.05,
FDR corrected for conditions, time, and frequency win-
dows, n = 3 9 3 9 2). Only guided saccades showed
significant stronger gamma power in contralateral versus
ipsilateral sites of the pIPS in the delay period.
In summary, horizontal saccade direction was reflected
in lateralized power changes in low gamma and alpha
around the posterior parietal cortex. These lateralization
effects were strongest during the delay period and stronger
for guided trials.
Discussion
The goal of this study was to shed light on the spa-
tiotemporal dynamics of action selection. To this end, we
investigated the neuronal signatures of preparation,
execution, and target selection for freely chosen and vi-
sually guided saccades. We found a fronto-parietal network
exhibiting sustained power changes within gamma and
alpha to beta frequency bands that may reflect the process
of competition between behavioral alternatives for action
selection.
In the first analysis combining free and guided saccades
we identified significant changes of local oscillatory
population activity related to general saccade planning and
execution. In line with previous electrophysiological
studies on sensorimotor transformations of guided saccades
(Pesaran et al. 2002; Lachaux et al. 2006; Medendorp et al.
2007; Hinkley et al. 2011; Gregoriou et al. 2012), we
identified a fronto-parietal network including the intra-
parietal sulcus and the frontal and supplementary eye
fields, that exhibited an antagonistic signature of increased
gamma band activity and suppressed beta band activity.
Visual areas showed an additional increase in alpha band
activity during the delay.
The neuronal activity we found for the combined ana-
lysis of free and guided saccades likely reflects different
concurrently active processes including motor preparation,
142 Brain Topogr (2016) 29:130–148
123
Author's personal copy
action selection, spatial attention, and working memory
operations that need to be integrated for goal-oriented be-
havior. In order to unravel the mechanisms specific for
action selection, we compared the neuronal activity for
instructed action (guided saccades) with action selection
between competing behavioral alternatives (free saccades).
Guided saccade trials exhibited a stronger fast and transient
gamma band response to the instructional cue compared to
free saccade trials in extrastriate and posterior parietal
cortex. In contrast, freely selecting saccade targets between
equally valuable alternatives was associated with stronger
subsequent sustained enhancements of fronto-parietal
gamma power during the late preparation phase of the
saccade.
Activity in the gamma frequency range is thought to
reflect local excitatory-inhibitory interactions and can be
regarded as a signature of enhanced cortical processing
(Hasenstaub et al. 2005; Bartos et al. 2007; Cardin et al.
2009; Fries 2009; Donner and Siegel 2011). In this context,
the fast transient and late persistent increases in gamma
band in the contrast of guided and free saccades may reflect
two distinct cortical processes associated with different
aspects of action selection: Stronger gamma power for
guided saccades directly after the cue may reflect fast ori-
enting to the cued target location and action-relevant sen-
sory response processes to the spatial cue. The protracted
stronger increase of gamma band activity in free choice
trials might reflect enhanced competition between various
potential movement plans with equal rewarding outcomes
compared to a single movement plan in guided saccades (cf.
Cisek and Kalaska 2010). In particular, the sustained nature
of the enhancement of gamma power in combination with
its localization in areas of sensorimotor transformation is
compatible with the assumption that the selection of actions
emerges in a distributed way through mutual competition
between cell assemblies that encode parallel evolving motor
plans (Shadlen and Newsome 2001; Cisek and Kalaska
2005; Cui and Andersen 2007; Coulthard et al. 2008; Oli-
veira et al. 2010; Pastor-Bernier and Cisek 2011; Pastor-
Bernier et al. 2012; Costello et al. 2013). Integrated models
of action selection claim that this form of decision making
is a general mechanism for all decisions resulting in a
movement (Cisek 2006, 2007; Shadlen et al. 2008; Cisek
and Kalaska 2010; cf. also Seth 2007).
a b
c
Fig. 6 Lateralized spectral signatures for horizontal saccades. a Dif-
ferences in spectral power between contralateral and ipsilateral sites
of saccade direction for horizontal saccades pooled over free and
guided condition visualized onto a left cortical hemisphere. Cool
color ranges denote less spectral power on contra—relative to
ipsilateral sites of saccades direction, warm colors indicate stronger
spectral power of contra—compared to ipsilateral sites. Statistical
comparisons were restricted to 95 source locations in frontal, parietal
and occipital areas (indicated by purple dots in the upper left).
Difference from zero was statistically assessed by a cluster based
random permutation test correcting for multiple comparisons of
number of voxels, time windows, and frequency windows (p\ 0.05).
Functional maps are masked by the extent of the identified clusters
and illustrated on a 3D cortical surface. b Time–frequency resolved
differences in spectral power for contralateral versus ipsilateral parts
of pIPS for horizontal saccades. The plot depicts statistically masked
z-scores (t test, p\ 0.05, uncorrected for multiple comparisons).
c Differentiation of lateralization effects for free and guided saccades
in selected frequency bands (alpha and low gamma) in pIPS.
Lateralization is shown as the average contrast of spectral power of
contra versus ipsilateral parts of pIPS (mean over subjects ± sem
over subjects) for free (light grey bars) and guided (dark grey bars)
saccades separately. Lateralization was tested against zero for both
saccade types separately as well as for the difference between both
conditions (t test, * p\ 0.05, FDR corrected)
Brain Topogr (2016) 29:130–148 143
123
Author's personal copy
How is this mutual competition between different action
plans realized within the sensorimotor areas? Physiological
measurements of single neuron activity in parietal cortex
suggest that competition between multiple actions is en-
coded as relative rate code, reflecting the number of
available options and the subjective desirability of each
action alternative (Dorris and Glimcher 2004; Sugrue et al.
2004; Klaes et al. 2012). On the population level, we ob-
served a global enhancement of gamma power in fronto-
parietal association cortex associated with the presence of
multiple action alternatives. The observed gamma band
signature is distinct from saccadic spike artifact activity
with respect to source localization and to temporal dy-
namics and therefore most likely arises from neuronal
rhythmic synchronization (cf. Jerbi et al. 2009 and Carl
et al. 2012 for source distribution of the saccadic spike
artifact in iEEG and MEG, respectively). This enhance-
ment of local rhythmic inhibitory-excitatory interactions
may reflect enhanced local competition between cell
assemblies. Hence, our observations suggest that in addi-
tion to spike rates, precise timing—reflected in synchro-
nization—plays a role in the competition between cell
assemblies representing different available action
alternatives.
Because all choices in the free saccade trials were be-
haviorally equally valuable in our experiment, subjects
were free to choose and had to motivate their choice in-
ternally. Interpreting this as a form of voluntary choice, our
findings corroborate studies that have attributed aspects of
voluntariness of action selection to the fronto-parietal
network. Human fMRI, TMS, and lesion studies suggested
that parietal and premotor areas are involved in the process
of voluntary or free action selection (Milea et al. 2007;
Soon et al. 2008; Beudel and de Jong 2009; Oliveira et al.
2010). Furthermore, the fronto-parietal network was pro-
posed to specifically implement the choice of an action
when maximally competing alternatives are present (Hag-
gard 2008; Kable and Glimcher 2009; de Jong 2011). This
assumption is supported by electrophysiological studies in
non-human primates that found single unit activity in lat-
eral intraparietal area and oscillatory coupling between
premotor and parietal areas representing the specific out-
come of a chosen movement amongst competing alterna-
tives (Gold and Shadlen 2007; Pesaran et al. 2008). Our
findings of enhanced fronto-parietal gamma activity during
saccade target selection provides evidence for a similar
choice network in humans and suggests an important role
of oscillatory activity for implementing voluntary action
selection.
Various cerebral structures have been associated with
the origin of voluntary decisions. While e.g. Soon et al.
(2008) and Bode et al. (2012) suggested that frontopolar
cortex implements the initial step in generating decisions,
other evidence points to medial frontal cortex as a key
player in intentional action selection in humans (Libet et al.
1983; Cunnington et al. 2002; Rowe et al. 2010; Fried et al.
2011). Our data do not exclude the possibility that struc-
tures like medial frontal cortex including the supplemen-
tary eye fields might modulate other fronto-parietal
structures in order to mediate saccade target selection (cf.
Coe et al. 2002). Here, our data showing concurrent sus-
tained fronto-parietal oscillatory activity associated with
free action selection support assumptions about decisions
being implemented in a network of concurrently active
brain areas operating in a parallel manner (Ledberg et al.
2007).
An important question is to what degree attentional
mechanisms might contribute to the selection specific dif-
ferences in gamma power between free and guided sac-
cades. Since spatial orienting implicates spatial attention,
choosing spatial saccade targets is correlated to some de-
gree with attentional shifts (cf. Andersen and Cui 2009),
and there is good evidence that overt orienting and covert
attention are mediated partly by the same networks (Riz-
zolatti et al. 1987; Kustov and Robinson 1996; Corbetta
et al. 1998). We understand decision towards action as an
emergent phenomenon that is necessarily composed of
several sub-functions including attentional contributions.
In line with this argument Bisley and Goldberg (2010),
proposed the concept of priority maps that highlight be-
haviorally relevant information to bias sensorimotor sys-
tems for appropriate action selections with the lateral
intraparietal area as a neural substrate. Our data support the
hypothesis of a similar priority map in humans.
Similarly, memory processes for strategic considerations
might accompany voluntary saccade target selection. An
inhibition of choosing the preceding target in most subjects
suggests that observed selection specific power signatures
might to some extent be related to monitoring of response
history (cf. Rowe et al. 2010; Zhang et al. 2012). Such an
action monitoring may be part of an integrated process of
motor planning, action selection, attentional allocation, and
working memory (Cisek and Kalaska 2005; Jerde et al.
2012).
Finally, the stronger transient response to guided com-
pared to free saccades may relate to processes other than
action selection: First, sensory responses may differ be-
tween conditions due to physical differences between cue
colors. However, isoluminant changes in visual stimuli, as
employed here, have been shown to induce only weak
gamma band responses confined to early visual areas
(Swettenham et al. 2013; cf. also Adjamian et al. 2008),
making a purely sensory driven difference of high gamma
band power between conditions in parietal and extrastriate
areas unlikely. In addition, evidence from non-human pri-
mates suggests that the strength of sensory responses
144 Brain Topogr (2016) 29:130–148
123
Author's personal copy

within parietal areas relies on behavioral relevance of the
stimulus (cf. Toth and Assad 2002; Ipata et al. 2006; An-
dersen and Cui 2009) and hence is not independent from
processes related to spatial guidance to the saccade target.
Second, guided saccades where the target must be kept in
memory after cue offset may entail higher working mem-
ory load than free saccades. Although spectral and spatial
distributions for the stronger cue-related power increase in
guided saccades are compatible with such a view, the
transient nature of the observed effect renders this inter-
pretation implausible (Curtis and Lee 2010).
In addition to the selection specific changes in gamma
power, we found that power was reduced within alpha and beta
bands during free saccade target selection compared to guided
saccades. These lower frequency changes spatially overlapped
with the changes in the gamma band but were more
widespread. Spectrally, these effects are compatible with the
rolandic mu rhythm with the alpha band reflecting pre-
dominantly somatosensory cortical function and the beta band
reflecting motor-cortex function (Hari and Salmelin 1997).
Beta band activity has been related to maintaining the
status quo of sensorimotor or cognitive states (Engel and
Fries 2010). Its suppression has been associated with acti-
vation of sensorimotor areas during voluntary movement
preparation and execution, motor imagery and movement
observation for limb movements (Hari et al. 1998; Neuper
and Pfurtscheller 1999, Pfurtscheller and Lopes da Silva
1999) and may reflect a general readiness for change. In
particular, beta band suppression was shown to be enhanced
in motor cortex when competing motor plans are co-acti-
vated in a manual Erikson flanker paradigm (Grent-’t-Jong
et al. 2013) and beta band suppression seems to reflect the
formation of a decision as a preparatory motor signal based
on the integrated evidence in perceptual decisions (Donner
et al. 2009; Wyart et al. 2012). Oscillations in the alpha band
have been implicated in a gating mechanism that inhibits task
irrelevant areas or, by release of inhibition, enhances the
general excitability of task relevant areas (Klimesch et al.
2007; Jensen and Mazaheri 2010). Such a gating function is
known to be associated with allocation of spatial attention
(Thut et al. 2006; Siegel et al. 2008; Wyart and Tallon-
Baudry 2008). Consequently, the observed effects of less
spectral power in alpha and beta frequency ranges during
free action selection compared to guided saccade trials may
reflect stronger engagement in movement preparation for
multiple actions plans as well as differences in attentional
load, or a combination of both effects.
To further pinpoint the functional role of the spectral
signatures of saccade target selection we investigated their
directional specificity. In line with previous reports on
guided saccades (Medendorp et al. 2007; Van Der Werf
et al. 2008; 2010; Buchholz et al. 2011; Van Der Werf et al.
2013), we found lateralized gamma band activity in pIPS
and lateralized alpha modulations in posterior parietal and
extrastriate areas. However, directional specificity in pIPS
was much less pronounced for free compared to guided
saccades. A possible explanation is that lateralization ef-
fects gradually build up with the evolvement of a decision
for the free saccade trials, resulting in overall weaker
spectral lateralization. Further studies are needed to ela-
borate on the direction specific dynamics of the selection
process in presentence of competing alternatives.
To conclude, our data show that action selection for
instructed behavior dissociates from internally motivated
action selection between behavioral alternatives in spectral
signatures, with stronger fast transient gamma band re-
sponses for instructed and later sustained gamma band
activity for freely selected saccades in a fronto-parietal
network. These spectro-temporal characteristics may re-
flect an integrated and parallelized process of eye move-
ment selection when selection between competing
movements is required.
Acknowledgments This study was supported by grants from the
European Union (EU) (IST-2005-27268, FP7-ICT-270212, ERC-
2010-AdG-269716) and the Deutsche Forschungsgemeinschaft
(DFG) (SFB 936/A3/B6).
Conflict of interest The authors declare no competing financial
interests.
Ethical Standards The Ethics Committee of the Medical Asso-
ciation Hamburg approved the current study. The study was con-
ducted in accordance with the Declaration of Helsinki and informed
consent was obtained from all participants prior to recordings. The
manuscript does not contain clinical studies or patient data.
References
Adjamian P, Hadjipapas A, Barnes GR, Hillebrand A, Holliday IE
(2008) Induced gamma activity in primary visual cortex is
related to luminance and not color contrast: an MEG study. J Vis
8(4):1–7. doi:10.1167/8.7.4
Andersen RA, Cui H (2009) Intention, action planning, and decision
making in parietal-frontal circuits. Neuron 63:568–583. doi:10.
1016/j.neuron.2009.08.028
Anderson EJ, Jones DK, O’Gorman RL et al (2012) Cortical network
for gaze control in humans revealed using multimodal MRI.
Cereb Cortex 22:765–775. doi:10.1093/cercor/bhr110
Bartos M, Vida I, Jonas P (2007) Synaptic mechanisms of synchro-
nized gamma oscillations in inhibitory interneuron networks. Nat
Rev Neurosci 8:45–56. doi:10.1038/nrn2044
Benjamini Y, Hochberg Y (1995) Controlling the false discovery rate:
a practical and powerful approach to multiple testing. J R
Statistic Soc Series B (Methodological) 57:289–300
Beudel M, de Jong BM (2009) Overlap and segregation in predorsal
premotor cortex activations related to free selection of self-
referenced and target-based finger movements. Cereb Cortex
19:2361–2371. doi:10.1093/cercor/bhn254
Bisley JW, Goldberg ME (2010) Attention, intention, and priority in
the parietal lobe. Annu Rev Neurosci 33:1–21. doi:10.1146/
annurev-neuro-060909-152823
Brain Topogr (2016) 29:130–148 145
123
Author's personal copy

Bode S, Bogler C, Soon CS, Haynes J-D (2012) The neural encoding
of guesses in the human brain. Neuroimage 59:1924–1931.
doi:10.1016/j.neuroimage.2011.08.106
Buchholz VN, Jensen O, Medendorp WP (2011) Multiple reference
frames in cortical oscillatory activity during tactile remapping
for saccades. J Neurosci 31:16864–16871. doi:10.1523/jneur
osci.3404-11.2011
Cardin JA, Carlen M, Meletis K, Knoblich U, Zhang F, Deisseroth K,
Tsai L-H, Moore CI (2009) Driving fast-spiking cells induces
gamma rhythm and controls sensory responses. Nature
459:663–667. doi:10.1038/nature08002
Carl C, Acık A, Konig P, Engel AK, Hipp JF (2012) The saccadic
spike artifact in MEG. Neuroimage 59:1657–1667. doi:10.1016/
j.neuroimage.2011.09.020
Cisek P (2006) Integrated neural processes for defining potential
actions and deciding between them: a computational model.
J Neurosci 26:9761–9770. doi:10.1523/jneurosci.5605-05.2006
Cisek P (2007) Cortical mechanisms of action selection: the
affordance competition hypothesis. Philos Trans R Soc Lond B
Biol Sci 362:1585–1599. doi:10.1098/rstb.2007.2054
Cisek P (2012) Making decisions through a distributed consensus.
Curr Opin Neurobiol 22:927–936. doi:10.1016/j.conb.2012.05.
007
Cisek P, Kalaska JF (2005) Neural correlates of reaching decisions in
dorsal premotor cortex: specification of multiple direction
choices and final selection of action. Neuron 45:801–814.
doi:10.1016/j.neuron.2005.01.027
Cisek P, Kalaska JF (2010) Neural mechanisms for interacting with a
world full of action choices. Annu Rev Neurosci 33:269–298.
doi:10.1146/annurev.neuro.051508.135409
Coe B, Tomihara K, Matsuzawa M, Hikosaka O (2002) Visual and
anticipatory bias in three cortical eye fields of the monkey
during an adaptive decision-making task. J Neurosci
22:5081–5090
Corbetta M, Akbudak E, Conturo TE, Snyder AZ, Ollinger JM, Drury
HA, Linenweber MR, Petersen SE, Raichle ME, Van Essen DC,
Shulman GL (1998) A common network of functional areas for
attention and eye movements. Neuron 21:761–773
Costello MG, Zhu D, Salinas E, Stanford TR (2013) Perceptual
modulation of motor–but not visual–responses in the frontal eye
field during an urgent-decision task. J Neurosci 33:16394–16408.
doi:10.1523/jneurosci.1899-13.2013
Coulthard EJ, Nachev P, Husain M (2008) Control over conflict
during movement preparation: role of posterior parietal cortex.
Neuron 58:144–157. doi:10.1016/j.neuron.2008.02.009
Croft RJ, Barry RJ (2000) Removal of ocular artifact from the EEG: a
review. Neurophysiol Clin 30:5–19. doi:10.1016/S0987-
7053(00)00055-1
Cui H, Andersen RA (2007) Posterior parietal cortex encodes
autonomously selected motor plans. Neuron 56:552–559.
doi:10.1016/j.neuron.2007.09.031
Cunnington R, Windischberger C, Deecke L, Moser E (2002) The
preparation and execution of self-initiated and externally-
triggered movement: a study of event-related fMRI. Neuroimage
15:373–385. doi:10.1006/nimg.2001.0976
Curtis CE, Lee D (2010) Beyond working memory: the role of
persistent activity in decision making. Trends Cogn Sci
14:216–222. doi:10.1016/j.tics.2010.03.006
de Jong BM (2011) Neurology of widely embedded free will. Cortex
47:1160–1165. doi:10.1016/j.cortex.2011.06.011
Donner TH, Siegel M (2011) A framework for local cortical
oscillation patterns. Trends Cogn Sci 15:191–199. doi:10.1016/
j.tics.2011.03.007
Donner TH, Siegel M, Fries P, Engel AK (2009) Buildup of choice-
predictive activity in human motor cortex during perceptual decision
making. Curr Biol 19:1581–1585. doi:10.1016/j.cub.2009.07.066
Dorris MC, Glimcher PW (2004) Activity in posterior parietal cortex
is correlated with the relative subjective desirability of action.
Neuron 44:365–378. doi:10.1016/j.neuron.2004.09.009
Engel AK, Fries P (2010) Beta-band oscillations—signalling the
status quo? Curr Opin Neurobiol 20:156–165. doi:10.1016/j.
conb.2010.02.015
Engel AK, Maye A, Kurthen M, Konig P (2013) Where’s the action?
The pragmatic turn in cognitive science. Trends Cogn Sci
17:202–209. doi:10.1016/j.tics.2013.03.006
Fried I, Mukamel R, Kreiman G (2011) Internally generated
preactivation of single neurons in human medial frontal cortex
predicts volition. Neuron 69:548–562. doi:10.1016/j.neuron.
2010.11.045
Fries P (2009) Neuronal gamma-band synchronization as a funda-
mental process in cortical computation. Annu Rev Neurosci
32:209–224. doi:10.1146/annurev.neuro.051508.135603Genovese CR, Lazar NA, Nichols T (2002) Thresholding of statistical
maps in functional neuroimaging using the false discovery rate.
Neuroimage 15:870–878. doi:10.1006/nimg.2001.1037
Glimcher PW (2003) The neurobiology of visual-saccadic decision
making. Annu Rev Neurosci 26:133–179. doi:10.1146/annurev.
neuro.26.010302.081134
Gold JI, Shadlen MN (2007) The neural basis of decision making.
Annu Rev Neurosci 30:535–574. doi:10.1146/annurev.neuro.29.
051605.113038
Gould IC, Nobre AC, Wyart V, Rushworth MFS (2012) Effects of
decision variables and intraparietal stimulation on sensorimotor
oscillatory activity in the human brain. J Neurosci 32:13805–13818.
doi:10.1523/jneurosci.2200-12.2012
Gratton G, Coles MG, Donchin E (1983) A new method for off-line
removal of ocular artifact. Electroencephalogr Clin Neuro-
physiol 55:468–484
Gregoriou GG, Gotts SJ, Desimone R (2012) Cell-type-specific
synchronization of neural activity in FEF with V4 during attention.
Neuron 73:581–594. doi:10.1016/j.neuron.2011.12.019
Grent-’t-Jong T, Oostenveld R, Jensen O et al (2013) Oscillatory
dynamics of response competition in human sensorimotor
cortex. Neuroimage 83:27–34. doi:10.1016/j.neuroimage.2013.
06.051
Gross J, Kujala J, Hamalainen M, Timmermann L, Schnitzler A,
Salmelin R (2001) Dynamic imaging of coherent sources:
studying neural interactions in the human brain. Proc Natl Acad
Sci USA 98:694–699. doi:10.1073/pnas.98.2.694
Haggard P (2008) Human volition: towards a neuroscience of will.
Nat Rev Neurosci 9:934–946. doi:10.1038/nrn2497
Hare TA, Schultz W, Camerer CF, O’Doherty JP, Rangel A (2011)
Transformation of stimulus value signals into motor commands
during simple choice. Proc Natl Acad Sci USA
108:18120–18125. doi:10.1073/pnas.1109322108
Hari R, Salmelin R (1997) Human cortical oscillations: a neuromag-
netic view through the skull. Trends Neurosci 20:44–49. doi:10.
1016/S0166-2236(96)10065-5
Hari R, Forss N, Avikainen S et al (1998) Activation of human
primary motor cortex during action observation: a neuromag-
netic study. Proc Natl Acad Sci USA 95:15061–15065
Hasenstaub A, Shu Y, Haider B, Kraushaar U, Duque A, McCormick
DA (2005) Inhibitory postsynaptic potentials carry synchronized
frequency information in active cortical networks. Neuron
47:423–435. doi:10.1016/j.neuron.2005.06.016
Hassler U, Barreto NT, Gruber T (2011) Induced gamma band
responses in human EEG after the control of miniature saccadic
artifacts. Neuroimage 57:1411–1421. doi:10.1016/j.neuroimage.
2011.05.062
Hinkley LBN, Nagarajan SS, Dalal SS, Guggisberg AG, Disbrow EA
(2011) Cortical temporal dynamics of visually guided behavior.
Cereb Cortex 21:519–529. doi:10.1093/cercor/bhq102
146 Brain Topogr (2016) 29:130–148
123
Author's personal copy
Hipp JF, Siegel M (2013) Dissociating neuronal gamma-band activity
from cranial and ocular muscle activity in EEG. Front Hum
Neurosci 7:338. doi:10.3389/fnhum.2013.00338
Hipp JF, Engel AK, Siegel M (2011) Oscillatory synchronization in
large-scale cortical networks predicts perception. Neuron
69:387–396. doi:10.1016/j.neuron.2010.12.027
Holmes CJ, Hoge R, Collins L, Woods R, Toga AW, Evans AC
(1998) Enhancement of MR images using registration for signal
averaging. J Comput Assist Tomogr 22:324–333
Hoshi E, Tanji J (2007) Distinctions between dorsal and ventral
premotor areas: anatomical connectivity and functional proper-
ties. Curr Opin Neurobiol 17:234–242. doi:10.1016/j.conb.2007.
02.003
Hyvarinen A, Oja E (2000) Independent component analysis:
algorithms and applications. Neural Netw 13:411–430
Ipata AE, Gee AL, Gottlieb J, Bisley JW, Goldberg ME (2006) LIP
responses to a popout stimulus are reduced if it is overtly
ignored. Nat Neurosci 9:1071–1076. doi:10.1038/nn1734
Jensen O, Mazaheri A (2010) Shaping functional architecture by
oscillatory alpha activity: gating by inhibition. Front Hum
Neurosci 4:186. doi:10.3389/fnhum.2010.00186
Jerbi K, Freyermuth S, Dalal S, Kahane P, Bertrand O, Berthoz A,
Lachaux J-P (2009) Saccade related gamma-band activity in
intracerebral EEG: dissociating neural from ocular muscle
activity. Brain Topogr 22:18–23. doi:10.1007/s10548-009-0078-5
Jerde TA, Merriam EP, Riggall AC, Hedges JH, Curtis CE (2012)
Prioritized maps of space in human frontoparietal cortex.
J Neurosci 32:17382–17390. doi:10.1523/jneurosci.3810-12.
2012
Jung TP, Makeig S, Westerfield M et al (2000) Removal of eye
activity artifacts from visual event-related potentials in normal
and clinical subjects. Neurophysiol Clin 111:1745–1758
Kable JW, Glimcher PW (2009) The neurobiology of decision:
consensus and controversy. Neuron 63:733–745. doi:10.1016/j.
neuron.2009.09.003
Kagan I, Iyer A, Lindner A, Andersen RA (2010) Space represen-
tation for eye movements is more contralateral in monkeys than
in humans. Proc Natl Acad Sci USA 107:7933–7938. doi:10.
1073/pnas.1002825107
Keren AS, Yuval-Greenberg S, Deouell LY (2010) Saccadic spike
potentials in gamma-band EEG: characterization, detection and
suppression. Neuroimage 49:2248–2263. doi:10.1016/j.neuro
image.2009.10.057
Klaes C, Schneegans S, Schoner G, Gail A (2012) Sensorimotor
learning biases choice behavior: a learning neural field model for
decision making. PLoS Comp Biol 8:e1002774. doi:10.1371/
journal.pcbi.1002774
Klimesch W, Sauseng P, Hanslmayr S (2007) EEG alpha oscillations:
the inhibition-timing hypothesis. Brain Res Rev 53:63–88.
doi:10.1016/j.brainresrev.2006.06.003
Kovach CK, Tsuchiya N, Kawasaki H, Oya H, Howard MA, Adolphs
R (2011) Manifestation of ocular-muscle EMG contamination in
human intracranial recordings. Neuroimage 54:213–233. doi:10.
1016/j.neuroimage.2010.08.002
Kustov AA, Robinson DL (1996) Shared neural control of attentional
shifts and eye movements. Nature 384:74–77. doi:10.1038/
384074a0
Lachaux J-P, Hoffmann D, Minotti L, Berthoz A, Kahane P (2006)
Intracerebral dynamics of saccade generation in the human
frontal eye field and supplementary eye field. Neuroimage
30:1302–1312. doi:10.1016/j.neuroimage.2005.11.023
Lancaster JL, Tordesillas-Gutierrez D, Martinez M, Salinas F, Evans
A, Zilles K, Mazziotta JC, Fox PT (2007) Bias between MNI and
Talairach coordinates analyzed using the ICBM-152 brain
template. Hum Brain Mapp 28:1194–1205. doi:10.1002/hbm.
20345
Lawrence BM, Snyder LH (2006) Comparison of effector-specific
signals in frontal and parietal cortices. J Neurophysiol
96:1393–1400. doi:10.1152/jn.01368.2005
Ledberg A, Bressler SL, Ding M, Coppola R, Nakamura R (2007)
Large-scale visuomotor integration in the cerebral cortex. Cereb
Cortex 17:44–62. doi:10.1093/cercor/bhj123
Lee TW, Girolami M, Sejnowski TJ (1999) Independent component
analysis using an extended infomax algorithm for mixed
subgaussian and supergaussian sources. Neural Comput
11:417–441
Libet B, Gleason CA, Wright EW, Pearl DK (1983) Time of
conscious intention to act in relation to onset of cerebral activity
(readiness-potential). The unconscious initiation of a freely
voluntary act. Brain 106:623–642
McDowell JE, Dyckman KA, Austin BP, Clementz BA (2008)
Neurophysiology and neuroanatomy of reflexive and volitional
saccades: evidence from studies of humans. Brain Cogn
68:255–270. doi:10.1016/j.bandc.2008.08.016
Medendorp WP, Kramer GFI, Jensen O, Oostenveld R, Schoffelen
J-M, Fries P (2007) Oscillatory activity in human parietal and
occipital cortex shows hemispheric lateralization and memory
effects in a delayed double-step saccade task. Cereb Cortex
17:2364–2374. doi:10.1093/cercor/bhl145
Medendorp WP, Buchholz VN, Van Der Werf J, Leone FTM (2011)
Parietofrontal circuits in goal-oriented behaviour. Eur J Neurosci
33:2017–2027. doi:10.1111/j.1460-9568.2011.07701.x
Milea D, Lobel E, Lehericy S, Leboucher P, Pochon J-B, Pierrot-
Deseilligny C, Berthoz A (2007) Prefrontal cortex is involved in
internal decision of forthcoming saccades. NeuroReport
18:1221–1224. doi:10.1097/WNR.0b013e3281e72ce7
Mitra PP, Pesaran B (1999) Analysis of dynamic brain imaging data.
Biophys J 76:691–708. doi:10.1016/S0006-3495(99)77236-X
Neuper C, Pfurtscheller G (1999) Motor imagery and ERD. In:
Pfurtscheller G, Lopes da Silva FH (eds) Event-related desyn-
chronization. Handbook of electroencephalography and clinical
neurophysiology, vol 6. Elsevier, Amsterdam, pp 303–325
Nichols TE, Holmes AP (2002) Nonparametric permutation tests for
functional neuroimaging: a primer with examples. Hum Brain
Mapp 15:1–25
Nolte G (2003) The magnetic lead field theorem in the quasi-static
approximation and its use for magnetoencephalography forward
calculation in realistic volume conductors. Phys Med Biol
48:3637–3652. doi:10.1088/0031-9155/48/22/002
Oliveira FTP, Diedrichsen J, Verstynen T, Duque J, Ivry RB (2010)
Transcranial magnetic stimulation of posterior parietal cortex
affects decisions of hand choice. Proc Natl Acad Sci USA
107:17751–17756. doi:10.1073/pnas.1006223107
Oostenveld R, Fries P, Maris E, Schoffelen J-M (2011) FieldTrip:
open source software for advanced analysis of MEG, EEG, and
invasive electrophysiological data. Comput Intell Neurosci
2011:156869. doi:10.1155/2011/156869
Pastor-Bernier A, Cisek P (2011) Neural correlates of biased
competition in premotor cortex. J Neurosci 31:7083–7088.
doi:10.1523/jneurosci.5681-10.2011
Pastor-Bernier A, Tremblay E, Cisek P (2012) Dorsal premotor cortex
is involved in switching motor plans. Front Neuroeng 5(5):1–15.
doi:10.3389/fneng.2012.00005
Pesaran B, Pezaris JS, Sahani M, Mitra PP, Andersen RA (2002)
Temporal structure in neuronal activity during working memory
in macaque parietal cortex. Nat Neurosci 5:805–811. doi:10.
1038/nn890
Pesaran B, Nelson MJ, Andersen RA (2008) Free choice activates a
decision circuit between frontal and parietal cortex. Nature
453:406–409. doi:10.1038/nature06849
Pfurtscheller G, Lopes da Silva FH (1999) Event-related EEG/MEG
synchronization and desynchronization: basic principles.
Brain Topogr (2016) 29:130–148 147
123
Author's personal copy

Neurophysiol Clin 110:1842–1857. doi:10.1016/S1388-
2457(99)00141-8
Plochl M, Ossandon JP, Konig P (2012) Combining EEG and eye
tracking: identification, characterization, and correction of eye
movement artifacts in electroencephalographic data. Front Hum
Neurosci 6:278. doi:10.3389/fnhum.2012.00278
R Core Team (2013) R: a language and environment for statistical
computing (R foundation for statistical computing, ed). Vienna
Rizzolatti G, Riggio L, Dascola I, Umilta C (1987) Reorienting
attention across the horizontal and vertical meridians: evidence
in favor of a premotor theory of attention. Neuropsychologia
25:31–40
Rowe JB, Hughes L, Nimmo-Smith I (2010) Action selection: a race
model for selected and non-selected actions distinguishes the
contribution of premotor and prefrontal areas. Neuroimage
51:888–896. doi:10.1016/j.neuroimage.2010.02.045
Salvucci DD, Goldberg JH (2000) Identifying fixations and saccades
in eye-tracking protocols. Proceedings of the symposium on eye
tracking research & applications—ETRA ‘00 (Florida). ACM
Press, New York, pp 71–78
Schlogl A, Keinrath C, Zimmermann D, Scherer R, Leeb R,
Pfurtscheller G (2007) A fully automated correction method of
EOG artifacts in EEG recordings. Neurophysiol Clin
118:98–104. doi:10.1016/j.clinph.2006.09.003
Seth AK (2007) The ecology of action selection: insights from
artificial life. Philos Trans R Soc Lond B Biol Sci
362(1485):1545–1558. doi:10.1098/rstb.2007.2052
Shadlen MN, Newsome WT (2001) Neural basis of a perceptual
decision in the parietal cortex (area LIP) of the rhesus monkey.
J Neurophysiol 86:1916–1936
Shadlen MN, Kiani R, Hanks TD, Churchland AK (2008) Neurobi-
ology of decision making: An intentional framework. In: Engel
C, Singer W (eds) Better than conscious? Decision making, the
human mind, and implications for institutions. MIT Press,
Cambridge, pp 71–101
Siegel M, Donner TH, Oostenveld R, Fries P, Engel AK (2008)
Neuronal synchronization along the dorsal visual pathway
reflects the focus of spatial attention. Neuron 60:709–719.
doi:10.1016/j.neuron.2008.09.010
Siegel M, Engel AK, Donner TH (2011) Cortical network dynamics
of perceptual decision-making in the human brain. Front Hum
Neurosci 5(21):1–12. doi:10.3389/fnhum.2011.00021
Soon CS, Brass M, Heinze H-J, Haynes J-D (2008) Unconscious
determinants of free decisions in the human brain. Nat Neurosci
11:543–545. doi:10.1038/nn.2112
Sugrue LP, Corrado GS, Newsome WT (2004) Matching behavior
and the representation of value in the parietal cortex. Science
304:1782–1787. doi:10.1126/science.1094765
Sweeney JA, Luna B, Keedy SK et al (2007) fMRI studies of eye
movement control: investigating the interaction of cognitive and
sensorimotor brain systems. Neuroimage 36(Suppl 2):T54–T60.
doi:10.1016/j.neuroimage.2007.03.018
Swettenham JB, Muthukumaraswamy SD, Singh KD (2013) BOLD
responses in human primary visual cortex are insensitive to
substantial changes in neural activity. Front Hum Neurosci.
doi:10.3389/fnhum.2013.00076
Thomson DJ (1982) Spectrum estimation and harmonic analysis. Proc
IEEE 70:1055–1096. doi:10.1109/proc.1982.12433
Thut G, Nietzel A, Brandt SA, Pascual-Leone A (2006) Alpha-band
electroencephalographic activity over occipital cortex indexes
visuospatial attention bias and predicts visual target detection.
J Neurosci 26:9494–9502. doi:10.1523/jneurosci.0875-06.2006
Toth LJ, Assad JA (2002) Dynamic coding of behaviourally relevant
stimuli in parietal cortex. Nature 415:165–168. doi:10.1038/
415165a
Van Der Werf J, Jensen O, Fries P, Medendorp WP (2008) Gamma-
band activity in human posterior parietal cortex encodes the
motor goal during delayed prosaccades and antisaccades.
J Neurosci 28:8397–8405. doi:10.1523/jneurosci.0630-08.2008
Van Der Werf J, Jensen O, Fries P, Medendorp WP (2010) Neuronal
synchronization in human posterior parietal cortex during reach
planning. J Neurosci 30:1402–1412. doi:10.1523/jneurosci.3448-
09.2010
Van Der Werf J, Buchholz VN, Jensen O, Medendorp WP (2013)
Reorganization of oscillatory activity in human parietal cortex
during spatial updating. Cereb Cortex 23:508–519. doi:10.1093/
cercor/bhr387
Van Veen BD, Van Drongelen W, Yuchtman M, Suzuki A (1997)
Localization of brain electrical activity via linearly constrained
minimum variance spatial filtering. IEEE Trans Biomed Eng
44:867–880. doi:10.1109/10.623056
Wyart V, Tallon-Baudry C (2008) Neural dissociation between visual
awareness and spatial attention. J Neurosci 28:2667–2679.
doi:10.1523/jneurosci.4748-07.2008
Wyart V, de Gardelle V, Scholl J, Summerfield C (2012) Rhythmic
fluctuations in evidence accumulation during decision making in
the human brain. Neuron 76:847–858. doi:10.1016/j.neuron.
2012.09.015
Yuval-Greenberg S, Tomer O, Keren AS, Nelken I, Deouell LY
(2008) Transient induced gamma-band response in EEG as a
manifestation of miniature saccades. Neuron 58:429–441.
doi:10.1016/j.neuron.2008.03.027
Zhang J, Hughes LE, Rowe JB (2012) Selection and inhibition
mechanisms for human voluntary action decisions. Neuroimage
63:392–402. doi:10.1016/j.neuron.2011.10.035
148 Brain Topogr (2016) 29:130–148
123
Author's personal copy