Embed Size (px)
Citation preview

This article appeared in a journal published by Elsevier. The attachedcopy is furnished to the author for internal non-commercial researchand education use, including for instruction at the authors institution
and sharing with colleagues.
Other uses, including reproduction and distribution, or selling orlicensing copies, or posting to personal, institutional or third party
websites are prohibited.
In most cases authors are permitted to post their version of thearticle (e.g. in Word or Tex form) to their personal website orinstitutional repository. Authors requiring further information
regarding Elsevier’s archiving and manuscript policies areencouraged to visit:
http://www.elsevier.com/copyright

Author's personal copy
Multidimensional GIS modeling of magnetic mineralogy as a proxy for fire useand spatial patterning: Evidence from the Middle Stone Age bearing sea caveof Pinnacle Point 13B (Western Cape, South Africa)q
Andy I.R. Herries a,*, Erich C. Fisher b
aUNSW Archaeomagnetism Laboratory, (iPAST) integrative Palaeoecological and Anthropological Studies, School of Medical Sciences,University of New South Wales, 2052, Kensington, AustraliabDepartment of Anthropology, College of Liberal Arts and Sciences, University of Florida, USA
a r t i c l e i n f o
Article history:Received 22 October 2008Accepted 29 May 2010
Keywords:Mineral magnetismAnthropogenic alterationMagnetic susceptibilitymDGISMSA
a b s t r a c t
This paper aims to identify the spatial patterning of burning and occupation within an early Middle StoneAge (MSA) sea cave in the Western Cape Province of South Africa by creating a multidimensional modelof archaeomagnetic data recovered from all excavated units. Magnetic susceptibility and other mineralmagnetic parameters are shown to provide an excellent proxy for the anthropogenic alteration andspread of burnt material into the surrounding unaltered cave deposits. The identification of combustionfeatures and areas of occupation or different activities within the site can be determined because themovement of people throughout the cave mixes magnetically strong hearth material with magneticallyweak unaltered sediments. This is also indicated by micromorphological analysis. The degree ofenhancement is also shown to indicate the extent to which a deposit has been altered, and therefore,intensity of occupation, because multiple heatings of deposits are needed to form the concentrations ofiron minerals occurring in some layers. This is further supported by a comparisonwith artifact density forthe layers. Variation in the magnetic values between different areas of the site is noted with majoroccupation or fire building occurring in the front of the cave during earlier MIS 6 periods, while duringlater MIS 5 periods the entire cave is occupied intensively. The oldest, MIS 11 deposits at the rear of thecave indicate no evidence of enhancement and an apparent absence of any anthropogenic signature.
� 2010 Elsevier Ltd. All rights reserved.
Introduction
The identification of spatial patterning in archaeological sitesand any inherent behavioral implications remain a difficult thing toaccess in many Paleolithic sites. This paper aims to identify spatialpatterning in an early Middle Stone Age (MSA) sea cave (PinnaclePoint Cave 13B [PP13B]) on the southern cape coast of South Africa,by creating a multidimensional model of mineral magnetic datarecovered from all excavated units. Magnetic susceptibility (MS) isthe most widely used mineral magnetic parameter in archaeolog-ical studies. MS is essentially the ease with which a material can bemagnetized and an indicator of the bulk iron concentration withina sediment/soil/material. MS has been shown to be a powerful tool
for identifying evidence for human occupation, mainly due to theuse of fire at archaeological sites (Peters et al., 2000, 2002; Petersand Batt, 2002; Marwick, 2005; Church et al., 2007).
LeBorgne (1955, 1960) demonstrated that burning leads to anenhancement of the MS of soils. MS enhancement occurs becauseburning causes the formation of magnetically stronger, fine toultrafine, ferrimagnetic minerals (magnetite, maghemite) thatdominate the signal and mask any weaker antiferromagnetic(goethite, hematite) or larger grained ferrimagnetic phases(Morinaga et al., 1999; Peters and Thompson, 1999). While MS isoften a good proxy for burning, only detailed mineral magneticcharacterization will explain the complex mineralogy of naturalsamples and associated reason for MS enhancement or variation(see Supplementary Online Material [SOM] for a detailed review ofmethods). An understanding of the variation of the differentmineral populations can elucidate a number of processes includingsediment input, alteration, human occupation, and climate change(Herries, 2009).
In cave sites, where pedogenesis does not alter the depositsafter or during deposition, MS variation is normally related to
q This article is part of ‘The Middle Stone Age at Pinnacle Point Site 13B, a CoastalCave near Mossel Bay (Western Cape Province, South Africa)’ Special Issue.* Corresponding author.
E-mail addresses: [email protected], [email protected] (A.I.R.Herries).
Contents lists available at ScienceDirect
Journal of Human Evolution
journal homepage: www.elsevier .com/locate/ jhevol
0047-2484/$ e see front matter � 2010 Elsevier Ltd. All rights reserved.doi:10.1016/j.jhevol.2010.07.012
Journal of Human Evolution 59 (2010) 306e320

Author's personal copy
variation in sedimentary input, and in archaeological sites,anthropogenic alteration. Complex magnetic transformations canstill occur in caves due to natural processes such as waterloggingand reactions related to deep guano deposits. Examples of this arethe colored MSA deposits of Rainbow Cave and the Earlier StoneAge (ESA) deposits of the Cave of Hearths at Makapansgat, origi-nally interpreted as being hearths (Mason, 1988; Latham andHerries, 2004). However, detailed magnetic mineralogical studieshave identified such deposits as entirely natural and not related toburning (Herries and Latham, 2009). Variations in sedimentaryinput can also show evidence for climatic change in manycircumstances as this changes the magnetic minerals deposited inthe caves, as is the case at Rose Cottage Cave (Herries and Latham,2003, 2009). However, when intense human occupation occurs,such as at Sibudu Cave, this natural signature is partly overprintedby anthropogenic alteration related to fire use (Herries, 2006). Insuch situations, layers or areas with relatively high MS values (hotspots), when compared to base sediments, should primarilyrepresent combustion features where sediments have been alteredby heat with the formation of highly magnetic mineral phases(Herries, 2009).
MS alone is generally unable to unequivocally identify in situburnt material as high MS areas may represent dumped burntmaterial from behavior such as the raking out of hearths. However,mineral magnetic studies can be a powerful tool when integratedwith micromorphology and paleomagnetic studies of burnt rocks(see Herries [2009] and Brown et al. [2009] for methodology;Fig. 1). These can identify both the maximum temperature that therocks have experienced and whether they are in situ or not. Unlesspost burning alteration or scattering has occurred, burnt depositsshould always have higher MS values than the surrounding sedi-ments, and in many cases in South Africa in situ combustionfeatures appear to have a distinct mineral magnetic signatureconsisting of high MS values and low frequency dependence ofmagnetic susceptibility (see [SOM]). Exceptions occur wheredeposits have been heated to high temperatures that are generally
only found in kilns. (Such temperatures are rarely, if ever, generatedby prehistoric campfires), or if altered by secondary naturalprocesses such as extensive waterlogging (Herries and Latham,2009).
Diffusion of burnt material throughout archaeological depositsby occupation causes dilution of the magnetic hot spots andenhances the surrounding weakly magnetic, unburnt material withthe addition of highly magnetic altered material. In theory, the MSdata combined with other methods have the ability to identify insitu combustion features and the area of occupation used byhumans around these features (or over time in vertical layers). Thisis because human movement spreads combusted material into thesurrounding weaker deposits as humans move around the caveafter having built a fire. However, other mechanisms (fluvial,aeolian) can also be responsible for diffusion of burnt material, andtherefore other analyses such as micromorphology are useful forunderstanding general processes occurring in the deposit (seeKarkanas and Goldberg, 2010). A comprehensive survey of the MSof sediments excavated from an archaeological site can expand theinterpretive range of other bulk point sampling methods (micro-morphology, Fourier transform infrared spectroscopy [FTIR]) toeasily include every excavated lens and feature at the site. Suchmicrosampling is possible because MS measurements have theadvantage of being cheap and easy to undertake and sample sizesare small, on the order of 10 g of sediment.
One of the main limitations in interpreting MS data has beenvisualization, which has mostly relied upon two-dimensionalsections or occasionally areal surveys (Ellwood et al., 1997; Herriesand Latham, 2003; Herries, 2006, 2009). To visualize the MS ofevery single excavatedunit fromanarchaeological site, as attemptedin this study, multidimensional visualization is necessary. Multidi-mensional visualization and analysis are more popular than evernow because of cheaper, more powerful software and newer tech-niques and equipment to record data precisely in 3D. As digital dataare increased, multidimensional visualization is becoming a natu-rally useful tool to efficiently and intuitively interact with and
Fig. 1. Paleomagnetic analysis (zijderveld and intensity plots [A/m2]) of sample 46660 from the LC-MSA (Northeastern area excavation). The pTRM from the heating is removed bybetween 300 and 350 �C to reveal the primary geological remanence (CRM).
A.I.R. Herries, E.C. Fisher / Journal of Human Evolution 59 (2010) 306e320 307

Author's personal copy
comprehend complex data sets. Within an archaeological setting,this intimacywith the spatial data allows unprecedented access intothe often complex spatiotemporal patterns of archaeologicalmaterials and their relationship to other natural or cultural features.
However, while archaeological data are now more often beingrecorded in 3D, for example using total stations, the GIS-basedspatial analysis of these data still seems to be predominantly withina 2D framework. The reason for this is likely due to specific defi-ciencies of 2.5De4D visualization and spatial analysis withincurrent readily available, and affordable, software utilizing a trueGIS framework, which are also not dependent upon advancedcomputer programming or graphics training (Zlatanova et al.,2004). Much progress has also been made on the visualization ofarchaeological sites and data using virtual reality techniquesincluding photogrammetry (e.g., Pollefeys et al., 2003; Barceló andVincente, 2004) and digital 3D scanners (e.g., Redfern andKilfeather, 2004) to create shape models of archaeological struc-tures or objects (see also Barceló [2000]). While these applicationsare certainly useful, the accuracy of the models and, more specifi-cally, their ability to be tested and refined against a series ofworking hypotheses can be questioned based on the perceivedpreferences for visual aesthetics by the various authors1 (forsimilar, see Lewin and Gross [1997]; Boukhari [2000]).
This study relies on the recent Multidimensional GeographicInformation Systems (mDGIS) approach which, at its core, seeks toconjoin accurate and aesthetically pleasing visual effects withquantitative hypothesis driven and testable spatial models. mDGISis defined as the representation and analysis of spatial and non-spatial data within a dynamic visual environment that facilitates2.5D non-volumetric depth of field, 3D volumetric representation,and 4D time and movement (see also Fisher [2005, 2007]). In thisstudy, the mDGIS approach allows us not only to view the complexspatial relationships among data but develop testable spatialmodels on the distributions and densities of MS, archaeological,and geological data to understand better how the sites wereoccupied within and across different times.
Overall this study had a number of specific aims: (1) create thefirst multidimensional model of mineral magnetic data froma Paleolithic site, (2) identify if high MS values correlate withfeatures identified as burnt during excavation, (3) compare inter-pretations from MS and micromorphology data (Karkanas andGoldberg, 2010) regarding in situ combustion features, and (4)identify if MS data indicate differences between units in eachexcavation area, and if there is a difference between excavationareas that might indicate changes in the spread of anthropogeni-cally altered material and, therefore, occupation (or activity specificareas within the site) of the site through time.
Site Chronology
The chronology of the PP13B sediments is developed fromoptically stimulated luminescence dating (OSL) and UeTh dating.The OSL results are described in Jacobs (2010), while the UeThresults and stratigraphy are described in detail in Marean et al.(2007, 2010). All age estimates used in this paper come fromthese papers, and the following summary is developed from thosedata (see also Table 1). A conservative age spread is provided bytaking the minimum and maximum OSL ages from each strati-graphic unit, adding 1 sigma to each, and then adjusting these forUeTh ages that are intercalated. For example, the more precise
UeTh ages on clean speleothems directly contacting the top of thearchaeological sediments shows us that the cave closed no laterthan 91 ka, so that age is used to adjust the age span of underlyingOSL-dated sediments to no younger than 91 ka.
Excavations were undertaken in three areas of the cave: theNortheastern area or LC-MSA, the Eastern area at the front of thecave, and the Western area at the rear of the cave (Fig. 6). Theoldest deposits are a series of archaeologically sterile LaminatedSilts that are preserved in the Western area at the rear of the caveand date to MIS 11 (414e349 ka). The Laminated silts were theneroded before deposition of sediments dated to MIS 6, fromroughly 174 to 142 ka. These MIS 6 deposits are preserved at therear of the cave as uncalcified sandy deposits (DB Sand 4 deposits)and in the front of the cave as a series of heavily eroded calcifieddeposits on the wall of the cave (LC-MSA Lower). The next phaseof deposition occurred between roughly 133 and 115 ka at thebeginning of MIS 5 and again consists of calcified deposits at thefront of the cave (LC-MSA Upper lower dune and LC-MSA Middle),and perhaps a series of loose deposits at the rear of the cave (LBGSand 1). A significant phase of erosion then appears to haveoccurred before the deposition of the Lower Roof Spall in theentrance area (Eastern area) of the cave between 114 and 106 ka.This initial deposition was then followed by the deposition ofa series of uncalcified deposits in both the front and the rear of thecave between 102 and 91 ka (see Table 1). At 91 ka the cave wassealed by a large dune and speleothems began to form on the backslope of the dune surface.
Methods
Archaeomagnetic sampling and laboratory analysis
Bulk samples were taken from every stratigraphic unit (Stra-tUnit) that was identified from the three excavations at the site andare presented as project sample numbers unless otherwise stated(see Marean et al. [2010]). Subsamples of the bulk sample werethen sieved to remove large clasts of quartzite, air dried for 48 h,and packaged into standard paleomagnetic sample cubes beforeshipment to the laboratory in Liverpool. This process saves shippingmore sediment than is necessary and so reduces the overall costs ofanalysis. StratUnits are grouped together to form stratigraphicaggregates (StratAggs), representing a distinct phase of deposition.The data we further contrasted against micromorphologicallydistinct units as per Karkanas and Goldberg (2010). When largeStratUnits were encountered multiple samples were taken fromdifferent excavation squares to increase sample density. Sampleswere taken from bulk samples so as to represent the average of thedeposit sampled. The samples were packaged into standardpaleomagnetic sample cubes. In total, around 676 bulk sampleswere studied from the three excavation areas (Northeastern [LC-MSA], Western, and Eastern), which did not include surfacecleanings and disturbances.
Standard dual frequency magnetic susceptibility methods wereapplied as per Dearing (1999) and are presented as low frequencymagnetic susceptibility (MS or cLF) measurements in units of10�8 m3 kg�1 unless otherwise stated. A series of more detailedmineral magnetic tests (as per Walden et al. [1999]) were con-ducted on representative samples to identify the magnetic miner-alogy, grain size, and concentration of magnetic minerals giving riseto the MS variation (see SOM). The magnetic susceptibility of thesamples at dual frequency room temperature (XLF, XHF, XFD%) andfrom liquid nitrogen temperatures (�196 �C; MS-LT) were con-ducted on Bartington (Ltd.) MS2 equipment. A MagneticMeasurements (Ltd.) Variable Field Translation Balance (VFTB) wasused to perform isothermal remanent magnetization (IRM)
1 It should be noted that not all archaeologically based virtual reality (VR)applications are inaccurate, but rather that they are missing a spatial analyticalcomponent.
A.I.R. Herries, E.C. Fisher / Journal of Human Evolution 59 (2010) 306e320308

Author's personal copy
acquisition and backfield curves, hysteresis loops, and thermo-magnetic (Curie) curves.
The mineral magnetic study at PP13B has been augmented by:(1) paleomagnetic analysis of burnt rocks to define in situ and exsitu burnt rocks (Fig. 1), and (2) micromorphological analysis of thedeposits to help discriminate between deposits diffused by aeolianor anthropogenic action (see Karkanas and Goldberg [2010]).
Multidimensional GIS modeling
Multidimensional Geographic Information Systems (mDGIS)was used to contextualize MS samples within site PP13B and thecorresponding geological and archaeological deposits. The studyrelied on ESRI ArcGIS 9.2, including the 3D Analyst extension andESRI ArcScene, to model site PP13B. Despite noted multidimen-sional visualization and analytical deficiencies2, ESRI ArcGIS isamong the most widely used GIS programs available today makingthe data generated easily transferable and usable by other users orapplications. ArcGIS also provides a comprehensive suite of toolsfor creating raster and vector data types and, with customization,can bemanipulated sufficiently to create suitable multidimensionaldata. For advanced multidimensional modeling (e.g., 3D convexhulls and TIN models) Raindrop Geomagic was used.
Data within the mDGIS were mapped using Topcon reflectorlesstotal stations georeferenced to a local, site centric grid (MAP grid).All finds, including archaeological and geological specimens,removed from the sitewere shot in directlywith a total station. Bulksamples for theMSanalysiswere shot in similarly. Both plottedfindsand bulk samples received unique identification numbers that wereused later to associate the data with StratUnits or other attributes.StratUnits were mapped by plotting the outline and center of theupper and lower extent of each unit. In total, 34,121 plotted finds,
1070 StratUnits, and 676MS samples have beenmapped since 2000,providing a detailed archaeological and geological record of the site.
The base data of the mDGIS consists of a high-resolution 2.5DTIN model of PP13B created using Raindrop Geomagic. StratUnitscontaining evidence of burning as identified in the field (FieldIdentified Combustion Features [FICF]), such as charcoal, burntbone or stone, and ash, were modeled as z-aware polygons. Plottedfinds were similarly subdivided according to associationwith burntStratUnits and represented as color coded individual points. Theplotted finds associated with burnt StratUnits are thus defined asBurnt StratUnit Plotted Finds (BSUPF). While BSUPFs should occurconsistently with burned StratUnits, the opposite is not always true.Thus, observation of BSUPF density within and around burnedStratUnits, and also MS “hot spots,” may help define activity areas,including in situ combustion features and secondary displacementof burned materials. MS points were modeled using size graduated3D spheres subdivided into 12 classes corresponding to MS valueranges. MS hot spots were defined as having a MS value greaterthan or equal to 50.00.
Magnetic susceptibility modeling; results and discussion
The Pinnacle Point caves provide perfect testing grounds formineral magnetic studies for a number of reasons. Firstly, thedeposits are not altered by pedogenesis after deposition.While ironis mobile and susceptible to two way transformation, the magneticmineralogy of burnt sediments is relatively stable up to w600 �C(Herries et al., 2007) and preliminary paleomagnetic studies ofburnt rocks from PP13B suggest they were heated to maximumtemperatures around 300e350 �C (Herries, 2009; Fig. 1). BecausePP13B is a relatively narrow deep cave that is perched part way upa sea cliff, natural fires occurring within the cave are extremelyunlikely.
Secondly, the bulk of the unaltered base sediments (beforearchaeological occupation) consist of diamagnetic (negativelymagnetic) to very weakly magnetic, externally derived ‘dune sand’and internally derived ‘cave sand’ from breakdown of the hostquartzite (SOM Fig. 1; Table Mountain Sandstone [TMS]; Karkanasand Goldberg, 2010). Mineral magnetic analysis of local dune andcave sand indicates that the cave sand was entirely devoid offerrimagnetic material suggestive of aeolian-derived soil, while the
Table 1Mean, minimum, and maximum magnetic susceptibility (MS) values, age estimates, and location of major stratigraphic aggregates from PP Cave 13B
Strat aggregate Magnetic susceptibility (10�8 m3 kg�1) Age min (ka) Age max (ka) Age median (ka) Excavation
No. Mean Min Max s.d.
LB Sand 1 38 10.45 1.38 32.47 5.79 91 94 93 WesternShelly Brown Sand 25 35.93 22.22 55.17 8.87 91 98 95 EasternUpper Roof Spall 86 52.45 17.61 414.01 43.55 91 98 95 EasternDB Sand 2 11 18.16 10.38 29.92 7.08 91 102 97 WesternLB Sand 2 6 13.44 2.55 22.87 6.81 91 102 97 WesternDB Sand 3 79 30.01 2.42 150 32.93 91 102 97 WesternLower Roof Spall 37 40.97 5.76 138.99 34.8 106 114 110 EasternLBG Sand 1 93 4.74 0.2 26.32 3.62 94 134 114 WesternLC-MSA Upper 9 25.66 7.91 61.3 17.87 115 133 124 NortheasternLC-MSA Middle 25 43.84 14.85 81.01 18.03 120 130 125 NortheasternDB Sand 4a 8 2.18 0.21 4.28 1.32 117 166 142 WesternLBG Sand 2 9 4.15 1.83 17.73 5.15 117 166 142 WesternDB Sand 4b 7 4.45 0.71 17.54 5.86 152 166 159 WesternLBG Sand 3 4 2.5 1.19 3.32 0.91 152 349 160 WesternDB Sand 4c 21 2.25 0.76 4.61 1.1 152 349 160 WesternLBG Sand 4 1 3.82 3.82 3.82 0 152 349 160 WesternLC-MSA Lower 99 56.76 4.5 153.49 28.22 153 174 164 NortheasternLB Silt-G 11 2.03 0.65 4.32 0.97 152 349 251 WesternLB Silt 21 1.85 0.47 3.17 0.74 152 349 251 WesternLaminated Facies 12 1.27 0.72 3.33 0.71 349 414 382 Western
2 Visualization deficiencies with ArcGIS 9.2 include: 1) limited TIN and rastersurface interpolation techniques to model highly irregular and spatially restrictedsurfaces, 2) the inability to model topography with overhanging or vertical surfaces,3) lack of volumetric and solid modeling techniques, and 4) the inability to createvector data (e.g., point, polyline, polygon, and z-aware shapefiles) within the 3Denvironment. Analytical deficiencies include: 1) the inability to perform mathe-matical calculations and spatial analyst functions on raster data within a 3D envi-ronment (i.e., ArcScene), and 2) limited 3D point pattern spatial analysis including3D volumetric density analysis.
A.I.R. Herries, E.C. Fisher / Journal of Human Evolution 59 (2010) 306e320 309

Author's personal copy
dune sand had an extremely weak signal suggesting an extremelysmall amount of such material (see SOM).
Thirdly, experimental fires and laboratory heating experimentsproduced on local Pinnacle Point dune and cave sand indicate thatheating causes magnetic enhancement with an increase in MSvalues (Fig. 2 and SOM Fig. 1). The contrast between the unburntand burnt deposits is very marked and so mixing of burnt materialinto unburnt sands is even more noticeable. Experimental fires
indicate that as more fires are burnt on the same spot greater MSenhancement is seen after each successive burn and so the amountof MS enhancement could indicate the intensity of occupation(Fig. 2a). An increase in the frequency dependence of magneticsusceptibility (XFD%) is also noted and indicates the formation offine-grained ferrimagnetic minerals that have been shown to beproduced by burning (Herries et al., 2007; Herries, 2009; see SOM).While some darkening of the deposits below the experimental fireoccurred there was almost no enhancement of the deposits below2 cm and very little below 1 cm (Fig. 2c). Therefore, while burningcan alter the color of underlying deposits it does not secondarilyalter the magnetic signal of the deposits, even after several fires.Extremely high MS values were not recorded in the experimentalfires until four fires had been burnt on the same spot. After fourfires the high MS values also correlated with a decrease in XFD%values due to the formation of ultrafine superparamagnetic (SP)grains (see SOM for more information; SOM Fig. 3). The presence ofSP grains is also confirmed by low temperature magnetic suscep-tibility analysis (see SOM Fig. 4). The pattern of high MS andmedium to low XFD% values is characteristic of in situ hearths fromSouth African MSA sites (Herries, 2006, 2009; SOM). This patternsuggests that extremely high MS values may represent areas wheremultiple fires have been lit and where long term occupationoccurred. Minimal enhancement may indicate shorter periods ofoccupation.
Fourthly, the site chronology (see Marean et al. [2010]; Jacobs[2010]) suggests that sediments of a similar age occur in differentparts of the cave and so changes in occupation patterns could benoted in space and time. The MS measurements for the site variedbetween 0.2 and 414 (10�8 m3 kg�1). To present the MS data ina clear format they are plotted using 2D plan and profile graphs, 3Doblique angle images, and a Supplementary video (SOM Video)discussing and visualizing the data within the mDGIS. Figure 3shows the traditional 2D method where only single slices of MSdata are shown in section. Figure 4 plots the same data within the3D GIS model and with geospatial coordinates associated with theMS data. The SOM Video shows the model in its true multidi-mensional form. The model visualizes the data as spheres and thelarger spheres indicate larger MS values.
Is there variation in the MS pattern between different areas?
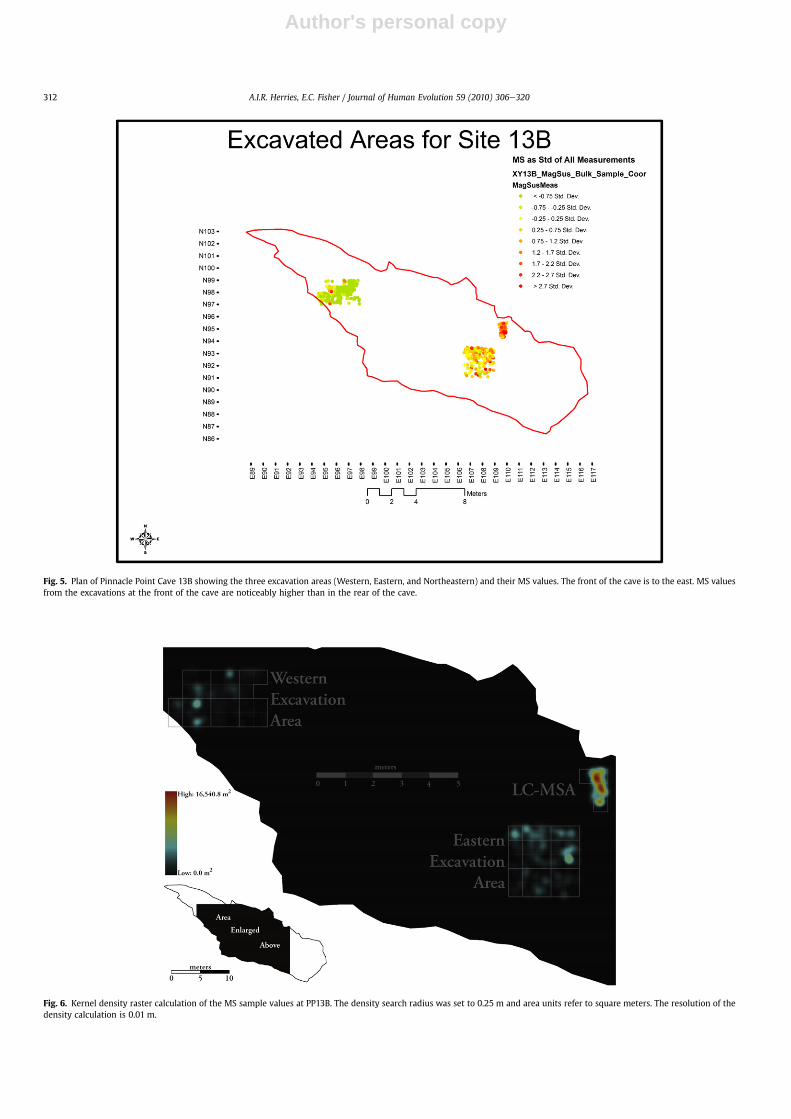
Figures 5 and 6 show two different horizontal 2D representa-tions of MS values for the three excavation areas. Figure 5 shows thepattern using size-graded spheres to represent MS values and
Fig. 2. Magnetic susceptibility data for experimental fires produced on Pinnacle Pointcave sand. (a) Increase in magnetic susceptibility (MS) after successive burns; (b)increase and then decline in frequency dependence of magnetic susceptibility aftersuccessive burns; (c) decrease in MS with depth after the fourth successive fire. Fig. 3. MS (10�8 m3 kg�1) versus elevation for the Western excavation of PP13B.
A.I.R. Herries, E.C. Fisher / Journal of Human Evolution 59 (2010) 306e320310

Author's personal copy
shows the exact 3D coordinates of each sample point. In sucha representation, the value of unsampled areas between samplepoints is not estimated. Figure 6 is a Kernel density raster calcula-tion of the magnetic susceptibility that is often used in 2D visual-ization of archaeological data. However, it cannot be used ina multidimensional model and additionally it calculates values forunsampled space between sample points. It is therefore not a truereflection of the MS variability.
What is immediately apparent from both figures (Figs. 5 and 6)and Table 1 is that MS values are much higher in the front (Easternand Northeastern [LC-MSA] excavations) of the cave whencompared to the rear (Western excavation). Moreover, high MSvalues also cluster in definable layers. Such patterning in the datamay indicate variations in anthropogenic alteration and so spatialpatterning of occupation throughout the cave and through time. Asshown in Figure 6, MS values are greatest from the LC-MSAdeposits(mean 52.23), followed closely by the Eastern excavations (43.61),and then theWestern excavations (11.34). Figure 7 and SOM Table 2indicate that there are significant differences between the variousStratAggs in each area, particularly for the Western excavations. Ascan be seen from Table 1 and SOM Table 2 the meanMS of the threeareas is significantly different from each other and within thoseareas the mean MS of each of the stratigraphic aggregates is alsosignificantly different. One of the aims of this paper was to try tounderstand the MS patterning both in vertical (time) and hori-zontal (spatial) space. As the Western area deposits show thegreatest MS variation and have the longest stratigraphy, they arethe main focus of this study.
What do MS hot spots represent?
A number of MS hot spots (MS> 50) are noted in the MS datafrom all three areas of the cave (Figs. 4e6 and 8e10). The magneticmineralogy of hot spots from the site indicates that they are
dominated by ultrafine-grained ferrimagnetic minerals consistentwith that from modern fishermen’s hearths in the Pinnacle Pointcaves (see SOM) and experimental fires (see above; Fig. 1).Frequency dependence of magnetic susceptibility (XFD%)measurements of the Western area excavation MS hot spots indi-cate a signature that is characteristic of in situ combustion featureswith high MS and low XFD% (see Fig. 1 and SOM Fig. 3).
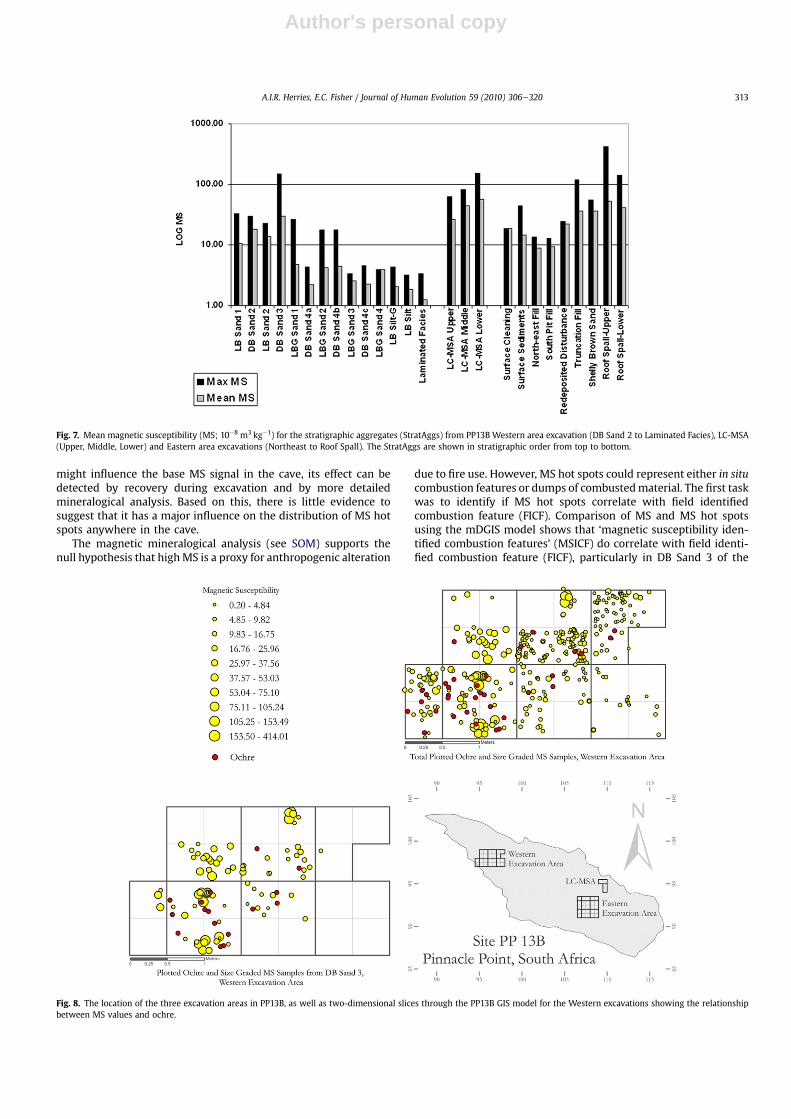
PP13B also contains large quantities of iron oxide-rich ochrethat occurs in the cave because of its use as a pigment (Mareanet al., 2007). As such, the mineralogy of excavated and modernochre was studied to assess its possible influence on the MS signal(SOM; Herries, 2009). In general, the ochre from the site has a lowMS and is mainly dominated by antiferromagnetic hematite and,as such, has a distinct mineralogy compared to the burnt sedi-ments and would very minimally influence the MS of the samples(SOM Fig. 2a). However, analysis of ochre from the Eastern areaexcavations indicates that some ochre has a minimal to strongferrimagnetic signal that is similar to experimentally heated ochre(see Herries [2009]). Ferrimagnetic ochre is often deep red in colorand the fact that the early modern humans at PP13B were pickingthe reddest ochre for utilization (Marean et al., 2007; see Watts[2010]) may indicate that they were deliberately altering thecolor of the ochre by heat as early as 114e91 ka or even as early as174e153 ka.
While ochre does occur in very high density in high MS layerDB Sand 3 of the Western excavations (Fig. 8), its influence on theMS signal is minimal. Overall, ochre does not correlate with MShot spots (Fig. 8), and in the Western area of the cave in particularthe ochre is dominated by a weak antiferromagnetic mineralogythat could not be responsible for the MS hot spots, despite someassociation. The majority of the ferrimagnetic ochre comes fromthe Eastern area excavations, where the MS signal is morehomogenous and perhaps suggests mixing of a number ofcombustion features throughout the deposit. While the ochre
Fig. 4. A vertical slice through the PP13B GIS model for the Western area excavation. This slice shows the slope of the deposits at the rear of the cave along with the identified slopeof high MS values associated with StratAgg DB Sand 3. There is an absence of high MS values in the lowest layers of this excavation. The vertical line of circles on the right of thepicture represents the archaeologically sterile MIS 11 deposits. A Jenks routine was used for this and all subsequent figures.
A.I.R. Herries, E.C. Fisher / Journal of Human Evolution 59 (2010) 306e320 311
Author's personal copy
Fig. 5. Plan of Pinnacle Point Cave 13B showing the three excavation areas (Western, Eastern, and Northeastern) and their MS values. The front of the cave is to the east. MS valuesfrom the excavations at the front of the cave are noticeably higher than in the rear of the cave.
Fig. 6. Kernel density raster calculation of the MS sample values at PP13B. The density search radius was set to 0.25 m and area units refer to square meters. The resolution of thedensity calculation is 0.01 m.
A.I.R. Herries, E.C. Fisher / Journal of Human Evolution 59 (2010) 306e320312
Author's personal copy
might influence the base MS signal in the cave, its effect can bedetected by recovery during excavation and by more detailedmineralogical analysis. Based on this, there is little evidence tosuggest that it has a major influence on the distribution of MS hotspots anywhere in the cave.
The magnetic mineralogical analysis (see SOM) supports thenull hypothesis that highMS is a proxy for anthropogenic alteration
due to fire use. However, MS hot spots could represent either in situcombustion features or dumps of combustedmaterial. The first taskwas to identify if MS hot spots correlate with field identifiedcombustion feature (FICF). Comparison of MS and MS hot spotsusing the mDGIS model shows that ‘magnetic susceptibility iden-tified combustion features’ (MSICF) do correlate with field identi-fied combustion feature (FICF), particularly in DB Sand 3 of the
Fig. 7. Mean magnetic susceptibility (MS; 10�8 m3 kg�1) for the stratigraphic aggregates (StratAggs) from PP13B Western area excavation (DB Sand 2 to Laminated Facies), LC-MSA(Upper, Middle, Lower) and Eastern area excavations (Northeast to Roof Spall). The StratAggs are shown in stratigraphic order from top to bottom.
Fig. 8. The location of the three excavation areas in PP13B, as well as two-dimensional slices through the PP13B GIS model for the Western excavations showing the relationshipbetween MS values and ochre.
A.I.R. Herries, E.C. Fisher / Journal of Human Evolution 59 (2010) 306e320 313
Author's personal copy
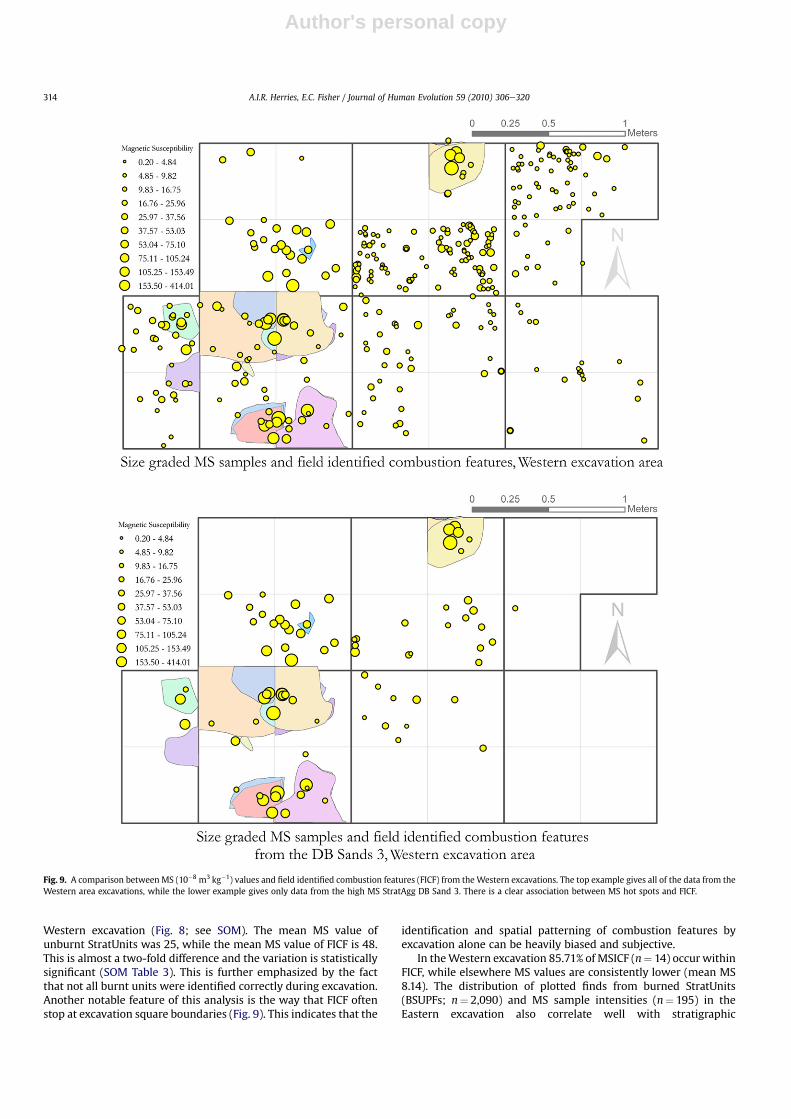
Western excavation (Fig. 8; see SOM). The mean MS value ofunburnt StratUnits was 25, while the mean MS value of FICF is 48.This is almost a two-fold difference and the variation is statisticallysignificant (SOM Table 3). This is further emphasized by the factthat not all burnt units were identified correctly during excavation.Another notable feature of this analysis is the way that FICF oftenstop at excavation square boundaries (Fig. 9). This indicates that the
identification and spatial patterning of combustion features byexcavation alone can be heavily biased and subjective.
In theWestern excavation 85.71% of MSICF (n¼ 14) occur withinFICF, while elsewhere MS values are consistently lower (mean MS8.14). The distribution of plotted finds from burned StratUnits(BSUPFs; n¼ 2,090) and MS sample intensities (n¼ 195) in theEastern excavation also correlate well with stratigraphic
Fig. 9. A comparison between MS (10�8 m3 kg�1) values and field identified combustion features (FICF) from the Western excavations. The top example gives all of the data from theWestern area excavations, while the lower example gives only data from the high MS StratAgg DB Sand 3. There is a clear association between MS hot spots and FICF.
A.I.R. Herries, E.C. Fisher / Journal of Human Evolution 59 (2010) 306e320314
Author's personal copy
interpretations and are sloped at w8� SSE. The vast majority(91.47%) of MS hot spots (MS> 50) here occur within the spatialextent of FICF. This correlation further supports the interpretationthat MS primarily reflects burning and anthropogenic activity.
TheMS datawas also correlated against themicromorphologicaldata of Karkanas and Goldberg (2010). Micromorphological anal-ysis of deposits from the Western excavation suggests that somelayers contain significant inputs of charcoal and burnt bone, whichwere crushed and broken as a result of trampling (for examplesample 46564; Karkanas and Goldberg, 2010). This further suggestshumans as the mechanism for redistribution of burnt materialaway from combustion features. Unfortunately, there is no
micromorphology sample directly related to an MSICF in theWestern area excavation. The micromorphology samples fall intoareas where the MS signal is of a medium value. The MS andmicromorphology together suggest that burnt material was inter-mixed with unaltered sand deposits due to trampling in the moreEastern part of the Western area excavation. The MS patternsuggests redistribution of burnt material down slope towards theentrance (east) of the cave, and so mixing likely occurred due toboth human movement and gravity driven slope processes (Figs. 4and 9).
In the Western area excavation, where archaeological depositsoverlay archaeologically sterile sediments, a decrease in MS is seen
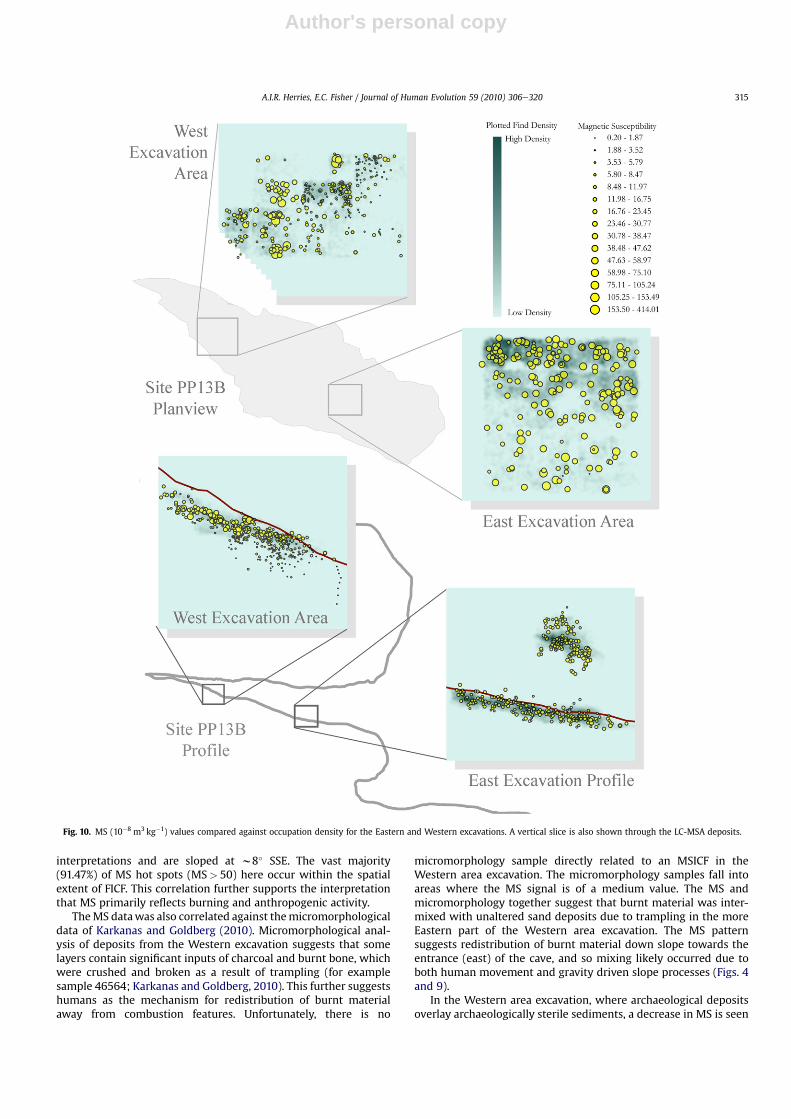
Fig. 10. MS (10�8 m3 kg�1) values compared against occupation density for the Eastern and Western excavations. A vertical slice is also shown through the LC-MSA deposits.
A.I.R. Herries, E.C. Fisher / Journal of Human Evolution 59 (2010) 306e320 315
Author's personal copy
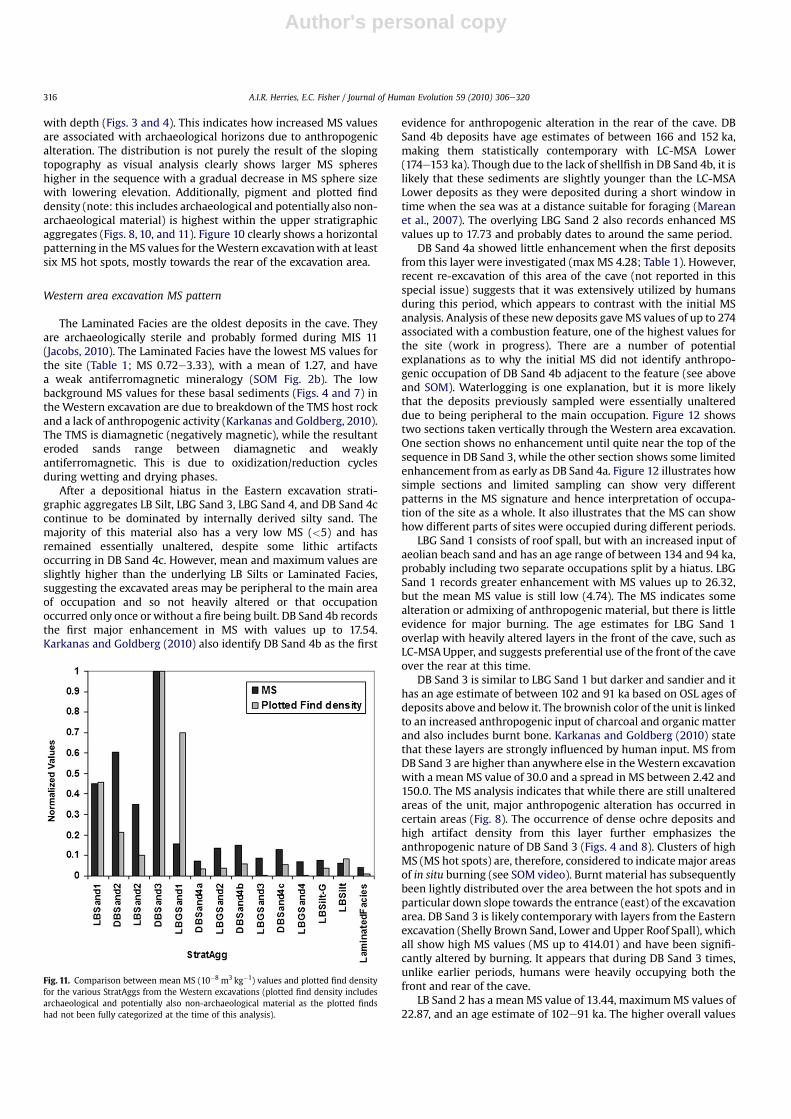
with depth (Figs. 3 and 4). This indicates how increased MS valuesare associated with archaeological horizons due to anthropogenicalteration. The distribution is not purely the result of the slopingtopography as visual analysis clearly shows larger MS sphereshigher in the sequence with a gradual decrease in MS sphere sizewith lowering elevation. Additionally, pigment and plotted finddensity (note: this includes archaeological and potentially also non-archaeological material) is highest within the upper stratigraphicaggregates (Figs. 8, 10, and 11). Figure 10 clearly shows a horizontalpatterning in theMS values for theWestern excavationwith at leastsix MS hot spots, mostly towards the rear of the excavation area.
Western area excavation MS pattern
The Laminated Facies are the oldest deposits in the cave. Theyare archaeologically sterile and probably formed during MIS 11(Jacobs, 2010). The Laminated Facies have the lowest MS values forthe site (Table 1; MS 0.72e3.33), with a mean of 1.27, and havea weak antiferromagnetic mineralogy (SOM Fig. 2b). The lowbackground MS values for these basal sediments (Figs. 4 and 7) inthe Western excavation are due to breakdown of the TMS host rockand a lack of anthropogenic activity (Karkanas and Goldberg, 2010).The TMS is diamagnetic (negatively magnetic), while the resultanteroded sands range between diamagnetic and weaklyantiferromagnetic. This is due to oxidization/reduction cyclesduring wetting and drying phases.
After a depositional hiatus in the Eastern excavation strati-graphic aggregates LB Silt, LBG Sand 3, LBG Sand 4, and DB Sand 4ccontinue to be dominated by internally derived silty sand. Themajority of this material also has a very low MS (<5) and hasremained essentially unaltered, despite some lithic artifactsoccurring in DB Sand 4c. However, mean and maximum values areslightly higher than the underlying LB Silts or Laminated Facies,suggesting the excavated areas may be peripheral to the main areaof occupation and so not heavily altered or that occupationoccurred only once or without a fire being built. DB Sand 4b recordsthe first major enhancement in MS with values up to 17.54.Karkanas and Goldberg (2010) also identify DB Sand 4b as the first
evidence for anthropogenic alteration in the rear of the cave. DBSand 4b deposits have age estimates of between 166 and 152 ka,making them statistically contemporary with LC-MSA Lower(174e153 ka). Though due to the lack of shellfish in DB Sand 4b, it islikely that these sediments are slightly younger than the LC-MSALower deposits as they were deposited during a short window intime when the sea was at a distance suitable for foraging (Mareanet al., 2007). The overlying LBG Sand 2 also records enhanced MSvalues up to 17.73 and probably dates to around the same period.
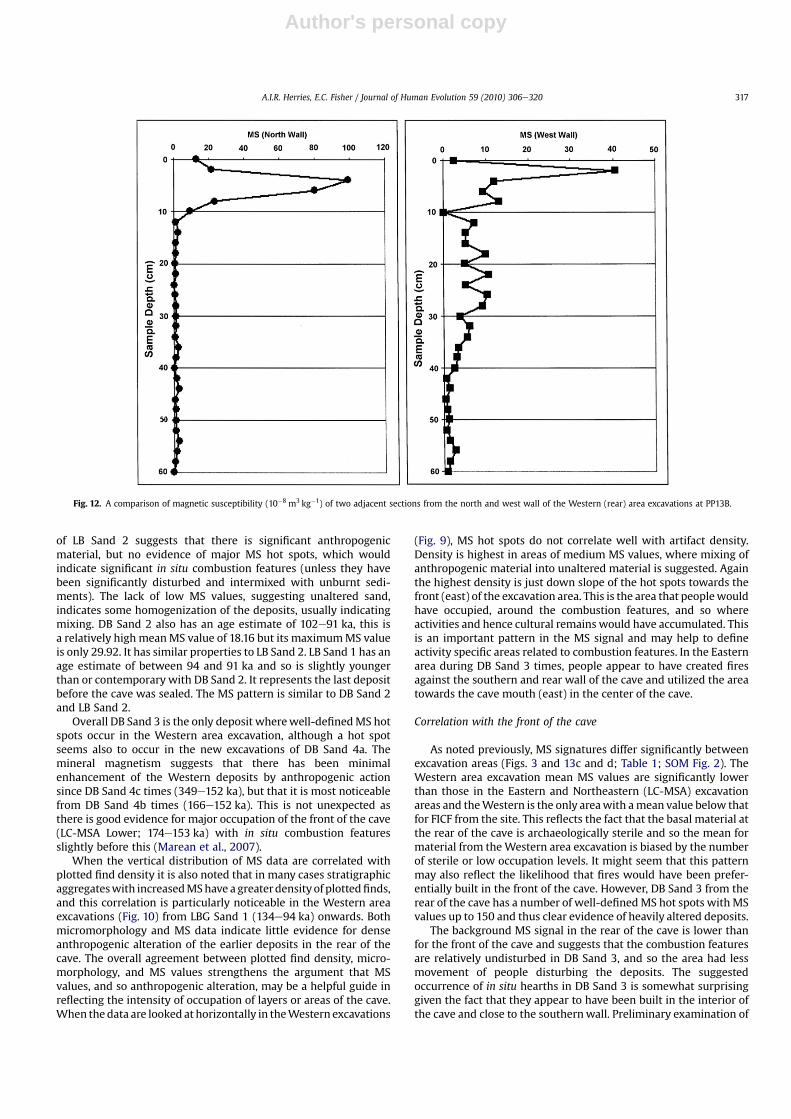
DB Sand 4a showed little enhancement when the first depositsfrom this layer were investigated (max MS 4.28; Table 1). However,recent re-excavation of this area of the cave (not reported in thisspecial issue) suggests that it was extensively utilized by humansduring this period, which appears to contrast with the initial MSanalysis. Analysis of these new deposits gave MS values of up to 274associated with a combustion feature, one of the highest values forthe site (work in progress). There are a number of potentialexplanations as to why the initial MS did not identify anthropo-genic occupation of DB Sand 4b adjacent to the feature (see aboveand SOM). Waterlogging is one explanation, but it is more likelythat the deposits previously sampled were essentially unaltereddue to being peripheral to the main occupation. Figure 12 showstwo sections taken vertically through the Western area excavation.One section shows no enhancement until quite near the top of thesequence in DB Sand 3, while the other section shows some limitedenhancement from as early as DB Sand 4a. Figure 12 illustrates howsimple sections and limited sampling can show very differentpatterns in the MS signature and hence interpretation of occupa-tion of the site as a whole. It also illustrates that the MS can showhow different parts of sites were occupied during different periods.
LBG Sand 1 consists of roof spall, but with an increased input ofaeolian beach sand and has an age range of between 134 and 94 ka,probably including two separate occupations split by a hiatus. LBGSand 1 records greater enhancement with MS values up to 26.32,but the mean MS value is still low (4.74). The MS indicates somealteration or admixing of anthropogenic material, but there is littleevidence for major burning. The age estimates for LBG Sand 1overlap with heavily altered layers in the front of the cave, such asLC-MSAUpper, and suggests preferential use of the front of the caveover the rear at this time.
DB Sand 3 is similar to LBG Sand 1 but darker and sandier and ithas an age estimate of between 102 and 91 ka based on OSL ages ofdeposits above and below it. The brownish color of the unit is linkedto an increased anthropogenic input of charcoal and organic matterand also includes burnt bone. Karkanas and Goldberg (2010) statethat these layers are strongly influenced by human input. MS fromDB Sand 3 are higher than anywhere else in theWestern excavationwith a mean MS value of 30.0 and a spread in MS between 2.42 and150.0. The MS analysis indicates that while there are still unalteredareas of the unit, major anthropogenic alteration has occurred incertain areas (Fig. 8). The occurrence of dense ochre deposits andhigh artifact density from this layer further emphasizes theanthropogenic nature of DB Sand 3 (Figs. 4 and 8). Clusters of highMS (MS hot spots) are, therefore, considered to indicatemajor areasof in situ burning (see SOM video). Burnt material has subsequentlybeen lightly distributed over the area between the hot spots and inparticular down slope towards the entrance (east) of the excavationarea. DB Sand 3 is likely contemporary with layers from the Easternexcavation (Shelly Brown Sand, Lower and Upper Roof Spall), whichall show high MS values (MS up to 414.01) and have been signifi-cantly altered by burning. It appears that during DB Sand 3 times,unlike earlier periods, humans were heavily occupying both thefront and rear of the cave.
LB Sand 2 has a mean MS value of 13.44, maximumMS values of22.87, and an age estimate of 102e91 ka. The higher overall values
Fig. 11. Comparison between mean MS (10�8 m3 kg�1) values and plotted find densityfor the various StratAggs from the Western excavations (plotted find density includesarchaeological and potentially also non-archaeological material as the plotted findshad not been fully categorized at the time of this analysis).
A.I.R. Herries, E.C. Fisher / Journal of Human Evolution 59 (2010) 306e320316
Author's personal copy
of LB Sand 2 suggests that there is significant anthropogenicmaterial, but no evidence of major MS hot spots, which wouldindicate significant in situ combustion features (unless they havebeen significantly disturbed and intermixed with unburnt sedi-ments). The lack of low MS values, suggesting unaltered sand,indicates some homogenization of the deposits, usually indicatingmixing. DB Sand 2 also has an age estimate of 102e91 ka, this isa relatively high meanMS value of 18.16 but its maximumMS valueis only 29.92. It has similar properties to LB Sand 2. LB Sand 1 has anage estimate of between 94 and 91 ka and so is slightly youngerthan or contemporary with DB Sand 2. It represents the last depositbefore the cave was sealed. The MS pattern is similar to DB Sand 2and LB Sand 2.
Overall DB Sand 3 is the only deposit wherewell-definedMS hotspots occur in the Western area excavation, although a hot spotseems also to occur in the new excavations of DB Sand 4a. Themineral magnetism suggests that there has been minimalenhancement of the Western deposits by anthropogenic actionsince DB Sand 4c times (349e152 ka), but that it is most noticeablefrom DB Sand 4b times (166e152 ka). This is not unexpected asthere is good evidence for major occupation of the front of the cave(LC-MSA Lower; 174e153 ka) with in situ combustion featuresslightly before this (Marean et al., 2007).
When the vertical distribution of MS data are correlated withplotted find density it is also noted that in many cases stratigraphicaggregateswith increasedMShave a greaterdensity of plottedfinds,and this correlation is particularly noticeable in the Western areaexcavations (Fig. 10) from LBG Sand 1 (134e94 ka) onwards. Bothmicromorphology and MS data indicate little evidence for denseanthropogenic alteration of the earlier deposits in the rear of thecave. The overall agreement between plotted find density, micro-morphology, and MS values strengthens the argument that MSvalues, and so anthropogenic alteration, may be a helpful guide inreflecting the intensity of occupation of layers or areas of the cave.When thedata are looked at horizontally in theWestern excavations
(Fig. 9), MS hot spots do not correlate well with artifact density.Density is highest in areas of medium MS values, where mixing ofanthropogenic material into unaltered material is suggested. Againthe highest density is just down slope of the hot spots towards thefront (east) of the excavation area. This is the area that peoplewouldhave occupied, around the combustion features, and so whereactivities and hence cultural remains would have accumulated. Thisis an important pattern in the MS signal and may help to defineactivity specific areas related to combustion features. In the Easternarea during DB Sand 3 times, people appear to have created firesagainst the southern and rear wall of the cave and utilized the areatowards the cave mouth (east) in the center of the cave.
Correlation with the front of the cave
As noted previously, MS signatures differ significantly betweenexcavation areas (Figs. 3 and 13c and d; Table 1; SOM Fig. 2). TheWestern area excavation mean MS values are significantly lowerthan those in the Eastern and Northeastern (LC-MSA) excavationareas and theWestern is the only areawith amean value below thatfor FICF from the site. This reflects the fact that the basal material atthe rear of the cave is archaeologically sterile and so the mean formaterial from theWestern area excavation is biased by the numberof sterile or low occupation levels. It might seem that this patternmay also reflect the likelihood that fires would have been prefer-entially built in the front of the cave. However, DB Sand 3 from therear of the cave has a number of well-definedMS hot spots with MSvalues up to 150 and thus clear evidence of heavily altered deposits.
The background MS signal in the rear of the cave is lower thanfor the front of the cave and suggests that the combustion featuresare relatively undisturbed in DB Sand 3, and so the area had lessmovement of people disturbing the deposits. The suggestedoccurrence of in situ hearths in DB Sand 3 is somewhat surprisinggiven the fact that they appear to have been built in the interior ofthe cave and close to the southernwall. Preliminary examination of
Fig. 12. A comparison of magnetic susceptibility (10�8 m3 kg�1) of two adjacent sections from the north and west wall of the Western (rear) area excavations at PP13B.
A.I.R. Herries, E.C. Fisher / Journal of Human Evolution 59 (2010) 306e320 317
Author's personal copy
burnt rocks from PP13B using paleomagnetism suggests that manyare not in situ (Fig. 1; see Herries [2009] and Brown et al. [2009] formethodology), as the secondary heating remanencewithin the rockis not oriented in a normal polarity direction (i.e., towards North).These data further support the mixing model suggested by the MSdata, but may also point to complex processes such as the rakingout and dumping of hearth material.
The MS pattern in the Eastern and Northeastern (front) exca-vation areas differs from the Western area excavation (Fig. 5),where the MS values appear more homogenous. Maximum valuesfor DB Sand 3, LC-MSA Lower, and Lower Roof Spall from the frontof the cave are all around the same MS value (w150) suggestingperhaps a similar level of occupation. Only one unit has anMS value<150; StratUnit E3BD of Upper Roof Spall has an MS value of 414and represents an undisturbed in situ, multiple use combustionfeature. Shelly Brown Sand and Upper Roof Spall from the Easternarea excavation appear to contain the remains of a number ofcombustion features that were likely spread across the entire area,producing a relatively homogenous MS signature horizontally andvertically (Fig. 10). Artifact density for the Eastern area is relativelyconsistent in its northern half towards the LC-MSA, but much lowerin its southern half. However, higher MS values occur in theSouthern area. This may reflect a pattern seen in a number of areasin the cave with low artifact density within MSICF and high artifactdensity in areas adjacent to MSICF. Micromorphology indicatesboth the presence of in situ combustion features and redistributedmaterial that has been trampled in different areas of the section,and confirms the interpretation of the MS pattern (Karkanas andGoldberg, 2010).
The LC-MSA is potentially contemporary with layers in both theEastern andWestern excavation areas. The mean of MS values here(MS¼ 50.97, n¼ 126) is higher than either of the other two exca-vation areas within the site (Table 1). The LC-MSA deposits dipw17� SW and contain clear stratification between unburnt andburnt lenses. The burnt lenses contain ash and dark organicmaterial including carbonaceous material. The spatial distributionof FICF (n¼ 22) here cluster vertically into numerous well-definedlenses. FICF further correlates spatially with the vertical distribu-tion of MS hot spots (MS> 50). The association between FICF and
MS hot spots suggests that these deposits contain in situ combus-tion features. Sediment micromorphology analysis of thesedeposits further supports this conclusion (Karkanas and Goldberg,2010). Of the three LC-MSA deposits, LC-MSA Lower has the highestMS values (mean 56.76 and max MS 153.49). The LC-MSA depositscontain significant quantities of ochre (utilized and unutilized),shellfish, and lithic material, and artifact density is also high(Fig. 10).
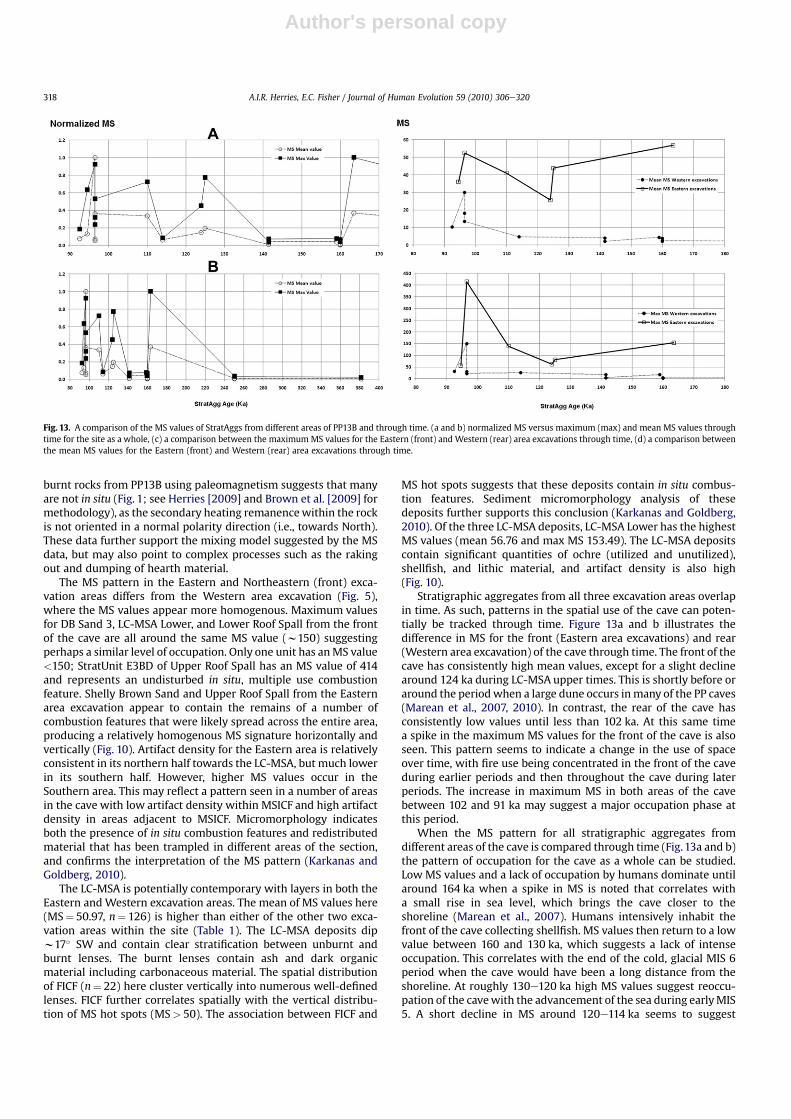
Stratigraphic aggregates from all three excavation areas overlapin time. As such, patterns in the spatial use of the cave can poten-tially be tracked through time. Figure 13a and b illustrates thedifference in MS for the front (Eastern area excavations) and rear(Western area excavation) of the cave through time. The front of thecave has consistently high mean values, except for a slight declinearound 124 ka during LC-MSA upper times. This is shortly before oraround the periodwhen a large dune occurs inmany of the PP caves(Marean et al., 2007, 2010). In contrast, the rear of the cave hasconsistently low values until less than 102 ka. At this same timea spike in the maximum MS values for the front of the cave is alsoseen. This pattern seems to indicate a change in the use of spaceover time, with fire use being concentrated in the front of the caveduring earlier periods and then throughout the cave during laterperiods. The increase in maximum MS in both areas of the cavebetween 102 and 91 ka may suggest a major occupation phase atthis period.
When the MS pattern for all stratigraphic aggregates fromdifferent areas of the cave is compared through time (Fig.13a and b)the pattern of occupation for the cave as a whole can be studied.Low MS values and a lack of occupation by humans dominate untilaround 164 ka when a spike in MS is noted that correlates witha small rise in sea level, which brings the cave closer to theshoreline (Marean et al., 2007). Humans intensively inhabit thefront of the cave collecting shellfish. MS values then return to a lowvalue between 160 and 130 ka, which suggests a lack of intenseoccupation. This correlates with the end of the cold, glacial MIS 6period when the cave would have been a long distance from theshoreline. At roughly 130e120 ka high MS values suggest reoccu-pation of the cavewith the advancement of the sea during earlyMIS5. A short decline in MS around 120e114 ka seems to suggest
Fig. 13. A comparison of the MS values of StratAggs from different areas of PP13B and through time. (a and b) normalized MS versus maximum (max) and mean MS values throughtime for the site as a whole, (c) a comparison between the maximum MS values for the Eastern (front) and Western (rear) area excavations through time, (d) a comparison betweenthe mean MS values for the Eastern (front) and Western (rear) area excavations through time.
A.I.R. Herries, E.C. Fisher / Journal of Human Evolution 59 (2010) 306e320318
Author's personal copy
a period of low occupation during amajor period of dune formationat the site. After this the entire cave appears to have been inten-sively occupied until it was sealed by a large dune around 91 ka.
Conclusions
Our answers to those questions posed earlier are: (1) themagnetic mineralogy of the samples supports the use of MS asa proxy of anthropogenically altered material; (2) MS hot spotscorrelate with StratUnits that were identified as burnt duringexcavation; (3) micromorphological interpretations correlate wellwith the MS interpretations; (4) MS data indicate differencesbetween layers from the excavations, but the variation is differentfor different excavation areas; (5) there is good correlation betweenMS and plotted find density, which suggests MS is a good proxy forintensity of occupation; moreover, the degree of MS enhancementappears to be a good indicator of occupation longevity and inten-sity; and (6) there is a major difference in the MS pattern indifferent excavation areas, which suggests humans were usingdifferent parts of the cave more intensively at different timeperiods.
Deposits from the front of the cave have high MS values duringearlier periods whenMS is low at the rear of the cave. This indicatesa potential change in the occupation pattern of the cave over time.Intense occupation of the front of the cave appears to have occurredduring earlier periods with minimal occupation or different activ-ities occurring at the back of the cave during this time. Intenseoccupation of the entire area of the cave seems to have occurredduring later periods, as this is whenMS is also high in the rear of thecave. The combustion features seem more intact and less distrib-uted at the rear of the cave when compared to the front, as this iswhere people would have been entering and leaving the cave. Suchchanges may reflect fires built for different purposes, such aswarmthwhile sleeping towards the cave rear, and cooking and heattreatment of artifacts towards the front. Changes occurring throughtime may reflect increasing group sizes utilizing the cave orlongevity of occupation at different periods. Distinct spatialpatterning can also be noted. A low density of artifacts occurs inareas with high MS, which represent combustion features, whilea high density of artifacts occurs in areas of medium MSsurrounding the combustion features. These areas adjacent to thecombustion features are where the main activities appear to havetaken place. Away from these features both artifact density and MStrail off, although some admixture of anthropogenically alteredmaterial occurs due to transport from the movement of people.
This first attempt at creating a multidimensional model of MS asa proxy of anthropogenic alteration and distribution for all depositsfrom an archaeological site has shown a great potential for recov-ering information about spatial patterning. This type of analysis canalso be used to help identify the context of burnt artifacts such asstone tools or ochre. In this way it can be established if such arti-facts were associated with combustion features and whether theheating was deliberate. Such an analysis was used by Brown et al.(2009) to help identify the heat treatment of silcrete stone toolsfrom PP5e6. When quantitative analysis of fire-modified rocks andstone tools from a site are combined with MS data as describedhere, it can provide a very powerful tool for understanding spatialpatterning in archaeological sites.
Acknowledgements
Archaeomagnetic analysis was undertaken at the University ofLiverpool Geomagnetism Laboratory with the support and assis-tance of Martin Gratton and Mimi Hill. The work was conducted aspart of the Mossel Bay Archaeological (MAP) and SACP4 projects
funded by the National Science Foundation (USA; grants # BCS-9912465, BCS-0130713, and BCS-0524087 to Marean), the HydeFamily Foundation, the Institute of Human Origins, and ArizonaState University. Additional funding to AIRH was provided by theUNSW Faculty of Medicine and ARC Discovery Grant DP0877603.Thanks to the South African Heritage Resources Agency (SAHRA)and Heritage Western Cape (HWC) for providing permits toconduct excavations at the selected sites and export specimens foranalysis. Thanks also to the Mossel Bay community for assistingduring excavations and analyses and in particular we thank the staffof the Diaz Museum Complex and the Mossel Bay ArchaeologicalProject.
Appendix. Supplementary data
Supplementary data associated with this article can be found inthe online version, doi:10.1016/j.jhevol.2010.07.012
References
Barceló, J.A., 2000. Visualizing what might be. An Introduction to virtual reality inarchaeology. In: Barceló, J.A., Forte, M., Sanders, D. (Eds.), Virtual Reality inArchaeology. British Archaeological Reports, vol. S843. ArcheoPress, Oxford,pp. 9e36.
Barceló, J.A., Vincente, O., 2004. Some problems in archaeological excavation 3Dmodelling. In: Magistrat der Stadt Wien-Referat Kulturelles Erbe-Stadtarch-äeologie-Wien (Ed.), Enter the Past. The E-way into the four Dimensions ofCultural Heritage. British Archaeological Reports, Int. Series, vol. 1227.ArchaeoPress, Oxford.
Boukhari, S., 2000. Rebuilding the Past. In: UNESCO Courier, vol. 40.Brown, K.S., Marean, C.W., Herries, A.I.R., Jacobs, Z., Tribolo, C., Braun, D., Roberts, D.L.,
Meyer, M.C., Bernatchez, J., 2009. Fire as an engineering tool of early modernhumans. Science 325, 859e862.
Church, M.J., Peters, C., Batt, C.M., 2007. Sourcing fire ash on archaeological sitesin the Western and Northern Isles of Scotland, using mineral magnetism.Geoarchaeology 22, 747e774.
Dearing, J., 1999. Magnetic susceptibility. In: Walden, J., Oldfield, F., Smith, J. (Eds.),Environmental Magnetism: a Practical Guide. Quatern. Res. Assoc. Tech. Guide,vol. 6, pp. 35e62.
Ellwood, B.B., Petruso, K.M., Harrold, F.B., Schuldenrein, J., 1997. High-resolutionpaleoclimatic trends for the Holocene identified using magnetic susceptibilitydata from archaeological excavations in caves. J. Archaeol. Sci. 24, 569e573.
Fisher, E., 2005. Applications of multi-dimensional GIS within subsurface archae-ology. Geoconnexion Mag. July/August, 48e50.
Fisher, E., 2007. Beyond smoke and mirrors: applications of multidimensional GIS attwo cave/rockshelter sites in Ethiopia and South Africa. In: Paper presented atthe 72nd Annual Meeting of the Society for American Archaeology, Austin,Texas, April 26e30, 2006.
Herries, A.I.R., 2006. Archaeomagnetic evidence for climate change at Sibudu Cave.S. Afr. Hum. 18, 131e147.
Herries, A.I.R., 2009. New approaches for integrating palaeomagnetic and mineralmagnetic methods to answer archaeological and geological questions on StoneAge sites. In: Fairbrain, A., O’Conner, S., Marwick, B. (Eds.), Terra Australis28dNew Directions in Archaeological Science. The Australian NationalUniversity Press, Canberra, Australia, pp. 235e253 (Chapter 16).
Herries, A.I.R., Kovacheva, M., Kostadinova, M., Shaw, J., 2007. Archaeo-directionaland intensity data from burnt structures at the Thracian site of Halka Bunar(Bulgaria): the effect of magnetic mineralogy, temperature and atmosphere ofheating in antiquity. Phys. Earth Planet Int. 162, 199e216.
Herries, A.I.R., Latham, A.G., 2003. ‘Environmental archaeomagnetism’: evidence forclimatic change during the later Stone Age using the magnetic susceptibility ofcave sediments from Rose Cottage Cave, South Africa. In: Mitchell, P., Haour, A.,Hobart, J. (Eds.), Researching Africa’s Past: New contributions from BritishArchaeologists. Oxford University School of Archaeology Monograph 57, Oxford,UK, pp. 25e35.
Herries, A.I.R., Latham, A.G., 2009. Chapter 5: archaeomagnetic studies at the Caveof Hearths. In: McNabb, J., Sinclair, A.G.M. (Eds.), The Cave of Hearths: MakapanMiddle Pleistocene Research Project. University of Southampton Series inArchaeology, vol. 1. Archaeopress, Oxford, pp. 59e64.
Jacobs, Z., 2010. An OSL chronology for the sedimentary deposits from PinnaclePoint Cave 13B - a punctuated presence. J. Hum. Evol. 59 (3-4), 289e305.
Karkanas, P., Goldberg, P., 2010. Site formation processes in site PP13B (PinnaclePoint, South Africa): resolving stratigraphic and depositional complexities withmicromorphology. J. Hum. Evol 59 (3-4), 256e273.
Latham, A.G., Herries, A.I.R., 2004. The formation and sedimentary infilling of thecave of hearths and historic cave complex. Geoarchaeology 19, 323e342.
LeBorgne, E., 1955. Susceptibilité magnétiqe anormale du sol superficiel. Annls.Géophys. 11, 399e419.
A.I.R. Herries, E.C. Fisher / Journal of Human Evolution 59 (2010) 306e320 319

Author's personal copy
LeBorgne, E., 1960. Etude expérimentale du trainage magnétique dans le cas d’unensemble de grains magnétiques trés fins disperses dans une substance non-magnétique. Annls. Géophys. 16, 445e494.
Lewin, J.S., Gross, M.D., 1997. Resolving archaeological site data with 3D computermodelling: the case of Ceren. Automat. Const. 6, 323e334.
Marean, C.W., Bar-Matthews, M., Fisher, E., Goldberg, P., Herries, A.I.R., Karkanas, P.,Nilssen, P., Thompson, E., 2010. The stratigraphy of the Middle Stone Age CavePinnacle Point 13B (Mossel Bay, Western Cape Province, South Africa). J. Hum.Evol. 59 (3e4), 234e255.
Marean, C.W., Bar-Matthews,M., Bernatchez, J., Fisher, E., Goldberg, P., Herries, A.I.R.,Jacobs, Z., Jerardino, A., Karkanas, P., Minichillo, T., Nilssen, P.J., Thompson, E.,Watts, I.,Williams,H.W., 2007. EarlyHumanuse ofmarine resources andpigmentin South Africa during the Middle Pleistocene. Nature 449, 905e908.
Marwick, B., 2005. Element concentrations and magnetic susceptibility of anthro-sols: indicators of prehistoric human occupation in the inland Pilbara, WesternAustralia. J. Archaeol. Sci. 32, 1357e1368.
Mason, R.J., 1988. Cave of Hearths, Makapansgat, Transvaal, Occasional Paper No. 21.Archaeological Research Unit, University of Witwatersrand, Johannesburg,South Africa.
Morinaga, H., Inokuchi, H., Yamashita, H., Ono, A., Inada, T., 1999. Magneticdetection of heated soils at paleolithic sites in Japan. Geoarchaeology 14,377e399.
Pollefeys, M., Van Goold, L., Vergauwen, M., Conelis, K., Verbiest, F., Tops, J., 2003. 3Drecording for archaeological fieldwork. IEEE Computer Graphics Appl., 20e27.May/June 2003.
Peters, C., Batt, C.M., 2002. Dating and sourcing fuel ash residues from Cladh Hallan,South Uist, Scotland, using magnetic techniques. Phys. Chem. Earth Parts A/B/C27, 1349e1353.
Peters, C., Church, M.J., Coles, G., 2000. Mineral magnetism and archaeology atGalson on the Isle of Lewis, Scotland. Phys. Chem. Earth Part A: Solid EarthGeodesy 25, 455e460.
Peters, C., Thompson, R., 1999. Supermagnetic enhancement, superparamagnetism,and archaeological soils. Geoarchaeology 14, 401e413.
Peters, C., Thompson, R., Harrison, A., Church, M.J., 2002. Low temperature magneticcharacterisation of fire ash residues. Phys. Chem. Earth Parts A/B/C 27, 1355e1361.
Redfern, T., Kilfeather, E., 2004. A method for presenting high resolution archaeo-logical 3D scan data in narrative context. In: Proceeding of the 15th Interna-tional Workshop on Database and Expert Systems Applications (DEXA’04).
Walden, J., Oldfield, F., Smith, J., 1999. Environmental Magnetism: a Practical Guide.In: Quaternary Research Association Technical Guide, vol. 6.
Watts, I., 2010. The pigments from Pinnacle Point Cave 13B, Western Cape, SouthAfrica. J. Hum. Evol. 59 (3-4), 392e411.
Zlatanova, S., Alias, A.A., Rahman, A., Shi, W., 2004. Topological models andframeworks for 3D spatial objects. Comp. Geosci. 30, 419e428.
A.I.R. Herries, E.C. Fisher / Journal of Human Evolution 59 (2010) 306e320320