Embed Size (px)
Citation preview
Author's personal copy
Physics of the Earth and Planetary Interiors 177 (2009) 31–45
Contents lists available at ScienceDirect
Physics of the Earth and Planetary Interiors
journa l homepage: www.e lsev ier .com/ locate /pepi
Paleosecular variation models for ancient times: Clues fromKeweenawan lava flows
Lisa Tauxe a,∗, Kenneth P. Kodama b
a Scripps Institution of Oceanography, University of California, La Jolla, CA 92093-0220, United Statesb Lehigh University, Bethlehem, PA, United States
a r t i c l e i n f o
Article history:Received 24 February 2009Received in revised form 28 June 2009Accepted 1 July 2009
Keywords:Paleosecular variation modelsGeomagnetic field behaviorInclination error correctionOctupole contribution to time averagedfieldAsymmetric reversal behavior
a b s t r a c t
Statistical paleosecular variation models predict distributions of paleomagnetic vectors as a functionof geographic position. Such models have been used in a variety of applications that test whether agiven data set fairly represents the variability and average properties of the geomagnetic field. The simplerelationship between inclination of the geomagnetic field and latitude predicted by geocentric axial dipole(GAD) models has been a cornerstone for plate reconstructions for decades, yet many data sets exhibita tendency to be shallower than expected for a dominantly axial geocentric magnetic field. Too shallowinclinations have variously been interpreted as plate motion, permanent non-dipole field components orbias in inclination from sedimentary processes. Statistical PSV models could in principle be used to resolvethe cause of inclination anomalies because there is a simple relationship between the elongation of thedistribution of directions in the vertical plane and the average inclination. Shallowing of inclinationsfrom sedimentary processes results in a progressive transformation of the elongation direction in thevertical plane containing the average direction into a pronounced elongation in the plane perpendicularto that. However, the applicability of statistical models based on the last 5 million years for more ancienttimes is an open question. Here we present new data from the Keeweenawan North Shore Volcanics(∼1.1 Ga). These data are consistent with statistical PSV model predictions and are less well fit by modelsthat include a 20% axial octupole component. We also find evidence for a pervasive overprinting byhematite in a shallower direction and find support for the contention that the asymmetric reversal(s)observed in Keweenawan aged rocks along the North shore of Lake Superior can be explained as an ageprogression, with the reverse directions being older than the normal directions. Finally, we re-considerimplications from an analysis of inclinations from the Global Paleomagnetic Database for the Paleozoic andPre-Cambrian. We find that the data are inconsistent with a random sampling of any simple geomagneticfield model and conclude that the data set under-samples the field in a spatial sense.
© 2009 Elsevier B.V. All rights reserved.
1. Introduction
Statistical paleosecular variation (PSV) models for the geomag-netic field have been developed based on directional data fromlava flows erupted over the last 5 million years (e.g., Constableand Parker, 1988; Quidelleur and Courtillot, 1996; Constable andJohnson, 1999; Tauxe and Kent, 2004). These predict distributions ofpaleomagnetic vectors (and their transformations into virtual geo-magnetic poles and dipole moments) as a function of geographicposition. The simple relationship between inclination of the geo-magnetic field and latitude predicted by geocentric axial dipole(GAD) models has been a cornerstone for plate reconstructions fordecades, yet many data sets exhibit a tendency to be shallower
∗ Corresponding author. Tel.: +1 858 534 6084; fax: +1 858 534 0784.E-mail address: [email protected] (L. Tauxe).
than expected for a dominantly axial geocentric magnetic field.These “too shallow” inclinations have variously been interpretedas plate motion, permanent non-dipole field components or incli-nation error. A means of discriminating among these mechanismsis essential for resolving puzzles, such as the “snow-ball earth”hypothesis (which relies in part on shallow paleomagnetic direc-tions in direct association with sea-level glacial deposits, e.g., Sohlet al., 1999), a greater than expected frequency of shallow directionsat certain times (Kent and Smethurst, 1998) or in certain places (e.g.,Chauvin et al., 1996).
Statistical PSV models could in principle be used to assesswhether a given distribution of paleomagnetic directions are likelyto be geomagnetic in origin as opposed to one that has beendistorted by sedimentary processes. The models predict a sim-ple relationship between the elongation of the distribution ofdirections in the vertical plane and the average inclination. Shal-lowing of inclinations from sedimentary processes, on the other
0031-9201/$ – see front matter © 2009 Elsevier B.V. All rights reserved.doi:10.1016/j.pepi.2009.07.006
Author's personal copy
32 L. Tauxe, K.P. Kodama / Physics of the Earth and Planetary Interiors 177 (2009) 31–45
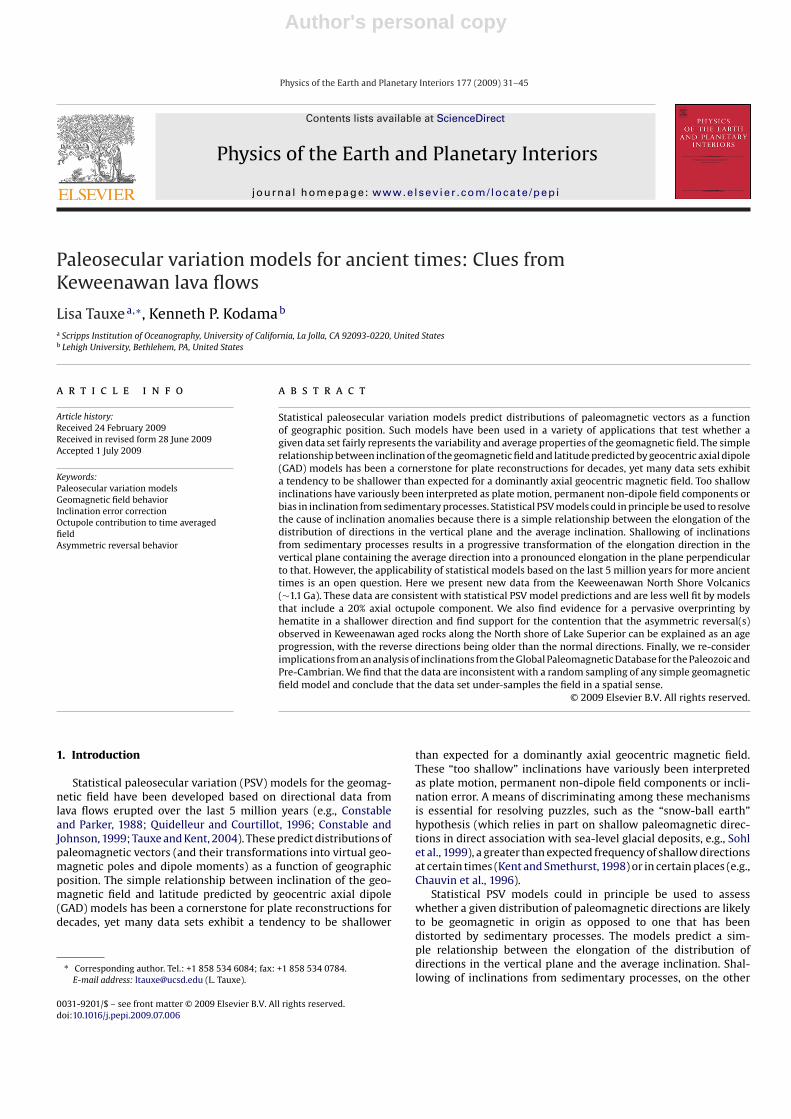
Fig. 1. (a) 100 directions drawn from the TK03.GAD field model (Tauxe and Kent, 2004; Tauxe et al., 2008) assuming a latitude of 30◦N. Circles are lower hemisphere andsquares are upper hemisphere. Note that the elongation direction (EDec) is parallel to the mean direction (Dec). (b) 100 directions drawn from the TK03.g30 model (averageoctupole was 20% of the dipole). (c) Directions from (a) subjected to the inclination shallowing formula with f = 0.5 (see text). Note that the elongation direction (EDec) isperpendicular to the mean direction (Dec).
hand transforms this vertical plane elongation progressively intoa pronounced horizontal elongation during which the elongationdirection EDec rotates from being parallel to the average directionand in the vertical plane to being perpendicular to that plane. Tauxeand Kent (2004) suggested that remanence directions could be“unflattened” using the empirical formula of (e.g., King, 1955) untilthe elongation and inclination agrees with the model prediction. InFig. 1a, we show 100 directions drawn from the TK03.GAD model ofTauxe and Kent (2004) (see also Tauxe et al., 2008) for a latitude of30◦. The mean inclination is 47◦, quite close to the GAD expectationof 49◦. The scatter in equivalent VGPs (Sp calculated with the cut-off procedure Vandamme and Courtillot, 1992, as in McElhinny andMcFadden, 1997) is 12.514
11. This is consistent with the prediction of14◦ from Model G of McElhinny and McFadden (1997) which wastuned to the same data set as TK03.GAD. The distribution of direc-tions is somewhat elongate (E∼ 1.8 as defined by Tauxe and Kent,2004), with the elongation direction (EDec) in the vertical plane par-allel to the average direction. In fact, TK03.GAD and similar models(e.g., CJ98 of Constable and Johnson, 1999, and QC96 of Quidelleurand Courtillot, 1996) predict that elongation varies inversely withinclination. Moreover, Tauxe et al. (2008) showed that the elon-gation/inclination trend is fairly robustly determined for the last 5million years and is not strongly dependent on the exact (GAD) fieldmodel chosen.
Interrogating the TK03 field model with a non-zero axial octupo-lar contribution of 20%, generates sets of directions like those shownin Fig. 1b. The mean inclination of 32.6◦ is much shallower than theGAD expectation and the distribution of directions is more elon-gate (E∼3.1). Importantly however, EDec is still in the vertical planeparallel to the average direction.
On the other hand, distributions of directions that exhibitsedimentary inclination error are profoundly different than anystatistical PSV model. The King function (King, 1955) for inclina-tion shallowing transforms the inclination of the applied magneticfield (If ) to the observed inclination (Io) by: tan Io = f tan If ) wheref is an empirical parameter ranging from 1.0 (no flattening) to 0.0(complete flattening). The directions drawn from the TK03.GADfield model in Fig. 1a transform to those shown in Fig. 1c (assum-ing f = 0.5). While these directions have a shallow bias (I = 29.1)equivalent to that resulting from g0
3 of 20%, the elongation directionis perpendicular to the average direction, markedly different fromthe non-GAD predictions.
If statistical PSV models accurately predict distributions of direc-tions for ancient times, such models can be used to discriminatebetween the different hypotheses for shallow inclination bias. This
approach has been successfully carried out on data ranging fromthe Triassic to the present (e.g., Tauxe and Kent, 2004; Krijgsmanand Tauxe, 2004; Kent and Tauxe, 2005; Tauxe, 2005; Tauxe et al.,2008). However, the PSV models used are based on compilations ofpaleomagnetic data for the last 5 million years and may not applyin ancient times (see discussion in Merrill et al., 1996). A quick testof the model predictions requires a large set of paleomagnetic datadirections (∼100) for which paleohorizontal is well constrained andplate motion over the time span of observation can be neglected.The elongation and average inclination of the data set can then becompared with the predicted trend.
Tauxe et al. (2008) compiled published data from large igneousprovinces (LIPs) to address the issue of how far back in timethe E /I predicted trend was valid. All LIP data sets had elonga-tion/inclination pairs that were consistent with the PSV modelpredictions but the oldest LIP with suitable data was the Paranámagmatic province, of early Cretacous age. To test the applicabil-ity of E /I trends derived from PSV models to the Pre-Cambrian, werequire a set of paleomagnetic directions that faithfully recordedthe geomagnetic field vector whose paleohorizontal is well con-strained. The data set must also sample a period of time sufficientto characterize PSV, but short enough to exclude the effects of platemotion (∼ 5 million years). The mid-continental rift of North Amer-ica has abundant lava flows of Keweenawan age (∼1 Ga) whosesimple stratigraphy allow adequate assessment of paleo-horizontal.In this paper, we present new data from a study of the North ShoreVolcanics along the shores of Lake Superior in Minnesota. We usethese data to address the problem of elongation/inclination trendsof PSV for the Keweenawan.
2. Geology and sampling
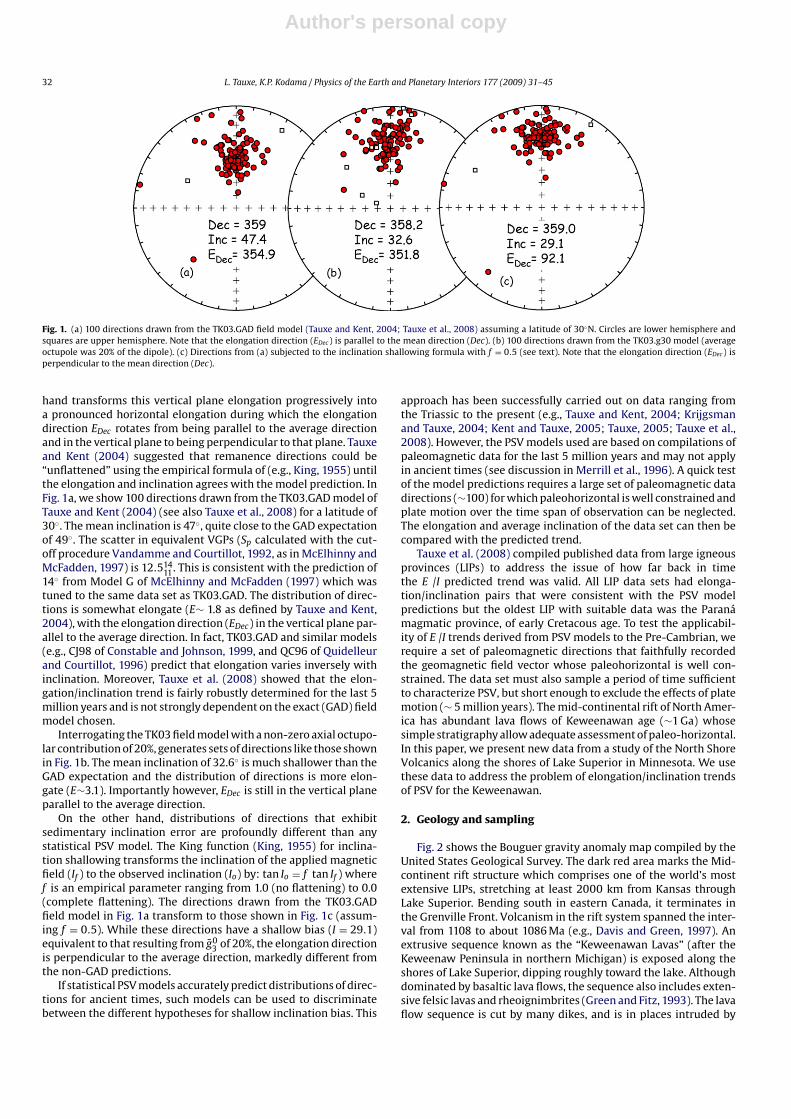
Fig. 2 shows the Bouguer gravity anomaly map compiled by theUnited States Geological Survey. The dark red area marks the Mid-continent rift structure which comprises one of the world’s mostextensive LIPs, stretching at least 2000 km from Kansas throughLake Superior. Bending south in eastern Canada, it terminates inthe Grenville Front. Volcanism in the rift system spanned the inter-val from 1108 to about 1086 Ma (e.g., Davis and Green, 1997). Anextrusive sequence known as the “Keweenawan Lavas” (after theKeweenaw Peninsula in northern Michigan) is exposed along theshores of Lake Superior, dipping roughly toward the lake. Althoughdominated by basaltic lava flows, the sequence also includes exten-sive felsic lavas and rheoignimbrites (Green and Fitz, 1993). The lavaflow sequence is cut by many dikes, and is in places intruded by
Author's personal copy
L. Tauxe, K.P. Kodama / Physics of the Earth and Planetary Interiors 177 (2009) 31–45 33
Fig. 2. Locations of studies on Keweenawan lavas (see Table 1). Basemap is gravity anomaly map modified from: http://www.geo.umn.edu/mgs/nicegeo/pdfs/boug grav.pdfcompiled by David L. Daniels and Stephen L. Snyder of the U.S.G.S. (For interpretation of the references to color in this figure legend, the reader is referred to the web versionof the article.)
small granophyres (see, e.g., Vervoort et al., 2007). In Minnesota,the Midcontinent Rift lavas are in close association with extensiveplutonic complexes that in places intrude into the lava sequences(see Fig. 2).
The Keweenawan lavas have been the subject of paleomagneticand geochronologic study for decades (see Fig. 2 and Table 1). Sincethe comprehensive review by Halls and Pesonen (1982), there havebeen new studies, the most recent of which is the work of Hnat et al.(2006) on the Portage Lake Volcanics. This study showed that care-ful step-wise demagnetization of multiple specimens per lava flowwas necessary to identify the primary component in the somewhataltered rocks, a procedure that was not done routinely in the ear-lier work. While of excellent quality, there were only 9 site meansbased on magnetite characteristic components available from thePortage Lake flows and additional data are necessary for testing thepaleosecular variation model. We report here the results of a newstudy on the sequence of Keweenawan lava flows exposed along theNorth shore of Lake Superior between Duluth and Grand Portage inMinnesota, the so-called “North Shore Volcanics” in Table 1 andFig. 3.
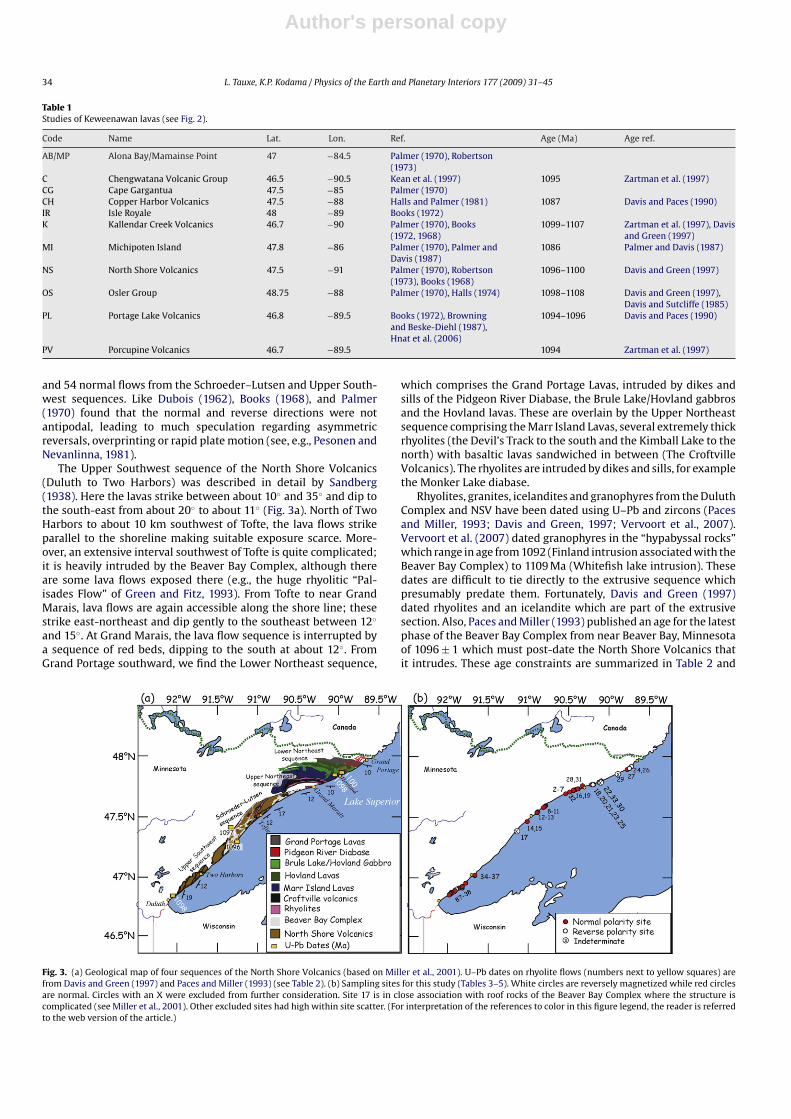
Miller et al. (2001) mapped four main sequences of basalticlavas as shown in Fig. 3a: the Upper Southwest sequence, theSchroeder–Lutsen sequence, and the Upper and Lower Northeastsequences. The basaltic lavas of the North Shore Volcanics (NSV)have distinctive amygdaloidal flow tops in which are secondaryminerals including the abundant agates that can be found in suchplaces as “Agate Bay”. There are numerous rhyolites, particularlyin the Upper Northeast sequence, the thickest of which are shownin the map. The North Shore Volcanic sequences are intruded bydiabase dikes and sills (e.g., Beaver Bay Complex and the PidgeonRiver Diabase) and gabbros (e.g., the Brule Lake/Hovland Gabbro).The oldest flows are thought to be in the Lower Northeast sequencewhich are overlain by the Upper Northeast sequence. The youngestflows are in the Schroeder–Lutsen sequence. However, the exactage relationship between the Upper Southwest and the UpperNortheast sequences is not known exactly, but they appear to beapproximately co-eval.
All four sequences have been sampled paleomagnetically byBooks (1968, 1972) and Palmer (1970). Palmer (1970) documented14 reversely magnetized “flows” in the Lower Northeast sequence
Author's personal copy
34 L. Tauxe, K.P. Kodama / Physics of the Earth and Planetary Interiors 177 (2009) 31–45
Table 1Studies of Keweenawan lavas (see Fig. 2).
Code Name Lat. Lon. Ref. Age (Ma) Age ref.
AB/MP Alona Bay/Mamainse Point 47 −84.5 Palmer (1970), Robertson(1973)
C Chengwatana Volcanic Group 46.5 −90.5 Kean et al. (1997) 1095 Zartman et al. (1997)CG Cape Gargantua 47.5 −85 Palmer (1970)CH Copper Harbor Volcanics 47.5 −88 Halls and Palmer (1981) 1087 Davis and Paces (1990)IR Isle Royale 48 −89 Books (1972)K Kallendar Creek Volcanics 46.7 −90 Palmer (1970), Books
(1972, 1968)1099–1107 Zartman et al. (1997), Davis
and Green (1997)MI Michipoten Island 47.8 −86 Palmer (1970), Palmer and
Davis (1987)1086 Palmer and Davis (1987)
NS North Shore Volcanics 47.5 −91 Palmer (1970), Robertson(1973), Books (1968)
1096–1100 Davis and Green (1997)
OS Osler Group 48.75 −88 Palmer (1970), Halls (1974) 1098–1108 Davis and Green (1997),Davis and Sutcliffe (1985)
PL Portage Lake Volcanics 46.8 −89.5 Books (1972), Browningand Beske-Diehl (1987),Hnat et al. (2006)
1094–1096 Davis and Paces (1990)
PV Porcupine Volcanics 46.7 −89.5 1094 Zartman et al. (1997)
and 54 normal flows from the Schroeder–Lutsen and Upper South-west sequences. Like Dubois (1962), Books (1968), and Palmer(1970) found that the normal and reverse directions were notantipodal, leading to much speculation regarding asymmetricreversals, overprinting or rapid plate motion (see, e.g., Pesonen andNevanlinna, 1981).
The Upper Southwest sequence of the North Shore Volcanics(Duluth to Two Harbors) was described in detail by Sandberg(1938). Here the lavas strike between about 10◦ and 35◦ and dip tothe south-east from about 20◦ to about 11◦ (Fig. 3a). North of TwoHarbors to about 10 km southwest of Tofte, the lava flows strikeparallel to the shoreline making suitable exposure scarce. More-over, an extensive interval southwest of Tofte is quite complicated;it is heavily intruded by the Beaver Bay Complex, although thereare some lava flows exposed there (e.g., the huge rhyolitic “Pal-isades Flow” of Green and Fitz, 1993). From Tofte to near GrandMarais, lava flows are again accessible along the shore line; thesestrike east-northeast and dip gently to the southeast between 12◦
and 15◦. At Grand Marais, the lava flow sequence is interrupted bya sequence of red beds, dipping to the south at about 12◦. FromGrand Portage southward, we find the Lower Northeast sequence,
which comprises the Grand Portage Lavas, intruded by dikes andsills of the Pidgeon River Diabase, the Brule Lake/Hovland gabbrosand the Hovland lavas. These are overlain by the Upper Northeastsequence comprising the Marr Island Lavas, several extremely thickrhyolites (the Devil’s Track to the south and the Kimball Lake to thenorth) with basaltic lavas sandwiched in between (The CroftvilleVolcanics). The rhyolites are intruded by dikes and sills, for examplethe Monker Lake diabase.
Rhyolites, granites, icelandites and granophyres from the DuluthComplex and NSV have been dated using U–Pb and zircons (Pacesand Miller, 1993; Davis and Green, 1997; Vervoort et al., 2007).Vervoort et al. (2007) dated granophyres in the “hypabyssal rocks”which range in age from 1092 (Finland intrusion associated with theBeaver Bay Complex) to 1109 Ma (Whitefish lake intrusion). Thesedates are difficult to tie directly to the extrusive sequence whichpresumably predate them. Fortunately, Davis and Green (1997)dated rhyolites and an icelandite which are part of the extrusivesection. Also, Paces and Miller (1993) published an age for the latestphase of the Beaver Bay Complex from near Beaver Bay, Minnesotaof 1096 ± 1 which must post-date the North Shore Volcanics thatit intrudes. These age constraints are summarized in Table 2 and
Fig. 3. (a) Geological map of four sequences of the North Shore Volcanics (based on Miller et al., 2001). U–Pb dates on rhyolite flows (numbers next to yellow squares) arefrom Davis and Green (1997) and Paces and Miller (1993) (see Table 2). (b) Sampling sites for this study (Tables 3–5). White circles are reversely magnetized while red circlesare normal. Circles with an X were excluded from further consideration. Site 17 is in close association with roof rocks of the Beaver Bay Complex where the structure iscomplicated (see Miller et al., 2001). Other excluded sites had high within site scatter. (For interpretation of the references to color in this figure legend, the reader is referredto the web version of the article.)
Author's personal copy
L. Tauxe, K.P. Kodama / Physics of the Earth and Planetary Interiors 177 (2009) 31–45 35
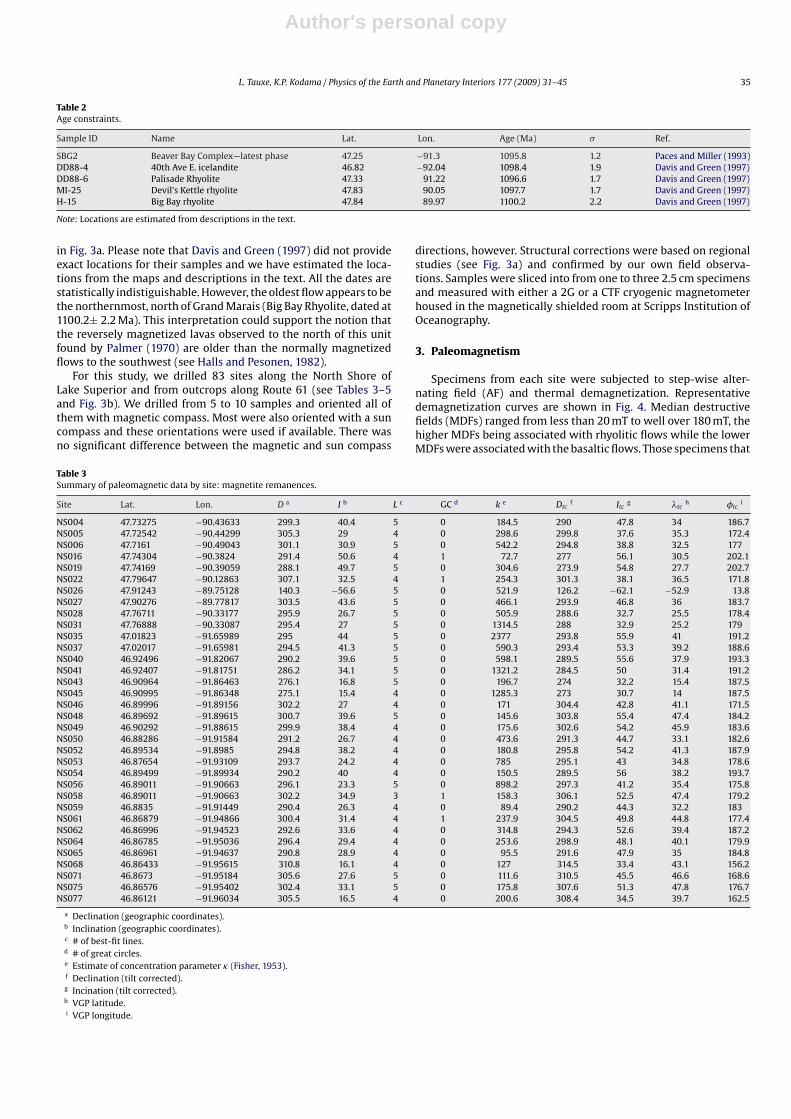
Table 2Age constraints.
Sample ID Name Lat. Lon. Age (Ma) � Ref.
SBG2 Beaver Bay Complex—latest phase 47.25 −91.3 1095.8 1.2 Paces and Miller (1993)DD88-4 40th Ave E. icelandite 46.82 −92.04 1098.4 1.9 Davis and Green (1997)DD88-6 Palisade Rhyolite 47.33 91.22 1096.6 1.7 Davis and Green (1997)MI-25 Devil’s Kettle rhyolite 47.83 90.05 1097.7 1.7 Davis and Green (1997)H-15 Big Bay rhyolite 47.84 89.97 1100.2 2.2 Davis and Green (1997)
Note: Locations are estimated from descriptions in the text.
in Fig. 3a. Please note that Davis and Green (1997) did not provideexact locations for their samples and we have estimated the loca-tions from the maps and descriptions in the text. All the dates arestatistically indistiguishable. However, the oldest flow appears to bethe northernmost, north of Grand Marais (Big Bay Rhyolite, dated at1100.2± 2.2 Ma). This interpretation could support the notion thatthe reversely magnetized lavas observed to the north of this unitfound by Palmer (1970) are older than the normally magnetizedflows to the southwest (see Halls and Pesonen, 1982).
For this study, we drilled 83 sites along the North Shore ofLake Superior and from outcrops along Route 61 (see Tables 3–5and Fig. 3b). We drilled from 5 to 10 samples and oriented all ofthem with magnetic compass. Most were also oriented with a suncompass and these orientations were used if available. There wasno significant difference between the magnetic and sun compass
directions, however. Structural corrections were based on regionalstudies (see Fig. 3a) and confirmed by our own field observa-tions. Samples were sliced into from one to three 2.5 cm specimensand measured with either a 2G or a CTF cryogenic magnetometerhoused in the magnetically shielded room at Scripps Institution ofOceanography.
3. Paleomagnetism
Specimens from each site were subjected to step-wise alter-nating field (AF) and thermal demagnetization. Representativedemagnetization curves are shown in Fig. 4. Median destructivefields (MDFs) ranged from less than 20 mT to well over 180 mT, thehigher MDFs being associated with rhyolitic flows while the lowerMDFs were associated with the basaltic flows. Those specimens that
Table 3Summary of paleomagnetic data by site: magnetite remanences.
Site Lat. Lon. D a I b L c GC d k e Dtcf Itc g �tc
h �tci
NS004 47.73275 −90.43633 299.3 40.4 5 0 184.5 290 47.8 34 186.7NS005 47.72542 −90.44299 305.3 29 4 0 298.6 299.8 37.6 35.3 172.4NS006 47.7161 −90.49043 301.1 30.9 5 0 542.2 294.8 38.8 32.5 177NS016 47.74304 −90.3824 291.4 50.6 4 1 72.7 277 56.1 30.5 202.1NS019 47.74169 −90.39059 288.1 49.7 5 0 304.6 273.9 54.8 27.7 202.7NS022 47.79647 −90.12863 307.1 32.5 4 1 254.3 301.3 38.1 36.5 171.8NS026 47.91243 −89.75128 140.3 −56.6 5 0 521.9 126.2 −62.1 −52.9 13.8NS027 47.90276 −89.77817 303.5 43.6 5 0 466.1 293.9 46.8 36 183.7NS028 47.76711 −90.33177 295.9 26.7 5 0 505.9 288.6 32.7 25.5 178.4NS031 47.76888 −90.33087 295.4 27 5 0 1314.5 288 32.9 25.2 179NS035 47.01823 −91.65989 295 44 5 0 2377 293.8 55.9 41 191.2NS037 47.02017 −91.65981 294.5 41.3 5 0 590.3 293.4 53.3 39.2 188.6NS040 46.92496 −91.82067 290.2 39.6 5 0 598.1 289.5 55.6 37.9 193.3NS041 46.92407 −91.81751 286.2 34.1 5 0 1321.2 284.5 50 31.4 191.2NS043 46.90964 −91.86463 276.1 16.8 5 0 196.7 274 32.2 15.4 187.5NS045 46.90995 −91.86348 275.1 15.4 4 0 1285.3 273 30.7 14 187.5NS046 46.89996 −91.89156 302.2 27 4 0 171 304.4 42.8 41.1 171.5NS048 46.89692 −91.89615 300.7 39.6 5 0 145.6 303.8 55.4 47.4 184.2NS049 46.90292 −91.88615 299.9 38.4 4 0 175.6 302.6 54.2 45.9 183.6NS050 46.88286 −91.91584 291.2 26.7 4 0 473.6 291.3 44.7 33.1 182.6NS052 46.89534 −91.8985 294.8 38.2 4 0 180.8 295.8 54.2 41.3 187.9NS053 46.87654 −91.93109 293.7 24.2 4 0 785 295.1 43 34.8 178.6NS054 46.89499 −91.89934 290.2 40 4 0 150.5 289.5 56 38.2 193.7NS056 46.89011 −91.90663 296.1 23.3 5 0 898.2 297.3 41.2 35.4 175.8NS058 46.89011 −91.90663 302.2 34.9 3 1 158.3 306.1 52.5 47.4 179.2NS059 46.8835 −91.91449 290.4 26.3 4 0 89.4 290.2 44.3 32.2 183NS061 46.86879 −91.94866 300.4 31.4 4 1 237.9 304.5 49.8 44.8 177.4NS062 46.86996 −91.94523 292.6 33.6 4 0 314.8 294.3 52.6 39.4 187.2NS064 46.86785 −91.95036 296.4 29.4 4 0 253.6 298.9 48.1 40.1 179.9NS065 46.86961 −91.94637 290.8 28.9 4 0 95.5 291.6 47.9 35 184.8NS068 46.86433 −91.95615 310.8 16.1 4 0 127 314.5 33.4 43.1 156.2NS071 46.8673 −91.95184 305.6 27.6 5 0 111.6 310.5 45.5 46.6 168.6NS075 46.86576 −91.95402 302.4 33.1 5 0 175.8 307.6 51.3 47.8 176.7NS077 46.86121 −91.96034 305.5 16.5 4 0 200.6 308.4 34.5 39.7 162.5
a Declination (geographic coordinates).b Inclination (geographic coordinates).c # of best-fit lines.d # of great circles.e Estimate of concentration parameter � (Fisher, 1953).f Declination (tilt corrected).g Incination (tilt corrected).h VGP latitude.i VGP longitude.
Author's personal copy
36 L. Tauxe, K.P. Kodama / Physics of the Earth and Planetary Interiors 177 (2009) 31–45
Table 4Summary of paleomagnetic data by site: hematite remanences. Superscripts for column headings same as Table 3.
Site Lat. Lon. Da Ib Lc GCd ke Dtcf Itc g �tc
h �tci
NS002 47.73415 −90.42919 291 32.6 4 0 191.1 283.5 38.7 24.9 185.2NS006 47.7161 −90.49043 301.1 30.4 5 0 657 294.9 38.4 32.4 176.7NS007 47.70123 −90.53907 307.4 31.8 5 0 173.2 301.5 40.6 37.9 172.9NS008 47.60108 −90.78655 313.9 34 5 0 255.1 309.4 44.7 45.3 169.3NS009 47.59789 −90.7915 291.5 41.6 4 0 400.8 281.9 49 29.3 192.7NS010 47.59411 −90.79729 292.3 31.7 5 0 280.5 285.7 39.5 26.7 183.8NS011 47.58531 −90.81521 293.8 19 5 0 249.8 290.1 27.2 24.1 174.3NS012 47.54605 −90.89361 288.8 32.5 4 0 97.1 282.5 41.2 25.4 187NS013 47.55097 −90.88284 290.5 29.2 4 0 444.3 285.2 38.2 25.8 183.4NS014 47.46915 −91.01428 277.7 23.9 5 0 1478.5 272.8 31.7 14.4 188.8NS015 47.46923 −91.0137 294.5 16.4 4 0 350.8 292 26.6 25.1 172.4NS018 47.77667 −90.2093 312.6 5.5 5 0 71 311.4 12.2 31.4 150.7NS020 47.77857 −90.19072 303.8 7.2 5 0 160.3 302.3 12.7 26.1 159.1NS021 47.77705 −90.2205 311.6 21 5 0 903 308.1 27.5 36 160.1NS023 47.77633 −90.20105 305.6 14 5 0 1001.5 303.1 19.6 29.4 161NS024 47.92843 −89.72541 147.1 −69.7 4 0 462.2 120.2 −75.5 −54.5 47.1NS034 47.01668 −91.66029 299.5 42.2 5 0 260.3 299.7 54.2 44 185.6NS036 47.01631 −91.66031 297.5 42.6 3 1 197 297 54.6 42.4 187.7NS039 46.95296 −91.77558 288.8 21.2 5 0 1425.8 287.6 33 25 178.3NS044 46.91107 −91.86044 289.7 28.5 4 0 344 289.2 44.5 31.6 183.9NS055 46.87575 −91.95249 284.3 17.7 5 0 390.5 283.6 36.7 23.9 182.9NS060 46.86945 −91.94685 292.6 26.4 5 0 110 293.9 45.3 35.2 181.2NS066 46.86674 −91.9526 313 19.7 4 0 1062.2 317.6 36.6 46.7 155.1NS067 46.87085 −91.94296 287.5 28.6 4 0 299.2 287.4 47.6 32 187.3NS078 46.85303 −91.97804 279.2 16.1 5 0 238.4 277.7 34.8 19 186.1NS079 46.85781 −91.96647 285.7 30.5 1 3 963.9 285 49.5 31.4 190.4NS080 46.8525 −91.97929 286.4 19.8 5 0 141.3 286 38.8 26.6 182.4NS081 46.85641 −91.9705 277.2 32.9 5 0 115 273.3 51.4 24.9 199.2NS083 46.85339 −91.97727 286.8 39.4 4 0 143.3 286.3 58.4 37.5 198.1NS085 46.8528 −91.97874 280.5 19.3 5 0 383.7 279 38.1 21.5 186.9NS087 46.85188 −91.98035 281.9 20 5 0 223.4 280.7 38.9 23 186.2
failed to reach their MDF with AF treatment (e.g., heavy red linein Fig. 4a) were subsequently treated to thermal demagnetization(e.g., heavy solid line in Fig. 4b). These all had blocking temperaturesnear 680 ◦ suggesting a hematite carrier. The blocking temperaturefrom all lava flows ranged from just under 600◦ to just under 700◦.
A total of 235 specimens had less than 10% remanence remain-ing after demagnetization to 180 mT or at 600◦. These we interpretas being dominated by magnetite. Examples of this type of behav-ior are shown in Fig. 5a and b for AF and thermal demagnetization,respectively. A further 196 specimens had more than 10% of theNRM remaining after treatment to these steps. These we considersignificantly or completely contaminated by hematite. Examples ofthese are shown in Fig. 5c and d for AF and thermal demagnetiza-tion, respectively.
Regardless of remanence carrier, most sites were characterizedby simple demagnetization behavior and excellent agreement ofdirections among the samples from the site (see Tables 3–5). Best-
fit lines and maximum angle of deviation (MAD) were calculatedthrough demagnetization data trending to the origin (insets toFig. 5a–d using the method of Kirschvink (1980). Six sites had oneor more specimen(s) whose demagnetization data was best inter-preted as a great circle (see, e.g., Fig. 5e and f).
Average directions and cones of 95% confidence from directionswith MADs ≤ 10◦ from sites with only directed lines were calculatedusing the statistics of Fisher (1953). Data from sites with one or moregreat circle fits were combined using the method of McFadden andMcElhinny (1988). All site means are listed in Tables 3–5.
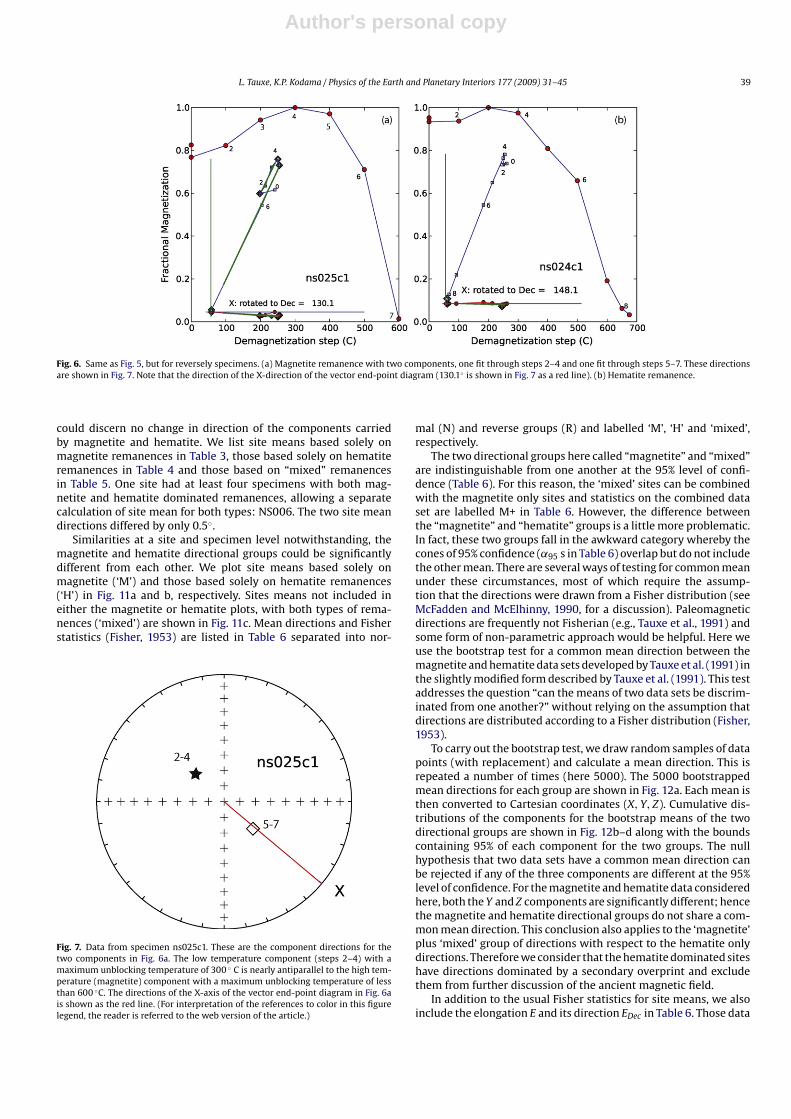
Three sites had characteristic directions that were southeastand steeply up. These we interpret as being reversely magnetized.Examples of demagnetization behavior from representative spec-imens from these sites are shown in Fig. 6. The demagnetizationdata shown in Fig. 6a can be fit by two distinct components, alow-temperature component with a maximum unblocking tem-perature of about 300 ◦C (demagnetization step 4 in the diagram)
Table 5Summary of paleomagnetic data by site: mixed remanences. Superscripts for column headings same as Table 3.
Site Lat. Lon. Da Ib Lc GCd ke Dtcf Itc g �tc
h �tci
ns003 47.7371 −90.4114 296.7 41 5 0 414.1 286.9 47.9 32 188.9ns017 47.3892 −91.1385 16.4 49.9 4 0 259.7 – – – –ns025 47.7763 −90.2011 133.9 −64 5 0 53.3 114.3 −69.7 −49.4 33.3ns030 47.799 −90.1056 295.1 30.2 5 0 395.1 289.2 33.9 26.4 178.8ns032 47.7319 −90.4429 293.4 33 5 0 285.9 286 39.7 27.1 184ns038 46.9541 −91.7732 287.1 17.5 5 0 104.2 286 29.2 22.2 177.6ns042 46.9105 −91.8175 291.6 27.1 5 0 104.5 291.6 43 32.4 181.2ns047 46.9016 −91.8885 306.5 40.5 5 0 496.7 311.7 55.9 53.1 179.6ns051 46.885 −91.912 292.9 24 5 0 224.5 293.3 42 33.1 179.3ns057 46.8745 −91.9343 287.8 10.6 5 0 2270.1 287.7 29.6 23.5 176.4ns063 46.8691 −91.9477 298 15.3 4 1 290.3 299.6 33.9 33.5 169.5ns072 46.8584 −91.9653 290.5 35.2 2 3 236.1 291.5 54.2 38.4 190.6ns073 46.8658 −91.954 305.4 16.5 4 0 82.1 308.4 34.5 39.7 162.5ns074 46.8574 −91.9673 289.6 37.7 1 4 51.5 290.3 56.7 39.1 193.9
Author's personal copy
L. Tauxe, K.P. Kodama / Physics of the Earth and Planetary Interiors 177 (2009) 31–45 37
Fig. 4. Demagnetization behavior of representative North Shore specimens. Specimens with initial demagnetization steps of 100◦ (e.g., heavy solid line) had been demagnetizedwith AF to 180 mT (see heavy solid line in diagram to left) prior to thermal demagnetization. Specimens whose treatment stopped below 600◦ (e.g., heavy dashed line) explodedduring thermal treatment.
and a high temperature component (steps 5–7) with a maximumunblocking temperature of less than 600 ◦C. These two directionsare approximately antipodal (see Fig. 7) and the low-temperaturecomponent does not appear to be a present field overprint.Rather, it appears to be an overprint in a northwesterly and downdirection.
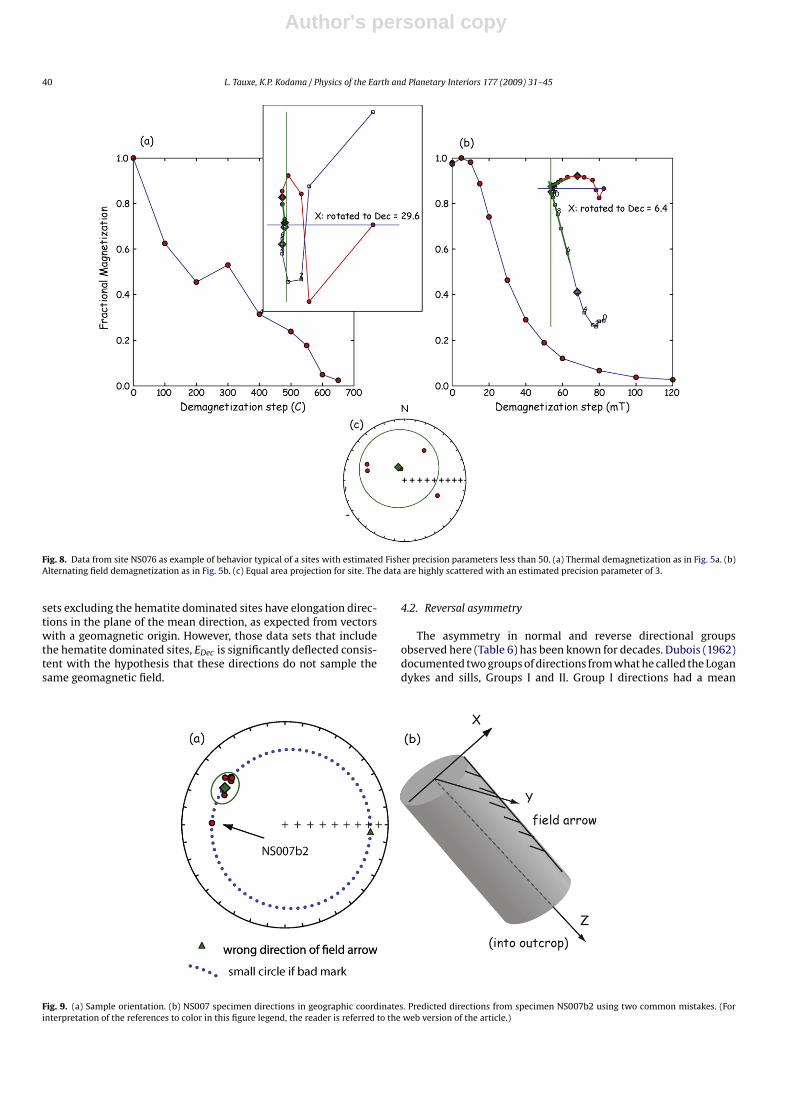
Four sites behaved in an erratic fashion (see, e.g., Fig. 8). Thesehad multiple components on demagnetization and poor within siteconsistency among specimen directions. No usable results wereobtained from such sites. In addition to these poorly behaved sites,NS017 was taken just south of Little Marais in the Schroeder–Lutsensequence (Fig. 3a). The outcrop is very near clearly overturned lavasthat form the roof of the Beaver Bay Complex and its structuralcorrection is difficult to constrain. We eliminate it from furtherconsideration here.
A few sites had well clustered directions, with the exception of asingle sample whose direction was displaced from the others (seespecimen NS007b2 in Fig. 9a). There are several mistakes that occuroccasionally in the field that can lead to misoriented directions.Many paleomagnetists simply throw out such deviant directionswithout further justification, a practice we find troubling. Instead,we follow Lawrence et al. (2009) who pointed out that the vari-ous common sources of misorientation in the field can be tested.For example, there are frequently stray marks on the sample whichcan be misinterpreted as being the orientation mark. Such a mis-take would misorient specimen directions along a small circle aboutthe specimen’s “Z” direction (see Fig. 9b). The small circle of pos-sible directions for specimen NS007b2 is shown as a dotted blueline in Fig. 9a. If the drill direction arrow were drawn in the wrong
direction (out of the outcrop instead of in the direction of drill),the specimen direction would be the triangle in Fig. 9a. In the caseshown here, it is quite plausible that a stray mark on sample NS007bwas misinterpreted as the field arrow and the direction from thespecimen from this sample (NS007b2) was discarded. Directionsfrom a total of 15 samples were flagged as having “bad” orienta-tions in this manner and were excluded from their respective sitemeans.
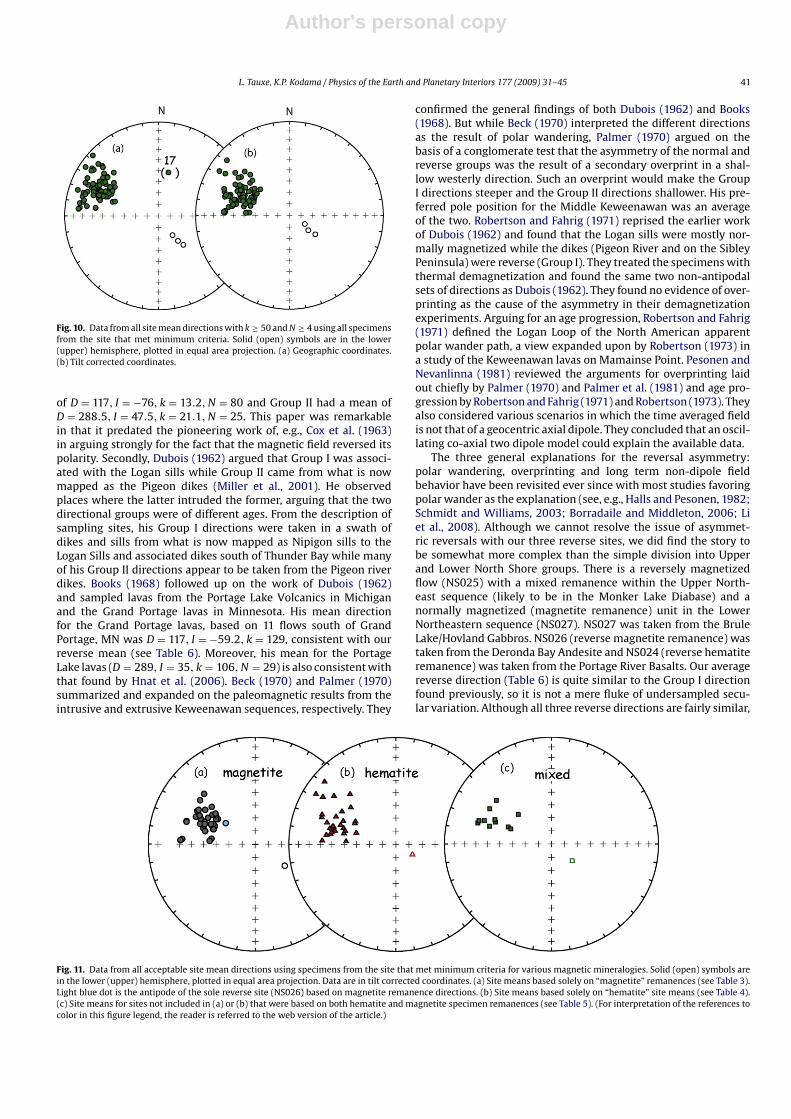
There are a total of 78 sites with at least four specimen direc-tions or great circles (with MAD angles ≤ 10◦) that had within siteFisher concentration statistics (k) of ≥50. We plot the directions ofthese in geographic coordinates in Fig. 10a and in tilt corrected coor-dinates in Fig. 10b. Structural corrections were taken from Milleret al. (2001). NS017 is shown in parentheses. The mean directionfor the 74 (normal) sites (excluding NS017) meeting minimum cri-teria from the North Shore Volcanics is D = 293, I = 43 (see ‘N’record labelled ‘all’ in Table 6 for details) and is similar to thatpublished by Halls and Pesonen (1982). Also, we recovered threesites (NS024-NS026) that were reversely magnetized. As was notedby Palmer (1970) and others, these have directions that are steeperthan the normal group (D = 121, I = −69, see ‘R’ record labelled ‘all’in Table 6), an observation that led to much speculation about rever-sal asymmetry in the Keweenawan (e.g., Pesonen and Nevanlinna,1981).
All of the data from this study have been uploaded into the MagICdatabase, including measurements, orientations, field photos andinterpretations. The complete data set is available for downloadingfrom earthref.org at this persistent link: http://earthref.org/cgi-bin/magic.cgi?mdt=m000629dt20090622093943.
Table 6Summary statistics for various data sets.
Polarity Component D I N R k ˛95 E EDec
N All 293.0 42.8 74 72.1011 38.4 2.7 1.61 307.0R All 120.9 -69.1 3 2.9850 133.0 10.7 – 315.2N M 294.7 46.7 32 31.4047 52.1 3.6 1.13 264.3N Mixed 293.2 42.0 12 11.7683 47.5 6.4 2.9 276.4N M+ 294.3 45.4 44 43.1432 50.2 3.1 1.52 274.2N H 291.4 39.0 30 29.0799 31.5 4.8 2.27 335.4
Components: M: magnetite; mixed: sites with directions based on magnetite and hematite specimen directions; H: hematite. M+ is magnetite plus mixed; D: mean declination;I: mean inclination; N: number of specimens; R: resultant vector length; k: Fisher’s concentration statistic; ˛95: Fisher’s cone of 95% confidence (both from Fisher, 1953); E:elongation; EDec: elongation direction (both from Tauxe and Kent, 2004).
Author's personal copy
38 L. Tauxe, K.P. Kodama / Physics of the Earth and Planetary Interiors 177 (2009) 31–45
Fig. 5. Demagnetization behavior from representative specimens from the North Shore Volcanics. Left (right) hand panels are alternating field (thermal) demagnetization.Numbers are the demagnetization step numbers (0 is the natural remanence). Insets to (a)–(d) are vector endpoint diagrams (with horizontal X-axis rotated to specifiedangle). Circles are horizontal projection X, Y and squares are in the X, Z plane. (a and b) Less than 10% of the remanence remains after demagnetization to 180 mT (a) or 600 ◦
C (b), these specimens are classified as a “magnetite” remanence. (c and d) More than 10% of the remanence remains after demagnetization to 180 mT (c) and 600 ◦ C (d) sothese specimens are classified as “hematite” remanences. Data shown in insets to (a)–(d) allow a simple best-fit line to be calculated to fine the characteristic direction. (eand f) Insets are equal area projections for demagnetization data with great circle fits shown as dotted lines (lower hemisphere projections).
4. Discussion
4.1. Origin and age of the magnetic remanence
As already mentioned, many of the specimens have remanencesthat are dominated by a magnetic carrier at a higher oxidation
state than pure magnetite (here called loosely “hematite”). Herewe consider the possible effect of secondary overprinting on ourKeweenawan results. Many sites have both types of specimens andmany specimens exhibit a drop in remanence between 550 and600◦ (typical of magnetite) but continue to demagnetize up tobetween 650 and 700◦ (typical of hematite). In these cases, we
Author's personal copy
L. Tauxe, K.P. Kodama / Physics of the Earth and Planetary Interiors 177 (2009) 31–45 39
Fig. 6. Same as Fig. 5, but for reversely specimens. (a) Magnetite remanence with two components, one fit through steps 2–4 and one fit through steps 5–7. These directionsare shown in Fig. 7. Note that the direction of the X-direction of the vector end-point diagram (130.1◦ is shown in Fig. 7 as a red line). (b) Hematite remanence.
could discern no change in direction of the components carriedby magnetite and hematite. We list site means based solely onmagnetite remanences in Table 3, those based solely on hematiteremanences in Table 4 and those based on “mixed” remanencesin Table 5. One site had at least four specimens with both mag-netite and hematite dominated remanences, allowing a separatecalculation of site mean for both types: NS006. The two site meandirections differed by only 0.5◦.
Similarities at a site and specimen level notwithstanding, themagnetite and hematite directional groups could be significantlydifferent from each other. We plot site means based solely onmagnetite (‘M’) and those based solely on hematite remanences(‘H’) in Fig. 11a and b, respectively. Sites means not included ineither the magnetite or hematite plots, with both types of rema-nences (‘mixed’) are shown in Fig. 11c. Mean directions and Fisherstatistics (Fisher, 1953) are listed in Table 6 separated into nor-
Fig. 7. Data from specimen ns025c1. These are the component directions for thetwo components in Fig. 6a. The low temperature component (steps 2–4) with amaximum unblocking temperature of 300 ◦ C is nearly antiparallel to the high tem-perature (magnetite) component with a maximum unblocking temperature of lessthan 600 ◦C. The directions of the X-axis of the vector end-point diagram in Fig. 6ais shown as the red line. (For interpretation of the references to color in this figurelegend, the reader is referred to the web version of the article.)
mal (N) and reverse groups (R) and labelled ‘M’, ‘H’ and ‘mixed’,respectively.
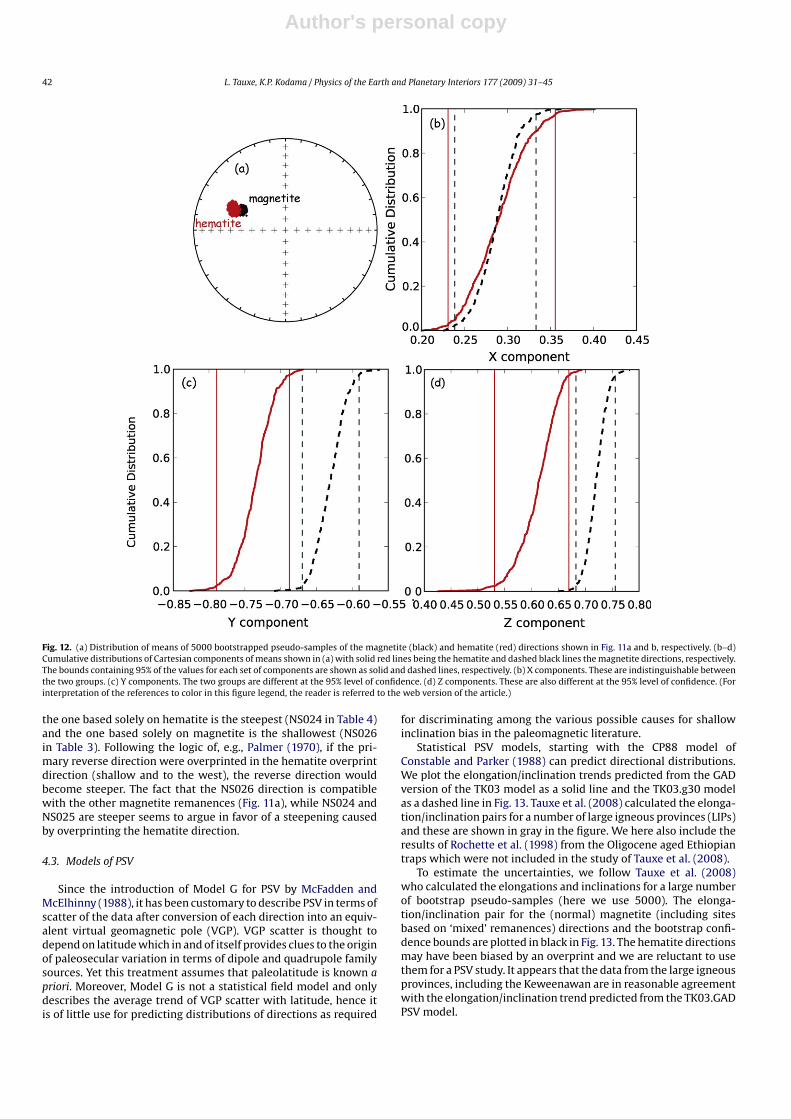
The two directional groups here called “magnetite” and “mixed”are indistinguishable from one another at the 95% level of confi-dence (Table 6). For this reason, the ‘mixed’ sites can be combinedwith the magnetite only sites and statistics on the combined dataset are labelled M+ in Table 6. However, the difference betweenthe “magnetite” and “hematite” groups is a little more problematic.In fact, these two groups fall in the awkward category whereby thecones of 95% confidence (˛95 s in Table 6) overlap but do not includethe other mean. There are several ways of testing for common meanunder these circumstances, most of which require the assump-tion that the directions were drawn from a Fisher distribution (seeMcFadden and McElhinny, 1990, for a discussion). Paleomagneticdirections are frequently not Fisherian (e.g., Tauxe et al., 1991) andsome form of non-parametric approach would be helpful. Here weuse the bootstrap test for a common mean direction between themagnetite and hematite data sets developed by Tauxe et al. (1991) inthe slightly modified form described by Tauxe et al. (1991). This testaddresses the question “can the means of two data sets be discrim-inated from one another?” without relying on the assumption thatdirections are distributed according to a Fisher distribution (Fisher,1953).
To carry out the bootstrap test, we draw random samples of datapoints (with replacement) and calculate a mean direction. This isrepeated a number of times (here 5000). The 5000 bootstrappedmean directions for each group are shown in Fig. 12a. Each mean isthen converted to Cartesian coordinates (X, Y, Z). Cumulative dis-tributions of the components for the bootstrap means of the twodirectional groups are shown in Fig. 12b–d along with the boundscontaining 95% of each component for the two groups. The nullhypothesis that two data sets have a common mean direction canbe rejected if any of the three components are different at the 95%level of confidence. For the magnetite and hematite data consideredhere, both the Y and Z components are significantly different; hencethe magnetite and hematite directional groups do not share a com-mon mean direction. This conclusion also applies to the ‘magnetite’plus ‘mixed’ group of directions with respect to the hematite onlydirections. Therefore we consider that the hematite dominated siteshave directions dominated by a secondary overprint and excludethem from further discussion of the ancient magnetic field.
In addition to the usual Fisher statistics for site means, we alsoinclude the elongation E and its direction EDec in Table 6. Those data
Author's personal copy
40 L. Tauxe, K.P. Kodama / Physics of the Earth and Planetary Interiors 177 (2009) 31–45
Fig. 8. Data from site NS076 as example of behavior typical of a sites with estimated Fisher precision parameters less than 50. (a) Thermal demagnetization as in Fig. 5a. (b)Alternating field demagnetization as in Fig. 5b. (c) Equal area projection for site. The data are highly scattered with an estimated precision parameter of 3.
sets excluding the hematite dominated sites have elongation direc-tions in the plane of the mean direction, as expected from vectorswith a geomagnetic origin. However, those data sets that includethe hematite dominated sites, EDec is significantly deflected consis-tent with the hypothesis that these directions do not sample thesame geomagnetic field.
4.2. Reversal asymmetry
The asymmetry in normal and reverse directional groupsobserved here (Table 6) has been known for decades. Dubois (1962)documented two groups of directions from what he called the Logandykes and sills, Groups I and II. Group I directions had a mean
Fig. 9. (a) Sample orientation. (b) NS007 specimen directions in geographic coordinates. Predicted directions from specimen NS007b2 using two common mistakes. (Forinterpretation of the references to color in this figure legend, the reader is referred to the web version of the article.)
Author's personal copy
L. Tauxe, K.P. Kodama / Physics of the Earth and Planetary Interiors 177 (2009) 31–45 41
Fig. 10. Data from all site mean directions with k ≥ 50 and N ≥ 4 using all specimensfrom the site that met minimum criteria. Solid (open) symbols are in the lower(upper) hemisphere, plotted in equal area projection. (a) Geographic coordinates.(b) Tilt corrected coordinates.
of D = 117, I = −76, k = 13.2, N = 80 and Group II had a mean ofD = 288.5, I = 47.5, k = 21.1, N = 25. This paper was remarkablein that it predated the pioneering work of, e.g., Cox et al. (1963)in arguing strongly for the fact that the magnetic field reversed itspolarity. Secondly, Dubois (1962) argued that Group I was associ-ated with the Logan sills while Group II came from what is nowmapped as the Pigeon dikes (Miller et al., 2001). He observedplaces where the latter intruded the former, arguing that the twodirectional groups were of different ages. From the description ofsampling sites, his Group I directions were taken in a swath ofdikes and sills from what is now mapped as Nipigon sills to theLogan Sills and associated dikes south of Thunder Bay while manyof his Group II directions appear to be taken from the Pigeon riverdikes. Books (1968) followed up on the work of Dubois (1962)and sampled lavas from the Portage Lake Volcanics in Michiganand the Grand Portage lavas in Minnesota. His mean directionfor the Grand Portage lavas, based on 11 flows south of GrandPortage, MN was D = 117, I = −59.2, k = 129, consistent with ourreverse mean (see Table 6). Moreover, his mean for the PortageLake lavas (D = 289, I = 35, k = 106, N = 29) is also consistent withthat found by Hnat et al. (2006). Beck (1970) and Palmer (1970)summarized and expanded on the paleomagnetic results from theintrusive and extrusive Keweenawan sequences, respectively. They
confirmed the general findings of both Dubois (1962) and Books(1968). But while Beck (1970) interpreted the different directionsas the result of polar wandering, Palmer (1970) argued on thebasis of a conglomerate test that the asymmetry of the normal andreverse groups was the result of a secondary overprint in a shal-low westerly direction. Such an overprint would make the GroupI directions steeper and the Group II directions shallower. His pre-ferred pole position for the Middle Keweenawan was an averageof the two. Robertson and Fahrig (1971) reprised the earlier workof Dubois (1962) and found that the Logan sills were mostly nor-mally magnetized while the dikes (Pigeon River and on the SibleyPeninsula) were reverse (Group I). They treated the specimens withthermal demagnetization and found the same two non-antipodalsets of directions as Dubois (1962). They found no evidence of over-printing as the cause of the asymmetry in their demagnetizationexperiments. Arguing for an age progression, Robertson and Fahrig(1971) defined the Logan Loop of the North American apparentpolar wander path, a view expanded upon by Robertson (1973) ina study of the Keweenawan lavas on Mamainse Point. Pesonen andNevanlinna (1981) reviewed the arguments for overprinting laidout chiefly by Palmer (1970) and Palmer et al. (1981) and age pro-gression by Robertson and Fahrig (1971) and Robertson (1973). Theyalso considered various scenarios in which the time averaged fieldis not that of a geocentric axial dipole. They concluded that an oscil-lating co-axial two dipole model could explain the available data.
The three general explanations for the reversal asymmetry:polar wandering, overprinting and long term non-dipole fieldbehavior have been revisited ever since with most studies favoringpolar wander as the explanation (see, e.g., Halls and Pesonen, 1982;Schmidt and Williams, 2003; Borradaile and Middleton, 2006; Liet al., 2008). Although we cannot resolve the issue of asymmet-ric reversals with our three reverse sites, we did find the story tobe somewhat more complex than the simple division into Upperand Lower North Shore groups. There is a reversely magnetizedflow (NS025) with a mixed remanence within the Upper North-east sequence (likely to be in the Monker Lake Diabase) and anormally magnetized (magnetite remanence) unit in the LowerNortheastern sequence (NS027). NS027 was taken from the BruleLake/Hovland Gabbros. NS026 (reverse magnetite remanence) wastaken from the Deronda Bay Andesite and NS024 (reverse hematiteremanence) was taken from the Portage River Basalts. Our averagereverse direction (Table 6) is quite similar to the Group I directionfound previously, so it is not a mere fluke of undersampled secu-lar variation. Although all three reverse directions are fairly similar,
Fig. 11. Data from all acceptable site mean directions using specimens from the site that met minimum criteria for various magnetic mineralogies. Solid (open) symbols arein the lower (upper) hemisphere, plotted in equal area projection. Data are in tilt corrected coordinates. (a) Site means based solely on “magnetite” remanences (see Table 3).Light blue dot is the antipode of the sole reverse site (NS026) based on magnetite remanence directions. (b) Site means based solely on “hematite” site means (see Table 4).(c) Site means for sites not included in (a) or (b) that were based on both hematite and magnetite specimen remanences (see Table 5). (For interpretation of the references tocolor in this figure legend, the reader is referred to the web version of the article.)
Author's personal copy
42 L. Tauxe, K.P. Kodama / Physics of the Earth and Planetary Interiors 177 (2009) 31–45
Fig. 12. (a) Distribution of means of 5000 bootstrapped pseudo-samples of the magnetite (black) and hematite (red) directions shown in Fig. 11a and b, respectively. (b–d)Cumulative distributions of Cartesian components of means shown in (a) with solid red lines being the hematite and dashed black lines the magnetite directions, respectively.The bounds containing 95% of the values for each set of components are shown as solid and dashed lines, respectively. (b) X components. These are indistinguishable betweenthe two groups. (c) Y components. The two groups are different at the 95% level of confidence. (d) Z components. These are also different at the 95% level of confidence. (Forinterpretation of the references to color in this figure legend, the reader is referred to the web version of the article.)
the one based solely on hematite is the steepest (NS024 in Table 4)and the one based solely on magnetite is the shallowest (NS026in Table 3). Following the logic of, e.g., Palmer (1970), if the pri-mary reverse direction were overprinted in the hematite overprintdirection (shallow and to the west), the reverse direction wouldbecome steeper. The fact that the NS026 direction is compatiblewith the other magnetite remanences (Fig. 11a), while NS024 andNS025 are steeper seems to argue in favor of a steepening causedby overprinting the hematite direction.
4.3. Models of PSV
Since the introduction of Model G for PSV by McFadden andMcElhinny (1988), it has been customary to describe PSV in terms ofscatter of the data after conversion of each direction into an equiv-alent virtual geomagnetic pole (VGP). VGP scatter is thought todepend on latitude which in and of itself provides clues to the originof paleosecular variation in terms of dipole and quadrupole familysources. Yet this treatment assumes that paleolatitude is known apriori. Moreover, Model G is not a statistical field model and onlydescribes the average trend of VGP scatter with latitude, hence itis of little use for predicting distributions of directions as required
for discriminating among the various possible causes for shallowinclination bias in the paleomagnetic literature.
Statistical PSV models, starting with the CP88 model ofConstable and Parker (1988) can predict directional distributions.We plot the elongation/inclination trends predicted from the GADversion of the TK03 model as a solid line and the TK03.g30 modelas a dashed line in Fig. 13. Tauxe et al. (2008) calculated the elonga-tion/inclination pairs for a number of large igneous provinces (LIPs)and these are shown in gray in the figure. We here also include theresults of Rochette et al. (1998) from the Oligocene aged Ethiopiantraps which were not included in the study of Tauxe et al. (2008).
To estimate the uncertainties, we follow Tauxe et al. (2008)who calculated the elongations and inclinations for a large numberof bootstrap pseudo-samples (here we use 5000). The elonga-tion/inclination pair for the (normal) magnetite (including sitesbased on ‘mixed’ remanences) directions and the bootstrap confi-dence bounds are plotted in black in Fig. 13. The hematite directionsmay have been biased by an overprint and we are reluctant to usethem for a PSV study. It appears that the data from the large igneousprovinces, including the Keweenawan are in reasonable agreementwith the elongation/inclination trend predicted from the TK03.GADPSV model.
Author's personal copy
L. Tauxe, K.P. Kodama / Physics of the Earth and Planetary Interiors 177 (2009) 31–45 43
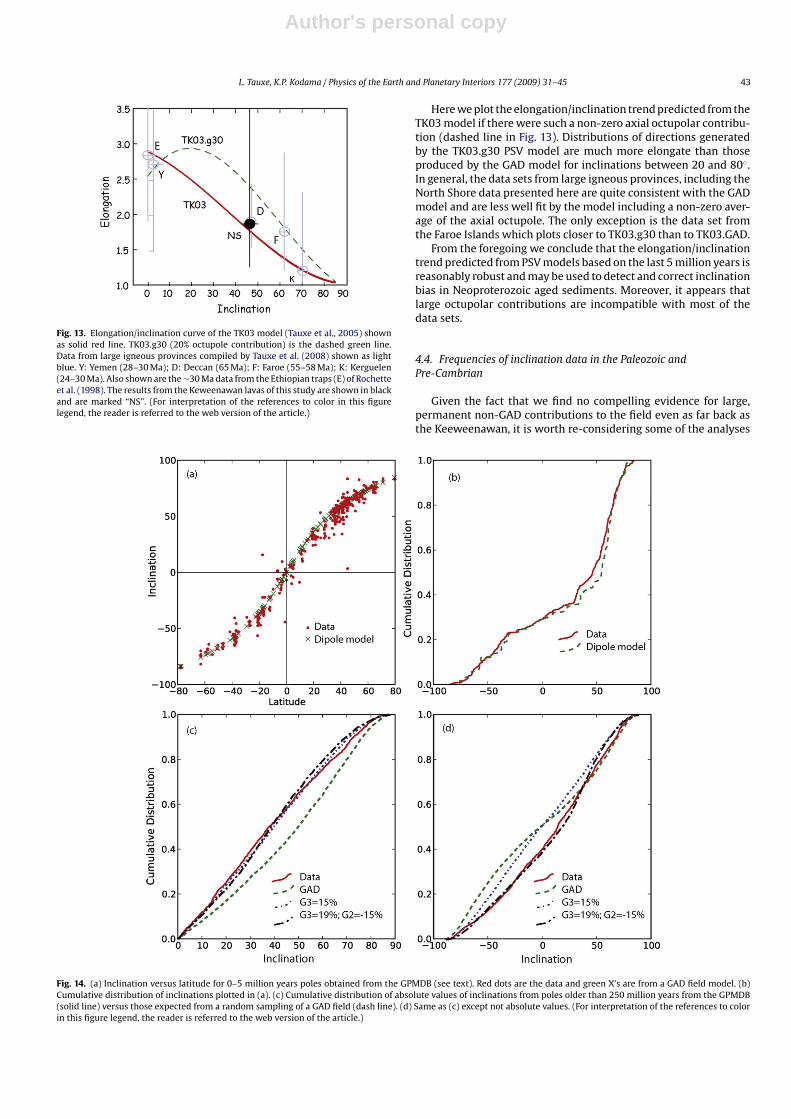
Fig. 13. Elongation/inclination curve of the TK03 model (Tauxe et al., 2005) shownas solid red line. TK03.g30 (20% octupole contribution) is the dashed green line.Data from large igneous provinces compiled by Tauxe et al. (2008) shown as lightblue. Y: Yemen (28–30 Ma); D: Deccan (65 Ma); F: Faroe (55–58 Ma); K: Kerguelen(24–30 Ma). Also shown are the ∼30 Ma data from the Ethiopian traps (E) of Rochetteet al. (1998). The results from the Keweenawan lavas of this study are shown in blackand are marked “NS”. (For interpretation of the references to color in this figurelegend, the reader is referred to the web version of the article.)
Here we plot the elongation/inclination trend predicted from theTK03 model if there were such a non-zero axial octupolar contribu-tion (dashed line in Fig. 13). Distributions of directions generatedby the TK03.g30 PSV model are much more elongate than thoseproduced by the GAD model for inclinations between 20 and 80◦.In general, the data sets from large igneous provinces, including theNorth Shore data presented here are quite consistent with the GADmodel and are less well fit by the model including a non-zero aver-age of the axial octupole. The only exception is the data set fromthe Faroe Islands which plots closer to TK03.g30 than to TK03.GAD.
From the foregoing we conclude that the elongation/inclinationtrend predicted from PSV models based on the last 5 million years isreasonably robust and may be used to detect and correct inclinationbias in Neoproterozoic aged sediments. Moreover, it appears thatlarge octupolar contributions are incompatible with most of thedata sets.
4.4. Frequencies of inclination data in the Paleozoic andPre-Cambrian
Given the fact that we find no compelling evidence for large,permanent non-GAD contributions to the field even as far back asthe Keeweenawan, it is worth re-considering some of the analyses
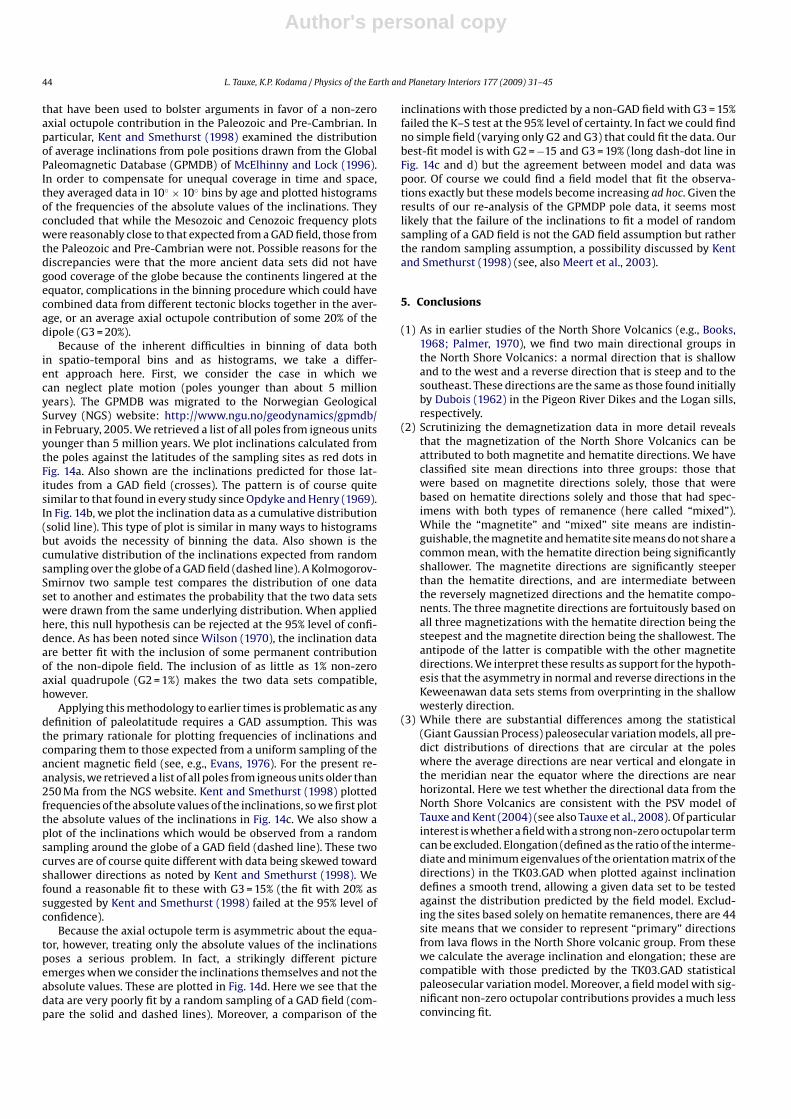
Fig. 14. (a) Inclination versus latitude for 0–5 million years poles obtained from the GPMDB (see text). Red dots are the data and green X’s are from a GAD field model. (b)Cumulative distribution of inclinations plotted in (a). (c) Cumulative distribution of absolute values of inclinations from poles older than 250 million years from the GPMDB(solid line) versus those expected from a random sampling of a GAD field (dash line). (d) Same as (c) except not absolute values. (For interpretation of the references to colorin this figure legend, the reader is referred to the web version of the article.)
Author's personal copy
44 L. Tauxe, K.P. Kodama / Physics of the Earth and Planetary Interiors 177 (2009) 31–45
that have been used to bolster arguments in favor of a non-zeroaxial octupole contribution in the Paleozoic and Pre-Cambrian. Inparticular, Kent and Smethurst (1998) examined the distributionof average inclinations from pole positions drawn from the GlobalPaleomagnetic Database (GPMDB) of McElhinny and Lock (1996).In order to compensate for unequal coverage in time and space,they averaged data in 10◦ × 10◦ bins by age and plotted histogramsof the frequencies of the absolute values of the inclinations. Theyconcluded that while the Mesozoic and Cenozoic frequency plotswere reasonably close to that expected from a GAD field, those fromthe Paleozoic and Pre-Cambrian were not. Possible reasons for thediscrepancies were that the more ancient data sets did not havegood coverage of the globe because the continents lingered at theequator, complications in the binning procedure which could havecombined data from different tectonic blocks together in the aver-age, or an average axial octupole contribution of some 20% of thedipole (G3 = 20%).
Because of the inherent difficulties in binning of data bothin spatio-temporal bins and as histograms, we take a differ-ent approach here. First, we consider the case in which wecan neglect plate motion (poles younger than about 5 millionyears). The GPMDB was migrated to the Norwegian GeologicalSurvey (NGS) website: http://www.ngu.no/geodynamics/gpmdb/in February, 2005. We retrieved a list of all poles from igneous unitsyounger than 5 million years. We plot inclinations calculated fromthe poles against the latitudes of the sampling sites as red dots inFig. 14a. Also shown are the inclinations predicted for those lat-itudes from a GAD field (crosses). The pattern is of course quitesimilar to that found in every study since Opdyke and Henry (1969).In Fig. 14b, we plot the inclination data as a cumulative distribution(solid line). This type of plot is similar in many ways to histogramsbut avoids the necessity of binning the data. Also shown is thecumulative distribution of the inclinations expected from randomsampling over the globe of a GAD field (dashed line). A Kolmogorov-Smirnov two sample test compares the distribution of one dataset to another and estimates the probability that the two data setswere drawn from the same underlying distribution. When appliedhere, this null hypothesis can be rejected at the 95% level of confi-dence. As has been noted since Wilson (1970), the inclination dataare better fit with the inclusion of some permanent contributionof the non-dipole field. The inclusion of as little as 1% non-zeroaxial quadrupole (G2 = 1%) makes the two data sets compatible,however.
Applying this methodology to earlier times is problematic as anydefinition of paleolatitude requires a GAD assumption. This wasthe primary rationale for plotting frequencies of inclinations andcomparing them to those expected from a uniform sampling of theancient magnetic field (see, e.g., Evans, 1976). For the present re-analysis, we retrieved a list of all poles from igneous units older than250 Ma from the NGS website. Kent and Smethurst (1998) plottedfrequencies of the absolute values of the inclinations, so we first plotthe absolute values of the inclinations in Fig. 14c. We also show aplot of the inclinations which would be observed from a randomsampling around the globe of a GAD field (dashed line). These twocurves are of course quite different with data being skewed towardshallower directions as noted by Kent and Smethurst (1998). Wefound a reasonable fit to these with G3 = 15% (the fit with 20% assuggested by Kent and Smethurst (1998) failed at the 95% level ofconfidence).
Because the axial octupole term is asymmetric about the equa-tor, however, treating only the absolute values of the inclinationsposes a serious problem. In fact, a strikingly different pictureemerges when we consider the inclinations themselves and not theabsolute values. These are plotted in Fig. 14d. Here we see that thedata are very poorly fit by a random sampling of a GAD field (com-pare the solid and dashed lines). Moreover, a comparison of the
inclinations with those predicted by a non-GAD field with G3 = 15%failed the K–S test at the 95% level of certainty. In fact we could findno simple field (varying only G2 and G3) that could fit the data. Ourbest-fit model is with G2 = −15 and G3 = 19% (long dash-dot line inFig. 14c and d) but the agreement between model and data waspoor. Of course we could find a field model that fit the observa-tions exactly but these models become increasing ad hoc. Given theresults of our re-analysis of the GPMDP pole data, it seems mostlikely that the failure of the inclinations to fit a model of randomsampling of a GAD field is not the GAD field assumption but ratherthe random sampling assumption, a possibility discussed by Kentand Smethurst (1998) (see, also Meert et al., 2003).
5. Conclusions
(1) As in earlier studies of the North Shore Volcanics (e.g., Books,1968; Palmer, 1970), we find two main directional groups inthe North Shore Volcanics: a normal direction that is shallowand to the west and a reverse direction that is steep and to thesoutheast. These directions are the same as those found initiallyby Dubois (1962) in the Pigeon River Dikes and the Logan sills,respectively.
(2) Scrutinizing the demagnetization data in more detail revealsthat the magnetization of the North Shore Volcanics can beattributed to both magnetite and hematite directions. We haveclassified site mean directions into three groups: those thatwere based on magnetite directions solely, those that werebased on hematite directions solely and those that had spec-imens with both types of remanence (here called “mixed”).While the “magnetite” and “mixed” site means are indistin-guishable, the magnetite and hematite site means do not share acommon mean, with the hematite direction being significantlyshallower. The magnetite directions are significantly steeperthan the hematite directions, and are intermediate betweenthe reversely magnetized directions and the hematite compo-nents. The three magnetite directions are fortuitously based onall three magnetizations with the hematite direction being thesteepest and the magnetite direction being the shallowest. Theantipode of the latter is compatible with the other magnetitedirections. We interpret these results as support for the hypoth-esis that the asymmetry in normal and reverse directions in theKeweenawan data sets stems from overprinting in the shallowwesterly direction.
(3) While there are substantial differences among the statistical(Giant Gaussian Process) paleosecular variation models, all pre-dict distributions of directions that are circular at the poleswhere the average directions are near vertical and elongate inthe meridian near the equator where the directions are nearhorizontal. Here we test whether the directional data from theNorth Shore Volcanics are consistent with the PSV model ofTauxe and Kent (2004) (see also Tauxe et al., 2008). Of particularinterest is whether a field with a strong non-zero octupolar termcan be excluded. Elongation (defined as the ratio of the interme-diate and minimum eigenvalues of the orientation matrix of thedirections) in the TK03.GAD when plotted against inclinationdefines a smooth trend, allowing a given data set to be testedagainst the distribution predicted by the field model. Exclud-ing the sites based solely on hematite remanences, there are 44site means that we consider to represent “primary” directionsfrom lava flows in the North Shore volcanic group. From thesewe calculate the average inclination and elongation; these arecompatible with those predicted by the TK03.GAD statisticalpaleosecular variation model. Moreover, a field model with sig-nificant non-zero octupolar contributions provides a much lessconvincing fit.
Author's personal copy
L. Tauxe, K.P. Kodama / Physics of the Earth and Planetary Interiors 177 (2009) 31–45 45
(4) A re-analysis of the treatment of inclinations from the GlobalPaleomagnetic Database shows that the data are very poorlyfit by a random sampling of a GAD or simple non-GAD field.It is more likely that the existing database significantly under-samples the field in a spatial sense, as discussed by Kent andSmethurst (1998) and Meert et al. (2003).
Acknowledgements
We are grateful for the cheerful field assistance of Ryan Miller,Elise Sbarbori, Katharine Turkle, and Daniel Staudigel. Thanks areowed to Curtis Gagnon and Norman de Schampe of the GrandPortage Reservation for allowing us to sample on their land. Sam-ples were measured by Ryan Fields, Katharine Turkle and Jason L.Steindorf. We have benefitted from many discussions with Jeff Geeand Dennis Kent. Two anonymous reviewers significantly improvedthe manuscript—you know who you are! Partial funding was pro-vided by the Academic Senate of the University of California andNSF grant # ANT 0538392 to LT.
References
Beck, M.E.J., 1970. Paleomagnetism of Keweenawan intrusive rocks, Minnesota. J.Geophys. Res. 75, 4985–4996.
Books, K., 1968. Magnetization of the lowermost Keweenawan lava flows in the LakeSuperior area. USGS Prof. Pap. 600-D, D248–D254.
Books, K., 1972. Paleomagneitsm of some Lake Superior Keweenawan rocks. USGSProf. Pap. 760, 42.
Borradaile, G., Middleton, R., 2006. Proterozoic paleomagnetism in the NipigonEmbayment of northern Ontario: Pillar Lake Lava, Waweig Troctolite andGunflintFomation tuffs. Precambr. Res. 144, 69–91.
Browning, T., Beske-Diehl, S., 1987. Paleomagnetism and the age of copper miner-alization in the Portage Lake volcanics, Upper Peninsula, Michigan. Can. J. EarthSci. 24, 2396–2404.
Chauvin, A., Perroud, H., Bazhenov, M., 1996. Anomalous low paleomagnetic incli-nations from Oliogocene-Lower Miocene red beds of the south-west TienShan,Central Asia. Geophys. J. Int. 126, 303–313.
Constable, C., Johnson, C., 1999. Anisotropic paleosecular variation models: implica-tions for geomagnetic field observables. Phys. Earth Planet. Int. 115, 35–51.
Constable, C., Parker, R.L., 1988. Statistics of the geomagnetic secular variation forthe past 5 m.y. J. Geophys. Res. 93, 11569–11581.
Cox, A.V., Doell, R.R., Dalrymple, G.B., 1963. Geomagnetic polarity epochs and Pleis-tocene geochronometry. Nature 198, 1049–1051.
Davis, D., Paces, J., 1990. Time resolution of geologic events on the Keweenaw Penin-sula and implications for development of the Midcontinent Rift system. EarthPlanet. Sci. Lett. 97, 54–64.
Davis, D., Sutcliffe, R., 1985. U–Pb ages from the Nipigon plate and northern LakeSuperior. Geol. Soc. Am. Bull. 96, 1572–1579.
Davis, D.W., Green, J.C., 1997. Geochronology of the North American Midcontinentrift in western Lake Superior and implications for its geodynamic evolution. Can.J. Earth Sci. 34 (4), 476–488.
Dubois, P., 1962. Paleomagnetism and correlation of Keweenawan rocks. Geol. Surv.Canada Bull. 71, 75pp.
Evans, M., 1976. Test of the dipolar nature of the geomagnetic field throughoutPhanerozoic time. Nature 262, 676–677.
Fisher, R.A., 1953. Dispersion on a sphere. Proc. Roy. Soc. London, Ser. A 217, 295–305.Green, J., Fitz, T.I., 1993. Extensive felsic lavas and rheoignimbrites in the
Keweenawan Midcontinent rift plateau volcanics, Minnesota: petrographic andfield recognition. J. Volc. Geotherm. Res. 54, 177–196.
Halls, H., 1974. A paleomagnetic reversal in the Osler volcanic group, Northern LakeSuperior. Can. J. Earth Sci. 11, 1200–1207.
Halls, H., Palmer, H., 1981. Remagnetization in Keweenawan rocks, Part II: lavaflows within the Copper Harbor Conglomerate, Michigan. Can. J. Earth Sci. 18,1395–1408.
Halls, H., Pesonen, L., 1982. Paleomagnetism of Keweenawan rocks. Geol. Soc. Am.Mem. 156, 173–201.
Hnat, J.S., van der Pluijm, B.A., van der Voo, R., 2006. Primary curvature in theMid-Continent Rift: paleomagnetism of the Portage Lake Volcanics (northernMichigan, USA). Tectonophysics 425 (1–4), 71–82.
Kean, W.F., Williams, I., Chan, L., Feeney, J., 1997. Magnetism of the Keweenawanage Chengwatana lava flows, northwest Wisconsin. Geophys. Res. Lett. 24 (12),1523–1526.
Kent, D., Smethurst, M., 1998. Shallow bias of paleomagnetic inclinations in thePaleozoic and Precambrian. Earth Planet. Sci. Lett. 160, 391–402.
Kent, D.V., Tauxe, L., 2005. Corrected Late Triassic latitudes for continents adjacentto the North Atlantic. Science 307, 240–244.
King, R.F., 1955. The remanent magnetism of artificially deposited sediments. Mon.Nat. R. Astr. Soc., Geophys. Suppl. 7, 115–134.
Kirschvink, J.L., 1980. The least-squares line and plane and the analysis of paleomag-netic data. Geophys. Jour. Roy. Astron. Soc. 62, 699–718.
Krijgsman, W., Tauxe, L., 2004. Shallow bias in Mediterranean paleomagnetic direc-tions caused by inclination error. Earth Planet. Sci. Lett. 222, 685–695.
Lawrence, K.P., Tauxe, L., Staudigel, H., Constable, C., Koppers, A., McIntosh,W.C., Johnson, C.L., 2009. Paleomagnetic field properties near the south-ern hemisphere tangent cylinder. Geochem. Geophys. Geosyst. 10, Q01005,doi:10.1029/2008GC00207.
Li, Z., Bogdanova, S., Collins, A., Davidson, A., DeWaele, B., Ernst, R.E., Fitzsimons,I., Fuck, R., Gladkochub, D., Jacobs, J., Karlstrom, K., Lu, S., Natapov, L., Pease, V.,Pisarevsky, S., Thrane, K., Vernikovsky, V., 2008. Assembly, configuration, andbreak-up history of Rodinia: A synthesis. Precambr. Res. 160, 179–210.
McElhinny, M., Lock, J., 1996. IAGA paleomagnetic databases with Access. Surv. ofGeophys. 17, 575–591.
McElhinny, M.W., McFadden, P.L., 1997. Palaeosecular variation over the past 5 Myrbased on a new generalized database. Geophys. J. Int. 131 (2), 240–252.
McFadden, P.L., McElhinny, M.W., 1988. The combined analysis of remagnetizationcircles and direct observations in paleomagnetism. Earth Planet. Sci. Lett. 87,161–172.
McFadden, P.L., McElhinny, M.W., 1990. Classification of the reversal test in palaeo-magnetism. Geophys. J. Int. 103, 725–729.
Meert, J., Tamrat, E., Spearman, J., 2003. Non-dipole fields and inclination bias:insights from a random walk analysis. Earth Planet. Sci. Lett. 214, 395–408.
Merrill, R.T., McElhinny, M.W., McFadden, P.L., 1996. The Magnetic Field of the Earth:Paleomagnetism, the Core and the Deep Mantle. Academic Press.
Miller, J., Green, J., Severson, M., Chandler, V., Peterson, D., 2001. Geologic map of theDuluth Complex and related rocks, northeastern Minnesota.
Opdyke, N.D., Henry, K.W., 1969. A test of the dipole hypothesis. Earth Planet. Sci.Lett. 6, 139–151.
Paces, J., Miller, J., 1993. Precise U-Pb ages of Duluth Complex and related maficintrusions, Northeastern Minnesota: Geochronological insights to physical pet-rogenetic, paleomagnetic and tectonomagmatic processes associated with the1.1 Ga midcontinent rift system. J. Geophy. Res. 98, 13997–14013.
Palmer, H., 1970. Paleomagnetism and correlation of some Middle Keweenawanrocks, Lake Superior. Can. J. Earth Sci. 7, 1410–1436.
Palmer, H., Davis, D., 1987. Paleomagnetism and U–Pb geochronology of volcanicrocks from Michipoicoten Island, Lake Superior, Canada: precise calibration ofthe Keweenawan polar wander track. Precambrian Res. 37, 157–171.
Palmer, H.C., Halls, H.C., Pesonen, L.J., 1981. Remagnetization in Keweenawan rocks.Part I: conglomerates. Can. J. Earth Sci. 18, 599–618.
Pesonen, L.J., Nevanlinna, H., 1981. Late Precambrian Keweenawan asymmetric rever-sals. Nature 294, 436–439.
Quidelleur, X., Courtillot, V., 1996. On low-degree spherical harmonic models ofpaleosecular variation. Phys. Earth Planet. Int. 95, 55–77.
Robertson, W., 1973. Pole positions from the Mamainse Point lavas and their bear-ing on a Keweenawan pole path and polarity sequence. Can. J. Earth Sci. 10,1541–1555.
Robertson, W., Fahrig, W., 1971. The Great Logan Paleomagnetic Loop - The polarwandering path from Canadian shield rocks during the Neohelikian Era. Can. J.Earth Sci. 8, 1355–1372.
Rochette, P., Tamrat, E., Féraud, G., Pik, R., Courtillot, V., Ketefo, E., Coulon, C., Hoff-man, C., Vandamme, D., Yirgu, G., 1998. Magnetostratigraphy and timing of theOligocene Ethiopian traps. Earth Planet. Sci. Lett. 164, 497–510.
Sandberg, A., 1938. Section across Keweenawan lavas at Duluth, MN. Geol. Soc. Am.Bull. 49, 795–830.
Schmidt, P.W., Williams, G.E., 2003. Reversal asymmetry in Mesoproterozoic over-printing of the 1.88-Ga Gunflint Formation, Ontario, Canada: non-dipole effectsor apparent polar wander? Tectonophysics 377 (1–2), 7–32.
Sohl, L.E., Christie-Blick, N., Kent, D.V., 1999. Paleomagnetic polarity reversals inMarinoan (ca. 600 Ma) glacial deposits of Australia: Implications for the durationof low-latitude glaciation in neoproterozoic time. Geol. Soc. Amer. Bull. 111 (8),1120–1139.
Tauxe, L., 2005. Inclination flattening and the geocentric axial dipole hypothesis.Earth Planet. Sci. Lett. 233, 247–261.
Tauxe, L., Banerjee, S.K., Butler, R., van der Voo, R., 2009. Essentials of Paleomag-netism. University of California Press, Berkeley.
Tauxe, L., Kent, D.V., 2004. A simplified statistical model for the geomagnetic fieldand the detection of shallow bias in paleomagnetic inclinations: was the ancientmagnetic field dipolar? In: Channell, J.E.T.e.a. (Ed.), Timescales of the Paleomag-netic Field, vol. 145. American Geophysical Union, Washington, DC, pp. 101–116.
Tauxe, L., Kodama, K., Kent, D.V., 2008. Testing corrections for paleomagnetic incli-nation error in sedimentary rocks: a comparative approach. Phys. Earth Planet.Int. 169, 152–165.
Tauxe, L., Kylstra, N., Constable, C., 1991. Bootstrap statistics for paleomagnetic data.J. Geophys. Res. 96, 11723–11740.
Vandamme, D., Courtillot, V., 1992. Paleomagnetic constraints on the structure ofthe Deccan traps. Phys. Earth Planet. Inter. 74, 241–261.
Vervoort, J.D., Wirth, K., Kennedy, B., Sandland, T., Hatpp, K.S., 2007. The magmaticevolution of the Midcontinent rift: new geochronologic and geochemical evi-dence from felsic magmatism. Precambrian Res. 157 (1–4), 235–268.
Wilson, R.L., 1970. Permanent aspects of the Earth’s non-dipole magnetic field overupper Tertiary times. Geophys. J. R. Astr. Soc. 19, 417–437.
Zartman, R., Nicholson, S., Cannon, W., Morey, G., 1997. U–Th–Pb zircon ages of someKeweenawan Supergroup rocks from the south shore of Lake Superior. Can. J.Earth Sci. 34, 549–561.