Embed Size (px)
Citation preview
This article appeared in a journal published by Elsevier. The attachedcopy is furnished to the author for internal non-commercial researchand education use, including for instruction at the authors institution
and sharing with colleagues.
Other uses, including reproduction and distribution, or selling orlicensing copies, or posting to personal, institutional or third party
websites are prohibited.
In most cases authors are permitted to post their version of thearticle (e.g. in Word or Tex form) to their personal website orinstitutional repository. Authors requiring further information
regarding Elsevier’s archiving and manuscript policies areencouraged to visit:
http://www.elsevier.com/copyright
Author's personal copy
The faultline activation process and the effects of activated faultlineson coalition formation, conflict, and group outcomes
Karen A. Jehn a,*, Katerina Bezrukova b
a Melbourne Business School, 200 Leicester Street, Carlton, Victoria 3053, Australiab Department of Psychology, Santa Clara University, 500 El Camino Real, Santa Clara, CA 95053, USA
a r t i c l e i n f o
Article history:Received 8 June 2006Accepted 25 November 2009Available online 11 February 2010
Accepted by Dave Harrison
Keywords:FaultlinesConflictCoalition formationGroup entitlement configurationTeam identification
a b s t r a c t
This research examines the effects of group faultline activation on coalition formation, conflict, and groupoutcomes. We distinguish between dormant faultlines (potential faultlines based on demographic char-acteristics) and activated group faultlines (members actually perceive subgroups based on the demo-graphic characteristics) and hypothesize that while dormant faultlines do not automatically turn intoactive group divisions, a group’s entitlement configuration can activate divisions among group members.Study 1 was a construct validity study to verify the psychometric properties of the activated group fault-line measure and explain its connection to other process variables. In Studies 2 and 3, we tested ourhypotheses and found that groups with activated faultlines were more likely to form coalitions, have highlevels of group conflict, and lower levels of satisfaction and group performance than dormant faultlinegroups. Furthermore, team identification moderated the effects of activated faultlines on group processessuch that a strong workgroup identity decreased the likelihood that activated faultlines led to coalitionformation and conflict.
� 2009 Elsevier Inc. All rights reserved.
Group composition and its effect on group processes and out-comes are central to the study of organizations. However, much re-search on group diversity has shown mixed results (cf. Horwitz &Horwitz, 2007; Webber & Donahue, 2001; Williams & O’Reilly,1998). Lau and Murnighan (1998) introduced the concept of groupfaultlines to forward research on group composition. Group fault-lines ‘‘divide a group’s members on the basis of one or more attri-butes” (p. 325). The group faultline framework allows groupcomposition researchers to make predictions about subgroupinteractions within the group based on member demographiccharacteristics. However, much of the empirical work has ne-glected a number of aspects of faultlines that we consider criticalto understanding the theoretical link between members’ demo-graphics and group performance: faultline activation, group per-sonality configuration, and superordinate team identification. Ourmain research question is when are objective demographic align-ments (dormant faultlines) actually perceived by group members?That is, when do dormant faultlines become activated faultlines?
According to Lau and Murnighan (1998), groups may havemany potential faultlines, ‘‘each of which may activate or increasethe potential for particular subgroupings” (p. 328). Subgroups, ingeneral, are two or more individuals within a group separated from
other group members (Lau & Murnighan, 1998; O’Leary & Morten-sen, 2008). Faultline subgroups are based on demographic align-ments that divide groups; for instance, into male and femalesubgroups (Lau & Murnighan, 1998) or even based on location(Cramton & Hinds, 2005; O’Leary & Mortensen, 2008; Polzer, Crisp,Jarvenpaa, & Kim, 2006). We define faultline activation as the pro-cess by which an objective demographic alignment (a potential, ordormant faultline) is actually perceived by group members as thedivision of the group into separate subgroups based on demo-graphic alignment (an activated faultline). While Lau and Murni-ghan’s initial conceptualization of faultlines infers activation, themajority of the recent work on faultlines operationalizes faultlinesbased on objective demographic characteristics such as gender,nationality, and race (Lau & Murnighan, 2005; Li & Hambrick,2005; Molleman, 2005; Pearsall, Ellis, & Evans, 2008; Polzeret al., 2006; Sawyer, Houlette, & Yeagley, 2006; Thatcher, Jehn, &Zanutto, 2003). Despite the theorizing, much of this past work onfaultlines (see Earley and Mosakowski (2000) for exception) doesnot examine whether the members actually perceive these sub-group distinctions based on demographics that Lau and Murnighan(1998) suggested were the basis for consequent intragroup pro-cesses and outcomes.
We therefore draw on the diversity research which has sug-gested: (a) that diverse groups are likely to contain subgroups(Phillips, Mannix, Neale, & Gruenfeld, 2004; Polzer et al., 2006);(b) that there is a conceptual distinction between objective and
0749-5978/$ - see front matter � 2009 Elsevier Inc. All rights reserved.doi:10.1016/j.obhdp.2009.11.008
* Corresponding author.E-mail addresses: [email protected] (K.A. Jehn), [email protected] (K. Bezru-
kova).
Organizational Behavior and Human Decision Processes 112 (2010) 24–42
Contents lists available at ScienceDirect
Organizational Behavior and Human Decision Processes
journal homepage: www.elsevier .com/ locate /obhdp
Author's personal copy
perceived demographic differences within groups (Garcia-Prieto,Bellard, & Schneider, 2003; Harrison & Klein, 2007; Zellmer-Bruhn,Maloney, Bhappu, & Salvador, 2008) that has been acknowledgedin the empirical work on surface- and deep-level diversity (Cunn-ingham, 2007; Harrison, Price, & Bell, 1998; Harrison, Price, Gavin,& Florey, 2002; Phillips & Loyd, 2006; Phillips, Northcraft, & Neale,2006), mentoring relationships (e.g., Lankau, Riordan, & Thomas,2005), value and goal diversity (e.g., Jehn, Northcraft, & Neale,1999; Mannix & Jehn, 2004; Rink, 2005), face-to-face vs. computermediated communication (e.g., Bhappu, Griffith, & Northcraft,1997), and perceived variability/homogeneity in ingroups and out-groups (e.g., Lee & Ottati, 1993).
In addition, research on supervisor–subordinate relations hassuggested that perceived differences often have a greater effecton interactions than objective demographic differences (cf. Rior-dan, 2000; Strauss, Barrick, & Connerley, 2001; Turban & Jones,1988). Ashforth and Mael (1989) explain this by suggesting thatthe effect of demographic differences is through individuals’ per-ceptions. A recent study by Zellmer-Bruhn et al. (2008) shows thatthe demographic composition within a group is not necessarily re-lated to perceived demographic similarity. They discuss implica-tions for faultline research and suggest that the ‘‘congruencebetween potential faultlines and activated faultlines is not a fore-gone conclusion” (p. 14). We believe that it is therefore criticalfor research on faultlines to examine the activation of dormantfaultlines into activated faultlines thus taking into account mem-bers’ perceptions of the demographic composition within thegroup in addition to the objective demographics as, we believe, thisis the foundation for future interactions among group members. Infact, we propose that the objective demographic subgroup divi-sions (dormant faultlines) examined in the past research on fault-lines may not necessarily be perceived by the members (activatedfaultlines) and therefore the past studies have provided a limitedexamination of the faultline construct.
Configural aspects of groups are considered an important aspectof the context of group interaction (cf. Kirkman, Tesluk, & Rosen,2004) that until now have been generally overlooked in researchexamining group composition, and in faultline research in particu-lar. Configural concepts (Klein & Kozlowski, 2000) are those havingmeaning at the team level because of their form of dispersion, butthat stem from individual attributes, such as personality or abilityvariables (Barrick, Stewart, Neubert, & Mount, 1998; Barry & Stew-art, 1997; Molleman, Nauta, & Jehn, 2004; Neuman, Wagner, &Christiansen, 1999; Stellmacher & Petzel, 2005). We specificallyexamine the team entitlement configuration as key to faultlineactivation based on equity sensitivity (Huseman, Hatfield, & Miles,1987; King, Miles, & Day, 1993; Miles, Hatfield, & Huseman, 1994)and political aggression theories (Chirot, 1997; Dekker, Malova, &Hoogendoorn, 2003; Duckitt, 1989). Entitlement refers to the beliefof an individual that they are deserving of rewards, regardless oftheir effort (Moore, 1991). Entitled individuals increase powerstruggles and adversity in groups (Kirkpatrick, Waugh, Valencia,& Webster, 2002; Sauley & Bedeian, 2000) and hence, when spe-cific team entitlement configurations are present in a group wepropose that dormant faultlines are more likely to be activated.Political history provides many examples of abusive leaders withhigh entitlement beliefs who intensively exploited nationalisticrhetoric to emphasize conflict between races or classes (Chirot,1997) to extend their political power (Dekker et al., 2003; Weiss,2003). An example of an entitlement configuration leading to dor-mant faultline activation is that of the MBA learning team with twomembers with high levels of entitlement polarizing the group. Wepropose that this configuration, two entitleds, is most likely to acti-vate demographic faultlines. That is, in a group when there are twoindividuals vying for power and control (i.e., entitleds) in opposingfaultline subgroups, this is the most likely configuration to activate
the effects of dormant faultlines. We argue that the configurationof entitlement beliefs within a group, which are associated withauthority seeking and power struggle initiation (Miles et al.,1994; Raja, Johns, & Ntalianis, 2004; Silverman & Williamson,1997), can trigger the activation of dormant faultlines. We there-fore include in our model the moderating role of group entitlementconfiguration in activating dormant faultlines.
In addition, the internal group dynamics, according to Lau andMurnighan (1998), are a key component of the process by whichgroup composition influences group and individual level outcomes.While some studies have suggested mediating factors betweenfaultlines and group outcomes, they often do not directly test theserelationships (e.g., Gibson & Vermeulen, 2003; Sawyer et al., 2006;for exceptions see Lau & Murnighan, 2005; Li & Hambrick, 2005).One common group process that is examined in diversity research,and that is indicated in the original theory as key to performancelosses in groups with faultlines, is conflict (Lau & Murnighan,1998; cf. Williams & O’Reilly, 1998). In addition to examining con-flict, we also investigate coalition formation as a behavioral processindicated in the original faultline theory (Lau & Murnighan, 1998)but neglected in the subsequent empirical work. Therefore, inthese studies we examine the faultline activation process and theeffects of activated faultlines on coalition formation, conflict, andgroup outcomes.
Finally, while we propose that faultline activation will lead tocoalition formation and conflict, we also suggest a more positiveview of this situation by proposing a moderator that alleviatesthe negative aspects of faultline activation: superordinate teamidentification. We draw upon social identity theory (Tajfel & Turn-er, 1986) and social categorization theory (Turner, 1984; Turner,Hogg, Oakes, Reicher, & Wetherell, 1987) to understand how asuperordinate workgroup identity (Gaertner & Dovidio, 2000;Gaertner, Dovidio, Anastasio, Bachman, & Rust, 1993; Kane, Argote,& Levine, 2005) may reduce conflict and coalition formation be-tween activated subgroups by reducing the salience of the sub-group categorization. We propose that when group members areboth committed to and hold the superordinate team identity asprimary (team identification) the entire group becomes moreinternally cohesive and thus negative group processes such as con-flict and coalition formation are less likely.
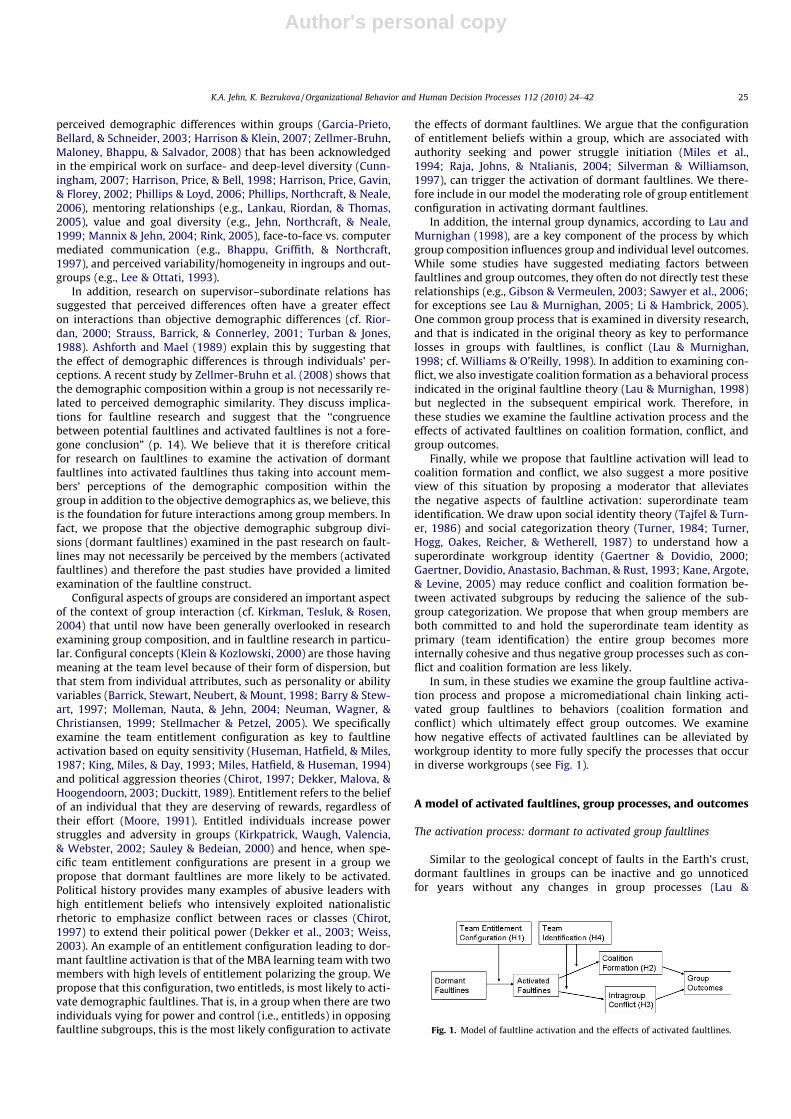
In sum, in these studies we examine the group faultline activa-tion process and propose a micromediational chain linking acti-vated group faultlines to behaviors (coalition formation andconflict) which ultimately effect group outcomes. We examinehow negative effects of activated faultlines can be alleviated byworkgroup identity to more fully specify the processes that occurin diverse workgroups (see Fig. 1).
A model of activated faultlines, group processes, and outcomes
The activation process: dormant to activated group faultlines
Similar to the geological concept of faults in the Earth’s crust,dormant faultlines in groups can be inactive and go unnoticedfor years without any changes in group processes (Lau &
Fig. 1. Model of faultline activation and the effects of activated faultlines.
K.A. Jehn, K. Bezrukova / Organizational Behavior and Human Decision Processes 112 (2010) 24–42 25
Author's personal copy
Murnighan, 1998; Wiprut & Zobrack, 2000). We therefore distin-guish between dormant faultlines and activated group faultlinesand define dormant faultlines as the demographic alignmentacross members that may (or may not) divide a group into sub-groups based on objective demographic alignment across mem-bers. This objective alignment is what most past faultlineresearch has studied (for an exception see Earley & Mosakowski,2000). Activated group faultlines occur in groups when membersactually perceive these divisions into subgroups based on demo-graphic attributes. While dormant faultlines are based on theobjective demographics of group members, activated group fault-lines exist when members perceive two separate subgroups. Inthe geological literature, to continue with the metaphor, thereare certain things that lead to the likelihood of a dormant faultbeing activated: (1) the predisposition of the fault orientation(i.e., the alignment exists, the dormant fault) and (2) and increasein stress or pressure that pushes on the sides of the faults (Wiprut& Zobrack, 2000). Most past organizational and team research hasassumed that the first criterion is enough, but we focus on the sec-ond aspect, the faultline activation process and propose that dor-mant faultlines do not necessarily turn into active groupdivisions, but that certain group personality configurations acti-vate potential dormant alignments.
Theoretically, according to Lau and Murnighan (1998) and morerecently Cramton and Hinds (2005), faultlines increase the poten-tial for demographic subgroupings (two or more members separatefrom other group member based on demographics). We proposethat there are certain situations in which demographic alignmentsbecome salient to the members in the group (Harrison & Klein,2007; Li & Hambrick, 2005). Identity and self theories suggest anactivation process within individuals based on the salience of so-cial categories (cf. Oakes, 1987; Pearsall et al., 2008). For instance,Brewer and Gardner (1996) review theories of the social self andstate that different selves are activated at different times or in dif-ferent contexts. From the perspective of multiple identities or iden-tity complexity, Roccas and Brewer (2002) discuss objective (whatthe person is; White, Christian, young, female) vs. subjective iden-tities (who they see themselves, and others, as at a specific time;White Christian) and the processes by which subjective identitiesare decided.
Diversity and workgroup research has also examined the pro-cesses by which a specific individual characteristic becomes salientin a workgroup (cf. Harrison & Klein, 2007; e.g., Moreland, Levine,& Wingert, 1996; Zellmer-Bruhn et al., 2008), focusing on the easeof assessment or visibility of the characteristic. The visible, salientdemographics provide the basis for subgroup salience to be pri-mary to the employee (Ashforth & Johnson, 2001; Brewer & Gard-ner, 1996; Ellemers, De Gilder, & Haslam, 2004). Note, however,that we propose that not all potential faultline situations are nec-essarily activated; that is, while the demographics of the groupmembers suggest the potential for faultlines (Lau & Murnighan,1998), the members may never actually feel or behave as separategroups; that is, there may be no perceived differences acrossboundaries by members. For our research, we specifically wantto know what activates demographic subgroup identity, or the per-ception of the group members that demographically aligned sub-groups exist.
Based on the work on multiple identities (e.g., Roccas & Brewer,2002) and workgroup researchers who have considered configuralaspects (e.g., Barrick et al., 1998; Barry & Stewart, 1997; Neumanet al., 1999), we propose that the configuration of personality char-acteristics within the group (group personality configuration) is animportant factor that will determine whether or not the faultlinesare activated, and a factor that has thus far been ignored in thefaultline research (cf. Molleman, 2005). Most past researchattempting to address team level personality characteristics has
examined aggregated individual scores (e.g., Molleman et al.,2004) or variance across members (e.g., Barrick et al., 1998) andhas ignored the configural aspects. In our model, member entitle-ment placement as a configural aspect is part of the group context(Colquitt & Jackson, 2006; Kirkman et al., 2004), and an importantcomponent of the explanation of why groups with objective fault-lines will have members who actually perceive these faultlines.
Group entitlement configuration
We introduce group entitlement configuration as an activator ofdormant faultlines which determines whether faultlines areencouraged or tolerated within groups. This specific personalityvariable is one that, we propose, given the specific entitlementconfiguration, has the potential to pull groups apart, rather thanunite them (Chirot, 1997; Silverman & Williamson, 1997). We de-fine entitlement beliefs as the feeling of deserving, regardless of ef-fort, held by the members (adapted from Moore (1991)). Thisconstruct is often associated with arrogance, conceit, authorityseeking, and grandiosity (Baumeister, Smart, & Boden, 1996; Kirk-patrick et al., 2002; Silverman & Williamson, 1997). Entitleds arepredisposed to compete for glory, personal worth, and power(Miles et al., 1994; Raja et al., 2004) and hence, are likely to estab-lish themselves as a center of a communication often in oppositionto others (Duckitt, 1989). Equity sensitivity theory (Huseman et al.,1987; King et al., 1993; Miles et al., 1994) implies that individualsrespond in different ways to perceived equity and inequity; that is,they are differentially sensitive to equity issues. The term ‘‘entitl-eds” is used to refer to those individuals who are looking for waysto improve their own situation and increase the rewards they canreceive from the organization compared to others (Blakely, An-drews, & Moorman, 2005; King & Miles, 1994). Entitleds are oftencharacterized as ‘‘takers” looking to get their way and improvetheir own situations (Kickul, Gundry, & Posig, 2005; Mintu-Wim-satt, 2003). When examining potential activators of dormant toactivated faultlines, we propose based on theories of politicalaggression, justice, and equity sensitivity that a key construct toconsider is the group entitlement configuration as a contextualtrigger of attention and even opposition across demographicallyaligned subgroups (dormant faultlines).
We argue that a group entitlement configuration with disper-sion of two entitleds across dormant faultlines will influence thedegree to which the dormant faultlines are activated. Politicalaggression theory (Chirot, 1997; Dekker et al., 2003; Duckitt,1989) posits that entitled individuals increase power strugglesand animosity within and between groups. This research suggeststhat individuals who possess high entitlement beliefs attempt toextend their political power in divisive ways (Dekker et al., 2003;Weiss, 2003) by encouraging divides between races or classes (Chi-rot, 1997). In addition, the high level of self-perceived superioritypossessed by such individuals has been shown to incite tensionand polarization among employees (Kirkpatrick et al., 2002; Sauley& Bedeian, 2000). Hogan, Raskin, and Fazzini (1990) note that man-agers with a strong sense of entitlement make judgments withgreater confidence and become disproportionally more influentialin group situations.
Justice researchers find that different levels of equity beliefswithin groups (e.g., entitleds dispersed with others) causes nega-tive affective reactions and decreased member motivation to per-form group roles (Colquitt, 2004; Grienberger, Rutte, & vanKnippenberg, 1997; van den Bos & Lind, 2001). We propose thatthese effects will be exacerbated if the entitled members are inopposite faultline subgroups. A group consisting of an entitlementconfiguration of two high entitled members will experience polar-ization over leadership and inevitable competition over power(Barry & Stewart, 1997; Mannix, 1993; Pearce & DeNisi, 1983), thus
26 K.A. Jehn, K. Bezrukova / Organizational Behavior and Human Decision Processes 112 (2010) 24–42

Author's personal copy
activating dormant demographic faultlines within the group. Thisconfiguration of members allows the influential ability of ‘‘entitl-eds” to trigger the activation of dormant faultlines. Since entitledsrequire complimentary followers, a group consisting of more thanone entitled may experience battles over followers (Barry & Stew-art, 1997) which we suggest will be activated along dormant fault-lines. That is, followers will unite behind influential members mostlikely based on demographic alignment (similarity-attraction; By-rne, 1971; Kirkman et al., 2004; Rand & Wexley, 1975). We suggestthat this influential ability of two people, each with a strong senseof entitlement, may promote the process whereby dormant fault-lines actually become active divides along demographic lines with-in a group. In this sense, our personality configuration reflectsHarrison and Klein’s (2007) notion of ‘‘diversity as separation” asit suggests a bimodal distribution with most unit members occu-pying the same position or uniformly spreading across the contin-uum with the two outliers on each side of the faultline. Here,separation is at its maximum with members polarizing and thegroup’s social network bifurcating into two dense clusters (Harri-son & Klein, 2007). Equally weighted centers of potential powerwithin a group might give a rise to the emergence of competingand nonoverlapping subgroups (Lau & Murnighan, 1998; Mannix,1993; Murnighan & Brass, 1991; Pearce & DeNisi, 1983) and, inour model, activate dormant faultlines based on demographics.Note, therefore, that not all potential faultline situations are acti-vated; that is, while the demographics of the group members sug-gest the potential for faultlines, the members may never actuallyfeel or behave as separate groups unless activated by the grouppersonality configuration. Specifically, based on the above, we pro-pose that the group personality configuration in which two mem-bers have strong entitlement beliefs is the most likely situation forfaultlines to be activated.
Hypothesis 1. Group entitlement configuration will moderate therelationship between dormant faultlines and activated faultlines;that is, groups with dormant faultlines and with a group person-ality configuration of two members with strong entitlement beliefsin opposing faultline subgroups will be more likely to haveactivated faultlines than groups without this group personalityconfiguration.
Mediators of the relationship between activated faultlines and groupoutcomes: coalition formation and conflict
The next step in the model of faultlines that we investigate,once faultlines are activated, is the group processes that mediatethe relationship between activated faultlines and group outcomes(see Fig. 1). We propose that coalition formation and conflict aremechanisms by which activated faultlines (perceived subgroupsbased on demographic alignment) have an impact on group out-comes. We define a coalition as two or more parties who cooperateto obtain a mutually desired outcome that satisfies the interests ofthe coalition rather than those of the entire group within which itis embedded (Komorita & Kravitz, 1983). This reflects members’behaviors that involve joint action to achieve a goal (Thibaut & Kel-ley, 1959). It has been argued that people form coalitions on thebasis of agreement on issues or similar definitions of their task sit-uation (Murnighan & Brass, 1991). We predict that coalitions aremore likely to occur when group members perceive subgroupsbased on demographic similarities within the group. For example,Eisenhardt and Bourgeois (1988) found that the demographic sim-ilarity of group members predicted coalition patterns through theprocesses of initial attraction and social integration of group mem-bers. Therefore, we test a prior held assumption of whether or notthe demographic similarities that form faultlines will automati-cally lead to coalitional behavior.
The multiparty negotiation and coalition literature suggest thatonce a coalition is formed, the parties in the coalition cooperatewith each other, favorably influencing their own outcomes at theexpense of noncoalition members (Polzer, Mannix, & Neale,1998). This coalition formation promotes intergroup distrust andsocial competition (Brewer, 1996; Insko & Schopler, 1998; Inskoet al., 1993). Implicit competition between coalitions may interferewith the individual’s ability or willingness to make choices thatbenefit all members of a group (Brewer, 1995) thus decreasinggroup performance. The existence of two distinct coalitions createsingroup/outgroup membership which leads to intergroup biasesand lower satisfaction (Polzer et al., 1998; Sherif, Harvey, White,Hood, & Sherif, 1961). We, therefore, also propose that coalitionformation within a group will likely lead to lower levels of groupproductivity and performance given the split efforts andallegiances.
Hypothesis 2. Coalition formation mediates the relationshipbetween activated group faultlines and group outcomes (membersatisfaction, perceived performance, and objective performance).
Interindividual–intergroup discontinuity theory suggests thatintersubgroup relations may be more competitive, less trusting,and more conflictful than those between two individuals (Insko& Schopler, 1987; Insko, Schopler, Hoyle, Dardis, & Graetz, 1990;Schopler et al., 1993) or in a group that does not have activatedfaultlines. One explanation is that ingroup–outgroup distinctionscause animosity and competition between the subgroups as theydistinguish themselves from one another (Insko et al., 1990). Whendemographic subgroups are salient, according to Li and Hambrick(2005), negative processes such as conflict are likely to arise asthe two sides become wary of one another. Because of negativecategorization processes, subgroups are likely to experience frus-tration, discomfort, hostility, and anxiety that can result in conflictin the group (Gaertner, Dovidio, Nier, Ward, & Banker, 1999; Lippo-nen, Helkama, & Juslin, 2003; Polzer, 2004; Polzer et al., 2006).
Conflicts, in general, are perceived incompatibilities or discrep-ant views among group members (Jehn & Bendersky, 2003). Con-flicts can cause extreme negative process problems such as lackof coordination, cooperation, and cohesion (Brewer, 1995, 1996;LaBianca, Brass, & Gray, 1998). A recent meta-analysis indicatesthat they have similar negative effects on group outcomes basedon a cognitive processing perspective that all conflict is detrimen-tal to performance (De Dreu & Weingart, 2003). Conflict increasesthe cognitive load which interferes with complex thinking and pro-cessing of information. Research suggests that the threat and anx-iety associated with conflict can inhibit employees’ cognitivefunctioning in their processing of complex information (Roseman,Wiest, & Swartz, 1994; Staw, Sandelands, & Dutton, 1981). Accord-ing to this perspective, a negative conflict schema narrows therange of attention and triggers negative memory material whichin addition to interfering with group performance also negativelyinfluences commitment, cohesiveness, and satisfaction (Carnevale& Probst, 1998). These conflicts deplete energy and effort thatcould be expended toward task completion and the attainmentof mutual goals (Amason & Mooney, 1999; Northcraft, Polzer,Neale, & Kramer, 1995). Therefore, we predict that:
Hypothesis 3. Intragroup conflict mediates the relationshipbetween activated group faultlines and group outcomes (membersatisfaction, perceived performance, and objective performance).
Team identification and faultline activation
Given the negative consequences of faultline activation outlinedabove, we next propose a moderator that can reduce the likelihoodthat activated faultlines lead to negative group processes.
K.A. Jehn, K. Bezrukova / Organizational Behavior and Human Decision Processes 112 (2010) 24–42 27
Author's personal copy
According to Lau and Murnighan (1998), faultlines can lead to sali-ent subgroups that then become a basis for social identificationand categorization. Groups in which members identify with a par-ticular demographic subgroup are likely to have the negative out-comes associated with categorization (e.g., negative stereotypingand prejudice) which can increase the likelihood of activated fault-lines leading to coalition formation and conflict (Thatcher & Jehn,1998). However, if there is a strong superordinate workgroup iden-tity within the team (Gaertner & Dovidio, 2000; Gaertner et al.,1993; Kane et al., 2005) this may override the negative process ef-fects of activated faultline subgroups. That is, in groups with strongteam identification (a meta-identity, focused on the workgroup),activated faultlines will be less likely to lead to negative group pro-cesses based on stereotyping and outgroup biases (Gaertner & Dov-idio, 2000; Gaertner et al., 1993; Hogg & Terry, 2000). A workgroupidentity as that part of an individual’s self-concept, which derivesfrom his/her knowledge of his/her membership in a group, to-gether with the value and emotional significance attached to thatmembership (adapted from Tajfel, 1982). That is, groups in whichmembers have strong team identification will have a high level ofcommitment and hold the workgroup goals as primary (Kane et al.,2005). The team identification acts as a ‘‘social glue” and commonuniting force to keep an activated faultline group working toward acommon performance goal without process loss (Thatcher & Zhu,2006; Van Vugt & Hart, 2004). Therefore, we propose that thestronger the team identification within the group, the less likelyactivated faultlines will lead to conflict and coalition formation.
Hypothesis 4. Team identification will moderate the relationshipbetween activated faultlines and coalition formation and conflictsuch that the positive relationship between activated faultlinesand the process variables weakens as the moderator, teamidentification, increases.
Methods
Overview of studies
In Study 1, we develop and test our measure of activated fault-lines and demonstrate its construct validity (convergent and dis-criminant; Brown, Trevino, & Harrison, 2005; Campbell, 1960)and internal reliability utilizing 65 student workteams. The secondstudy provides the cross-validation of our constructs and an empir-ical test of our theoretical model using 40 student workteams withdormant faultlines based on one demographic characteristic, race.The third study again replicates the construct validity of Studies 1and 2 with 32 workteams and also tests the hypotheses with dor-mant faultlines based on two demographic characteristics (raceand gender). In our research, we relied on a multimethod approachto examine member alignment and resulting group processes.
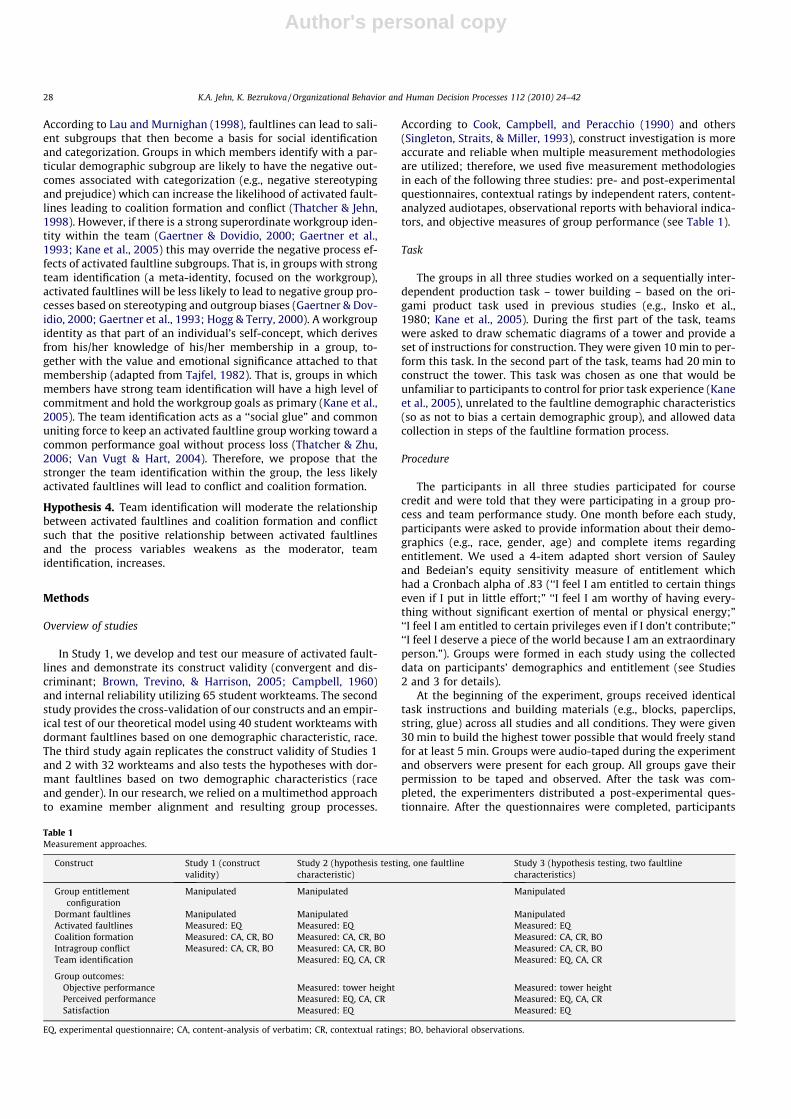
According to Cook, Campbell, and Peracchio (1990) and others(Singleton, Straits, & Miller, 1993), construct investigation is moreaccurate and reliable when multiple measurement methodologiesare utilized; therefore, we used five measurement methodologiesin each of the following three studies: pre- and post-experimentalquestionnaires, contextual ratings by independent raters, content-analyzed audiotapes, observational reports with behavioral indica-tors, and objective measures of group performance (see Table 1).
Task
The groups in all three studies worked on a sequentially inter-dependent production task – tower building – based on the ori-gami product task used in previous studies (e.g., Insko et al.,1980; Kane et al., 2005). During the first part of the task, teamswere asked to draw schematic diagrams of a tower and provide aset of instructions for construction. They were given 10 min to per-form this task. In the second part of the task, teams had 20 min toconstruct the tower. This task was chosen as one that would beunfamiliar to participants to control for prior task experience (Kaneet al., 2005), unrelated to the faultline demographic characteristics(so as not to bias a certain demographic group), and allowed datacollection in steps of the faultline formation process.
Procedure
The participants in all three studies participated for coursecredit and were told that they were participating in a group pro-cess and team performance study. One month before each study,participants were asked to provide information about their demo-graphics (e.g., race, gender, age) and complete items regardingentitlement. We used a 4-item adapted short version of Sauleyand Bedeian’s equity sensitivity measure of entitlement whichhad a Cronbach alpha of .83 (‘‘I feel I am entitled to certain thingseven if I put in little effort;” ‘‘I feel I am worthy of having every-thing without significant exertion of mental or physical energy;”‘‘I feel I am entitled to certain privileges even if I don’t contribute;”‘‘I feel I deserve a piece of the world because I am an extraordinaryperson.”). Groups were formed in each study using the collecteddata on participants’ demographics and entitlement (see Studies2 and 3 for details).
At the beginning of the experiment, groups received identicaltask instructions and building materials (e.g., blocks, paperclips,string, glue) across all studies and all conditions. They were given30 min to build the highest tower possible that would freely standfor at least 5 min. Groups were audio-taped during the experimentand observers were present for each group. All groups gave theirpermission to be taped and observed. After the task was com-pleted, the experimenters distributed a post-experimental ques-tionnaire. After the questionnaires were completed, participants
Table 1Measurement approaches.
Construct Study 1 (constructvalidity)
Study 2 (hypothesis testing, one faultlinecharacteristic)
Study 3 (hypothesis testing, two faultlinecharacteristics)
Group entitlementconfiguration
Manipulated Manipulated Manipulated
Dormant faultlines Manipulated Manipulated ManipulatedActivated faultlines Measured: EQ Measured: EQ Measured: EQCoalition formation Measured: CA, CR, BO Measured: CA, CR, BO Measured: CA, CR, BOIntragroup conflict Measured: CA, CR, BO Measured: CA, CR, BO Measured: CA, CR, BOTeam identification Measured: EQ, CA, CR Measured: EQ, CA, CR
Group outcomes:Objective performance Measured: tower height Measured: tower heightPerceived performance Measured: EQ, CA, CR Measured: EQ, CA, CRSatisfaction Measured: EQ Measured: EQ
EQ, experimental questionnaire; CA, content-analysis of verbatim; CR, contextual ratings; BO, behavioral observations.
28 K.A. Jehn, K. Bezrukova / Organizational Behavior and Human Decision Processes 112 (2010) 24–42
Author's personal copy
were carefully debriefed about the goal and the purpose of theexercise, and winners were awarded T-shirts with the Universitylogo.
Measurement approach
Given that some measurement methods are more appropriatefor assessing perceptual constructs such as activated faultlines(e.g., questionnaires; Schwab, 1999) and some are more appropri-ate for assessing behavioral constructs such as coalitions and con-flict (e.g., observational reports, contextual ratings; Schwab, 1999),we included multiple methodologies to develop a valid measure-ment system to test our full model which included both percep-tions and behaviors. In addition, this allowed us to strengthenour examination of construct validity and achieve greater mea-surement accuracy via triangulation of multiple measurementtechniques (Campbell & Fiske, 1959; Runkel & McGrath, 1972).For instance, listening to audiotapes allows a more nuanced andaccurate consideration of verbal responses and reactions (e.g., thetone of voice, sarcasm, humor; Jehn & Shah, 1997), while codingthe transcripts makes it easier to identify ‘‘thought units” (Folger,Hewes, & Poole, 1984; Weingart, 1997; Weldon, Jehn, & Pradhan,1991) and allows for more extensive and deeper cognitive process-ing by the coders as they read and reflect on each thought unit(Krosnick & Alwin, 1987). In contrast, observational reports oftenprovide more consistent assessments across research participants(Schwab, 1999). Research findings in cognitive psychology havefurther shown how different presentation formats of responsealternatives (i.e., visual vs. oral presentation) may guide differentinterpretations, memory biases, and allow for various levels in par-ticipants’ cognitive processing (Harrison, McLaughlin, & Coalter,1996; Krosnick & Alwin, 1987). Thus, as we utilized different for-mats (i.e., listening, reading, watching), we ensured that no valu-able data were lost and, following recommendations in thepsychometric literature (e.g., Ghiselli, Campbell, & Zedeck, 1981;Hinkin, 1998), we were able to develop more accurate and com-plete measures that capture the full domain of our conceptual def-initions and operationalized constructs. We discuss thetriangulation of these multiple methods in our measures and re-sults sections below.
Contextual ratingsIn this measurement methodology, two trained raters who were
unaware of the experimental conditions listened to each group’saudiotape and rated the behavioral constructs under study (weused different raters to code different constructs as per Podsakoff,MacKenzie, Lee, and Podsakoff (2003)). In creating, testing, andimplementing our coding scheme, we have closely followed theWeber protocol (Weber, 1990) (e.g., definition of the coding catego-ries, revision of the coding rules, etc.). Raters were given definitionsof each construct and were asked questions such as ‘‘To what extenthave coalitions formed in this team?” (coalition formation) or ‘‘Howmuch conflict is there in this team?” (conflict). As suggested by Saal,Downey, and Lahey (1980), we further enhanced our coding proce-dure by clearly defining anchor points with a uniform standard ofreference (1 = not at all and 5 = a lot). When raters assigned thescore farther than one point apart, they discussed an issue untilthey reached agreement. One-third of the tapes were coded bytwo raters to provide data for tests of interrater reliability.
Content-analysis of verbatimThis measurement technique involved text analysis of the
audiotapes. First, an individual who was familiar with the partici-pants identified group members within each team on the audio-tapes and checked for accuracy of transcription by randomlyselecting segments from the audiotapes and comparing them with
the transcripts. The results showed that the discussions were accu-rately transcribed. Second, two raters (different coders coded dif-ferent variables as per Podsakoff et al. (2003)) blind tohypotheses and conditions, were trained to segment the group dis-cussion data into ‘‘thought units” (Folger et al., 1984) often definedas ‘‘a sequence of a few words conveying a single thought” (Wel-don et al., 1991). They segmented roughly 30% of all the data to-gether with high reliability (percentage of exactagreement = 97%) and then divided in half the remaining data tounitize independently. They further coded all thought units forcontent categories directly relevant to the proposed research mod-el (Jehn & Shah, 1997): activated faultlines, coalition formation,intragroup conflict, team identification, team entitlement configu-ration, member satisfaction, and perceived group performance. Foreach variable with an exception of activated faultlines (0 = nodemographic-based split and 1 = demographic-based split), thecoders were asked to assign a score on a scale of 1–5 (1 = not atall and 5 = a lot) based on the coded instances. One-third of thetranscripts were coded by two raters to provide data for tests ofinterrater reliability. Although perceptual constructs can be bestmeasured using survey and behavioral variables using behaviorcoding, we collected all variables with all measures for our con-struct validity study (Study 1).
Behavioral observationsThis form of measurement is specifically focused on the behav-
iors of team members. Observers used Structured ObservationalReports to capture behavioral indications of coalition formationand conflict utilizing conversational analysis (Goodwin & Heritage,1990). Conversational analysis is a disciplined way of studying thecommunication within interactional episodes (Ten Have, 1986).The total of six observers were advanced undergraduate studentsworking full-time in an organizational behavior laboratory andwere present during the task to measure behaviors by assessingthe direction of conversation. They received two hours of behav-ioral observation training prior to this study and then weregrouped into two-person teams to observe the actual group inter-actions (different teams were asked to observe different variablesas per Podsakoff et al. (2003), and rate them on a scale from1 = not at all to 5 = a lot). We checked if observers were able to de-tect information relevant to the attribute in the stream of behavior(i.e., conflict, coalitions) by conducting a mock discussion in thelaboratory setting. The results were consistent across observers.These observational reports taken during the studies providedadditional behavioral verification of our audiotape and surveymeasures of coalition formation and conflict (see Table 1).
Experimental questionnaireWe collected self-reports on perceived activated faultlines, coa-
lition formation, conflict, team identification, perceptions of work-group performance, and member satisfaction. The items wereinterspersed to avert contrast, consistency or order effects. Allmeasures were assessed using a 5-point Likert scale with anchorsof 1 (not at all) and 5 (very much).
Objective measures of group performanceGroup performance was assessed by the objective outcome of
the motor task that groups had to perform. This measure wasbased on the height of a tower constructed by a group, given thatthe tower could stand on its own for at least 5 min.
Study 1
In Study 1, we focused on developing the measure of activatedfaultlines, assessing its construct validity, and investigating
K.A. Jehn, K. Bezrukova / Organizational Behavior and Human Decision Processes 112 (2010) 24–42 29
Author's personal copy
whether this measure is distinct from other similar group processconstructs (e.g., coalitions and conflict) to warrant differentiatingamong them. Following Brown et al. (2005), we demonstrate thetrait validity of our constructs through convergent (operationaliza-tions converge with one another) and discriminant (they divergefrom measures of unrelated constructs) validity. In addition, weshow how perceptual constructs such as activated faultlines canbe most effectively measured via survey methodology whereasbehavioral constructs such as coalitions and conflict are best mea-sured based on behavior coding techniques. Groups were formed ineach study using the collected data on participants’ demographicsand entitlement (see more detail in Study 2).
Participants and design
Participants were 253 undergraduate business students work-ing in 65 four-person groups from a private university enrolledin a 12-week course on team functioning. Ten classes participatedin this study and sessions of 4–6 groups were run at different timesto facilitate the observations (no significant differences for any ofthe group process and outcome variables were found among eitherthe different classes or experimental sessions). The mean age of theparticipants was 23 years (range = 17–60 years). The majority ofthe participants (65%) were white; 5% were Asian; 12% were Afri-can Americans; and 18% were Hispanic. Forty-two percent of theparticipants were male.
During the first class session, all participants indicated theirown race, and based on this information, we were able to create33 dormant faultline groups and 32 no dormant faultline groups.Participants were placed into dormant vs. no dormant faultlinegroups based on race (see more detail on experimental procedureand task above) given that race is one of the most visible and so-cially relevant demographic categories (Dovidio, Gaertner, Kawa-kami, & Hodson, 2002; Dovidio, Kawakami, & Gaertner, 2002;Sawyer et al., 2006). We used this assignment to link faultlinesto a specific demographic characteristic (race) based on the origi-nal definition of Lau and Murnighan that faultlines can divide agroup based on one salient attribute (Lau & Murnighan, 1998, p.328; Pearsall et al., 2008); other attributes were held constant(e.g., gender, age). All dormant faultline groups included two dis-tinct subgroups of Caucasians (2–3 members) and non-Caucasiansfollowing the logic of Lau and Murnighan (2005) that Caucasiansare the dominant racial group in North America. Non-Caucasiansubgroups always included a similar race subgroup of Asians, Afri-can Americans, or Hispanics (categories determined by the U.S.Census Bureau (2002)). There were no significant differencesacross the non-Caucasian subgroups on the variables of interestin this construct validity study. Following Sawyer et al. (2006),we included questions to verify that participants accurately per-ceived the racial composition of the group. As a second cross-checkof the effectiveness of the dormant faultline assignment, we askedtwo independent observers to verify the racial composition of thegroup. Both observers indicated participants’ race (e.g., who isWhite and who is Asian) and verified which member(s), if any,were of the same race correctly.
Measures
Activated faultlinesWe assessed activated group faultlines using four survey items
(e.g., ‘‘My team split into subgroups during this exercise based onrace.”, ‘‘My team broke into two groups during this exercise basedon race.” ‘‘My team cracked into smaller cliques based on race dur-ing this exercise.” and ‘‘My team divided into subsets of peoplebased on race during this exercise.”) and we also asked participantsopen-ended questions such as ‘‘If your group split into two groups,
on what characteristic did your team split into subgroups (e.g.,race, gender, major, etc.).” These questionnaire items reflect thecognitive aspect of activated faultlines (group members perceivea division of the group into separate subgroups based on demo-graphic alignment).
Coalition formationWe operationalized coalitions as members’ behaviors that in-
volve joint action to achieve a goal (Thibaut & Kelley, 1959). We as-sessed coalition behavior with three forms of measurement:contextual ratings, content-analysis of verbatim, and behavioralobservations, all anchored on a response scale of 1 (not at all) to5 (a lot). We relied on Cobb’s (1991) content analytic approachto measure coalition formation and Lawler and Youngs’ (1975)measure of perceived utility of alliance in developing our measure-ment approaches. The contextual ratings of the videotape reflectedtwo independent raters’ assessments (Cohen’s j = .69) regardingthe following: ‘‘To what extent have coalitions formed in thisteam?” Content-analysis of coalition formation (rating = 5, a lot)was also reliable (Cohen’s k = .81). For our behavioral observationmeasure, we had two independent raters (different raters from thecontent-analysis coders) score the member behaviors (Cohen’sj = .70) by indicating who worked with whom and answeringthe question: ‘‘Did coalitions form?”
Intragroup conflictWe assessed conflict with three forms of measurement: contex-
tual ratings (Cohen’s j = 1.0), content-analysis of verbatim (Co-hen’s j = .78), and behavioral observations (Cohen’s j = .94), allanchored on a response scale of 1 (not at all) to 5 (a lot). We reliedon Jehn’s (1995) and Jehn and Mannix (2001) items to develop ourmeasurement of conflict.
We collected evidence regarding the validity of our group-levelconstructs based on the intraclass correlation coefficients (ICC[1]s)analysis. We first conducted one-way analysis of variance andfound between-groups variance for all of these variables significantat either the .01 or the .001 level, reflecting dependence betweenthe scores of group members and indicating that the group wasthe appropriate level of analysis. We obtained the following valuesof ICC[1]s: activated faultlines, .41; conflict, .94; and coalitions, .94,and therefore created our group-level variables (Bliese, 2000).
Results
Scale developmentWe followed a number of guidelines in writing items for the
activated faultlines scale. First, using Hinkin’s (1995) deductiveitem-generation strategy, we obtained both published articlesand works in progress studying group faultlines (e.g., Earley &Mosakowski, 2000; Lau & Murnighan, 1998) and thoroughly exam-ined them for clear examples and construct definitions from whichreflective items could be developed. We then developed four itemsand circulated them among colleagues for comments. To providean initial assessment of the factor structure and reliability, wepre-tested these items on a subsample of 32 students (8 groups).In light of the modest sample size, we subjected items to explor-atory factor analysis using principal-factors extraction with obli-que rotation (direct oblimin) (Fabrigar, Wegener, MacCallum, &Strahan, 1999). Only one factor was extracted that accounted for63% of the total variance and Cronbach’s alpha for the scale was.81. We deleted one item (‘‘My team cracked into smaller cliquesduring this exercise.”) that did not load strongly on the factorand showed low item-total correlation.
We further subjected the multiple measures of activated fault-lines, coalitions, and conflict to exploratory factor analysis (Fabri-gar et al., 1999). A principal-factors analysis with oblique
30 K.A. Jehn, K. Bezrukova / Organizational Behavior and Human Decision Processes 112 (2010) 24–42
Author's personal copy
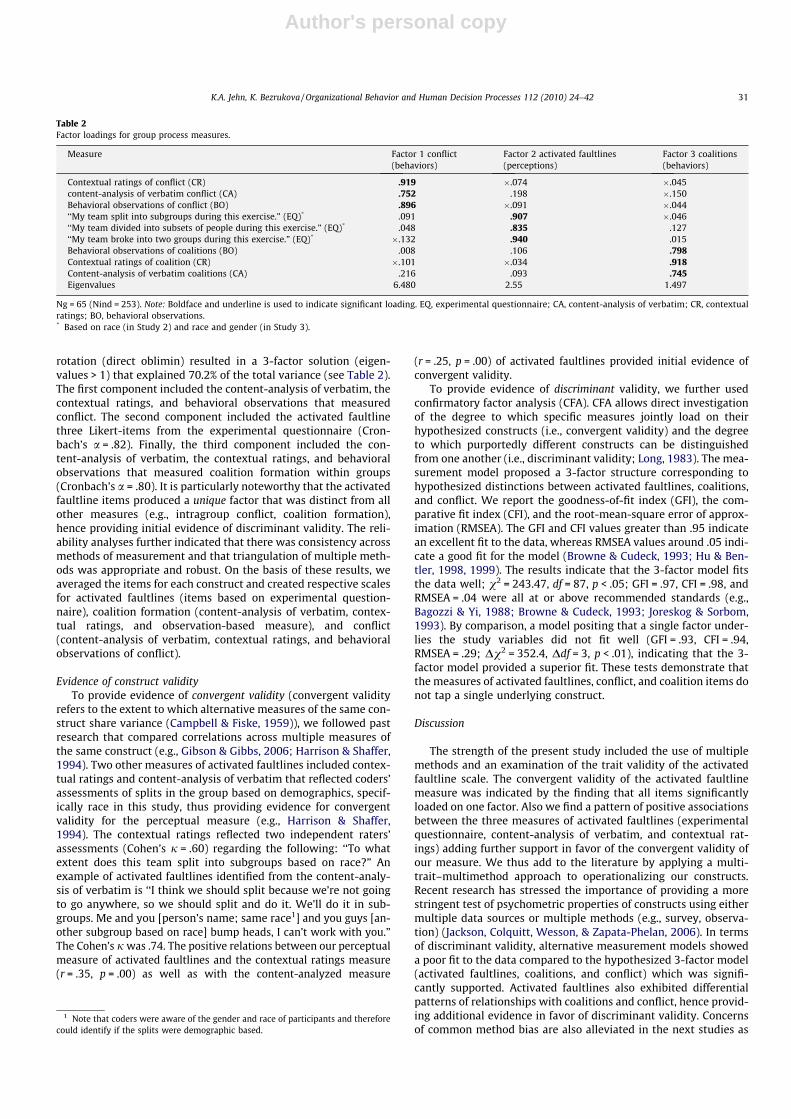
rotation (direct oblimin) resulted in a 3-factor solution (eigen-values > 1) that explained 70.2% of the total variance (see Table 2).The first component included the content-analysis of verbatim, thecontextual ratings, and behavioral observations that measuredconflict. The second component included the activated faultlinethree Likert-items from the experimental questionnaire (Cron-bach’s a = .82). Finally, the third component included the con-tent-analysis of verbatim, the contextual ratings, and behavioralobservations that measured coalition formation within groups(Cronbach’s a = .80). It is particularly noteworthy that the activatedfaultline items produced a unique factor that was distinct from allother measures (e.g., intragroup conflict, coalition formation),hence providing initial evidence of discriminant validity. The reli-ability analyses further indicated that there was consistency acrossmethods of measurement and that triangulation of multiple meth-ods was appropriate and robust. On the basis of these results, weaveraged the items for each construct and created respective scalesfor activated faultlines (items based on experimental question-naire), coalition formation (content-analysis of verbatim, contex-tual ratings, and observation-based measure), and conflict(content-analysis of verbatim, contextual ratings, and behavioralobservations of conflict).
Evidence of construct validityTo provide evidence of convergent validity (convergent validity
refers to the extent to which alternative measures of the same con-struct share variance (Campbell & Fiske, 1959)), we followed pastresearch that compared correlations across multiple measures ofthe same construct (e.g., Gibson & Gibbs, 2006; Harrison & Shaffer,1994). Two other measures of activated faultlines included contex-tual ratings and content-analysis of verbatim that reflected coders’assessments of splits in the group based on demographics, specif-ically race in this study, thus providing evidence for convergentvalidity for the perceptual measure (e.g., Harrison & Shaffer,1994). The contextual ratings reflected two independent raters’assessments (Cohen’s j = .60) regarding the following: ‘‘To whatextent does this team split into subgroups based on race?” Anexample of activated faultlines identified from the content-analy-sis of verbatim is ‘‘I think we should split because we’re not goingto go anywhere, so we should split and do it. We’ll do it in sub-groups. Me and you [person’s name; same race1] and you guys [an-other subgroup based on race] bump heads, I can’t work with you.”The Cohen’s j was .74. The positive relations between our perceptualmeasure of activated faultlines and the contextual ratings measure(r = .35, p = .00) as well as with the content-analyzed measure
(r = .25, p = .00) of activated faultlines provided initial evidence ofconvergent validity.
To provide evidence of discriminant validity, we further usedconfirmatory factor analysis (CFA). CFA allows direct investigationof the degree to which specific measures jointly load on theirhypothesized constructs (i.e., convergent validity) and the degreeto which purportedly different constructs can be distinguishedfrom one another (i.e., discriminant validity; Long, 1983). The mea-surement model proposed a 3-factor structure corresponding tohypothesized distinctions between activated faultlines, coalitions,and conflict. We report the goodness-of-fit index (GFI), the com-parative fit index (CFI), and the root-mean-square error of approx-imation (RMSEA). The GFI and CFI values greater than .95 indicatean excellent fit to the data, whereas RMSEA values around .05 indi-cate a good fit for the model (Browne & Cudeck, 1993; Hu & Ben-tler, 1998, 1999). The results indicate that the 3-factor model fitsthe data well; v2 = 243.47, df = 87, p < .05; GFI = .97, CFI = .98, andRMSEA = .04 were all at or above recommended standards (e.g.,Bagozzi & Yi, 1988; Browne & Cudeck, 1993; Joreskog & Sorbom,1993). By comparison, a model positing that a single factor under-lies the study variables did not fit well (GFI = .93, CFI = .94,RMSEA = .29; Dv2 = 352.4, Ddf = 3, p < .01), indicating that the 3-factor model provided a superior fit. These tests demonstrate thatthe measures of activated faultlines, conflict, and coalition items donot tap a single underlying construct.
Discussion
The strength of the present study included the use of multiplemethods and an examination of the trait validity of the activatedfaultline scale. The convergent validity of the activated faultlinemeasure was indicated by the finding that all items significantlyloaded on one factor. Also we find a pattern of positive associationsbetween the three measures of activated faultlines (experimentalquestionnaire, content-analysis of verbatim, and contextual rat-ings) adding further support in favor of the convergent validity ofour measure. We thus add to the literature by applying a multi-trait–multimethod approach to operationalizing our constructs.Recent research has stressed the importance of providing a morestringent test of psychometric properties of constructs using eithermultiple data sources or multiple methods (e.g., survey, observa-tion) (Jackson, Colquitt, Wesson, & Zapata-Phelan, 2006). In termsof discriminant validity, alternative measurement models showeda poor fit to the data compared to the hypothesized 3-factor model(activated faultlines, coalitions, and conflict) which was signifi-cantly supported. Activated faultlines also exhibited differentialpatterns of relationships with coalitions and conflict, hence provid-ing additional evidence in favor of discriminant validity. Concernsof common method bias are also alleviated in the next studies as
Table 2Factor loadings for group process measures.
Measure Factor 1 conflict(behaviors)
Factor 2 activated faultlines(perceptions)
Factor 3 coalitions(behaviors)
Contextual ratings of conflict (CR) .919 �.074 �.045content-analysis of verbatim conflict (CA) .752 .198 �.150Behavioral observations of conflict (BO) .896 �.091 �.044‘‘My team split into subgroups during this exercise.” (EQ)* .091 .907 �.046‘‘My team divided into subsets of people during this exercise.” (EQ)* .048 .835 .127‘‘My team broke into two groups during this exercise.” (EQ)* �.132 .940 .015Behavioral observations of coalitions (BO) .008 .106 .798Contextual ratings of coalition (CR) �.101 �.034 .918Content-analysis of verbatim coalitions (CA) .216 .093 .745Eigenvalues 6.480 2.55 1.497
Ng = 65 (Nind = 253). Note: Boldface and underline is used to indicate significant loading. EQ, experimental questionnaire; CA, content-analysis of verbatim; CR, contextualratings; BO, behavioral observations.* Based on race (in Study 2) and race and gender (in Study 3).
1 Note that coders were aware of the gender and race of participants and thereforecould identify if the splits were demographic based.
K.A. Jehn, K. Bezrukova / Organizational Behavior and Human Decision Processes 112 (2010) 24–42 31
Author's personal copy
dormant faultlines are the alignment of demographic characteris-tics (assigned to condition), activated faultlines are perceptionsand thus measured with perceptual measurement methods (i.e.,questionnaires), and coalition formation and conflict are conceptu-alized as behaviors and thus, are measured with behavioral indica-tors and not questionnaires.
Study 2
Having described the development and validation of our newmeasure of activated faultlines, in Study 2 we cross-validate themeasure of activated faultlines (and other process variables). Asnoted at the outset, the process of faultline activation remains lar-gely untested, thus our second goal in this study is to provide a firsttest of our theoretical model and hypotheses regarding faultlineactivation and the effects of activated faultlines on conflict, coali-tion, and group outcomes.
Participants and design
Participants were 160 undergraduate business students (40four-person groups) from a private university enrolled in a 12-week course on team functioning. Seven classes participated in thisstudy and sessions of 4–6 groups were run at different times tofacilitate the observations (no significant differences for any ofthe group process and outcome variables were found among eitherstudents’ different classes or experimental sessions). The mean ageof the participants was 22 years (range = 17–60 years). The major-ity of the participants (60%) were white; 8% were Asian; 12% wereAfrican Americans; and 20% were Hispanic. Forty-eight percent ofthe participants were female.
We used a 2 � 2 between-subjects quasi-experimental designcrossing dormant faultlines (groups with dormant faultlines vs.groups with no dormant faultlines) and group entitlement config-uration (2 entitleds vs. groups without such members). Regardingour faultline manipulation, participants were placed into dormantvs. no dormant faultline groups based on race (see more detail onexperimental procedure and task above) given that race is one ofthe most visible and socially relevant demographic categories(Dovidio et al., 2002; Gaertner & Dovidio, 2000; Sawyer et al.,2006). We used this manipulation to provide a clear and simpletest of the faultline activation hypotheses based on the originaldefinition of Lau and Murnighan that faultlines can divide a groupbased on one salient attribute (Lau & Murnighan, 1998, p. 328;Pearsall et al., 2008), especially considering all other attributesare held constant (e.g., gender, age). Given the makeup of racialdemographics available in the class, we were able to create 21 dor-mant faultline groups and 19 no dormant faultline groups. All dor-mant faultline groups included two distinct subgroups ofCaucasians (2 members) and non-Caucasians following the logicof Lau and Murnighan (2005) that Caucasians are the dominant ra-cial group in North America.
The group entitlement configuration was manipulated by plac-ing two members with high entitlement scores (range = 4–5) intogroups or having groups with no entitled members (range = 1–2.5). This was based on the entitlement scores collected one monthbefore the study which resulted in a bimodal distribution(M = 2.17, SD = 1.29; an intermode at 3; Kessing, 2006; Meehl,1992) with the first mode consisting of participants with low levelsof entitlement (range = 1–2.5) and the second mode consisting ofparticipants with high levels of entitlement (range 4–5). In the dor-mant faultline condition, one entitled was in each side of the dor-mant faultline (i.e., 1 entitled Caucasian, 1 entitled non-Caucasian).The 2 � 2 of faultlines and entitled configuration thus created fourcells: (1) dormant faultline no entitleds, (2) dormant faultline 2
entitleds (in opposite race subgroups), (3) no dormant faultlinesand no entitleds, (4) no dormant faultlines and two entitleds. Wealso checked whether participants of a certain race felt more enti-tled than others in general and there were no significant race effect(F(3, 156) = .05, n.s., g2 = .00). All data were further analyzed at thegroup level.
Measures
Process measuresBased on the results of Study 1, we used three survey items to
assess activated faultlines (see Study 1 for more detail on processmeasures). We further measured coalition formation using con-tent-analysis of verbatim (Cohen’s j = .78), contextual ratings (Co-hen’s j = .60), and behavioral observations (Cohen’s j = .71). Wealso assessed conflict using content-analysis of verbatim (Cohen’sj = .75), contextual ratings (Cohen’s j = .90), and behavioral obser-vations (Cohen’s j = .91). All raters were blind to condition andhypotheses.
Team identificationWe assessed team identification with three forms of measure-
ment: content-analysis of verbatim (Cohen’s j = .64), contextualratings (Cohen’s j = .63), and post-experimental questionnaire.We used six survey items based on Brown, Condor, Mathews,Wade, and William’s (1986) scale such as ‘‘It was important tome that others thought highly of my team during this exercise”and ‘‘When someone criticized my team, it felt like a personalinsult.”
Group outcomesWe used a number of different methods to measure team out-
comes. First, we used the objective measure of motor task perfor-mance that was based on the height of the tower constructed bya group. Second, to measure perceived performance we utilizedthe contextual rating (Cohen’s j = .82), content-analysis of verba-tim transcripts (Cohen’s j = .72), and three items from the experi-mental questionnaire that measured perceived group performance(‘‘My team performed very effectively on this exercise,” ‘‘I think myworkgroup, as a whole, performed very well during this exercise,”‘‘My team was very effective at getting things done quickly duringthis exercise.”). Third, we used three items from the experimentalquestionnaire to measure satisfaction (‘‘I was very satisfied work-ing in this team during this exercise,” ‘‘I would like to work withthis team again,” ‘‘I was happy working in this group during thisexercise.”
We created respective scales by taking the mean across mea-sures (each measure was rated on a 5-point Likert scale) for acti-vated faultlines (Cronbach’s a = .91), coalition formation(Cronbach’s a = .80), conflict (Cronbach’s a = .82), identification(Cronbach’s a = .81), and group outcomes (perceived performance;Cronbach’s a = .94, satisfaction: Cronbach’s a = .91) for use in thepresent study. We averaged individual-level scales across groupsto produce group scores of the factors and aggregated them tothe four-person group level, following the procedures describedin Study 1. The values of ICC[1]s were as follow: activated fault-lines, .61; team identification, .63; conflict, .87; satisfaction, .45;group performance, .67; and coalitions, .40. On the basis of theseresults, we concluded that aggregation was justified and createdour group-level variables.
Manipulation checks
Following Sawyer et al. (2006), we included questions to verifythat participants accurately perceived the racial composition of thegroup. All participants indicated their own race and indicated
32 K.A. Jehn, K. Bezrukova / Organizational Behavior and Human Decision Processes 112 (2010) 24–42
Author's personal copy
which member(s), if any, were of the same (or another) race cor-rectly. As a second cross-check of the effectiveness of the faultlinemanipulation, we asked two independent observers to verify theracial composition of the group. Both observers indicated partici-pants’ race (e.g., who is White and who is Asian) and verified whichmember(s), if any, were of the same race correctly. As a final cross-check, we followed Lau and Murnighan’s (2005) procedure byusing the faultline index of Thatcher et al. (2003). The averagefaultline strengths of groups with no dormant and dormant fault-lines were 0 and .98, respectively, the difference between themwas statistically significant, F(1, 36) = 179.51, p < .01, g2 = .86, indi-cating that dormant vs. no dormant faultline manipulation wassuccessful. This manipulation check was not influenced by groupentitlement configuration, F(1, 36) = .07, n.s., g2 = .01, nor by theinteraction between faultlines and entitlement, F(1, 36) = .20, n.s.,g2 = .01.
Regarding the group entitlement configuration manipulationcheck, we adapted the equity sensitivity items based on Sauleyand Bedeian (2000) (e.g., ‘‘I feel I deserve a lot because of who Iam,” Cronbach’s a = .76). Overall, participants in the two entitledmember condition reported higher levels of entitlement(M = 3.10, SD = 1.59) than in the no entitled condition (M = 1.63,SD = .49, F(1, 156) = 46.46, p = .00, g2 = .25). This manipulationcheck was not influenced by faultline condition, F(1, 156) = .23,n.s., g2 = .00, nor by the interaction between faultlines and entitle-ment, F(1, 156) = .01, n.s., g2 = .00. To further check the effective-ness of the manipulation, we have followed Goncalo and Staw’s(2006) procedure and asked two coders blind to the hypothesesto read the verbatim of group discussions from transcribed audio-tapes and code group entitlement configuration. The coders weregiven the definition of entitlement and asked to place each groupmember into a high or low category based on his/her sense of enti-tlement (Cohen’s j = .60). Groups in the two entitled member con-dition were more likely to be coded (Cohen’s j = .80) as having twoentitleds on each side of a faultlines and groups in no entitled con-dition were more likely to be coded as having no entitleds on eachside of a faultlines, v2(1, N = 40) = 6.67, p < .05, effect size indexCramer’s V = .41, hence satisfying the profile of group entitlementconfiguration manipulated. We further conducted a 2 (groups withdormant faultlines vs. groups with no dormant faultlines) � 2group entitlement configuration (2 entitleds vs. groups withoutsuch members) logistic regression on the coders’ scores (see Hartand Van Vugt (2006) for a similar analysis). The entitlement effectwas significant, v2(1, N = 40) = 3.71, p < .05, the Nagelkerke R2
effect size = .21 (Tabachnik & Fidell, 1989). There was no faultline
effect v2(1, N = 40) = .22, n.s., the Nagelkerke R2 effect size = .00nor an interaction, v2(1, N = 40) = .02, n.s., the Nagelkerke R2 effectsize = .11. Taken together, these results suggest that our manipula-tion was successful.
Results and discussion
Cross-validationWe again used CFA to examine the construct validity of our pro-
cess variables. The measurement model proposed a 3-factor struc-ture corresponding to our proposed distinctions between activatedfaultlines, coalition formation, and conflict. The results indicatethat the model fits the data well; v2 = 234.19, df = 87, p < .05;GFI = .97, CFI = .98, and RMSEA = .07 were all at or above recom-mended standards (e.g., Bagozzi & Yi, 1988; Browne & Cudeck,1993; Hu & Bentler, 1998, 1999; Joreskog & Sorbom, 1993).
Hypotheses tests
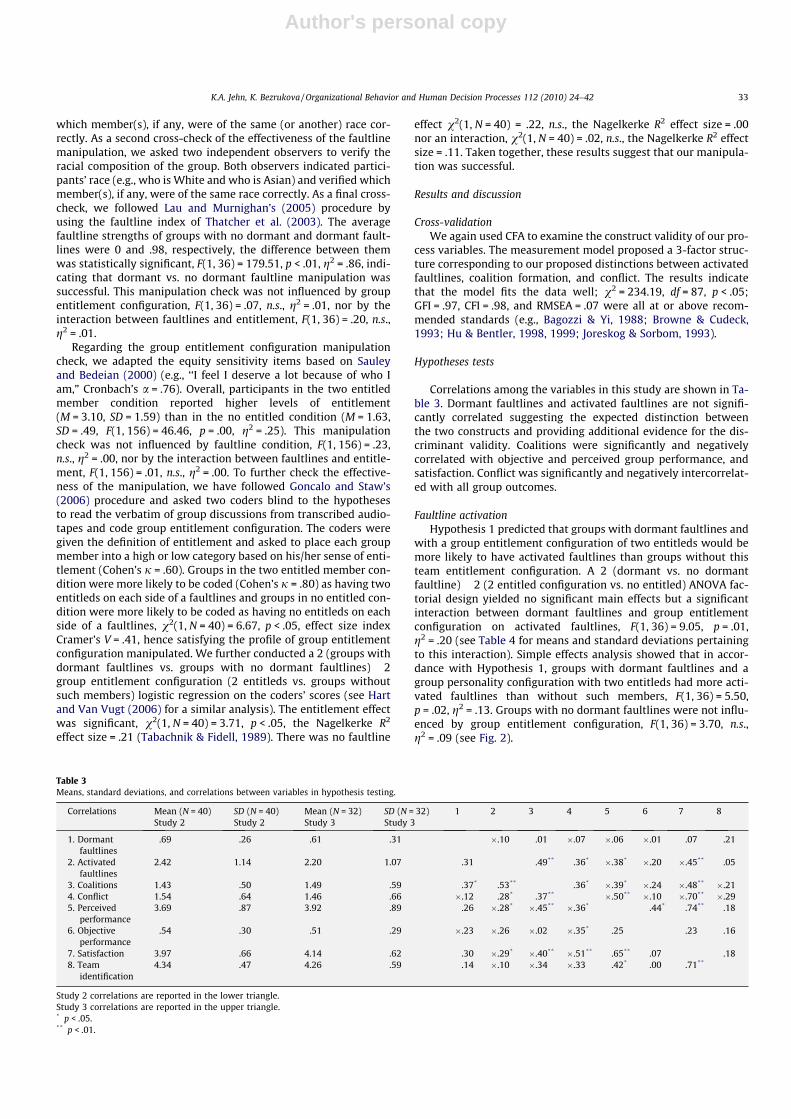
Correlations among the variables in this study are shown in Ta-ble 3. Dormant faultlines and activated faultlines are not signifi-cantly correlated suggesting the expected distinction betweenthe two constructs and providing additional evidence for the dis-criminant validity. Coalitions were significantly and negativelycorrelated with objective and perceived group performance, andsatisfaction. Conflict was significantly and negatively intercorrelat-ed with all group outcomes.
Faultline activationHypothesis 1 predicted that groups with dormant faultlines and
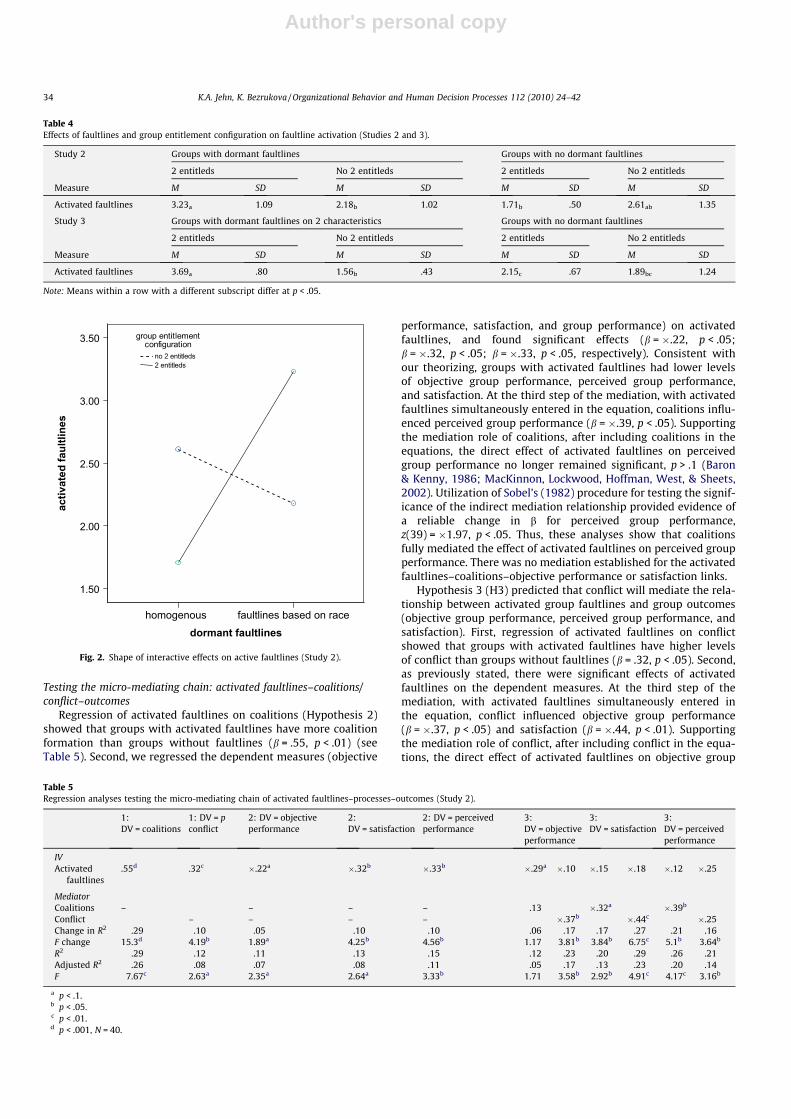
with a group entitlement configuration of two entitleds would bemore likely to have activated faultlines than groups without thisteam entitlement configuration. A 2 (dormant vs. no dormantfaultline) � 2 (2 entitled configuration vs. no entitled) ANOVA fac-torial design yielded no significant main effects but a significantinteraction between dormant faultlines and group entitlementconfiguration on activated faultlines, F(1, 36) = 9.05, p = .01,g2 = .20 (see Table 4 for means and standard deviations pertainingto this interaction). Simple effects analysis showed that in accor-dance with Hypothesis 1, groups with dormant faultlines and agroup personality configuration with two entitleds had more acti-vated faultlines than without such members, F(1, 36) = 5.50,p = .02, g2 = .13. Groups with no dormant faultlines were not influ-enced by group entitlement configuration, F(1, 36) = 3.70, n.s.,g2 = .09 (see Fig. 2).
Table 3Means, standard deviations, and correlations between variables in hypothesis testing.
Correlations Mean (N = 40)Study 2
SD (N = 40)Study 2
Mean (N = 32)Study 3
SD (N = 32)Study 3
1 2 3 4 5 6 7 8
1. Dormantfaultlines
.69 .26 .61 .31 �.10 .01 �.07 �.06 �.01 .07 .21
2. Activatedfaultlines
2.42 1.14 2.20 1.07 .31 .49** .36* �.38* �.20 �.45** .05
3. Coalitions 1.43 .50 1.49 .59 .37* .53** .36* �.39* �.24 �.48** �.214. Conflict 1.54 .64 1.46 .66 �.12 .28* .37** �.50** �.10 �.70** �.295. Perceived
performance3.69 .87 3.92 .89 .26 �.28* �.45** �.36* .44* .74** .18
6. Objectiveperformance
.54 .30 .51 .29 �.23 �.26 �.02 �.35* .25 .23 .16
7. Satisfaction 3.97 .66 4.14 .62 .30 �.29* �.40** �.51** .65** .07 .188. Team
identification4.34 .47 4.26 .59 .14 �.10 �.34 �.33 .42* .00 .71**
Study 2 correlations are reported in the lower triangle.Study 3 correlations are reported in the upper triangle.* p < .05.** p < .01.
K.A. Jehn, K. Bezrukova / Organizational Behavior and Human Decision Processes 112 (2010) 24–42 33
Author's personal copy
Testing the micro-mediating chain: activated faultlines–coalitions/conflict–outcomes
Regression of activated faultlines on coalitions (Hypothesis 2)showed that groups with activated faultlines have more coalitionformation than groups without faultlines (b = .55, p < .01) (seeTable 5). Second, we regressed the dependent measures (objective
performance, satisfaction, and group performance) on activatedfaultlines, and found significant effects (b = �.22, p < .05;b = �.32, p < .05; b = �.33, p < .05, respectively). Consistent withour theorizing, groups with activated faultlines had lower levelsof objective group performance, perceived group performance,and satisfaction. At the third step of the mediation, with activatedfaultlines simultaneously entered in the equation, coalitions influ-enced perceived group performance (b = �.39, p < .05). Supportingthe mediation role of coalitions, after including coalitions in theequations, the direct effect of activated faultlines on perceivedgroup performance no longer remained significant, p > .1 (Baron& Kenny, 1986; MacKinnon, Lockwood, Hoffman, West, & Sheets,2002). Utilization of Sobel’s (1982) procedure for testing the signif-icance of the indirect mediation relationship provided evidence ofa reliable change in b for perceived group performance,z(39) = �1.97, p < .05. Thus, these analyses show that coalitionsfully mediated the effect of activated faultlines on perceived groupperformance. There was no mediation established for the activatedfaultlines–coalitions–objective performance or satisfaction links.
Hypothesis 3 (H3) predicted that conflict will mediate the rela-tionship between activated group faultlines and group outcomes(objective group performance, perceived group performance, andsatisfaction). First, regression of activated faultlines on conflictshowed that groups with activated faultlines have higher levelsof conflict than groups without faultlines (b = .32, p < .05). Second,as previously stated, there were significant effects of activatedfaultlines on the dependent measures. At the third step of themediation, with activated faultlines simultaneously entered inthe equation, conflict influenced objective group performance(b = �.37, p < .05) and satisfaction (b = �.44, p < .01). Supportingthe mediation role of conflict, after including conflict in the equa-tions, the direct effect of activated faultlines on objective group
Table 4Effects of faultlines and group entitlement configuration on faultline activation (Studies 2 and 3).
Study 2 Groups with dormant faultlines Groups with no dormant faultlines
2 entitleds No 2 entitleds 2 entitleds No 2 entitleds
Measure M SD M SD M SD M SD
Activated faultlines 3.23a 1.09 2.18b 1.02 1.71b .50 2.61ab 1.35
Study 3 Groups with dormant faultlines on 2 characteristics Groups with no dormant faultlines
2 entitleds No 2 entitleds 2 entitleds No 2 entitleds
Measure M SD M SD M SD M SD
Activated faultlines 3.69a .80 1.56b .43 2.15c .67 1.89bc 1.24
Note: Means within a row with a different subscript differ at p < .05.
homogenous faultlines based on racedormant faultlines
activ
ated
faul
tline
s
Fig. 2. Shape of interactive effects on active faultlines (Study 2).
Table 5Regression analyses testing the micro-mediating chain of activated faultlines–processes–outcomes (Study 2).
1:DV = coalitions
1: DV = pconflict
2: DV = objectiveperformance
2:DV = satisfaction
2: DV = perceivedperformance
3:DV = objectiveperformance
3:DV = satisfaction
3:DV = perceivedperformance
IVActivated
faultlines.55d .32c �.22a �.32b �.33b �.29a �.10 �.15 �.18 �.12 �.25
MediatorCoalitions – – – – .13 �.32a �.39b
Conflict – – – – �.37b �.44c �.25Change in R2 .29 .10 .05 .10 .10 .06 .17 .17 .27 .21 .16F change 15.3d 4.19b 1.89a 4.25b 4.56b 1.17 3.81b 3.84b 6.75c 5.1b 3.64b
R2 .29 .12 .11 .13 .15 .12 .23 .20 .29 .26 .21Adjusted R2 .26 .08 .07 .08 .11 .05 .17 .13 .23 .20 .14F 7.67c 2.63a 2.35a 2.64a 3.33b 1.71 3.58b 2.92b 4.91c 4.17c 3.16b
a p < .1.b p < .05.c p < .01.d p < .001, N = 40.
34 K.A. Jehn, K. Bezrukova / Organizational Behavior and Human Decision Processes 112 (2010) 24–42
Author's personal copy
performance and satisfaction no longer remained significant, p > .1.Utilization of Sobel’s (1982) procedure for testing the significanceof the indirect mediation relationship provided evidence of a reli-able change in b for conflict with objective group performance,z(39) = �1.66 at p < .1 and satisfaction, z(39) = �1.81, p < .05. Thus,these analyses show partial support for our Hypothesis 3: conflictmediated the effect of activated faultlines on objective group per-formance (at p < .1) and fully mediated the effect of faultlines onsatisfaction.
Moderating role of team identificationAs a test of Hypothesis 4, whether team identification alleviates
the negative effects of activated processes, a series of moderatedregression analyses with coalition formation and conflict as thedependent measures and activated faultlines, team identification,and the activated faultlines by team identification cross-productrevealed significant interactions for coalition formation (b = �.46,p = .01, R2 changed for the interaction .16, F(1, 35) = 9.35, p = .01,and for the overall equation, R2 = .54, F(4, 35) = 7.91, p = .00) andconflict (b = �.58, p = .00, R2 changed for the interaction .25,F(1, 35) = 14.00, p = .00, and for the overall equation, R2 = .51,F(4, 35) = 7.02, p = .00).
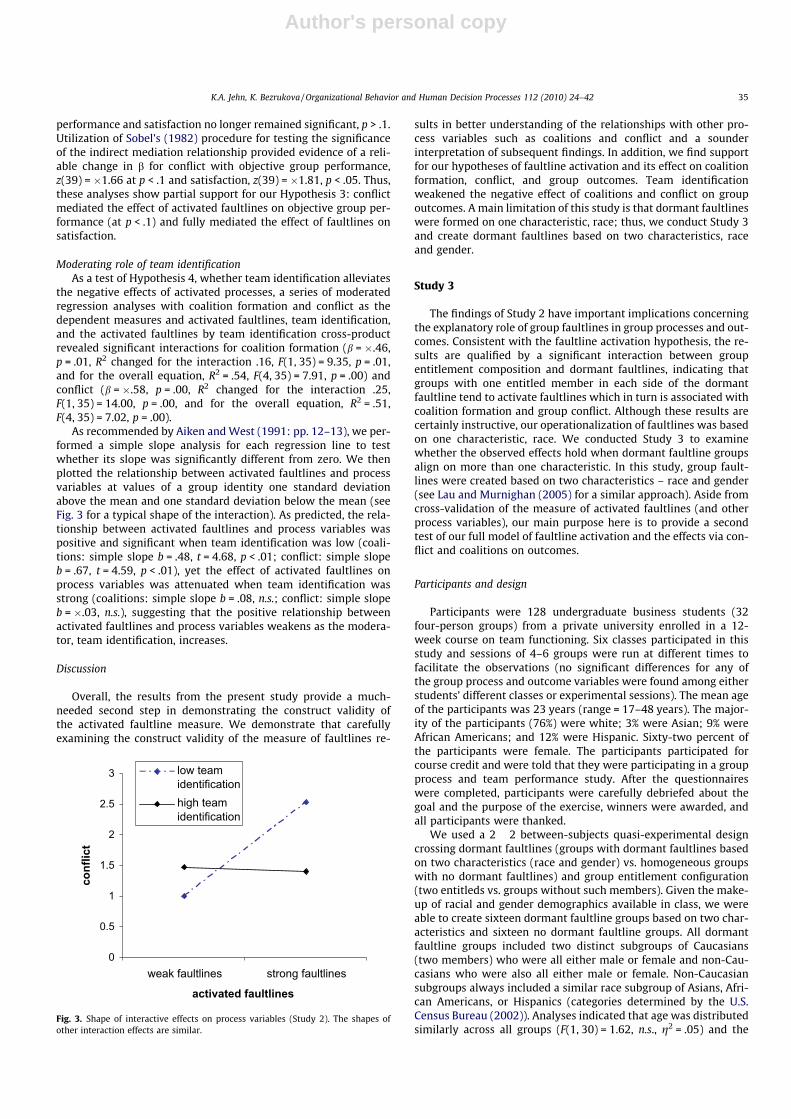
As recommended by Aiken and West (1991: pp. 12–13), we per-formed a simple slope analysis for each regression line to testwhether its slope was significantly different from zero. We thenplotted the relationship between activated faultlines and processvariables at values of a group identity one standard deviationabove the mean and one standard deviation below the mean (seeFig. 3 for a typical shape of the interaction). As predicted, the rela-tionship between activated faultlines and process variables waspositive and significant when team identification was low (coali-tions: simple slope b = .48, t = 4.68, p < .01; conflict: simple slopeb = .67, t = 4.59, p < .01), yet the effect of activated faultlines onprocess variables was attenuated when team identification wasstrong (coalitions: simple slope b = .08, n.s.; conflict: simple slopeb = �.03, n.s.), suggesting that the positive relationship betweenactivated faultlines and process variables weakens as the modera-tor, team identification, increases.
Discussion
Overall, the results from the present study provide a much-needed second step in demonstrating the construct validity ofthe activated faultline measure. We demonstrate that carefullyexamining the construct validity of the measure of faultlines re-
sults in better understanding of the relationships with other pro-cess variables such as coalitions and conflict and a sounderinterpretation of subsequent findings. In addition, we find supportfor our hypotheses of faultline activation and its effect on coalitionformation, conflict, and group outcomes. Team identificationweakened the negative effect of coalitions and conflict on groupoutcomes. A main limitation of this study is that dormant faultlineswere formed on one characteristic, race; thus, we conduct Study 3and create dormant faultlines based on two characteristics, raceand gender.
Study 3
The findings of Study 2 have important implications concerningthe explanatory role of group faultlines in group processes and out-comes. Consistent with the faultline activation hypothesis, the re-sults are qualified by a significant interaction between groupentitlement composition and dormant faultlines, indicating thatgroups with one entitled member in each side of the dormantfaultline tend to activate faultlines which in turn is associated withcoalition formation and group conflict. Although these results arecertainly instructive, our operationalization of faultlines was basedon one characteristic, race. We conducted Study 3 to examinewhether the observed effects hold when dormant faultline groupsalign on more than one characteristic. In this study, group fault-lines were created based on two characteristics – race and gender(see Lau and Murnighan (2005) for a similar approach). Aside fromcross-validation of the measure of activated faultlines (and otherprocess variables), our main purpose here is to provide a secondtest of our full model of faultline activation and the effects via con-flict and coalitions on outcomes.
Participants and design
Participants were 128 undergraduate business students (32four-person groups) from a private university enrolled in a 12-week course on team functioning. Six classes participated in thisstudy and sessions of 4–6 groups were run at different times tofacilitate the observations (no significant differences for any ofthe group process and outcome variables were found among eitherstudents’ different classes or experimental sessions). The mean ageof the participants was 23 years (range = 17–48 years). The major-ity of the participants (76%) were white; 3% were Asian; 9% wereAfrican Americans; and 12% were Hispanic. Sixty-two percent ofthe participants were female. The participants participated forcourse credit and were told that they were participating in a groupprocess and team performance study. After the questionnaireswere completed, participants were carefully debriefed about thegoal and the purpose of the exercise, winners were awarded, andall participants were thanked.
We used a 2 � 2 between-subjects quasi-experimental designcrossing dormant faultlines (groups with dormant faultlines basedon two characteristics (race and gender) vs. homogeneous groupswith no dormant faultlines) and group entitlement configuration(two entitleds vs. groups without such members). Given the make-up of racial and gender demographics available in class, we wereable to create sixteen dormant faultline groups based on two char-acteristics and sixteen no dormant faultline groups. All dormantfaultline groups included two distinct subgroups of Caucasians(two members) who were all either male or female and non-Cau-casians who were also all either male or female. Non-Caucasiansubgroups always included a similar race subgroup of Asians, Afri-can Americans, or Hispanics (categories determined by the U.S.Census Bureau (2002)). Analyses indicated that age was distributedsimilarly across all groups (F(1, 30) = 1.62, n.s., g2 = .05) and the
0
0.5
1
1.5
2
2.5
3
weak faultlines strong faultlines
activated faultlines
conf
lict
low teamidentificationhigh teamidentification
Fig. 3. Shape of interactive effects on process variables (Study 2). The shapes ofother interaction effects are similar.
K.A. Jehn, K. Bezrukova / Organizational Behavior and Human Decision Processes 112 (2010) 24–42 35
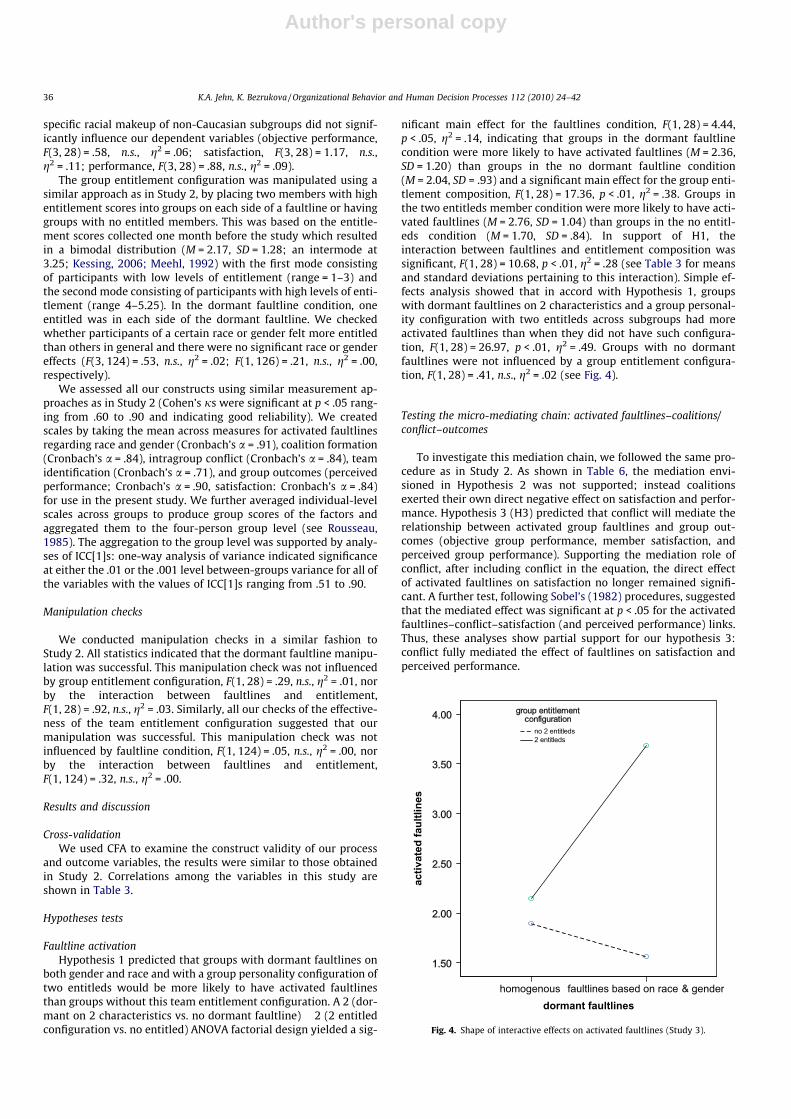
Author's personal copy
specific racial makeup of non-Caucasian subgroups did not signif-icantly influence our dependent variables (objective performance,F(3, 28) = .58, n.s., g2 = .06; satisfaction, F(3, 28) = 1.17, n.s.,g2 = .11; performance, F(3, 28) = .88, n.s., g2 = .09).
The group entitlement configuration was manipulated using asimilar approach as in Study 2, by placing two members with highentitlement scores into groups on each side of a faultline or havinggroups with no entitled members. This was based on the entitle-ment scores collected one month before the study which resultedin a bimodal distribution (M = 2.17, SD = 1.28; an intermode at3.25; Kessing, 2006; Meehl, 1992) with the first mode consistingof participants with low levels of entitlement (range = 1–3) andthe second mode consisting of participants with high levels of enti-tlement (range 4–5.25). In the dormant faultline condition, oneentitled was in each side of the dormant faultline. We checkedwhether participants of a certain race or gender felt more entitledthan others in general and there were no significant race or gendereffects (F(3, 124) = .53, n.s., g2 = .02; F(1, 126) = .21, n.s., g2 = .00,respectively).
We assessed all our constructs using similar measurement ap-proaches as in Study 2 (Cohen’s js were significant at p < .05 rang-ing from .60 to .90 and indicating good reliability). We createdscales by taking the mean across measures for activated faultlinesregarding race and gender (Cronbach’s a = .91), coalition formation(Cronbach’s a = .84), intragroup conflict (Cronbach’s a = .84), teamidentification (Cronbach’s a = .71), and group outcomes (perceivedperformance; Cronbach’s a = .90, satisfaction: Cronbach’s a = .84)for use in the present study. We further averaged individual-levelscales across groups to produce group scores of the factors andaggregated them to the four-person group level (see Rousseau,1985). The aggregation to the group level was supported by analy-ses of ICC[1]s: one-way analysis of variance indicated significanceat either the .01 or the .001 level between-groups variance for all ofthe variables with the values of ICC[1]s ranging from .51 to .90.
Manipulation checks
We conducted manipulation checks in a similar fashion toStudy 2. All statistics indicated that the dormant faultline manipu-lation was successful. This manipulation check was not influencedby group entitlement configuration, F(1, 28) = .29, n.s., g2 = .01, norby the interaction between faultlines and entitlement,F(1, 28) = .92, n.s., g2 = .03. Similarly, all our checks of the effective-ness of the team entitlement configuration suggested that ourmanipulation was successful. This manipulation check was notinfluenced by faultline condition, F(1, 124) = .05, n.s., g2 = .00, norby the interaction between faultlines and entitlement,F(1, 124) = .32, n.s., g2 = .00.
Results and discussion
Cross-validationWe used CFA to examine the construct validity of our process
and outcome variables, the results were similar to those obtainedin Study 2. Correlations among the variables in this study areshown in Table 3.
Hypotheses tests
Faultline activationHypothesis 1 predicted that groups with dormant faultlines on
both gender and race and with a group personality configuration oftwo entitleds would be more likely to have activated faultlinesthan groups without this team entitlement configuration. A 2 (dor-mant on 2 characteristics vs. no dormant faultline) � 2 (2 entitledconfiguration vs. no entitled) ANOVA factorial design yielded a sig-
nificant main effect for the faultlines condition, F(1, 28) = 4.44,p < .05, g2 = .14, indicating that groups in the dormant faultlinecondition were more likely to have activated faultlines (M = 2.36,SD = 1.20) than groups in the no dormant faultline condition(M = 2.04, SD = .93) and a significant main effect for the group enti-tlement composition, F(1, 28) = 17.36, p < .01, g2 = .38. Groups inthe two entitleds member condition were more likely to have acti-vated faultlines (M = 2.76, SD = 1.04) than groups in the no entitl-eds condition (M = 1.70, SD = .84). In support of H1, theinteraction between faultlines and entitlement composition wassignificant, F(1, 28) = 10.68, p < .01, g2 = .28 (see Table 3 for meansand standard deviations pertaining to this interaction). Simple ef-fects analysis showed that in accord with Hypothesis 1, groupswith dormant faultlines on 2 characteristics and a group personal-ity configuration with two entitleds across subgroups had moreactivated faultlines than when they did not have such configura-tion, F(1, 28) = 26.97, p < .01, g2 = .49. Groups with no dormantfaultlines were not influenced by a group entitlement configura-tion, F(1, 28) = .41, n.s., g2 = .02 (see Fig. 4).
Testing the micro-mediating chain: activated faultlines–coalitions/conflict–outcomes
To investigate this mediation chain, we followed the same pro-cedure as in Study 2. As shown in Table 6, the mediation envi-sioned in Hypothesis 2 was not supported; instead coalitionsexerted their own direct negative effect on satisfaction and perfor-mance. Hypothesis 3 (H3) predicted that conflict will mediate therelationship between activated group faultlines and group out-comes (objective group performance, member satisfaction, andperceived group performance). Supporting the mediation role ofconflict, after including conflict in the equation, the direct effectof activated faultlines on satisfaction no longer remained signifi-cant. A further test, following Sobel’s (1982) procedures, suggestedthat the mediated effect was significant at p < .05 for the activatedfaultlines–conflict–satisfaction (and perceived performance) links.Thus, these analyses show partial support for our hypothesis 3:conflict fully mediated the effect of faultlines on satisfaction andperceived performance.
homogenous faultlines based on race & genderdormant faultlines
activ
ated
faul
tline
s
Fig. 4. Shape of interactive effects on activated faultlines (Study 3).
36 K.A. Jehn, K. Bezrukova / Organizational Behavior and Human Decision Processes 112 (2010) 24–42
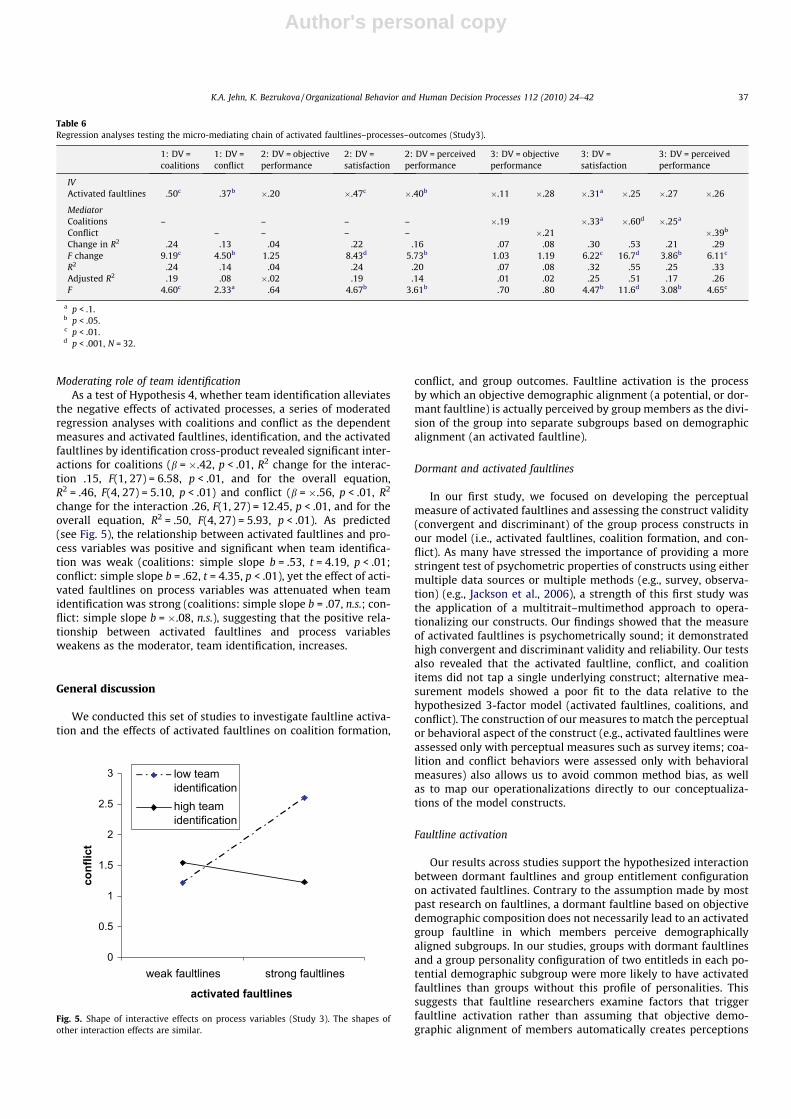
Author's personal copy
Moderating role of team identificationAs a test of Hypothesis 4, whether team identification alleviates
the negative effects of activated processes, a series of moderatedregression analyses with coalitions and conflict as the dependentmeasures and activated faultlines, identification, and the activatedfaultlines by identification cross-product revealed significant inter-actions for coalitions (b = �.42, p < .01, R2 change for the interac-tion .15, F(1, 27) = 6.58, p < .01, and for the overall equation,R2 = .46, F(4, 27) = 5.10, p < .01) and conflict (b = �.56, p < .01, R2
change for the interaction .26, F(1, 27) = 12.45, p < .01, and for theoverall equation, R2 = .50, F(4, 27) = 5.93, p < .01). As predicted(see Fig. 5), the relationship between activated faultlines and pro-cess variables was positive and significant when team identifica-tion was weak (coalitions: simple slope b = .53, t = 4.19, p < .01;conflict: simple slope b = .62, t = 4.35, p < .01), yet the effect of acti-vated faultlines on process variables was attenuated when teamidentification was strong (coalitions: simple slope b = .07, n.s.; con-flict: simple slope b = �.08, n.s.), suggesting that the positive rela-tionship between activated faultlines and process variablesweakens as the moderator, team identification, increases.
General discussion
We conducted this set of studies to investigate faultline activa-tion and the effects of activated faultlines on coalition formation,
conflict, and group outcomes. Faultline activation is the processby which an objective demographic alignment (a potential, or dor-mant faultline) is actually perceived by group members as the divi-sion of the group into separate subgroups based on demographicalignment (an activated faultline).
Dormant and activated faultlines
In our first study, we focused on developing the perceptualmeasure of activated faultlines and assessing the construct validity(convergent and discriminant) of the group process constructs inour model (i.e., activated faultlines, coalition formation, and con-flict). As many have stressed the importance of providing a morestringent test of psychometric properties of constructs using eithermultiple data sources or multiple methods (e.g., survey, observa-tion) (e.g., Jackson et al., 2006), a strength of this first study wasthe application of a multitrait–multimethod approach to opera-tionalizing our constructs. Our findings showed that the measureof activated faultlines is psychometrically sound; it demonstratedhigh convergent and discriminant validity and reliability. Our testsalso revealed that the activated faultline, conflict, and coalitionitems did not tap a single underlying construct; alternative mea-surement models showed a poor fit to the data relative to thehypothesized 3-factor model (activated faultlines, coalitions, andconflict). The construction of our measures to match the perceptualor behavioral aspect of the construct (e.g., activated faultlines wereassessed only with perceptual measures such as survey items; coa-lition and conflict behaviors were assessed only with behavioralmeasures) also allows us to avoid common method bias, as wellas to map our operationalizations directly to our conceptualiza-tions of the model constructs.
Faultline activation
Our results across studies support the hypothesized interactionbetween dormant faultlines and group entitlement configurationon activated faultlines. Contrary to the assumption made by mostpast research on faultlines, a dormant faultline based on objectivedemographic composition does not necessarily lead to an activatedgroup faultline in which members perceive demographicallyaligned subgroups. In our studies, groups with dormant faultlinesand a group personality configuration of two entitleds in each po-tential demographic subgroup were more likely to have activatedfaultlines than groups without this profile of personalities. Thissuggests that faultline researchers examine factors that triggerfaultline activation rather than assuming that objective demo-graphic alignment of members automatically creates perceptions
Table 6Regression analyses testing the micro-mediating chain of activated faultlines–processes–outcomes (Study3).
1: DV =coalitions
1: DV =conflict
2: DV = objectiveperformance
2: DV =satisfaction
2: DV = perceivedperformance
3: DV = objectiveperformance
3: DV =satisfaction
3: DV = perceivedperformance
IVActivated faultlines .50c .37b �.20 �.47c �.40b �.11 �.28 �.31a �.25 �.27 �.26
MediatorCoalitions – – – – �.19 �.33a �.60d �.25a
Conflict – – – – �.21 �.39b
Change in R2 .24 .13 .04 .22 .16 .07 .08 .30 .53 .21 .29F change 9.19c 4.50b 1.25 8.43d 5.73b 1.03 1.19 6.22c 16.7d 3.86b 6.11c
R2 .24 .14 .04 .24 .20 .07 .08 .32 .55 .25 .33Adjusted R2 .19 .08 �.02 .19 .14 .01 .02 .25 .51 .17 .26F 4.60c 2.33a .64 4.67b 3.61b .70 .80 4.47b 11.6d 3.08b 4.65c
a p < .1.b p < .05.c p < .01.d p < .001, N = 32.
0
0.5
1
1.5
2
2.5
3
weak faultlines strong faultlines
activated faultlines
conf
lict
low teamidentificationhigh teamidentification
Fig. 5. Shape of interactive effects on process variables (Study 3). The shapes ofother interaction effects are similar.
K.A. Jehn, K. Bezrukova / Organizational Behavior and Human Decision Processes 112 (2010) 24–42 37
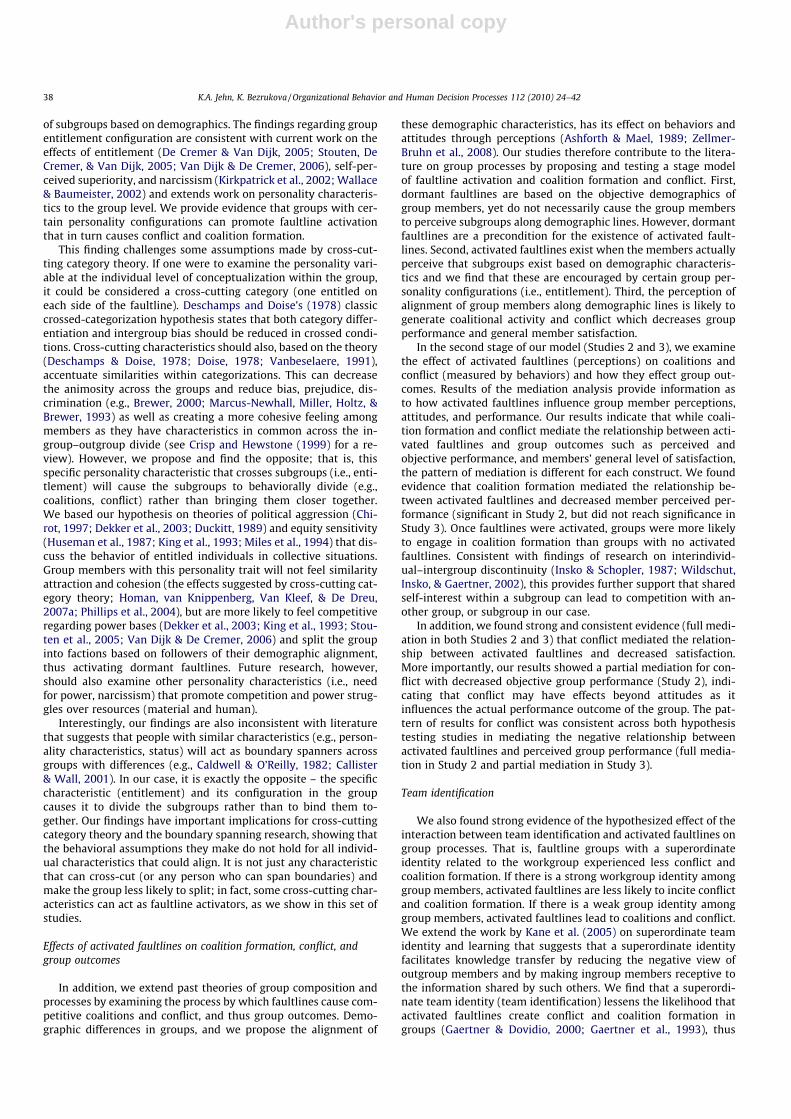
Author's personal copy
of subgroups based on demographics. The findings regarding groupentitlement configuration are consistent with current work on theeffects of entitlement (De Cremer & Van Dijk, 2005; Stouten, DeCremer, & Van Dijk, 2005; Van Dijk & De Cremer, 2006), self-per-ceived superiority, and narcissism (Kirkpatrick et al., 2002; Wallace& Baumeister, 2002) and extends work on personality characteris-tics to the group level. We provide evidence that groups with cer-tain personality configurations can promote faultline activationthat in turn causes conflict and coalition formation.
This finding challenges some assumptions made by cross-cut-ting category theory. If one were to examine the personality vari-able at the individual level of conceptualization within the group,it could be considered a cross-cutting category (one entitled oneach side of the faultline). Deschamps and Doise’s (1978) classiccrossed-categorization hypothesis states that both category differ-entiation and intergroup bias should be reduced in crossed condi-tions. Cross-cutting characteristics should also, based on the theory(Deschamps & Doise, 1978; Doise, 1978; Vanbeselaere, 1991),accentuate similarities within categorizations. This can decreasethe animosity across the groups and reduce bias, prejudice, dis-crimination (e.g., Brewer, 2000; Marcus-Newhall, Miller, Holtz, &Brewer, 1993) as well as creating a more cohesive feeling amongmembers as they have characteristics in common across the in-group–outgroup divide (see Crisp and Hewstone (1999) for a re-view). However, we propose and find the opposite; that is, thisspecific personality characteristic that crosses subgroups (i.e., enti-tlement) will cause the subgroups to behaviorally divide (e.g.,coalitions, conflict) rather than bringing them closer together.We based our hypothesis on theories of political aggression (Chi-rot, 1997; Dekker et al., 2003; Duckitt, 1989) and equity sensitivity(Huseman et al., 1987; King et al., 1993; Miles et al., 1994) that dis-cuss the behavior of entitled individuals in collective situations.Group members with this personality trait will not feel similarityattraction and cohesion (the effects suggested by cross-cutting cat-egory theory; Homan, van Knippenberg, Van Kleef, & De Dreu,2007a; Phillips et al., 2004), but are more likely to feel competitiveregarding power bases (Dekker et al., 2003; King et al., 1993; Stou-ten et al., 2005; Van Dijk & De Cremer, 2006) and split the groupinto factions based on followers of their demographic alignment,thus activating dormant faultlines. Future research, however,should also examine other personality characteristics (i.e., needfor power, narcissism) that promote competition and power strug-gles over resources (material and human).
Interestingly, our findings are also inconsistent with literaturethat suggests that people with similar characteristics (e.g., person-ality characteristics, status) will act as boundary spanners acrossgroups with differences (e.g., Caldwell & O’Reilly, 1982; Callister& Wall, 2001). In our case, it is exactly the opposite – the specificcharacteristic (entitlement) and its configuration in the groupcauses it to divide the subgroups rather than to bind them to-gether. Our findings have important implications for cross-cuttingcategory theory and the boundary spanning research, showing thatthe behavioral assumptions they make do not hold for all individ-ual characteristics that could align. It is not just any characteristicthat can cross-cut (or any person who can span boundaries) andmake the group less likely to split; in fact, some cross-cutting char-acteristics can act as faultline activators, as we show in this set ofstudies.
Effects of activated faultlines on coalition formation, conflict, andgroup outcomes
In addition, we extend past theories of group composition andprocesses by examining the process by which faultlines cause com-petitive coalitions and conflict, and thus group outcomes. Demo-graphic differences in groups, and we propose the alignment of
these demographic characteristics, has its effect on behaviors andattitudes through perceptions (Ashforth & Mael, 1989; Zellmer-Bruhn et al., 2008). Our studies therefore contribute to the litera-ture on group processes by proposing and testing a stage modelof faultline activation and coalition formation and conflict. First,dormant faultlines are based on the objective demographics ofgroup members, yet do not necessarily cause the group membersto perceive subgroups along demographic lines. However, dormantfaultlines are a precondition for the existence of activated fault-lines. Second, activated faultlines exist when the members actuallyperceive that subgroups exist based on demographic characteris-tics and we find that these are encouraged by certain group per-sonality configurations (i.e., entitlement). Third, the perception ofalignment of group members along demographic lines is likely togenerate coalitional activity and conflict which decreases groupperformance and general member satisfaction.
In the second stage of our model (Studies 2 and 3), we examinethe effect of activated faultlines (perceptions) on coalitions andconflict (measured by behaviors) and how they effect group out-comes. Results of the mediation analysis provide information asto how activated faultlines influence group member perceptions,attitudes, and performance. Our results indicate that while coali-tion formation and conflict mediate the relationship between acti-vated faultlines and group outcomes such as perceived andobjective performance, and members’ general level of satisfaction,the pattern of mediation is different for each construct. We foundevidence that coalition formation mediated the relationship be-tween activated faultlines and decreased member perceived per-formance (significant in Study 2, but did not reach significance inStudy 3). Once faultlines were activated, groups were more likelyto engage in coalition formation than groups with no activatedfaultlines. Consistent with findings of research on interindivid-ual–intergroup discontinuity (Insko & Schopler, 1987; Wildschut,Insko, & Gaertner, 2002), this provides further support that sharedself-interest within a subgroup can lead to competition with an-other group, or subgroup in our case.
In addition, we found strong and consistent evidence (full medi-ation in both Studies 2 and 3) that conflict mediated the relation-ship between activated faultlines and decreased satisfaction.More importantly, our results showed a partial mediation for con-flict with decreased objective group performance (Study 2), indi-cating that conflict may have effects beyond attitudes as itinfluences the actual performance outcome of the group. The pat-tern of results for conflict was consistent across both hypothesistesting studies in mediating the negative relationship betweenactivated faultlines and perceived group performance (full media-tion in Study 2 and partial mediation in Study 3).
Team identification
We also found strong evidence of the hypothesized effect of theinteraction between team identification and activated faultlines ongroup processes. That is, faultline groups with a superordinateidentity related to the workgroup experienced less conflict andcoalition formation. If there is a strong workgroup identity amonggroup members, activated faultlines are less likely to incite conflictand coalition formation. If there is a weak group identity amonggroup members, activated faultlines lead to coalitions and conflict.We extend the work by Kane et al. (2005) on superordinate teamidentity and learning that suggests that a superordinate identityfacilitates knowledge transfer by reducing the negative view ofoutgroup members and by making ingroup members receptive tothe information shared by such others. We find that a superordi-nate team identity (team identification) lessens the likelihood thatactivated faultlines create conflict and coalition formation ingroups (Gaertner & Dovidio, 2000; Gaertner et al., 1993), thus
38 K.A. Jehn, K. Bezrukova / Organizational Behavior and Human Decision Processes 112 (2010) 24–42

Author's personal copy
acting as a positive force in workgroups. Therefore, even in groupswith activated faultlines, the team identification can assist thegroup in maintaining constructive group processes or avoidingprocess losses due to activated faultlines via the united group feel-ing toward a common goal that such an identity can create(Thatcher & Zhu, 2006; Van Vugt & Hart, 2004).
Limitations
There are a number of limitations to this study that should beconsidered and could point to directions for future research. First,our design includes relatively small-scale laboratory experiments,which challenges external validity, as does the short-term natureof our studies (Kelly & McGrath, 1988), and thus future researchshould examine this model in an organizational setting over time.However, this allowed us to put together groups for study withspecific demographic profiles, which is often not possible in orga-nizations. In addition, our findings regarding team identificationwere not based on experimental manipulations, and thus thesefinding should be verified in future studies.
In Study 2, we examined faultlines based on one demographiccharacteristic (race); therefore, our manipulation of dormant fault-lines was the most conservative case described by Lau and Murni-ghan (1998). In Study 3, we replicated our findings with thedormant faultline groups based on two characteristics (race andgender). It may be that dormant faultlines based on an alignmentof an even greater number of demographic characteristics mayprovide a more clear dividing line for activation to occur. Whilethe range of faultline strength measured in these studies is consis-tent with the scores of studies that use multiple characteristics tomeasure objective faultlines (e.g., Lau & Murnighan, 2005; Sawyeret al., 2006), this may be due to the characteristics selected (race,gender), given that race and gender are two of the most visibleand socially relevant demographic categories (Deaux & Emswiller,1974; Dovidio et al., 2002).
Another related limitation is the potential confound of statusdifferences as they are inherent in many social categories such asrace or gender (Bunderson, 2003; Sidanius & Pratto, 1999). It is rea-sonable to expect that different racial groups may introduce anadditional source of systematic variance. For example, social dom-inance theory (cf. Sidanius & Pratto, 1999) suggests that groupmembers share a schema that cognitively constructs other out-group members in a hierarchy by agreeing what groups are to bekept at a greater distance than others (Hagendoorn, 1995; Mullick& Hraba, 2001). Research further suggests that group membersconstruct social representations based on relative distances ofdemographic attributes (e.g., Hraba, 1989; Hraba, Radloff, &Gray-Ray, 1999). This argument suggests that our non-Caucasianssubgroups may differ across the groups in the dormant faultlinecondition. While non-Caucasian subgroups always included a sim-ilar race subgroup of Asians, African Americans, or Hispanics (cat-egories determined by the U.S. Census Bureau (2002)), and did notsignificantly influence our dependent variables, given the rich the-ory of differences in race (cf. Roth, Bevier, Bobko, Switzer, and Tyler(2001), also see a special issue in American Psychologist, Andersonand Nickerson (2005)), this could limit our findings.
Future research
We investigated one possible factor than can activate dormantfaultlines to become activated faultlines, but it is likely there areother triggers that should be investigated. Future work might focuson different attributes that members can align on (e.g., other per-sonality characteristics; Molleman, 2005). For example, researchon psychological contracts (e.g., Raja et al., 2004), surface- anddeep-level diversity (Harrison et al., 1998, 2002), and leadership
(e.g., Premeaux & Bedeian, 2003) indicates different effects of per-sonality characteristics in organizational settings. In addition, fu-ture research should investigate when demographiccharacteristics are aligned with entitlement (e.g., all whites areentitled, all blacks are not). It is possible, that as time passes, mem-bers of faultline subgroups initially formed based on demographiccharacteristics may also discover similarities or differences alongdeeper level attributes such as personality (e.g., Harrison et al.,2002; Molleman, 2005).
Another interesting direction for future research is to examinepositive rather than negative activators. In our study we investi-gated the group entitlement configuration as a negative activator;that is, as a negative force, pulling subgroups apart in a competi-tive, noncooperative way inducing conflict and competitive coali-tion formation. However, there may also be positive activators;that is, factors that make diversity or subgroups salient (i.e., open-ness norms, positive diversity beliefs; e.g., Homan, van Knippen-berg, Van Kleef, & De Dreu, 2007b) but in a way that encouragescommunication and cooperation across subgroups. This way,members have social support based on demographic similarity,but feel comfortable interacting with those of the other subgroupto reach superior outcomes for their common-goal group. Positiveactivation mechanisms may emphasize the advantages of demo-graphic-based subgroups (e.g., support within the subgroup tovoice opinions, differing opinions based on differences across sub-groups) and these forces will promote constructive processes ingroups.
In conclusion, in this research we distinguish between dormantvs. activated faultlines, theorizing that the objective demographiccharacteristics that members may align on, while present, are notautomatically noticed by group members and thus do not neces-sarily become activated such that group members perceive thisalignment. In fact, we propose that certain characteristics of thegroup members and the profile of these personality characteristicswithin the group activate dormant faultlines into activated fault-lines, or the actual perception of member that these subgroups ex-ist based on demographic characteristics. Once activated, faultlinescan lead to negative group behaviors (conflict and coalition forma-tion) that hinder member satisfaction and group performance.However, the news is not all bad. Team identification can reducethe negative effect of activated faultlines by providing memberswith a shared common identity regarding the workgroup that facil-itates work focus and completion.
References
Aiken, L. S., & West, S. G. (1991). Multiple regression: Testing and interpretinginteractions. Newbury Park, CA: Sage.
Amason, A. C., & Mooney, A. C. (1999). The effects of past performance on topmanagement team conflict in strategic decision making. International Journal ofConflict Management, 10, 340–359.
Anderson, N., & Nickerson, K. J. (2005). Genes, race, and psychology in the genomeera: An introduction. American Psychologist, 60(1), 5–8.
Ashforth, B. E., & Johnson, S. A. (2001). Which hat to wear? The relative salience ofmultiple identities in organizational contexts. In M. A. Hogg & D. J. Terry (Eds.),Social identity processes in organizational contexts (pp. 31–48). Philadelphia, PA:Psychology Press.
Ashforth, B. E., & Mael, F. (1989). Social identity theory and the organization.Academy of Management Review, 14(1), 20–39.
Bagozzi, R. P., & Yi, Y. (1988). On the evaluation of structural equation models.Journal of the Academy of Marketing Science, 16, 74–94.
Baron, R. M., & Kenny, D. A. (1986). The moderator mediator variable distinction insocial psychological research: Conceptual, strategic, and statisticalconsiderations. Journal of Personality and Social Psychology, 51(6), 1173–1182.
Barrick, M. R., Stewart, G. L., Neubert, M. J., & Mount, M. K. (1998). Relating memberability and personality to work-team processes and team effectiveness. Journalof Applied Psychology, 83, 377–391.
Barry, B., & Stewart, G. L. (1997). Composition, process and performance in self-managed groups: The role of personality. Journal of Applied Psychology, 82,62–78.
K.A. Jehn, K. Bezrukova / Organizational Behavior and Human Decision Processes 112 (2010) 24–42 39
Author's personal copy
Baumeister, R. F., Smart, L., & Boden, J. M. (1996). Relation of threatened egotism toviolence and aggression: The dark side of self-esteem. Psychological Review, 103,5–33.
Bhappu, A. D., Griffith, T. L., & Northcraft, G. B. (1997). Media effects andcommunication bias in diverse groups. Organizational Behavior and HumanDecision Processes, 70(3), 199–205.
Blakely, G. L., Andrews, M. C., & Moorman, R. H. (2005). The moderating effects ofequity sensitivity on the relationship between organizational justice andorganizational citizenship behaviors. Journal of Business and Psychology, 20(2),259–273.
Bliese, P. D. (2000). Within-group agreement, non-interdependence, and reliability:Implications for data aggregation and analysis. In K. J. Klein & S. W. J. Kozlowski(Eds.), Multilevel theory, research, and methods in organizations (pp. 349–381).San Francisco, CA: Jossey-Bass.
Brewer, M. B. (1995). Managing diversity: The role of social identities. In S. E.Jackson & M. N. Ruderman (Eds.), Diversity in work teams: Research paradigms fora changing workplace (pp. 47–68). American Psychological Association.
Brewer, M. B. (1996). When contact is not enough: Social identity and intergroupcooperation. International Journal of Intercultural Relations, 20, 291–303.
Brewer, M. B. (2000). Reducing prejudice through cross-categorization: Effects ofmultiple social identities. In S. Oskamp (Ed.), Reducing prejudice anddiscrimination (pp. 165–183). Mahwah, NJ: Lawrence Erlbaum.
Brewer, M. B., & Gardner, W. (1996). Who is this ’’we’’? Levels of collective identityand self representations. Journal of Personality and Social Psychology, 71(1),83–93.
Brown, R., Condor, S., Mathews, A., Wade, G., & Williams, J. (1986). Explainingintergroup differentiation in an industrial organization. Journal of OccupationalPsychology, 59, 273–286.
Brown, M. E., Trevino, L. K., & Harrison, D. A. (2005). Ethical leadership: A sociallearning perspective for construct development and testing. OrganizationalBehavior and Human Decision Processes, 97, 117–134.
Browne, M. W., & Cudeck, R. (1993). Alternative ways of assessing model fit. In K. A.Bollen & J. S. Long (Eds.), Testing structural equation models (pp. 136–162).Thousand Oaks, CA: Sage.
Bunderson, J. S. (2003). Recognizing and utilizing expertise in work groups: A statuscharacteristics perspective. Administrative Science Quarterly, 48(4), 557–591.
Byrne, D. (1971). The attraction paradigm. New York, NY: Academic Press.Caldwell, D. F., & O’Reilly, C. A. (1982). Boundary spanning and individual
performance: The impact of self-monitoring. Journal of Applied Psychology,67(1), 124–127.
Callister, R. R., & Wall, J. A. (2001). Conflict across organizational boundaries:Managed care organizations versus health care providers. Journal of AppliedPsychology, 86(4), 754–763.
Campbell, D. T. (1960). Recommendations for APA test standards regardingconstruct, trait, or discriminant validity. American Psychologist, 15, 546–553.
Campbell, D. T., & Fiske, D. W. (1959). Convergent and discriminant validation bythe multitrait–multimethod matrix. Psychological Bulletin, 56, 81–105.
Carnevale, P. J., & Probst, T. M. (1998). Social values and social conflict in creativeproblem solving and categorization. Journal of Personality and Social Psychology,74(5), 1300–1309.
Chirot, D. (1997). Some propositions, lessons, and predictions about tyranny. Moderntyrants: The power and prevalence of evil in our age. New York, NY: Free Press.
Cobb, A. T. (1991). Toward the study of organizational coalitions: Participantconcerns and activities in a simulated organizational setting. Human Relations,44(10), 1057–1079.
Colquitt, J. A. (2004). Does the justice of one interact with the justice of many?Reactions to procedural justice in teams. Journal of Applied Psychology, 89(4),633–646.
Colquitt, J. A., & Jackson, C. L. (2006). Justice in teams: The context sensitivity ofjustice rules across individual and team contexts. Journal of Applied SocialPsychology, 36(4), 868–899.
Cook, T. D., Campbell, D. T., & Peracchio, L. (1990). Quasi experimentation (2nd ed..In Marvin D. Dunnette & Leaetta M. Hough (Eds.). Handbook of industrial andorganizational psychology (vol. 1, pp. 491–576). Palo Alto, CA: ConsultingPsychologists Press, Inc..
Cramton, C. D., & Hinds, P. J. (2005). Subgroup dynamics in internationallydistributed teams: Ethnocentrism or cross-national learning? In B. Staw & R.Kramer (Eds.), Research in organizational behavior. Vol. 26 (pp. 231–263). Oxford,UK: Elsevier Science Inc..
Crisp, R. J., & Hewstone, M. (1999). Differential evaluation of crossed categorygroups: Patterns, processes, and reducing intergroup bias. Group Processes &Intergroup Relations, 2(4), 307–333.
Cunningham, G. B. (2007). Perceptions as reality: The influence of actual andperceived demographic dissimilarity. Journal of Business Psychology, 22(1),79–89.
De Cremer, D., & Van Dijk, E. (2005). When and why leaders put themselves first:Leader behaviour in resource allocations as a function of feeling entitled.European Journal of Social Psychology, 35, 553–563.
De Dreu, C. K. W., & Weingart, L. R. (2003). Task versus relationship conflict, teamperformance, and team member satisfaction: A meta-analysis. Journal of AppliedPsychology, 88(4), 741–749.
Deaux, K., & Emswiller, T. (1974). Explanations for successful performance on sex-linked tasks: What is skill for the male is luck for the female. Journal ofPersonality and Social Psychology, 29, 80–85.
Dekker, H., Malova, D., & Hoogendoorn, S. (2003). Nationalism and its explanations.Political Psychology, 24, 345–376.
Deschamps, J. C., & Doise, W. (1978). Crossed category membership in intergrouprelations. In H. Tajfel (Ed.), Differentiation between social groups (pp. 141–158).London, UK: Academic Press.
Doise, W. (1978). Groups and individuals: Explanations in social psychology.Cambridge: Cambridge University Press.
Dovidio, J. F., Gaertner, S. L., Kawakami, K., & Hodson, G. (2002). Why can’t we justget along? Interpersonal biases and interracial distrust. Cultural Diversity andEthnic Psychology, 8(2), 88–102.
Dovidio, J. F., Kawakami, K., & Gaertner, S. L. (2002). Implicit and explicit prejudiceand interracial interaction. Journal of Personality and Social Psychology, 82, 62–68.
Duckitt, J. (1989). Authoritarism and group identification: A new view of an oldconstruct. Political Psychology, 10, 63–84.
Earley, P. C., & Mosakowski, E. (2000). Creating hybrid team cultures: An empiricaltest of transnational team functioning. Academy of Management Journal, 43(1),26–49.
Eisenhardt, K., & Bourgeois, L. (1988). Politics of strategic decision making in high-velocity environments: Toward a midrange theory. Academy of ManagementJournal, 31, 737–770.
Ellemers, N., De Gilder, D., & Haslam, S. A. (2004). Motivating individuals and groupsat work: A social identity perspective on leadership and group performance.Academy of Management Review, 29, 459–478.
Fabrigar, L. R., Wegener, D. T., MacCallum, R. C., & Strahan, E. J. (1999). Evaluatingthe use of exploratory factor analysis in psychological research. PsychologicalMethods, 4, 272–299.
Folger, J. P., Hewes, D. E., & Poole, M. S. (1984). Coding social interaction. In B. Dervin& M. J. Voight (Eds.), Progress in communication sciences (pp. 115–161).Norwood, NJ: Ablex.
Gaertner, S. L., & Dovidio, J. F. (2000). Reducing intergroup bias: The common ingroupidentity model. Philadelphia, PA: The Psychology Press.
Gaertner, S. L., Dovidio, J. F., Anastasio, P. A., Bachman, B. A., & Rust, M. C. (1993). Thecommon ingroup identity model: Recategorization and the reduction ofintergroup bias. In W. Stroebe & M. Hewstone (Eds.). European review ofsocial psychology (Vol. 4, pp. 1–26). New York, NY: Wiley.
Gaertner, S. L., Dovidio, J. F., Nier, J. A., Ward, C. M., & Banker, B. S. (1999). Acrosscultural divides: The value of a superordinate identity. In D. Prentice & D. Miller(Eds.), Cultural divides: Understanding and overcoming group conflict(pp. 173–212). New York: Russell Sage.
Garcia-Prieto, P., Bellard, E., & Schneider, S. C. (2003). Experiencing diversity,conflict, and emotions in teams. Applied Psychology: An International Review, 52,413–440.
Ghiselli, E. E., Campbell, J. P., & Zedeck, S. (1981). Measurement theory for thebehavioral sciences. San Francisco, CA: W.H. Freeman.
Gibson, C. B., & Gibbs, J. L. (2006). Unpacking the concept of virtuality: The effects ofgeographical dispersion, electronic dependence, dynamic structure, andnational diversity on team innovation.
Gibson, C., & Vermeulen, F. (2003). A healthy divide: Subgroups as a stimulus forteam learning behavior. Administrative Science Quarterly, 48, 202–239.
Goncalo, J. A., & Staw, B. M. (2006). Individualism–collectivism and group creativity.Organizational Behavior and Human Decision Processes, 100(1), 96–109.
Goodwin, C., & Heritage, J. (1990). Conversation analysis. Annual Review ofAnthropology, 19, 283–307.
Grienberger, I. V., Rutte, C. G., & van Knippenberg, A. F. M. (1997). Influence of socialcomparisons of outcomes and procedures on fairness judgments. Journal ofApplied Psychology, 82(6), 913–919.
Hagendoorn, L. (1995). Intergroup biases in multiple group systems: The perceptionof ethnic hierarchies. In W. Stroebe & M. Hewstone (Eds.), European review ofsocial psychology (pp. 199–228). Chichester, UK: Wiley.
Harrison, D. A., & Klein, K. J. (2007). What’s the difference? Diversity constructs asseparation, variety, or disparity in organizations. Academy of ManagementReview, 32(4), 1199–1228.
Harrison, D. A., McLaughlin, M. E., & Coalter, T. M. (1996). Context, cognition, andcommon method variance: Psychometric and verbal protocol evidence.Organizational Behavior and Human Decision Processes, 68(3), 246–261.
Harrison, D. A., Price, K. H., & Bell, M. P. (1998). Beyond relational demography:Time and the effects of surface- and deep-level diversity on work groupcohesion. Academy of Management Journal, 41(1), 96–107.
Harrison, D. A., Price, K. H., Gavin, J. H., & Florey, A. T. (2002). Time, teams, and taskperformance: Changing effects of surface- and deep-level diversity on groupfunctioning. Academy of Management Journal, 45(5), 1029–1045.
Harrison, D. A., & Shaffer, M. A. (1994). Comparative examinations of self-reportsand perceived absenteeism norms: Wading through Lake Wobegon. Journal ofApplied Psychology, 79(2), 240–251.
Hart, C. M., & Van Vugt, M. (2006). From faultlines to group fission: Understandingmembership changes in small groups. Personality and Social Psychology Bulletin,32, 392–404.
Hinkin, T. R. (1995). A review of scale development practices in the study oforganizations. Journal of Management, 21, 967–988.
Hinkin, T. R. (1998). A brief tutorial on the development of measures for use inquestionnaires. Organizational Research Methods, 1, 104–121.
Hogan, R., Raskin, R., & Fazzini, D. (1990). The dark side of charisma. In K. E. Clark &M. B. Clark (Eds.), Measures of leadership (pp. 343–354). West Orange, NJ:Leadership Library of America, Inc..
Hogg, M. A., & Terry, D. J. (2000). Social identity and self-categorization processes inorganizational contexts. Academy of Management Review, 25(1), 121–140.
Homan, A. C., van Knippenberg, D., Van Kleef, G. A., & De Dreu, C. K. W. (2007a).Interacting dimensions of diversity: Cross-categorization and the functioning of
40 K.A. Jehn, K. Bezrukova / Organizational Behavior and Human Decision Processes 112 (2010) 24–42

Author's personal copy
diverse work groups. Group Dynamics: Theory, Research, and Practice, 11(2),79–94.
Homan, A. C., van Knippenberg, D., Van Kleef, G. A., & De Dreu, C. K. W. (2007b).Bridging faultlines by valuing diversity: Diversity beliefs, informationelaboration, and performance in diverse work groups. Journal of AppliedPsychology, 92(5), 1189–1199.
Horwitz, S. K., & Horwitz, I. B. (2007). The effects of team diversity on teamoutcomes: A meta-analytic review of team demography. Journal of Management,33(6), 987–1015.
Hraba, J. (1989). The ethnic hierarchy in The Netherlands: Social distance and socialrepresentation. British Journal of Social Psychology, 28, 57–69.
Hraba, J., Radloff, T., & Gray-Ray, P. (1999). A comparison of Black and White socialdistance. Journal of Social Psychology, 139(4), 536–539.
Hu, L., & Bentler, P. M. (1998). Fit indices in covariance structure modeling:Sensitivity to underparameterized model misspecification. PsychologicalMethods, 3, 424–453.
Hu, L., & Bentler, P. M. (1999). Cutoff criteria for fit indexes in covariance structureanalysis: Conventional criteria versus new alternatives. Structural EquationsModeling, 6, 1–55.
Huseman, R. C., Hatfield, J. D., & Miles, E. W. (1987). A new perspective on equitytheory – The equity sensitivity construct. Academy of Management Review, 12(2),222–234.
Insko, C. A., & Schopler, J. (1987). Categorization, competition, and collectivity. In C.Hendrick (Ed.). Review of personality and social psychology: Group processes (Vol.8, pp. 213–251). New York: Sage.
Insko, C. A., & Schopler, J. (1998). Differential distruct of groups and individuals. In C.Sedikides, J. Schopler, & C. A. Insko (Eds.), Intergroup cognition and intergroupbehavior (pp. 75–108). Mahwah, NJ: Erlbaum.
Insko, C. A., Schopler, J., Drigotas, S. M., Graetz, K. A., Kennedy, J., Cox, C., et al.(1993). The role of communication in interindividual-intergroup discontinuity.Journal of Conflict Resolution, 37, 108–138.
Insko, C. A., Schopler, J., Hoyle, R. H., Dardis, G. J., & Graetz, K. A. (1990). Individual-group discontinuity as a function of fear and greed. Journal of Personality andSocial Psychology, 58, 68–79.
Jackson, C. L., Colquitt, J. A., Wesson, M. J., & Zapata-Phelan, C. P. (2006).Psychological collectivism: A measurement validation and linkage to groupmember performance. Journal of Applied Psychology, 91(4), 884–899.
Jehn, K. A. (1995). A multimethod examination of the benefits and detriments ofintragroup conflict. Administrative Science Quarterly, 40, 256–282.
Jehn, K. A., & Bendersky, C. (2003). Intragroup conflict in organizations: Acontingency perspective on the conflict–outcome relationship. Research inOrganizational Behavior, 25, 187–242.
Jehn, K. A., & Mannix, E. A. (2001). The dynamic nature of conflict: A longitudinalstudy of intragroup conflict and group performance. Academy of ManagementJournal, 44(2), 238–251.
Jehn, K. A., Northcraft, G., & Neale, M. (1999). Why differences make a difference: Afield study of diversity, conflict, and performance in workgroups. AdministrativeScience Quarterly, 44, 741–763.
Jehn, K. A., & Shah, P. P. (1997). Interpersonal relationships and task performance:An examination of mediating processes in friendship and acquaintance groups.Journal of Personality and Social Psychology, 72, 775–790.
Joreskog, K. G., & Sorbom, D. (1993). LISREL 8: Structural equation modelingwith SIMPLIS command language. Chicago, IL: Scientific Software InternationalInc..
Kane, A. A., Argote, L., & Levine, J. M. (2005). Knowledge transfer between groups viapersonnel rotation: Effects of social identity and knowledge quality.Organizational Behavior and Human Decision Processes, 96, 56–71.
Kelly, J. R., & McGrath, J. E. (1988). On time and method. Newbury Park, CA: Sage.Kessing, L. V. (2006). Diagnostic subtypes of bipolar disorder in older versus
younger adults. Bipolar Disorders, 8, 56–64.Kickul, J., Gundry, L., & Posig, M. (2005). Does trust matter? The relationship
between equity sensitivity and perceived organizational justice. Journal ofBusiness Ethics, 56(3), 205–218.
King, W. C., & Miles, E. W. (1994). The measurement of equity sensitivity. Journal ofOccupational and Organizational Psychology, 67, 133–142.
King, W. C., Miles, E. W., & Day, D. D. (1993). A test and refinement of the equitysensitivity construct. Journal of Organizational Behavior, 14(4), 301–317.
Kirkman, B. L., Tesluk, P. E., & Rosen, B. (2004). The impact of demographicheterogeneity and team leader–team member demographic fit on teamempowerment and effectiveness. Group & Organization Management, 29(3),334–368.
Kirkpatrick, L. A., Waugh, C. E., Valencia, A., & Webster, G. D. (2002). The functionaldomain specificity of self-esteem and the differential prediction of aggression.Journal of Personality and Social Psychology, 82, 756–767.
Klein, K. J., & Kozlowski, S. W. J. (2000). Multilevel theory, research, and methods inorganizations: Foundations, extensions, and new directions. San Francisco, CA:Jossey-Bass.
Komorita, S. S., & Kravitz, D. A. (1983). Coalition formation: A social psychologicalapproach. In Paulus (Ed.), Basic group processes (pp. 1979–2003). New York, NY:Springer.
Krosnick, J. A., & Alwin, D. F. (1987). An evaluation of a cognitive theory of response–order effects in survey measurement. The Public Opinion Quarterly, 51(2),201–219.
LaBianca, G., Brass, D. J., & Gray, B. (1998). Social networks and perceptions ofintergroup conflict: The role of negative relationships and third parties.Academy of Management Journal, 41, 55–67.
Lankau, M. J., Riordan, C. M., & Thomas, C. H. (2005). The effects of similarity andliking in formal relationships between mentors and protégés. Journal ofVocational Behavior, 67, 252–265.
Lau, D., & Murnighan, J. K. (1998). Demographic diversity and faultlines: Thecompositional dynamics of organizational groups. Academy of ManagementReview, 23, 325–340.
Lau, D., & Murnighan, J. K. (2005). Interactions within groups and subgroups: Thedynamic effects of demographic faultlines. Academy of Management Journal,48(4), 645–659.
Lawler, E. J., & Youngs, G. A. (1975). Coalition formation: An integrative model.Sociometry, 38, 1–17.
Lee, Y., & Ottati, V. (1993). Determinants of in-group and out-group perceptions ofheterogeneity: An investigation of Sino-American stereotypes. Journal of Cross-Cultural Psychology, 24, 298–316.
Li, J. T., & Hambrick, D. C. (2005). Factional groups: A new vantage on demographicfaultlines, conflict, and disintegration in work teams. Academy of ManagementJournal, 48(5), 794–813.
Lipponen, J., Helkama, K., & Juslin, M. (2003). Subgroup identification, superordinateidentification and intergroup bias between the subgroups. Group Processes andIntergroup Relations, 6, 239–250.
Long, J. S. (1983). Confirmatory factor analysis. Beverly Hills CA: Sage Publications.MacKinnon, D. P., Lockwood, C. M., Hoffman, J. M., West, S. G., & Sheets, V. (2002). A
comparison of methods to test mediation and other intervening variable effects.Psychological Methods, 7, 83–104.
Mannix, E. A. (1993). Organizations as resource dilemmas: The effects of powerbalance on coalition formation in small groups. Organizational Behavior andHuman Decision Processes, 55, 1–22.
Mannix, E. A., & Jehn, K. A. (2004). Let’s norm and storm, but not right now:Integrating models of group development and performance. In M. Neale, E.Mannix, & S. Blount (Eds.), Research on managing groups and teams (pp. 11–37).Greenwich, CT: JAI Press.
Marcus-Newhall, A., Miller, N., Holtz, R., & Brewer, M. (1993). Cross-cutting categorymembership with role assignment: A means of reducing intergroup bias. BritishJournal of Social Psychology, 32, 125–146.
Meehl, P. E. (1992). Factors and taxa, traits and types, differences of degree anddifferences in kind. Journal of Personality, 60(1), 117–174.
Miles, E. W., Hatfield, J. D., & Huseman, R. C. (1994). The equity sensitivity construct:Potential implications for worker performance. Journal of Management, 15(4),581–588.
Mintu-Wimsatt, A. (2003). King and Miles’ equity sensitivity instrument: A cross-cultural validation. Psychological Reports, 92, 23–26.
Molleman, E. (2005). Diversity in demographic characteristics, abilities andpersonality traits: Do faultlines affect team functioning? Group Decision andNegotiation, 14, 173–193.
Molleman, E., Nauta, A., & Jehn, K. A. (2004). Person–job fit applied to teamwork – Amultilevel approach. Small Group Research, 35(5), 515–539.
Moore, D. (1991). Entitlement and justice evaluations: Who should get more, andwhy. Social Psychology Quarterly, 54, 208–223.
Moreland, R. L., Levine, J. M., & Wingert, M. L. (1996). Creating the ideal group:Composition effects at work. In E. Witte & J. Davis (Eds.), Understanding groupbehavior. Hillsdale: Erlbaum.
Mullick, R., & Hraba, J. (2001). Ethnic attitudes in Pakistan. International Journal ofIntercultural Relations, 25(2), 165–179.
Murnighan, J. K., & Brass, D. J. (1991). Intraorganizational coalitions. In M. H.Bazerman, R. J. Lewicki, & B. H. Sheppard (Eds.), Research on negotiation inorganizations: The handbook of negotiation research (pp. 283–306). Greenwich,CT: JAI Press.
Neuman, G. A., Wagner, S. H., & Christiansen, N. D. (1999). The relationship betweenwork-team personality composition and the job performance of teams. Group &Organization Management, 24, 28–45.
Northcraft, G. B., Polzer, J. T., Neale, M. A., & Kramer, R. M. (1995). Diversity, socialidentity, and performance: Emergent social dynamics in cross-functional teams.In S. E. Jackson & M. N. Ruderman (Eds.), Diversity in work teams: Researchparadigms for a changing workplace (pp. 69–96). American PsychologicalAssociation.
Oakes, P. (1987). The salience of social categories. In Turner et al. (Eds.),Rediscovering the social group. A self-categorization theory (pp. 117–141).Oxford, UK: Blackwell.
O’Leary, M. B., & Mortensen, M. (2008). Friends and enemies within: The role ofsubgroups, imbalance, and isolates in geographically dispersed teams. MITSloan Research Paper No. 4689-08.
Pearce, J. A., & DeNisi, A. S. (1983). Attribution theory and strategic decision making:An application to coalition formation. Academy of Management Journal, 26,119–128.
Pearsall, M. J., Ellis, A. P., & Evans, J. M. (2008). Unlocking the effects of genderfaultlines on team creativity: Is activation the key? Journal of Applied Psychology,93(1), 225–234.
Phillips, K. W., & Loyd, D. L. (2006). When surface and deep-level diversity collide:The effects on dissenting group members. Organizational Behavior and HumanDecision Processes, 99, 143–160.
Phillips, K. W., Mannix, E. A., Neale, M. A., & Gruenfeld, D. H. (2004). Diverse groupsand information sharing: The effects of congruent ties. Journal of ExperimentalSocial Psychology, 40, 497–510.
Phillips, K. W., Northcraft, G. B., & Neale, M. A. (2006). Surface-level diversity anddecision-making in groups: When does deep-level similarity help? GroupProcesses & Intergroup Relations, 9(4), 467–482.
K.A. Jehn, K. Bezrukova / Organizational Behavior and Human Decision Processes 112 (2010) 24–42 41
Author's personal copy
Podsakoff, P. M., MacKenzie, S. B., Lee, J., & Podsakoff, N. P. (2003). Common methodbiases in behavioral research: A critical review of the literature andrecommended remedies. Journal of Applied Psychology, 88, 879–903.
Polzer, J. T. (2004). How subgroup interests and reputations moderate the effect oforganizational identification and cooperation. Journal of Management, 30(1),71–96.
Polzer, J. T., Crisp, C. B., Jarvenpaa, S. L., & Kim, J. W. (2006). Extending the faultlinemodel to geographically dispersed teams: How collocated subgroups can impairgroup functioning. Academy of Management Journal, 49, 679–692.
Polzer, J. T., Mannix, E. A., & Neale, M. A. (1998). Interest alignment and coalitions inmultiparty negotiation. Academy of Management Journal, 41, 42–54.
Premeaux, S. F., & Bedeian, A. G. (2003). Breaking the silence: The moderatingeffects of self-monitoring in predicting speaking up in the workplace. Journal ofManagement Studies, 40(6), 1537–1562.
Raja, U., Johns, G., & Ntalianis, F. (2004). The impact of personality on psychologicalcontracts. Academy of Management Journal, 47(3), 350–367.
Rand, T. M., & Wexley, K. N. (1975). A demonstration of the Byrne’s similarityhypothesis in simulated employment interviews. Psychological Reports, 36,535–544.
Rink, F. (2005). Diversity and small group decision making: Towards a socialidentity framework for studying the effects of task-related differences in dyadsand groups. Unpublished doctoral dissertation, Leiden University.
Riordan, C. M. (2000). Relational demography within groups: Past developments,contradictions, and new directions. Research in Personnel and Human ResourceManagement, 19, 131–173.
Roccas, S., & Brewer, M. B. (2002). Social identity complex. Personality and SocialPsychological Review, 6(2), 88–106.
Roseman, I. J., Wiest, C., & Swartz, T. S. (1994). Phenomenology, behaviors, and goalsdifferentiate discrete emotions. Journal of Personality & Social Psychology, 67,206–221.
Roth, P. L., Bevier, C. A., Bobko, P., Switzer, F. S., & Tyler, P. (2001). Ethnic groupdifferences in cognitive ability in employment and educational settings: Ameta-analysis. Personnel Psychology, 54, 297–330.
Rousseau, D. M. (1985). Issues of level in organizational research: Multi-level andcross-level perspectives. Research in Organizational Behavior, 7, 1–37.
Runkel, P. J., & McGrath, J. E. (1972). Research on human behavior: A systematic guideto method. New York, NY: Holt, Rinehart & Winston.
Saal, F. E., Downey, R. G., & Lahey, M. A. (1980). Rating the ratings: Assessing thepsychometric quality of rating data. Psychological Bulletin, 88, 413–428.
Sauley, K. S., & Bedeian, A. G. (2000). Equity sensitivity: Construction of a measureand examination of its psychometric properties. Journal of Management, 26(5),885–910.
Sawyer, J. E., Houlette, M. A., & Yeagley, E. L. (2006). Decision performance anddiversity structure: Comparing faultlines in convergent, crosscut, and raciallyhomogeneous groups. Organizational Behavior and Human Decision Processes,99(1), 1–15.
Schopler, J., Insko, C. A., Graetz, K. A., Drigotas, S. M., Smith, V. A., & Dahl, K. A.(1993). Individual–group discontinuity: Further evidence for mediation by fearand greed. Personality and Social Psychology Bulletin, 19, 419–431.
Schwab, D. P. (1999). Research methods for organizational studies. Mahwah, NJ:Lawrence Erlbaum.
Sherif, M., Harvey, O. J., White, B. J., Hood, W. R., & Sherif, C. W. (1961). Intergroupconflict and cooperation: The Robbers Cave experiment. Norman: University ofOklahoma Book Exchange.
Sidanius, S., & Pratto, F. (1999). Social dominance: An intergroup theory of socialhierarchy and oppression. New York, NY: Cambridge University Press.
Silverman, J. G., & Williamson, G. M. (1997). Social ecology and entitlementsinvolved in battering by heterosexual college males: Contributions of familyand peers. Violence & Victims, 12, 147–164.
Singleton, R. A., Jr., Straits, B. C., & Miller, M. (1993). Approaches to social research(2nd ed.). New York, NY: Oxford University Press.
Sobel, M. E. (1982). Asymptotic confidence intervals for indirect effects in structuralequation models. In S. Leinhart (Ed.), Sociological methodology (pp. 290–312).San Francisco, CA: Jossey-Bass.
Staw, B. M., Sandelands, L. E., & Dutton, J. E. (1981). Threat–rigidity effects inorganizational behavior: A multilevel analysis. Administrative Science Quarterly,26, 501–524.
Stellmacher, J., & Petzel, Th. (2005). Authoritarianism as a group phenomenon.International society of political psychology. Malden: Blackwell Publishing, Inc.. p.245–74.
Stouten, J., De Cremer, D., & Van Dijk, E. (2005). I’m doing the best I can (for myself):Leadership and variance of harvesting in resource dilemmas. Group Dynamics:Theory, Research, and Practice, 9(3), 205–211.
Strauss, J. P., Barrick, M. R., & Connerley, M. L. (2001). An investigation of relationalpersonality effects on peer and supervisor ratings and the impact of familiarity.Journal of Occupational and Organizational Psychology, 74, 637–657.
Tabachnik, B. G., & Fidell, L. S. (1989). Using multivariate statistics (2nd ed.). NewYork, NY: HarperCollins.
Tajfel, H. (1982). Social psychology of intergroup relations. Annual Review ofPsychology, 33, 1–39.
Tajfel, H., & Turner, J. C. (1986). The social identity theory of intergroup behavior. InAustin Worchel (Ed.), Psychology of intergroup relations (2nd ed., pp. 7–24).Chicago, IL: Nelson.
Ten Have, P. (1986). Methodological issues in conversational analysis. Bulletin deMéthodologie Sociologique, 27, 23–51.
Thatcher, S., & Jehn, K. A. (1998). A model of group diversity profiles andcategorization processes in bicultural organizational teams. In M. Neale, E.Mannix, & D. Gruenfeld (Eds.), Research on managing groups and teams(pp. 1–20). London, UK: JAI Press.
Thatcher, S. M. B., Jehn, K. A., & Zanutto, E. (2003). Cracks in diversity research: Theeffects of diversity faultlines on conflict and performance. Group Decision andNegotiation, 12(3), 217–241.
Thatcher, S. M. B., & Zhu, X. (2006). Changing identities in a changing workplace:Identification, identity enactment, self-verification and telecommuting.Academy of Management Review, 31(4), 1076–1088.
Thibaut, J., & Kelley, H. H. (1959). The social psychology of groups. New York, NY:Wiley.
Turban, D. B., & Jones, A. P. (1988). Supervisor–subordinate similarity: Types, effectsand mechanisms. Journal of Applied Psychology, 73, 28–234.
Turner, J. C. (1984). Social identification and psychological group formation. In H.Tajfel (Ed.). The social dimension: European developments in social psychology(Vol. 2, pp. 518–538). Cambridge, UK: Cambridge University Press.
Turner, J. C., Hogg, M. A., Oakes, P. J., Reicher, S. D., & Wetherell, M. S. (1987).Rediscovering the social group: A self-categorization theory. Oxford, UK: Blackwell.
U.S. Census Bureau (2002). United States population and demographic report.<http://www.census.gov>.
van den Bos, K., & Lind, E. A. (2001). The psychology of own versus others’treatment: Self-oriented and other-oriented effects on perceptions ofprocedural justice. Personality and Social Psychology Bulletin, 27, 1324–1333.
Van Dijk, E., & De Cremer, D. (2006). Self-benefiting in the allocation of scarceresources: Leader–follower effects and the moderating effect of social valueorientations. Personality and Social Psychology Bulletin, 32, 1352–1361.
Van Vugt, M., & Hart, C. M. (2004). Social identity as social glue: The origins of grouployalty. Journal of Personality and Social Psychology, 86, 585–598.
Vanbeselaere, N. (1991). The different effects of simple and crossed categorizations.In W. Stroebe & M. Hewstone (Eds.), European review of social psychology(pp. 247–278). Chichester, UK: Wiley.
Wallace, H. M., & Baumeister, R. F. (2002). The performance of narcissists rises andfalls with perceived opportunity for glory. Journal of Personality and SocialPsychology, 82, 819–834.
Webber, S., & Donahue, L. (2001). Impact of highly and less job-related diversity onwork group cohesion and performance: A meta-analysis. Journal of Management,27(2), 141–162.
Weber, R. (1990). Basic content analysis (2nd ed.). Thousand Oaks, CA: Sage.Weingart, L. R. (1997). How did they do that? The ways and means of studying
group processes. In L. L. Cummings & B. M. Staw (Eds.). Research inorganizational behavior (Vol. 19, pp. 189–239). Elsevier Ltd..
Weiss, H. (2003). A cross-national comparison of nationalism in Austria, theCzech and Slovac Republics, Hungary, and Poland. Political Psychology, 24,377–401.
Weldon, E., Jehn, K. A., & Pradhan, P. (1991). Processes that mediate the relationshipbetween a group goal and improved group performance. Journal of Personalityand Social Psychology, 61, 555–569.
Wildschut, T., Insko, C. A., & Gaertner, L. (2002). Intragroup social influence andintergroup competition. Journal of Personality and Social Psychology, 82,975–992.
Williams, K., & O’Reilly, C. (1998). Demography and diversity in organizations: Areview of 40 years of research. Research in Organizational Behavior, 20, 77–140.
Wiprut, D., & Zobrack, M. D. (2000). Fault reactivation and fluid flow along apreviously dormant fault. Geology, 28, 595–598.
Zellmer-Bruhn, M. E., Maloney, M. M., Bhappu, A. D., & Salvador, R. (2008). Whenand how do differences matter? An exploration of perceived similarity in teams.Organizational Behavior and Human Decision Processes, 107(1), 41–59.
42 K.A. Jehn, K. Bezrukova / Organizational Behavior and Human Decision Processes 112 (2010) 24–42