Embed Size (px)
Citation preview
This article was published in an Elsevier journal. The attached copyis furnished to the author for non-commercial research and
education use, including for instruction at the author’s institution,sharing with colleagues and providing to institution administration.
Other uses, including reproduction and distribution, or selling orlicensing copies, or posting to personal, institutional or third party
websites are prohibited.
In most cases authors are permitted to post their version of thearticle (e.g. in Word or Tex form) to their personal website orinstitutional repository. Authors requiring further information
regarding Elsevier’s archiving and manuscript policies areencouraged to visit:
http://www.elsevier.com/copyright
Author's personal copy
Why the unskilled are unaware: Further explorations of (absent)self-insight among the incompetent q
Joyce Ehrlinger a,*, Kerri Johnson b, Matthew Banner c, David Dunning c, Justin Kruger d
a Department of Psychology, Florida State University, Tallahassee, FL 32306-4301, USAb Department of Communication Studies, University of California, Los Angeles, CA 90095, USA
c Department of Psychology, Cornell University, Ithaca, NY 14853-7601, USAd Leonard N. Stern School of Business, New York University, New York, NY 10012, USA
Received 16 December 2006Available online 23 October 2007
Accepted by Scott Highhouse
Abstract
People are typically overly optimistic when evaluating the quality of their performance on social and intellectual tasks. In particular,poor performers grossly overestimate their performances because their incompetence deprives them of the skills needed to recognizetheir deficits. Five studies demonstrated that poor performers lack insight into their shortcomings even in real world settings and whengiven incentives to be accurate. An additional meta-analysis showed that it was lack of insight into their own errors (and not mistakenassessments of their peers) that led to overly optimistic estimates among poor performers. Along the way, these studies ruled out recentalternative accounts that have been proposed to explain why poor performers hold such positive impressions of their performance.� 2007 Elsevier Inc. All rights reserved.
Keywords: Competence; Self-confidence; Metacognition; Self-insight
One of the painful things about our time is that thosewho feel certainty are stupid, and those with any imag-ination and understanding are filled with doubt andindecision
Bertrand Russell (1951)
As Bertrand Russell noted, those most confident intheir level of expertise and skill are not necessarily thosewho should be. Surveys of the psychological literature
suggest that perception of skill is often only modestlycorrelated with actual level of performance, a patternfound not only in the laboratory but also in the class-room, health clinic, and the workplace (for reviews,see Dunning, 2005; Dunning, Heath, & Suls, 2004; Ehr-linger & Dunning, 2003; Falchikov & Boud, 1989; Har-ris & Schaubroeck, 1988; Mabe & West, 1982).
Surveys of the literature also suggest that people holdpositive beliefs about their competence to a logicallyimpossible degree (for reviews, see Alicke & Govorun,2005; Dunning, 2005; Dunning et al., 2004). In one com-mon example of this tendency, several research studieshave shown that the average person, when asked, typi-cally claims that he or she is ‘‘above average’’, (Alicke,1985; Brown, 1986; Dunning, Meyerowitz, & Holzberg,1989; Weinstein, 1980) which is, of course, statisticallyimpossible. These biased self-evaluations are seen inimportant real world settings as well as the laboratory.
0749-5978/$ - see front matter � 2007 Elsevier Inc. All rights reserved.
doi:10.1016/j.obhdp.2007.05.002
q We thank Alba Cabral, Leah Doane, Alex Emmot, DonnyThometz, Kevin van Aelst, and Nathalie Vizueta for assisting in thecollection of data. We also thank members of the Dunning laboratoryand, in particular, Nicholas Epley, for many helpful suggestions. Thisresearch was supported financially by National Institute of MentalHealth Grant RO1 56072, awarded to Dunning.
* Corresponding author. Fax: +1 850 644 7739.E-mail address: [email protected] (J. Ehrlinger).
www.elsevier.com/locate/obhdp
Available online at www.sciencedirect.com
Organizational Behavior and Human Decision Processes 105 (2008) 98–121
Author's personal copy
In a survey of engineers at one company, for example,42% thought their work ranked in the top 5% amongtheir peers (Zenger, 1992), a fact that could easily impedetheir motivation to improve. Elderly people tend tobelieve they are ‘‘above average’’ drivers (Marottoli &Richardson, 1998), a perception that that is, in reality,associated with being labeled an unsafe driver (Freund,Colgrove, Burke, & McLeod, 2005). Even academicsare not immune. A survey of college professors revealedthat 94% thought they do ‘‘above average’’ work—a fig-ure that defies mathematical plausibility (Cross, 1977).
(Absent) Self-insight among the incompetent
Why are people typically so convinced that they aremore capable than they, in fact, are? In recent years,an active and emerging literature has grown to explainerrors in self-assessment. One strategy for understandingthe sources of error in self-assessment is to identify thoseindividuals who make the most mistaken self-judgments.By examining how these error-prone individuals differfrom their more accurate peers, one can identify sourcesof error in general.
Adopting this approach, Kruger and Dunning (1999)suggested that, across many intellectual and socialdomains, it is the poorest performers who hold the leastaccurate assessments of their skill and performances,grossly overestimating how well their performancesstack up against those of their peers. For example, stu-dents performing in the bottom 25% among their peerson tests of grammar, logical reasoning, and humortended to think that they are performing above the60th percentile (Kruger & Dunning, 1999). Further, thispattern has been conceptually replicated among under-graduates completing a classroom exam (Dunning,Johnson, Ehrlinger, & Kruger, 2003), medical studentsassessing their interviewing skills (Hodges, Regehr, &Martin, 2001) clerks evaluating their performance(Edwards, Kellner, Sistron, & Magyari, 2003), and med-ical laboratory technicians evaluating their on-the-jobexpertise (Haun, Zeringue, Leach, & Foley, 2000).
Kruger and Dunning (1999) argued that this grossoverconfidence occurs because those who lack skill sim-ply are not in a position to accurately recognize themagnitude of their deficits. Their incompetence pro-duces a double curse. First, their lack of skill, by defi-nition, makes it difficult to produce correct responsesand, thus, they make many mistakes. Second, this verysame lack of skill also deprives them of success at themetacognitive task of recognizing when a particulardecision is a correct or an incorrect one. For example,to produce a grammatically correct sentence, one mustknow something about the rules of grammar. But onemust also have an adequate knowledge of the rules ofgrammar in order to recognize when a sentence is
grammatically correct, whether written by one’s selfor by another person. Thus, those who lack grammat-ical expertise are not in a position to accurately judgethe quality of their attempts or the attempts of otherpeople. In addition, because people tend to choosethe responses they think are most reasonable, peoplewith deficits are likely to believe they are doing quitewell even when they are, in reality, doing quite poorly(Kruger & Dunning, 1999). Consistent with this argu-ment, poor performers are significantly worse at distin-guishing between correct and incorrect responses thanare their more competent peers (for a review, see Dun-ning, 2005). This is true when judging their ownresponses (e.g., Chi, Glaser, & Rees, 1982; Keren,1987; Kruger & Dunning, 1999; Maki, Jonas, & Kal-lod, 1994; Shaughnessy, 1979; Sinkavich, 1995) as wellas responses provided by others (Carney & Harrigan,2003; Kruger & Dunning, 1999).
To be sure, the incompetent are not alone in their dif-ficulty with accurate self-assessment. These same studiessuggest that top performers consistently underestimate
how superior or distinctive their performances are rela-tive to their peers. In Kruger and Dunning (1999) stud-ies, the top 25% tended to think that their skills lay inthe 70th–75th percentile, although their performancesfell roughly in the 87th percentile. Kruger and Dunningsuggested that this underestimation stems from a differ-ent source—because top performers find the tests theyconfront to be easy, they mistakenly assume that theirpeers find the tests to be equally easy. As such, theirown performances seem unexceptional. Supporting thisproposal, Kruger and Dunning found that exposingtop performers to how their peers performed on thesame task caused them to recognize, in part, just howexceptional their performances were relative to theirpeers (see Hodges et al., 2001, for similar findings).
Goals of the present research
The primary aim of this manuscript is to advancean understanding of why the incompetent, in particu-lar, tend to lack self-insight. Although a growing bodyof evidence has provided support for the claim thatincompetence hinders self-insight (e.g., Dunninget al., 2003; Haun et al., 2000; Hodges et al., 2001),this analysis has been subject to criticism. These cri-tiques argue that the self-assessment errors observedby Kruger and Dunning can be largely reduced to sta-tistical or methodological artifacts rather than to anabsence of metacognitive competence among poor per-formers. Through the present research, we sought toexamine whether Kruger and Dunning’s (1999) analy-sis or these competing alternatives better explainsoverestimation among the bottom performers andunderestimation among top performers.
J. Ehrlinger et al. / Organizational Behavior and Human Decision Processes 105 (2008) 98–121 99
Author's personal copy
Metacognitive error or statistical artifact?
Two alternative accounts have been published toexplain the pattern of over- and underestimation of per-formance observed by Kruger and Dunning (1999).Central to these critiques is the notion that top and bot-tom performers actually do not differ in their ability toevaluate the quality of their own performances. Instead,it is argued, people of all skill levels have equal difficultyestimating the quality of their performance—and it isthis shared difficulty, coupled with statistical or method-ological artifacts, that account for the observed patternsof over- and underestimation.
Regression to the mean account
In one critique, Krueger and Mueller (2002; see alsoAckerman, Beier, & Bowen, 2002; Krueger & Funder,2004) proposed that the patterns of over- and underesti-mation found by Kruger and Dunning (1999) were notevidence of a relationship between skill level and metacog-nitive skill. Instead, they argued, the pattern was pro-duced by regression to the mean coupled with the factthat people tend overall to rate themselves as above aver-age (Alicke, 1985; Brown, 1986; Krueger, 1998). Becauseperceptions of performance correlate imperfectly withactual performance, it was nearly inevitable that theself-assessments of bottom performers would regressback to toward an average self-assessment, thus ensuringthat their estimates would be higher than the performancethey achieved. Similarly, the performance estimates madeby top performers would regress back toward the average,ensuring that their true performance would be higher thantheir corresponding estimates.
According to Krueger and Mueller (2002) this regres-sion to the mean phenomenon arises, in part, becausemeasures used to assess the skill level of participantsare statistically unreliable and, thus, fraught with mea-surement error. This unreliability would ensure a smal-ler correlation between perceptions and the reality ofperformance, leading to more regression to the meanand greater levels of over- and underestimation. If onemeasured and then corrected for that lack of reliability,they argued, a good deal of over- and underestimationwould evaporate. In two datasets, Krueger and Muellerdid just that—demonstrating that a good deal of theoverestimation among bottom performers and underes-timation among top performers in their datasets evapo-rated after unreliability, and thus the impact ofmeasurement error, were corrected (for a reply, see Kru-ger & Dunning, 2002).
Task difficulty account
Burson, Larrick, and Klayman (2006) provided asimilar account for Kruger and Dunning’s interpreta-
tion of over and underestimation, this focused on com-parative performance estimates in which people assessedhow well they performed relative to their peers. Theyagreed with Krueger and Mueller (2002) that compara-tive judgments of one’ performance are difficult foreveryone to provide and that bottom and top perform-ers do not differ in their ability to evaluate their perfor-mance. Their argument, drawing upon Kruger (1999),noted that above average effect frequently occurs fortasks that people perceive to be easy but that tasks per-ceived to be difficult can produce below average effects.When faced with great difficulty in completing a task,individuals believe that they are performing poorlyand, failing to properly account for the degree to whichothers also experience this difficulty, assess their relativeperformance as worse than average. Burson and col-leagues argued that, if everyone produces similar esti-mates (estimates that are high for tasks perceived to beeasy but low for tasks perceived to be difficult) what dic-tates accuracy is less a matter of greater insight on thepart of some participants and more a matter of per-ceived difficulty. When a test seems easy, everyone willbelieve they have performed well relative to their peersbut only top performers will be accurate, leaving bottomperformers overconfident. When the test is construed tobe hard, however, everyone will think they have donepoorly relative to the peers and bottom performers willbe more accurate than their more competent peers. Inshort, Burson et al. (2006) argue, whether top or bottomperformers are most inaccurate is an artifact of the per-ceived difficulty of the task.
Indeed, Burson et al. (2006) presented participantswith tasks perceived to be difficult in three studies andfound support for their assertions. Participants esti-mated how well they had performed on tasks (e.g., triviaand ‘‘word prospector’’ tasks) that were designed toappear either particularly easy or difficult. Across thesestudies, Burson and colleagues found that estimates ofperformance did not correlate well with actual perfor-mance but correlated highly with difficulty condition.After completing an easy task, participants of all skilllevels estimated that they had performed well relativeto their peers, such that top performers looked relativelyaccurate and bottom performers were grossly overconfi-dent. However, after completing a difficult task, partici-pants of all skill levels estimated that they hadperformed quite poorly relative to their peers, makingpoor performers look quite accurate and top performersvastly underconfident.
Although Burson and colleagues largely focusedthis critique on comparative and not absoluteestimates of performance, they took their results asevidence that the Kruger and Dunning (1999) patternof over- and underestimation of relative performancewas simply a function of using seemingly easytasks and, as such, did not provide evidence of a
100 J. Ehrlinger et al. / Organizational Behavior and Human Decision Processes 105 (2008) 98–121
Author's personal copy
relationship between skill level and accuracy in self-assessments.
The present investigations
The following studies were designed to address theabove critiques and, more generally, provide a betterunderstanding of the relationship between level of skilland accuracy in self-assessment. We have organizedthe studies described in this manuscript in three sections,each with a separate aim.
Section 1
Section 1 was designed to directly address the claimsthat apparent over and underestimation among bottomand top performers can be reduced to statistical andmethodological artifacts. We did this in several ways.To address the claims made by Krueger and Mueller(2002), we explored the accuracy of self-assessmentsafter correcting for lack of statistical reliability in ourdatasets. Once correcting for unreliability, would we stillsee dramatic overestimation on the part of poor per-formers and underestimation among top performers(as predicted by Kruger & Dunning, 1999) or would thispattern of misestimation largely vanish (as predicted byKrueger & Mueller, 2002)?
Second, given the Burson et al. (2006) critique, wethought it critical to explore self-assessment squarelyin the real world, with tasks of ecological validity thatparticipants approached with an ecologically representa-tive range of competencies. Burson et al. explicitly chosetasks that would appear to be difficult or easy for theirparticipants. As such, they showed what could happenat the extremes of human performance. In addition, theyalso chose tasks that participants were likely not to havemuch experience or familiarity with, such as trivia ques-tions or a word game, which meant that participantsfaced a notable degree of uncertainty about how theyor their peers would perform. Those choices left openthe question of what patterns of assessments peoplewould make if they dealt with a type of task they werevery likely to face in real life—with which they had somefamiliarity about how they and their peers would per-formed. A quick look at overall performance levelsattained by participants in Kruger and Dunning (1999)suggests that the patterns of over and under-confidencewould look quite different from what Burson et al. pro-posed. According to Burson et al. (2006), poor perform-ers will grossly overestimate their performance on onlytasks that are perceived to be easy. The tasks used inKruger and Dunning, however, look anything but easy.The average performance participants attained rangedfrom 66.4% correct (Study 3) to 49.1% correct (Study4). Bottom performers answered between 48.2% (Study3) and 3.2% (Study 4) questions correctly in these
studies. Yet, even facing these difficult tasks, poor per-forming participants still grossly overestimated theirperformance relative to their peers.
Thus, in Part 1, we looked at real world cases inwhich people approached (often challenging) tasks thatthey would encounter in their everyday lives, ratherthan ones designed by experimenters to seem eithereasy or difficult. In these ecologically valid circum-stances, would we tend to find the pattern of self-assessments observed by Kruger and Dunning (1999)or would the pattern look different? We took thisdirection because we thought it would be critical toexplore error in self-assessment on ecologically repre-sentative and familiar tasks in real-world settings. Inparticular, we asked undergraduate students to esti-mate how well they had performed on course examsand asked members of college debate teams to evalu-ate their tournament performance. These tasks werechosen because they were ones that individualsapproached out of their own volition (as opposed tohaving the task imposed by an experimenter), theywere devised by naturally-occurring agents (e.g., acourse instructor) rather than by experimenters, andparticipants had reasonable amount of prior experi-ence and feedback on the tasks.
In addition, Burson et al. (2006) inspired us toexplore a wider range of self-assessment measures. Theirargument about task difficulty rested largely on the useof comparative measures in which people evaluated theirperformance relative to their peers. They argued thatpeople would underestimate themselves on difficult tasksand overestimate themselves on easy tasks because ofthe inherent difficulty of knowing how their peers haddone, regardless of the skill level exhibited by the personmaking the evaluation. But what about estimates thatdo not involve comparisons with peers? Burson et al.are largely silent on this, but Kruger and Dunning(1999) are not: Peer performers should still grossly over-estimate their performance regardless of the type ofmeasure used. Thus, in the following studies, we tookcare to ask participants to judge their performance on‘‘absolute’’ evaluations—measures that required nocomparison to another person (e.g., how many testquestions did they answer correctly)—in addition tocomparative judgments. We predicted that poor per-formers would overestimate their performance on abso-lute as well as relative measures, with top performersbeing largely accurate in their assessments.
Section 2
In Section 2, we examined a third plausible alterna-tive explanation of the pattern of over- and underesti-mation observed by Kruger and Dunning (1999). Onecould argue that a goal to preserve a positive, if notaccurate, view of the self may be particularly strong
J. Ehrlinger et al. / Organizational Behavior and Human Decision Processes 105 (2008) 98–121 101
Author's personal copy
among those who have performed poorly preciselybecause these are the individuals who might suffer themost from admitting the reality of their poor perfor-mance. Those who score very well, in contrast, wouldhave considerably less motivation to glorify the qualityof their performance. Indeed, they may be motivatedinstead to be overly modest about their achievement.
If this is the case, what appears to be an inability toassess the quality of one’s performance on the part ofthe unskilled might actually be an unwillingness to doso accurately, in that the unskilled prefer to report arosy view of their performance. Under this analysis,those who are unskilled can and will recognize howpoorly they have performed if properly motivated.Thus, in the three studies comprising the second section,we offered incentives to encourage participants to pro-vide accurate self-assessments. If the unskilled are trulyunable to evaluate the quality of their performances,their performance estimates should remain inflated evenin the face of strong incentives to be accurate.
Section 3
The first two sections of this paper speak primarily tofactors that do not influence performance estimates,while simply referring back to previous literature to clar-ify what does influence estimates. This focus stemsdirectly from critiques of Kruger and Dunning (1999).In Section 3, however, we provide a meta-analysis ofexisting data to look directly at the specific errors lead-ing to overestimation of comparative performanceamong poor performers and underestimation by topperformers. According to Kruger and Dunning (1999),poor performers overestimate their abilities because theydo not have the metacognitive skill to know that theythemselves are doing poorly. The major problem isone of self-estimation, not estimation of peers. Misesti-mates of their peers’ performance may contribute totheir bias, but it is not the primary mechanism that leadsto their overestimation. Top performers, on the otherhand, may underestimate how well they are doing rela-tive to their peers because they overestimate how welltheir peers are doing. That is, mistaken assessments ofpeers become a more substantive portion of why topperformers fail to recognize the rarity of theircompetence.
Our analysis in Section 3 directly explored the influ-ence of these differing sources of error on self-assess-ments made by top and bottom performers. In doingso, it served as a response to both the Krueger andMueller (2002) and Burson et al. (2006) who attributederrors in performance evaluation to methodological orstatistical artifacts—to overall bias in self-estimates(e.g., were people largely over- or underestimating theirperformance relative to their peers) as well as measure-ment error in the assessment of skill. If we could tie pat-
terns of over- and underestimation more closely to thetypes of specific errors predicted by Kruger and Dun-ning (1999), we would then provide evidence in supportof (or against) their account.
Section 1: Correcting for reliability in self-assessments for
real world tasks
All too often, social psychological research remains inthe laboratory and we are left to infer that the same phe-nomenon routinely occur in the real world. For this rea-son, the discipline is often open to the criticism thatwhat we find is limited to particular contrived labora-tory situations or to particular demographics (e.g.,Mintz, Redd, & Vedlitz, 2006; Sears, 1986). Thus, thosefew opportunities to measure social psychological phe-nomenon in the real world are particularly valuable.Real world demonstrations are particularly importantin this case because critiques of Kruger and Dunning(1999) have centered on whether their findings are lim-ited to particular types of tasks (e.g., easy tasks or taskswith unreliable measures; Burson et al., 2006; Krueger &Mueller, 2002). Thus, in this section, we examined theaccuracy of self-assessment among top and bottom per-formers on real world tasks.
We were concerned not just with the generality ofour phenomenon across tasks but also across mea-sures. Thus, throughout this paper, we broadenedthe types of self-assessment measures examined toinclude absolute measures of performance as well ascomparative ones. We, like Kruger and Dunning(1999), asked participants to rate the quality of theirperformance relative to their peers. However, in addi-tion to this comparative estimate, we asked partici-pants to provide absolute estimates of theirperformance, such as the number of exam questionsanswered correctly (Studies 1, 3, 4, and 5), the numberof debate matches won, and how a judge had ratedtheir debate performance (Study 2). Would poor per-formers dramatically overestimate their performanceon absolute as well as relative self-assessments?
In addition, the studies in Section 1 allowed for amore ecologically valid test of the regression-to-the-mean critique made by Krueger and Mueller (2002).According to that critique, once error in the measure-ment of perceived and actual performance is accountedfor, bottom performers should not overestimate theirabilities any more than do other individuals. Thus, inboth studies, we measured and corrected for any unreli-ability in our tests. This correction should make esti-mates of performance more accurate—but by howmuch? If error in self-assessments stems from a psycho-logical rather than a statistical source, the original pat-tern of over- and underestimation should remainlargely intact.
102 J. Ehrlinger et al. / Organizational Behavior and Human Decision Processes 105 (2008) 98–121
Author's personal copy
Study 1
In Study 1, college students assessed their perfor-mance on a challenging in-class exam immediately aftercompleting it. They judged how well they had done rel-ative to other students in the class and also estimatedtheir raw score—the number of questions answered cor-rectly. We predicted that bottom performers wouldoverestimate their performance regardless of type ofmeasure used. Top performers would underestimatetheir performance relative to their peers, but wouldshow much less, if any, underestimation on the rawscore measure.
Study 1 replicates a study in Dunning et al. (2003),showing that students doing badly on a course examtended to grossly overestimate their performancewhether relative (e.g., percentile) or absolute (e.g., rawscore) measures were used. This study also adds oneimportant extension. Using students’ performances ona second course exam, we could calculate the test-retestreliability of students’ performance in the class. Thisreliability estimate could be used to correct for measure-ment error. Then, we could see the extent to which theoriginal pattern of results evaporated once controllingfor measurement error in this ecologically valid setting.We predicted that much of the original pattern wouldremain strong even after correcting for measurementerror.
MethodsParticipants. Participants were 124 out of 238 studentsenrolled in an intermediate-level large-lecture psychol-ogy course psychology course. Students received extracredit toward their course grade for participating.
Procedure. Participants responded to a short question-naire attached to the end of their first preliminary exam-ination in the course. Participants were asked to providea percentile rating of their mastery of course material, aswell as their specific performance on the course exami-nation. Ratings could range from 1 (the student believedthey would have the lowest score out of every hundredstudents) to 99 (the student would have the best scoreout of every hundred students. Participants also esti-mated their raw exam score (out of 40 possible), as wellas the average score students in the class would attain.
The exam consisted of 22 multiple-choice questionsand three essays worth six points each. Participantscompleted the questionnaire and handed it in beforeleaving the exam session. On the questionnaire, partici-pants also gave permission for the researchers to laterobtain their score on the test. Five weeks later, duringthe second preliminary exam session in the course, wefollowed the identical procedure to collect participants’perceptions of their exam performance, as well as thereality of performance.
Results and discussion
Although the difficulty of this real life course examwas, of course, not manipulated for experimental pur-poses, we think it important to note that it was, in fact,a challenging exam. On average, students answered71.2% of questions correctly, with bottom performersfailing the exam (55.5% correct) and top performersearning, on average, a B+ (87% correct).
Despite the difficulty of this exam, as predicted, par-ticipants overestimated their performance and their abil-ity level (relative to their performance). Participantsthought that their mastery of the course material layin the 71st percentile, when their performance actuallyplaced them in the 49th, t(120) = 8.74, p < .0001. Simi-larly, participants thought that their test performanceplaced them in the 68th percentile—again, an overesti-mate, t(120) = 8.12, p < .0001. Not surprisingly, partici-pants also tended to overestimate their raw score on thetest by roughly 3.5 points (estimated score = 32.0; actualscore = 28.5), t(120) = 7.88, p < .0001. Students whocompleted the survey did not differ significantly in termsof average performance or variance from students whoopted not to complete the survey.
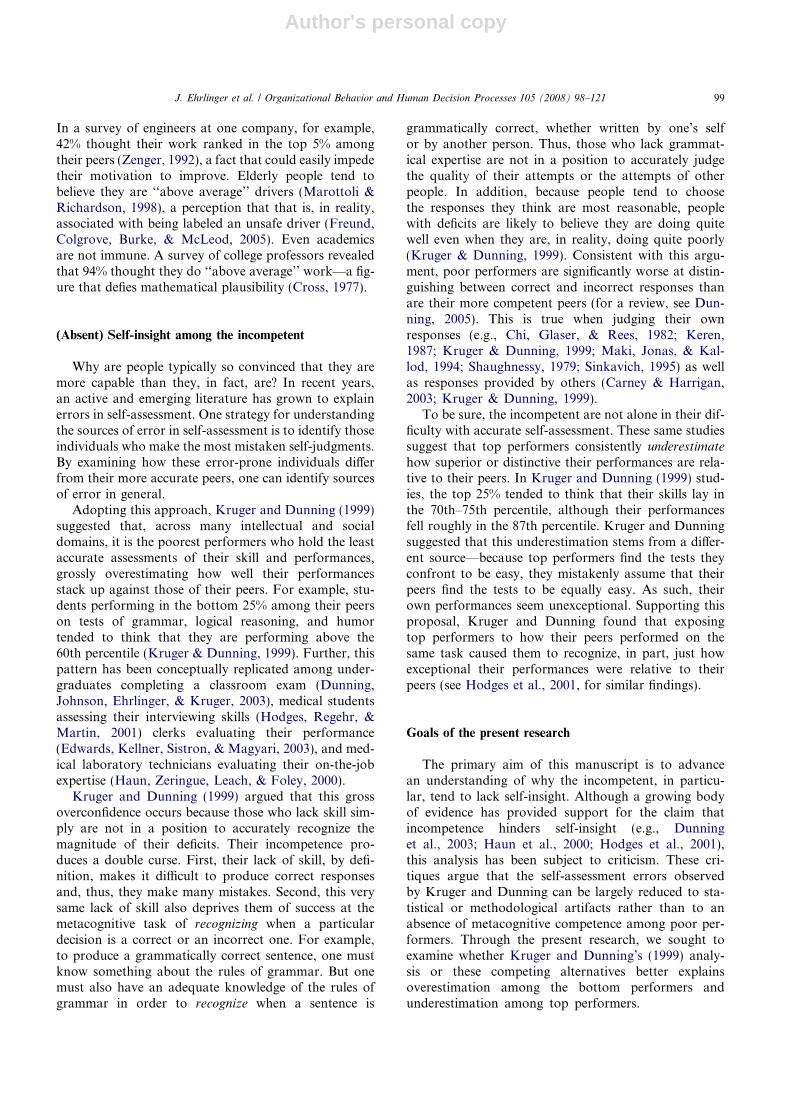
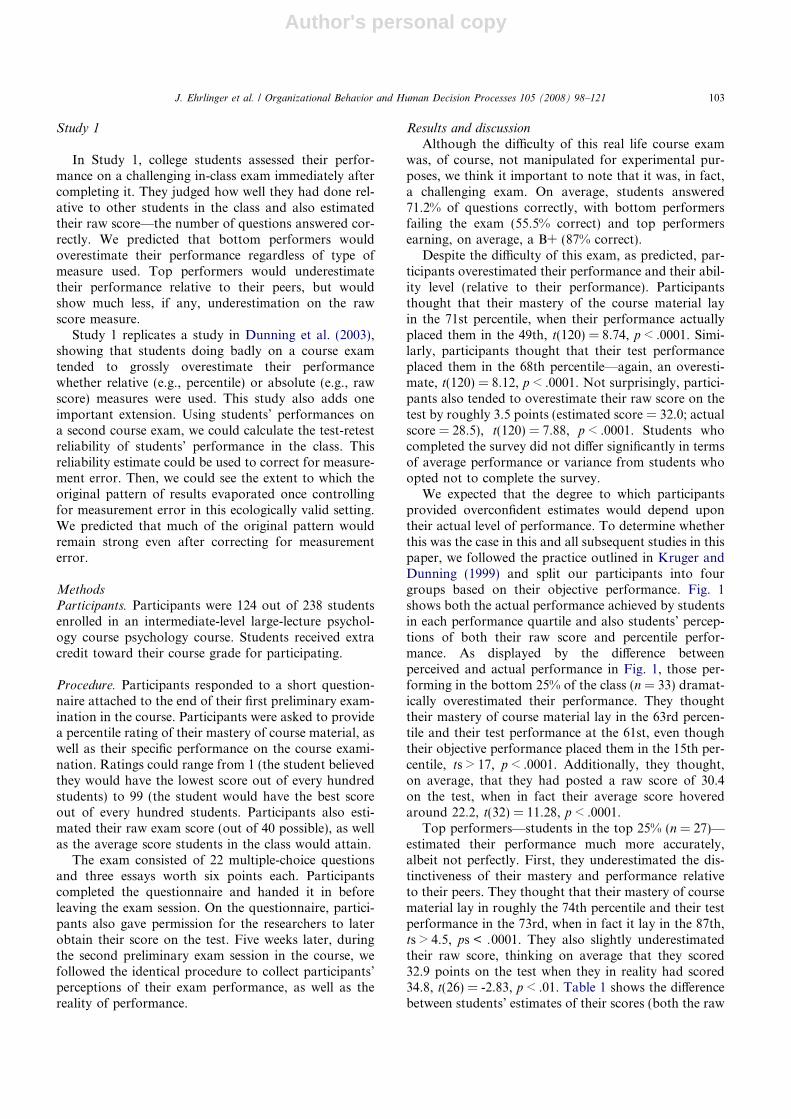
We expected that the degree to which participantsprovided overconfident estimates would depend upontheir actual level of performance. To determine whetherthis was the case in this and all subsequent studies in thispaper, we followed the practice outlined in Kruger andDunning (1999) and split our participants into fourgroups based on their objective performance. Fig. 1shows both the actual performance achieved by studentsin each performance quartile and also students’ percep-tions of both their raw score and percentile perfor-mance. As displayed by the difference betweenperceived and actual performance in Fig. 1, those per-forming in the bottom 25% of the class (n = 33) dramat-ically overestimated their performance. They thoughttheir mastery of course material lay in the 63rd percen-tile and their test performance at the 61st, even thoughtheir objective performance placed them in the 15th per-centile, ts > 17, p < .0001. Additionally, they thought,on average, that they had posted a raw score of 30.4on the test, when in fact their average score hoveredaround 22.2, t(32) = 11.28, p < .0001.
Top performers—students in the top 25% (n = 27)—estimated their performance much more accurately,albeit not perfectly. First, they underestimated the dis-tinctiveness of their mastery and performance relativeto their peers. They thought that their mastery of coursematerial lay in roughly the 74th percentile and their testperformance in the 73rd, when in fact it lay in the 87th,ts > 4.5, ps < .0001. They also slightly underestimatedtheir raw score, thinking on average that they scored32.9 points on the test when they in reality had scored34.8, t(26) = -2.83, p < .01. Table 1 shows the differencebetween students’ estimates of their scores (both the raw
J. Ehrlinger et al. / Organizational Behavior and Human Decision Processes 105 (2008) 98–121 103
Author's personal copy
score and percentile) and the score they actuallyachieved, split by level of performance.
Correcting for measurement error. How much of thisover- and underestimation was due to lack of reliability,and thus measurement error? To estimate this, we usedparticipants’ scores on the second preliminary examina-tion to provide an estimate of test-retest reliability. Interms of percentile rankings, the ranks participantsachieved on this first exam correlated .52 with the ranksthey obtained on the second exam. In terms of rawscore, performance on the first exam correlated .50 withperformance on the second.
Using these reliability estimates, we then recalculatedwhat the regression slope would be if we assumed per-fect reliability. The classic formula (Bollen, 1989) forthat calculation is:
Bcorrected ¼ Bobserved=reliability estimate
This typically results in a steeper regression slope thanthat originally observed. Correcting for the reliabilityassociated with the dependent measure (in this case, par-ticipants’ performance estimates) does not alter this rela-tionship or enter into the correction of the regressionslope (Bollen, 1989). This altered regression slope cor-rection, however, also calls for a revision of the interceptassociated with the relevant regression equation. Be-cause any regression slope must pass through the pointrepresenting the mean of both independent and depen-dent variables (i.e., objective performance, estimatedperformance, respectively), the corrected intercept canbe calculated as:
interceptcorrected
¼ average performance estimate� Bcorrected
� average objective performance
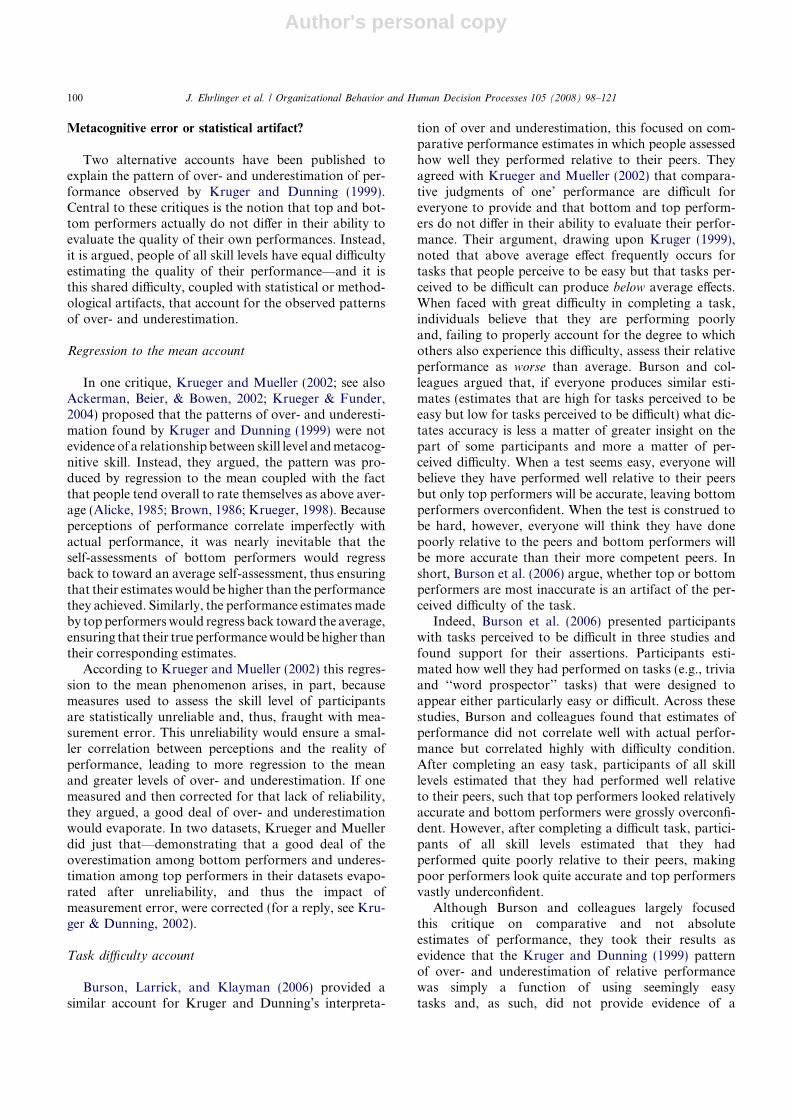
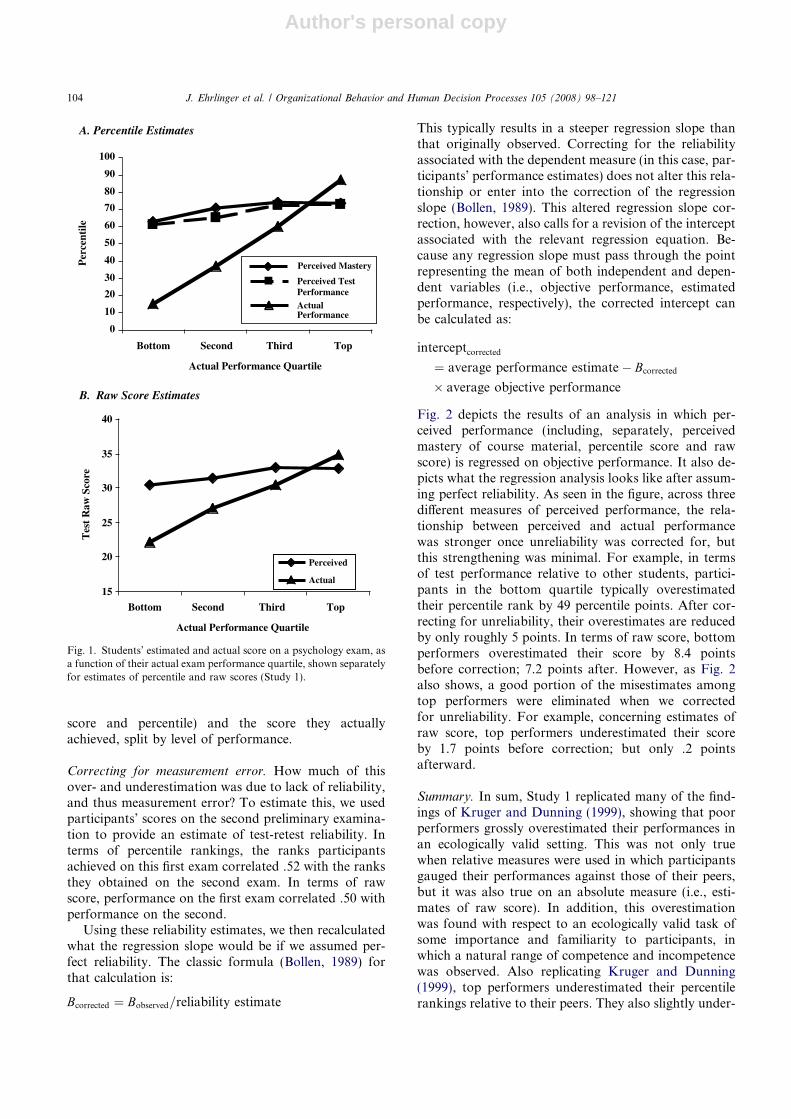
Fig. 2 depicts the results of an analysis in which per-ceived performance (including, separately, perceivedmastery of course material, percentile score and rawscore) is regressed on objective performance. It also de-picts what the regression analysis looks like after assum-ing perfect reliability. As seen in the figure, across threedifferent measures of perceived performance, the rela-tionship between perceived and actual performancewas stronger once unreliability was corrected for, butthis strengthening was minimal. For example, in termsof test performance relative to other students, partici-pants in the bottom quartile typically overestimatedtheir percentile rank by 49 percentile points. After cor-recting for unreliability, their overestimates are reducedby only roughly 5 points. In terms of raw score, bottomperformers overestimated their score by 8.4 pointsbefore correction; 7.2 points after. However, as Fig. 2also shows, a good portion of the misestimates amongtop performers were eliminated when we correctedfor unreliability. For example, concerning estimates ofraw score, top performers underestimated their scoreby 1.7 points before correction; but only .2 pointsafterward.
Summary. In sum, Study 1 replicated many of the find-ings of Kruger and Dunning (1999), showing that poorperformers grossly overestimated their performances inan ecologically valid setting. This was not only truewhen relative measures were used in which participantsgauged their performances against those of their peers,but it was also true on an absolute measure (i.e., esti-mates of raw score). In addition, this overestimationwas found with respect to an ecologically valid task ofsome importance and familiarity to participants, inwhich a natural range of competence and incompetencewas observed. Also replicating Kruger and Dunning(1999), top performers underestimated their percentilerankings relative to their peers. They also slightly under-
15
20
25
30
35
40
Bottom Second Third Top
Actual Performance Quartile
Tes
t R
aw S
core
Perceived
Actual
0
10
20
30
40
50
60
70
80
90
100
Bottom Second Third Top
Actual Performance Quartile
Per
cent
ile
Perceived Mastery
Perceived TestPerformanceActualPerformance
B. Raw Score Estimates
A. Percentile Estimates
Fig. 1. Students’ estimated and actual score on a psychology exam, asa function of their actual exam performance quartile, shown separatelyfor estimates of percentile and raw scores (Study 1).
104 J. Ehrlinger et al. / Organizational Behavior and Human Decision Processes 105 (2008) 98–121
Author's personal copy
estimated their absolute performance, but the magni-tude of that underestimation did not approach the mis-judgments seen among their bottom performing peers.Finally, correcting for measurement error, or ratherthe unreliability of performance measures, only mini-mally attenuated the patterns of misestimation. Indeed,even after assuming perfect reliability, bottom perform-ers still dramatically overestimated how well they haddone.
Study 2
Study 2 provided a conceptual replication of Study1. A few times each year, Cornell University holdsdebate tournaments in which teams from the North-eastern United States and Eastern Canada convergeto compete. During preliminary rounds of the tourna-ment, teams compete with each other but are not givenany feedback about how well they are doing. We tookadvantage of this situation to ask participants to esti-mate how well they were doing, and then comparedtheir perceptions against the reality of theirperformance.
Thus, this was the perfect forum to gauge whetherdebater’s perceptions of competence match thoseobserved by Kruger and Dunning (1999) in another eco-logically valid situation. This situation had an additionaladvantage in that we did not create the performancemetric nor were we involved in the evaluation ofparticipants.
Finally, we corrected for unreliability in one perfor-mance estimate, as in Study 1, to see to the degree towhich psychological, rather than statistical errorsexplain a lack of insight among the incompetent.
Methods
Participants. Participants came from 54 2-person teamswho had convened for a regional debate tournamentat Cornell University. Of those, 58 provided an ade-quate number of self-evaluations (see below) to qualifyto be in our sample.
Procedure. The study was conducted during the preli-minary rounds of the debate tournament. In each ofsix preliminary rounds, each team debates anotherteam on a topic chosen by tournament organizers.The two teams are observed by a judge, who deter-mines which team wins and rank orders the four indi-viduals in terms of the quality of their performance.The judge also scores the 4 after each round on a 30-point scale running from 1 to 30, although in practicevirtually all ratings fall between 22 and 27. Thus, foreach participant on each round, we had three measuresof objective performance: whether the participants’team had won, his or her rank, and the score the judgehad given.
After each round, teams are re-paired. Teams thatwin on the first round are paired with other winners; los-ers on each round are paired with losers. Importantly,no participant is told how well he or she, or the team,did until all six preliminary rounds are over.
We asked tournament participants to estimate howwell they thought they had done. Specifically, they pre-dicted whether their team had won, what rank theyhad personally attained, as well as what score the judgehad given them. Participants filled out these estimatesand identified themselves on short questionnaires aftereach round, which they then deposited in a box.Of 108 total tournament participants, 58 rated their
Table 1The difference between students’ perceived and actual performance across studies, as a function of how well they actually performed (bottom quartile,top quartile, or in the middle 50%), presented separately for estimates of their percentile and raw scores
Group Bottom 25% Middle 50% Top 25%
Study Perceived (%) Actual (%) Difference (%) Perceived (%) Actual (%) Difference (%) Perceived (%) Actual (%) Difference (%)
Performance percentile estimates
Study 1 61.2 14.9 46.3*** 69.4 49.8 19.6*** 73.3 87.0 �13.7***
Study 3 64.0 11.4 52.6%** 51.6 45.4 6.2 61.5 86.9 �25.4*
Study 4 58.8 14.0 44.8%*** 67.3 56.1 11.2** 68.6 92.1 �23.5**
Study 5 64.4 17.1 47.3%*** 73.3 56.0 17.3*** 71.4 89.4 �18.0*
Overall 62.1 14.4 47.8% 65.4 51.8 13.6 68.7 88.9 �20.2
Raw score estimates (as a percentage of total possible)
Study 1 76.0 55.3 20.7*** 76.0 55.3 20.1*** 82.3 87.0 �4.7*
Study 3 37.5 7.0 30.5** 78.2 56.4 30.5 73.3 83.7 �10.4*
Study 4 60.0 41.3 18.7*** 64.7 60.6 18.7 71.7 74.4 �2.7Study 5 66.4 50.0 16.4* 71.6 74.4 16.4 75.0 91.3 �16.3**
Overall 60.0 38.4 21.6 72.6 61.7 21.4 75.6 84.1 �8.5
Note. Participants did not provide comparable percentile and raw score estimates in Study 2.* p < .05.
** p < .005.*** p < .0001.
J. Ehrlinger et al. / Organizational Behavior and Human Decision Processes 105 (2008) 98–121 105
Author's personal copy
performance on at least three of the six rounds, and sowere included in our final sample.
After the preliminary rounds are over, how each indi-vidual and team did was made publicly available. Weexamined and transcribed these records to obtain ourmeasures of objective performance. Data from four indi-viduals were lost. Thus, we had objective performancemeasures for 104 debate tournament participants.
Results and discussion
To make the ranking measure commensurate with thetwo other measures of objective performance, in which
higher scores meant better performance, we reverse-scored the ranking measure so that 4 meant that theindividual was rated best in group and 1 as worst ingroup.
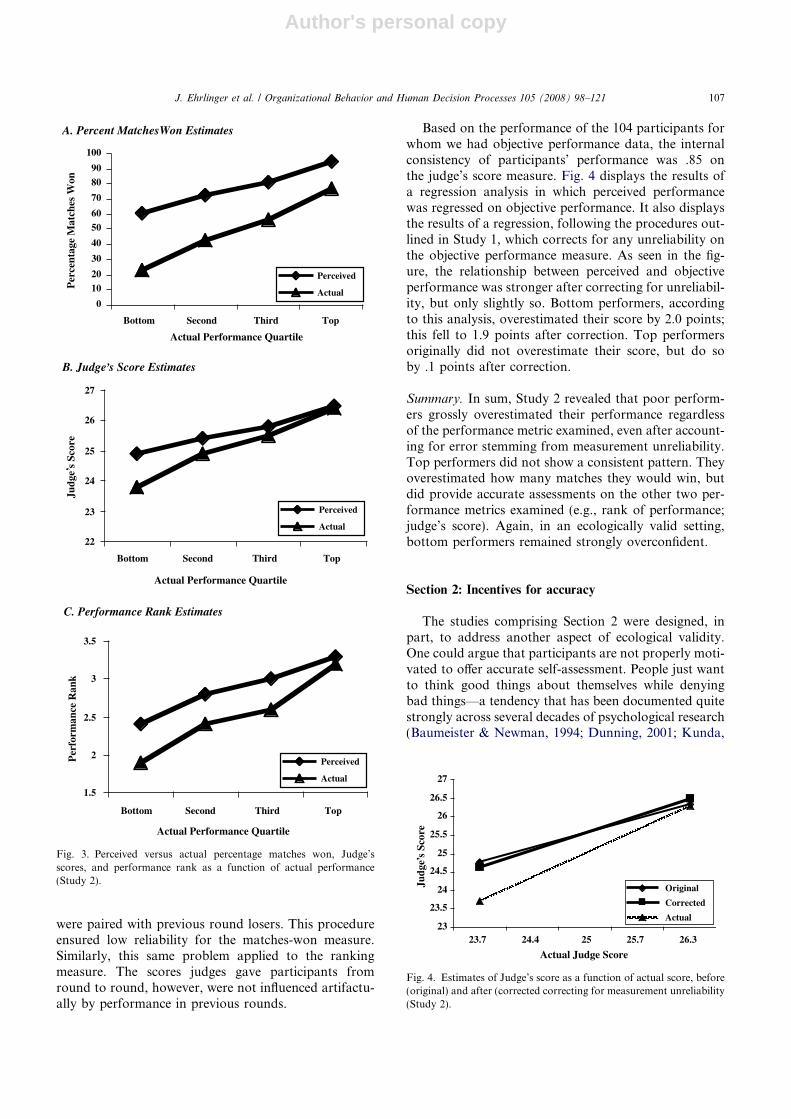
Looking over all measures, we find that tournamentparticipants overrated their performance. On average,they thought they won 75.4% of their matches, whereasthey actually won only 46.7% of them, t(57) = 8.85,p < .0001. They thought they achieved a rank of 2.8,whereas they actually achieved only 2.4, t(57) = 5.09,p < .0001. They thought on average that judges wouldgive them a score of 25.6, whereas the judge gave onlya 25.0, t(57) = 5.74, p < .0001.
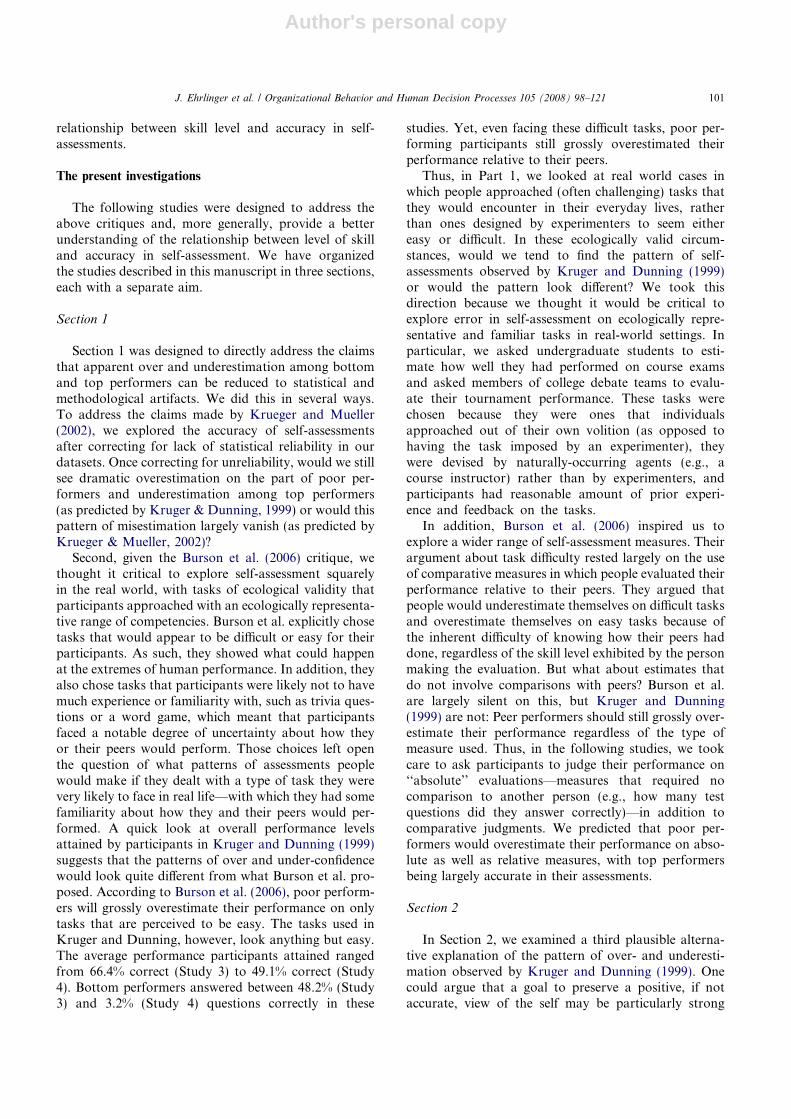
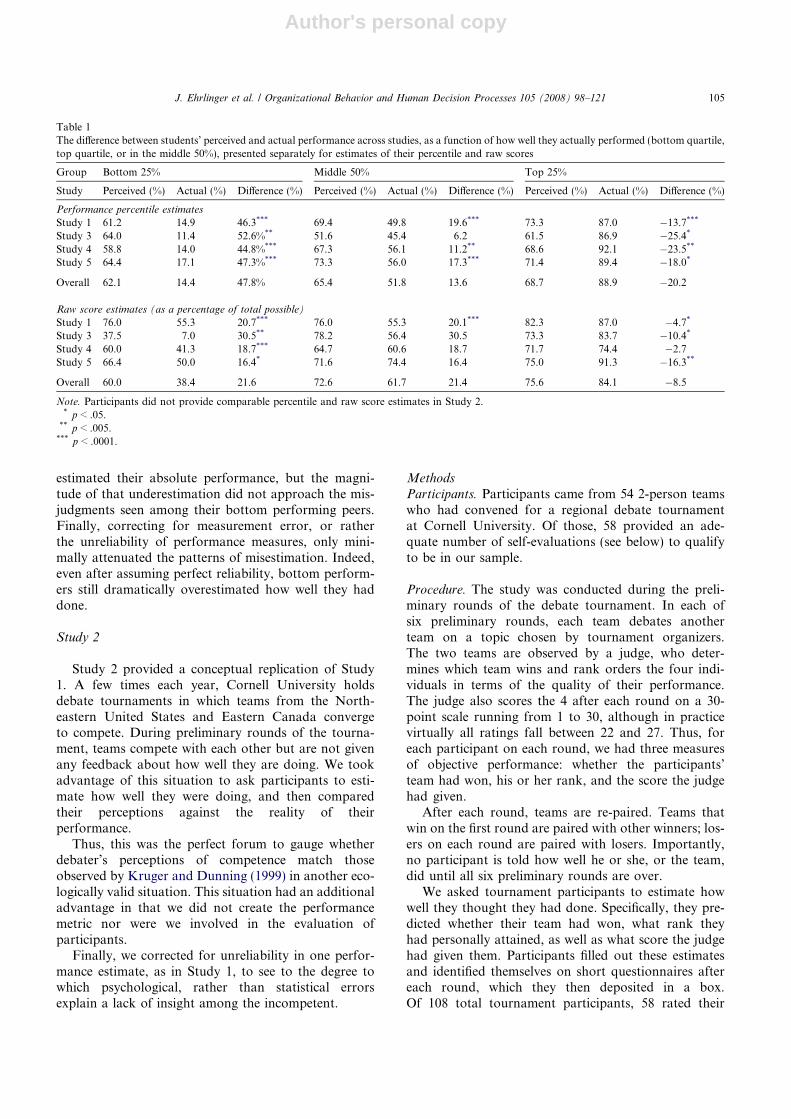
As in Study 1, we separated participants into fourgroups based on their objective performance, using thesum of the scores judges had given them over the sixrounds. As seen in Fig. 3, participants performing inthe bottom 25% grossly overestimated their perfor-mance. They thought they had won nearly 59% of theirmatches, yet they won only 22% of them, t(17) = 5.09,p < .0001. They thought they achieved a ranking of 2.4when their actual rank was 1.9, t(17) = 4.80, p < .0001.They thought judges would score them as a 24.9 whenthey actually received scores on average of around23.8, t(16) = 5.65, p < .0001.
Top performers (those in the top 25%) did not tend tooverestimate their performances as much. To be sure,they did overestimate the percentage of matches theywon, perceiving that they won 95% when they actuallywon only 77%, t(10) = 3.46, p < .01. However,they did not misestimate, on average, what rank theyachieved (3.3 and 3.2 for perceived versus actual, respec-tively), t(10) = .52, ns, nor the score judge’s gave them(26.5 and 26.4 for perceived versus actual, respectively),t(10) = .51, ns.
Correcting for measurement error. In sum, this study rep-licated much of the pattern found in Kruger and Dun-ning (1999). Bottom performers significantlyoverestimated their performances; top performers gaveestimates that, although not perfect, were more closelyon the mark. However, how much of the erroneousself-assessment by bottom performers was due to mea-surement error? To assess this, we focused on the scoresjudges gave to participants. We focused on this measurebecause calculating reliability on the other two measureswas inappropriate for two reasons. First, how well a per-son did on these measures depended on the perfor-mances of others as well as their own performance.Second, debate tournament procedures ensured thatthe reliability of these measures would be low. Becausewinners in one round would be paired with other win-ners in the next round, this heightened the probabilitythat a winner in a previous round would lose in the sub-sequent round. The reverse was true for losers, who weremore likely to win in subsequent rounds because they
0
20
40
60
80
100
10 30 50 70 90
Actual Percentile
Per
cent
ile
0
20
40
60
80
100
10 30 50 70 90
Actual Percentile
Per
cent
ile
15
20
25
30
35
40
21 24.5 28 31.5 35
Actual Raw Score
Raw
Sco
re
OriginalCorrectedActual
A. Percentile Mastery Estimates
B. Percentile Test Performance Estimates
C. Raw Score Estimates
OriginalCorrected
OriginalCorrected
Actual
Actual
Fig. 2. Comparison of students’ estimated and actual exam perfor-mance before (original) and after (corrected) correcting for measure-ment unreliability. This relationship is displayed separately forstudents’ estimated mastery of course material, percentile performancerelative to other classmates, and raw exam score (Study 1).
106 J. Ehrlinger et al. / Organizational Behavior and Human Decision Processes 105 (2008) 98–121
Author's personal copy
were paired with previous round losers. This procedureensured low reliability for the matches-won measure.Similarly, this same problem applied to the rankingmeasure. The scores judges gave participants fromround to round, however, were not influenced artifactu-ally by performance in previous rounds.
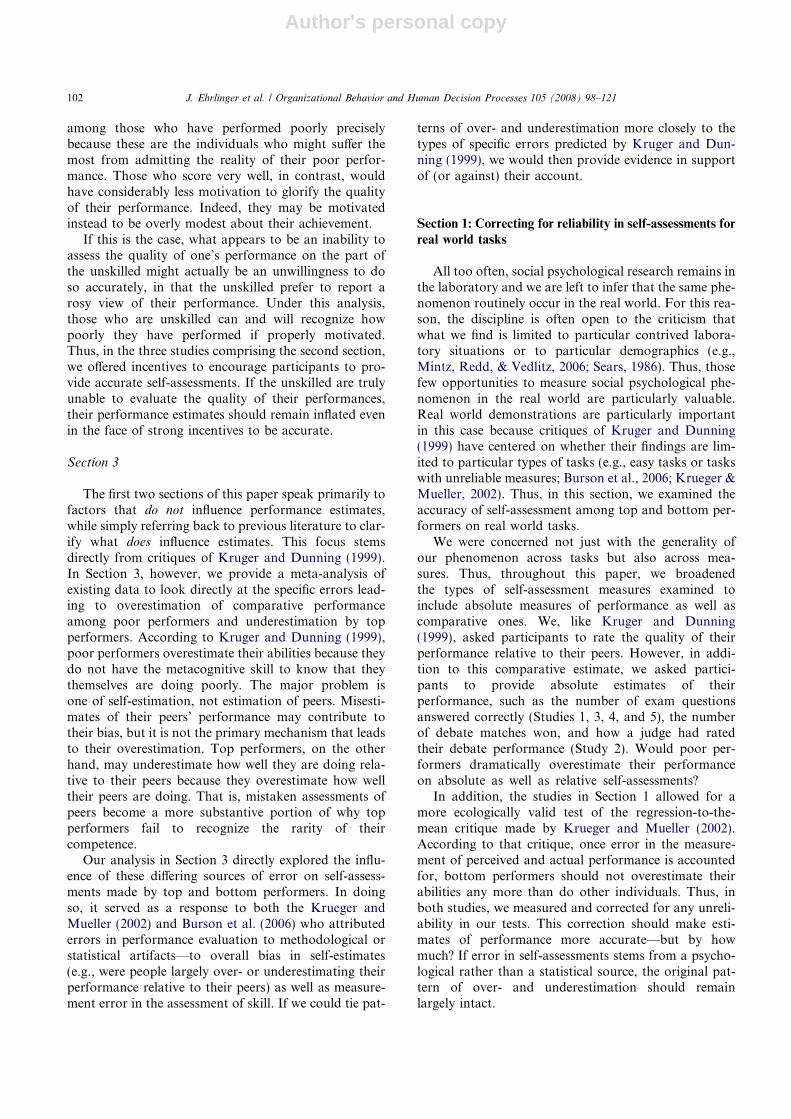
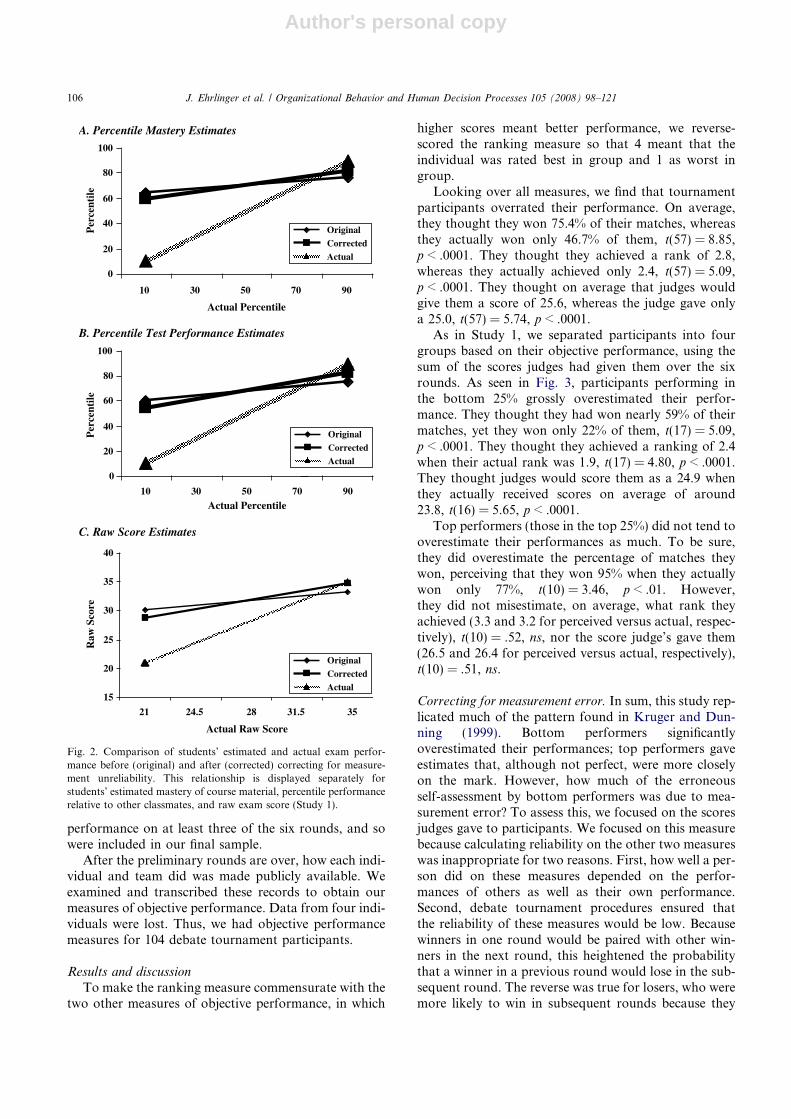
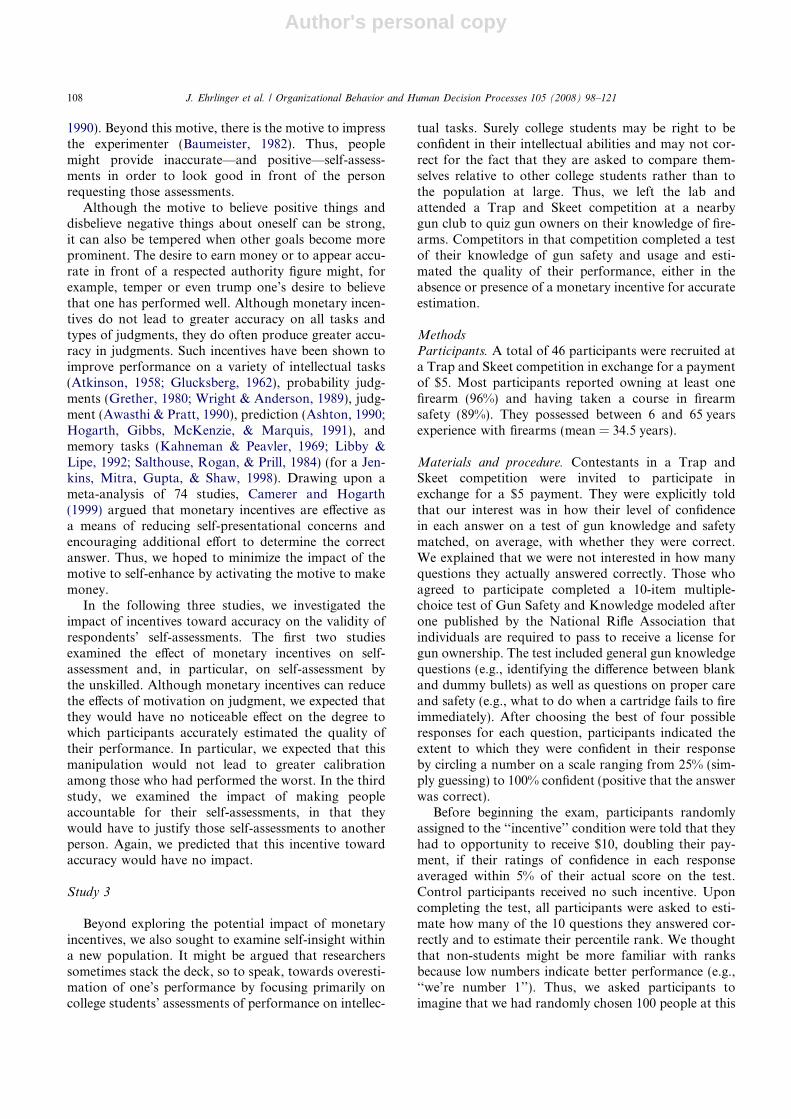
Based on the performance of the 104 participants forwhom we had objective performance data, the internalconsistency of participants’ performance was .85 onthe judge’s score measure. Fig. 4 displays the results ofa regression analysis in which perceived performancewas regressed on objective performance. It also displaysthe results of a regression, following the procedures out-lined in Study 1, which corrects for any unreliability onthe objective performance measure. As seen in the fig-ure, the relationship between perceived and objectiveperformance was stronger after correcting for unreliabil-ity, but only slightly so. Bottom performers, accordingto this analysis, overestimated their score by 2.0 points;this fell to 1.9 points after correction. Top performersoriginally did not overestimate their score, but do soby .1 points after correction.
Summary. In sum, Study 2 revealed that poor perform-ers grossly overestimated their performance regardlessof the performance metric examined, even after account-ing for error stemming from measurement unreliability.Top performers did not show a consistent pattern. Theyoverestimated how many matches they would win, butdid provide accurate assessments on the other two per-formance metrics examined (e.g., rank of performance;judge’s score). Again, in an ecologically valid setting,bottom performers remained strongly overconfident.
Section 2: Incentives for accuracy
The studies comprising Section 2 were designed, inpart, to address another aspect of ecological validity.One could argue that participants are not properly moti-vated to offer accurate self-assessment. People just wantto think good things about themselves while denyingbad things—a tendency that has been documented quitestrongly across several decades of psychological research(Baumeister & Newman, 1994; Dunning, 2001; Kunda,
0
1020
30
40
5060
70
8090
100
Bottom Second Third Top
Actual Performance Quartile
Per
cent
age
Mat
ches
Won
22
23
24
25
26
27
Bottom Second Third Top
Actual Performance Quartile
Judg
e s
Scor
e
1.5
2
2.5
3
3.5
Bottom Second Third Top
Actual Performance Quartile
Per
form
ance
Ran
k
Perceived
Actual
A. Percent MatchesWon Estimates
B. Judge s Score Estimates
C. Performance Rank Estimates
Perceived
Actual
Perceived
Actual
Fig. 3. Perceived versus actual percentage matches won, Judge’sscores, and performance rank as a function of actual performance(Study 2).
23
23.5
24
24.5
25
25.5
26
26.5
27
23.7 24.4 25 25.7 26.3
Actual Judge Score
Judg
e s
Scor
e
Original
Corrected
Actual
Fig. 4. Estimates of Judge’s score as a function of actual score, before(original) and after (corrected correcting for measurement unreliability(Study 2).
J. Ehrlinger et al. / Organizational Behavior and Human Decision Processes 105 (2008) 98–121 107
Author's personal copy
1990). Beyond this motive, there is the motive to impressthe experimenter (Baumeister, 1982). Thus, peoplemight provide inaccurate—and positive—self-assess-ments in order to look good in front of the personrequesting those assessments.
Although the motive to believe positive things anddisbelieve negative things about oneself can be strong,it can also be tempered when other goals become moreprominent. The desire to earn money or to appear accu-rate in front of a respected authority figure might, forexample, temper or even trump one’s desire to believethat one has performed well. Although monetary incen-tives do not lead to greater accuracy on all tasks andtypes of judgments, they do often produce greater accu-racy in judgments. Such incentives have been shown toimprove performance on a variety of intellectual tasks(Atkinson, 1958; Glucksberg, 1962), probability judg-ments (Grether, 1980; Wright & Anderson, 1989), judg-ment (Awasthi & Pratt, 1990), prediction (Ashton, 1990;Hogarth, Gibbs, McKenzie, & Marquis, 1991), andmemory tasks (Kahneman & Peavler, 1969; Libby &Lipe, 1992; Salthouse, Rogan, & Prill, 1984) (for a Jen-kins, Mitra, Gupta, & Shaw, 1998). Drawing upon ameta-analysis of 74 studies, Camerer and Hogarth(1999) argued that monetary incentives are effective asa means of reducing self-presentational concerns andencouraging additional effort to determine the correctanswer. Thus, we hoped to minimize the impact of themotive to self-enhance by activating the motive to makemoney.
In the following three studies, we investigated theimpact of incentives toward accuracy on the validity ofrespondents’ self-assessments. The first two studiesexamined the effect of monetary incentives on self-assessment and, in particular, on self-assessment bythe unskilled. Although monetary incentives can reducethe effects of motivation on judgment, we expected thatthey would have no noticeable effect on the degree towhich participants accurately estimated the quality oftheir performance. In particular, we expected that thismanipulation would not lead to greater calibrationamong those who had performed the worst. In the thirdstudy, we examined the impact of making peopleaccountable for their self-assessments, in that theywould have to justify those self-assessments to anotherperson. Again, we predicted that this incentive towardaccuracy would have no impact.
Study 3
Beyond exploring the potential impact of monetaryincentives, we also sought to examine self-insight withina new population. It might be argued that researcherssometimes stack the deck, so to speak, towards overesti-mation of one’s performance by focusing primarily oncollege students’ assessments of performance on intellec-
tual tasks. Surely college students may be right to beconfident in their intellectual abilities and may not cor-rect for the fact that they are asked to compare them-selves relative to other college students rather than tothe population at large. Thus, we left the lab andattended a Trap and Skeet competition at a nearbygun club to quiz gun owners on their knowledge of fire-arms. Competitors in that competition completed a testof their knowledge of gun safety and usage and esti-mated the quality of their performance, either in theabsence or presence of a monetary incentive for accurateestimation.
MethodsParticipants. A total of 46 participants were recruited ata Trap and Skeet competition in exchange for a paymentof $5. Most participants reported owning at least onefirearm (96%) and having taken a course in firearmsafety (89%). They possessed between 6 and 65 yearsexperience with firearms (mean = 34.5 years).
Materials and procedure. Contestants in a Trap andSkeet competition were invited to participate inexchange for a $5 payment. They were explicitly toldthat our interest was in how their level of confidencein each answer on a test of gun knowledge and safetymatched, on average, with whether they were correct.We explained that we were not interested in how manyquestions they actually answered correctly. Those whoagreed to participate completed a 10-item multiple-choice test of Gun Safety and Knowledge modeled afterone published by the National Rifle Association thatindividuals are required to pass to receive a license forgun ownership. The test included general gun knowledgequestions (e.g., identifying the difference between blankand dummy bullets) as well as questions on proper careand safety (e.g., what to do when a cartridge fails to fireimmediately). After choosing the best of four possibleresponses for each question, participants indicated theextent to which they were confident in their responseby circling a number on a scale ranging from 25% (sim-ply guessing) to 100% confident (positive that the answerwas correct).
Before beginning the exam, participants randomlyassigned to the ‘‘incentive’’ condition were told that theyhad to opportunity to receive $10, doubling their pay-ment, if their ratings of confidence in each responseaveraged within 5% of their actual score on the test.Control participants received no such incentive. Uponcompleting the test, all participants were asked to esti-mate how many of the 10 questions they answered cor-rectly and to estimate their percentile rank. We thoughtthat non-students might be more familiar with ranksbecause low numbers indicate better performance (e.g.,‘‘we’re number 1’’). Thus, we asked participants toimagine that we had randomly chosen 100 people at this
108 J. Ehrlinger et al. / Organizational Behavior and Human Decision Processes 105 (2008) 98–121
Author's personal copy
event, including them, and that we rank these individu-als according to their score on the test of gun safety andknowledge. We then asked participants to estimate whattheir rank would be from 1 (‘‘My score would be at thevery bottom, worse than the other 99 people’’) to 100(‘‘My score would be at the very top, better than theother 99 people’’). Finally, participants estimated thenumber of questions that would be answered correctly,on average, by their peers.
Results and discussion1
As in Study 2, in order to maintain a consistencyacross experiments, we reverse scored estimates of one’srank so that higher numbers mean better performance.
Accuracy of self-assessments. Participants dramaticallyoverestimated the quality of their performance on thetest of gun safety and knowledge. They believed, onaverage, that they had correctly answered 2.06 morequestions than they actually did, t(41) = 7.22, p < .001)and they overestimated the likelihood that individualresponses were accurate, on average, by 28%,t(43) = 11.28, p < .001). Although participants believedthat their percentile score was, on average, only 6.8%higher than it actually was—a difference that was notsignificantly different from zero, t(38) = 1.00, ns).2
We again split participants into four groups based ontheir objective performance on the quiz. We then exam-ined self-insight as measured by accuracy in (1) esti-mates of the number of questions answered correctly,(2) estimates of one’s percentile score, and (3) the levelof confidence one reported for each individual response.Participants in the bottom 25th percentile were dramat-
ically overconfident on all three measures (see Table 1).They offered overconfident estimates of the number ofquestions answered correctly, t(7) = 4.08, p < .005, theywere far more likely than their more skilled peers tooverestimate their percentile score, t(7) = 5.14, p < .001and to be overconfident with respect to individual items,t(7) = 10.40, p < .001. Note that overconfidence mightbe particularly worrisome in this case. Certainly weshould worry about the poor students whose overconfi-dence might keep them from studying and improvingtheir level of skill. Note, however, these individuals pri-marily hurt themselves. This is not necessarily true forindividuals who perform poorly on a test of gun safetyand knowledge but whom own and use guns oftenenough to participate in Trap and Skeet competition.Recognizing their misconceptions about how to safelyuse a gun is critical not just for the individual but alsofor those within firing range.
Top performers provided self-assessments that laycloser to objective performance. They know about gunsand they have greater insight into just how much theyknow, although they did tend to underestimate theirperformance, such as total number of items gotten right(t(11) = �2.38, p < .05), how distinctive their perfor-mances were relative to their peers (t(10) = �2.57,p < .05) and the likelihood that each individual itemwould be correct (t(12) = 4.13, p < .001).
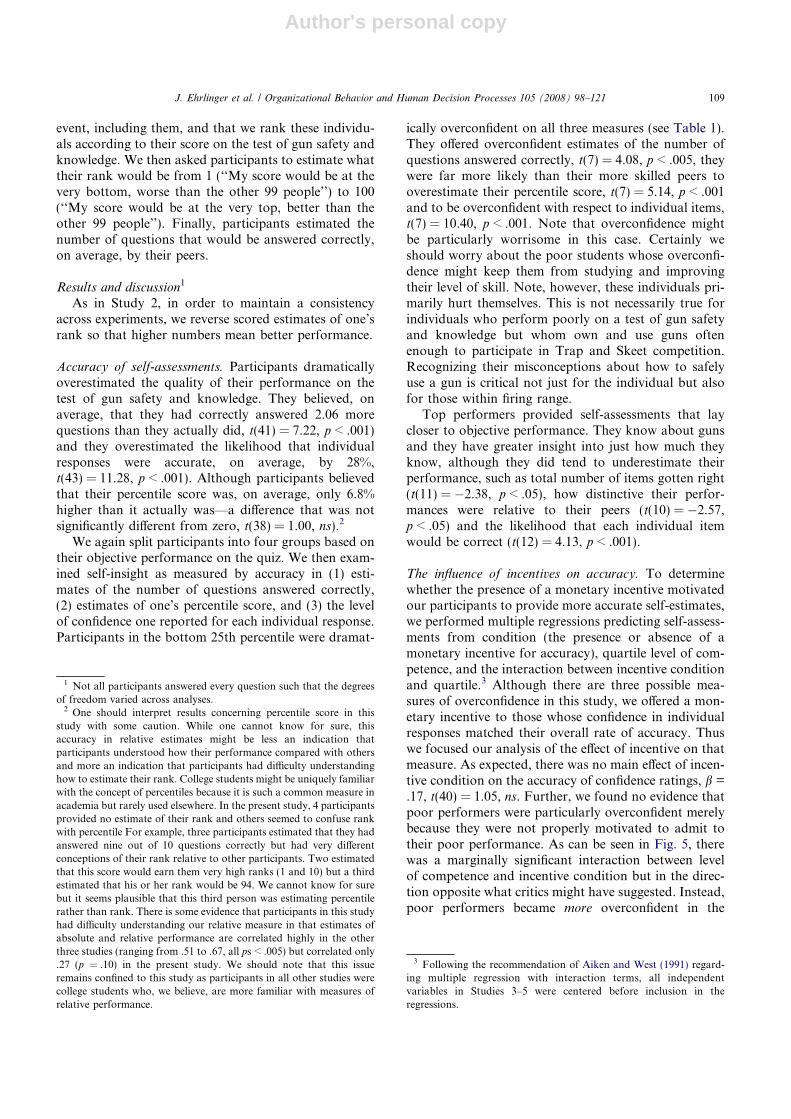
The influence of incentives on accuracy. To determinewhether the presence of a monetary incentive motivatedour participants to provide more accurate self-estimates,we performed multiple regressions predicting self-assess-ments from condition (the presence or absence of amonetary incentive for accuracy), quartile level of com-petence, and the interaction between incentive conditionand quartile.3 Although there are three possible mea-sures of overconfidence in this study, we offered a mon-etary incentive to those whose confidence in individualresponses matched their overall rate of accuracy. Thuswe focused our analysis of the effect of incentive on thatmeasure. As expected, there was no main effect of incen-tive condition on the accuracy of confidence ratings, b =
.17, t(40) = 1.05, ns. Further, we found no evidence thatpoor performers were particularly overconfident merelybecause they were not properly motivated to admit totheir poor performance. As can be seen in Fig. 5, therewas a marginally significant interaction between levelof competence and incentive condition but in the direc-tion opposite what critics might have suggested. Instead,poor performers became more overconfident in the
1 Not all participants answered every question such that the degreesof freedom varied across analyses.
2 One should interpret results concerning percentile score in thisstudy with some caution. While one cannot know for sure, thisaccuracy in relative estimates might be less an indication thatparticipants understood how their performance compared with othersand more an indication that participants had difficulty understandinghow to estimate their rank. College students might be uniquely familiarwith the concept of percentiles because it is such a common measure inacademia but rarely used elsewhere. In the present study, 4 participantsprovided no estimate of their rank and others seemed to confuse rankwith percentile For example, three participants estimated that they hadanswered nine out of 10 questions correctly but had very differentconceptions of their rank relative to other participants. Two estimatedthat this score would earn them very high ranks (1 and 10) but a thirdestimated that his or her rank would be 94. We cannot know for surebut it seems plausible that this third person was estimating percentilerather than rank. There is some evidence that participants in this studyhad difficulty understanding our relative measure in that estimates ofabsolute and relative performance are correlated highly in the otherthree studies (ranging from .51 to .67, all ps < .005) but correlated only.27 (p = .10) in the present study. We should note that this issueremains confined to this study as participants in all other studies werecollege students who, we believe, are more familiar with measures ofrelative performance.
3 Following the recommendation of Aiken and West (1991) regard-ing multiple regression with interaction terms, all independentvariables in Studies 3–5 were centered before inclusion in theregressions.
J. Ehrlinger et al. / Organizational Behavior and Human Decision Processes 105 (2008) 98–121 109
Author's personal copy
presence of a monetary incentive, b = �.31,t(40) = �1.74, p < .10.
Although participants were explicitly told that theywould earn money only if they accurately evaluatedwhether they had answered individual questions cor-rectly, one might wonder whether this incentive influ-enced the accuracy of other self-assessment measures.We performed two additional multiple regressions todetermine whether monetary incentives influenced accu-racy in estimates of the number of questions answeredcorrectly and estimates of one’s score relative to otherparticipants at the Trap and Skeet competition. As withconfidence in individual questions, the opportunity towin money did not lead to more accurate assessmentsof one’s relative score (b = .01, t(35) = .14, ns) or thenumber of questions answered correctly (b = �.22,t(38) = 1.44, ns). Further, we found additional supportfor the somewhat counterintuitive finding that monetaryincentives made poor performers more overconfident,relative to controls. Regression analyses revealed a sig-nificant interaction (see Fig. 5) between level of compe-tence and incentive condition on estimates of one’spercentile score, b = �.37, t(35) = �2.22, p < .05,though not on estimates of the number of questionsanswered correctly, b = �.21, t(38) = �1.35, ns.
Summary. Study 3 showed that Trap and Skeet shootersoverestimated their performance on a test of gun knowl-edge and safety even when offered a monetary incentiveto be accurate. Further, this study demonstrated thatstrong overconfidence among the least skilled is not aphenomenon limited to college students evaluating theirperformance on intellectual tasks. Instead, individualsreflecting upon a hobby in which they possess consider-able experience can have rather less than perfect insightinto their level of knowledge regarding a central—andcritical—feature of that hobby.
Study 4
In Study 4, a replication and extension of Study 3, wesought to provide a particularly strong test of thehypothesis that error in self-assessment cannot be attrib-uted to a motivation to think well of oneself or to pres-ent oneself positively to other people. In this study, wereturned to the laboratory and to the domain in whichKruger and Dunning (1999) first demonstrated particu-larly strong overconfidence among those who lackskill—logical ability. A critic might argue that $5 isnot a sufficient incentive to motivate individuals to putaside self-presentational concerns and provide an accu-rate assessment of one’s performance. For this reason,we offered participants up to $100 if they were able toaccurately determine how well they had performed onthe test. For college students who, stereotypically, areuniquely familiar with Ramen noodles, we presumedthat $100 would be a strong incentive. To ensure thatparticipants believed they could actually earn thismoney, the experimenter showed participants a (small)pile of one hundred dollar bills.
Methods
Participants. Fifty-seven undergraduates participated inexchange for extra credit.
Materials and procedure. All participants completed a20-item multiple-choice test of Logical Reasoning Abil-ity. As in the previous study, participants indicated howconfident they were in each answer by circling a numberon a scale anchored by 20% (simply guessing among thefive multiple-choice answers) and 100% confident (posi-tive that the answer was correct). After completing thetest but before estimating the quality of their perfor-mance, participants in the ‘‘incentive’’ condition weretold that they would receive $100 if they were exactlycorrect in their prediction of how many of the 20 logicalreasoning questions they had answered correctly. Theywere told that they would win $30 if they correctly esti-mated within 5% of their actual score on the test.
Participants then completed a closing questionnairesimilar to that in the previous study in which they esti-mated their percentile score on the exam, how many
0
10
2030
40
50
60
7080
90
100
10 30 50 70 90
Actual Percentile
Per
ceiv
ed P
erce
ntile
0
2
4
6
8
10
12
4 8
Actual Raw Score
Per
ceiv
ed R
aw S
core
Control
Incentive
Actual
A. Percentile Estimates
B. Raw Score Estimates
5 6 7
Control
Incentive
Actual
Fig. 5. Perceived versus actual percentile and raw score as a functionof actual performance and incentive condition (Study 3).
110 J. Ehrlinger et al. / Organizational Behavior and Human Decision Processes 105 (2008) 98–121
Author's personal copy
of the 10 questions they answered correctly and howmany of the questions would be answered correctly onaverage by their peers.
Results and discussion
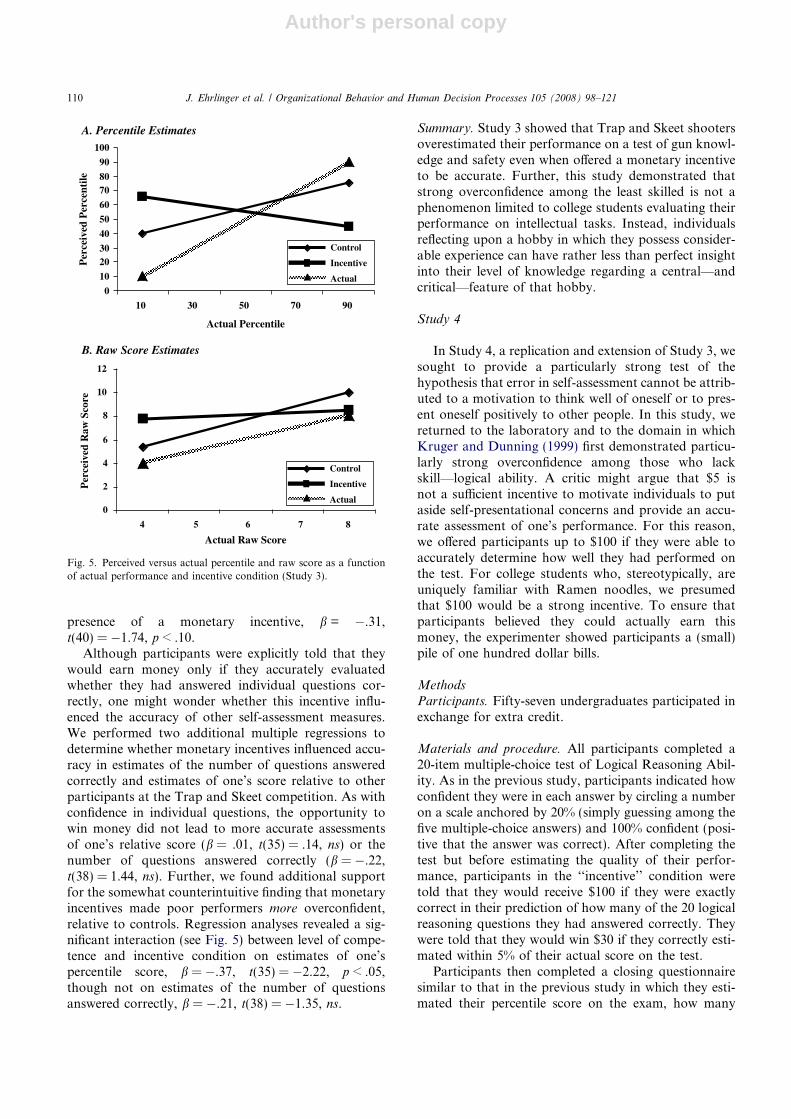
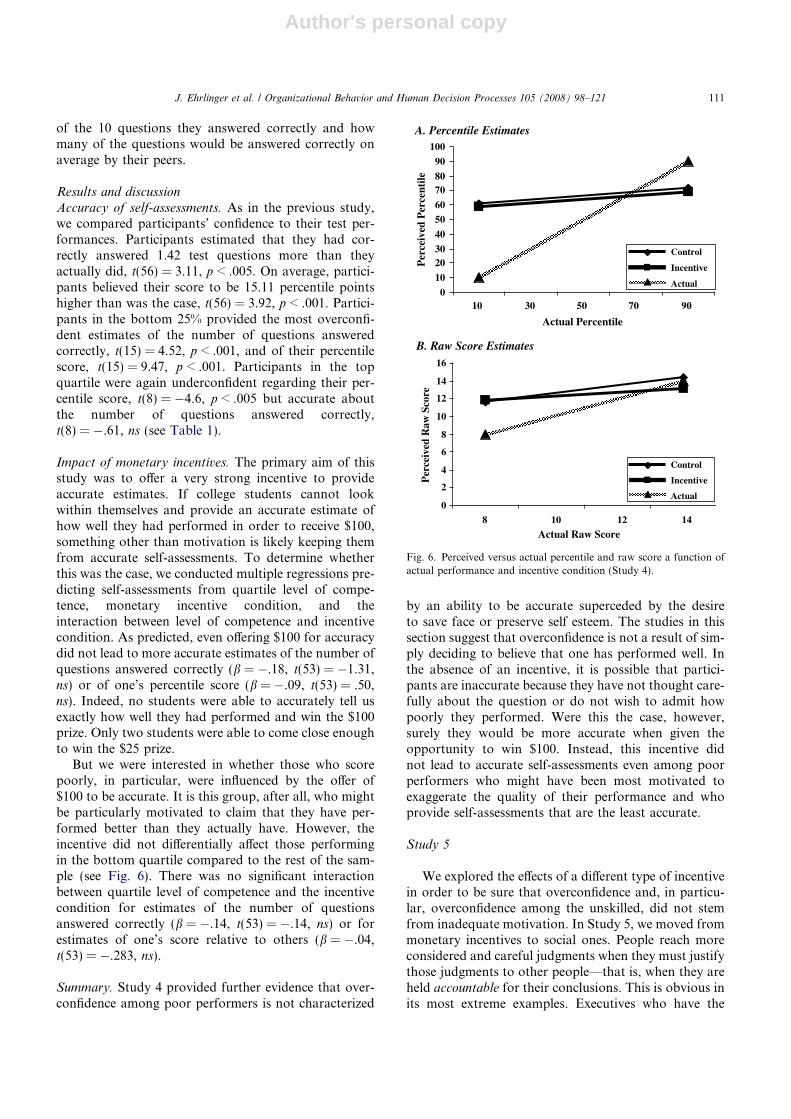
Accuracy of self-assessments. As in the previous study,we compared participants’ confidence to their test per-formances. Participants estimated that they had cor-rectly answered 1.42 test questions more than theyactually did, t(56) = 3.11, p < .005. On average, partici-pants believed their score to be 15.11 percentile pointshigher than was the case, t(56) = 3.92, p < .001. Partici-pants in the bottom 25% provided the most overconfi-dent estimates of the number of questions answeredcorrectly, t(15) = 4.52, p < .001, and of their percentilescore, t(15) = 9.47, p < .001. Participants in the topquartile were again underconfident regarding their per-centile score, t(8) = �4.6, p < .005 but accurate aboutthe number of questions answered correctly,t(8) = �.61, ns (see Table 1).
Impact of monetary incentives. The primary aim of thisstudy was to offer a very strong incentive to provideaccurate estimates. If college students cannot lookwithin themselves and provide an accurate estimate ofhow well they had performed in order to receive $100,something other than motivation is likely keeping themfrom accurate self-assessments. To determine whetherthis was the case, we conducted multiple regressions pre-dicting self-assessments from quartile level of compe-tence, monetary incentive condition, and theinteraction between level of competence and incentivecondition. As predicted, even offering $100 for accuracydid not lead to more accurate estimates of the number ofquestions answered correctly (b = �.18, t(53) = �1.31,ns) or of one’s percentile score (b = �.09, t(53) = .50,ns). Indeed, no students were able to accurately tell usexactly how well they had performed and win the $100prize. Only two students were able to come close enoughto win the $25 prize.
But we were interested in whether those who scorepoorly, in particular, were influenced by the offer of$100 to be accurate. It is this group, after all, who mightbe particularly motivated to claim that they have per-formed better than they actually have. However, theincentive did not differentially affect those performingin the bottom quartile compared to the rest of the sam-ple (see Fig. 6). There was no significant interactionbetween quartile level of competence and the incentivecondition for estimates of the number of questionsanswered correctly (b = �.14, t(53) = �.14, ns) or forestimates of one’s score relative to others (b = �.04,t(53) = �.283, ns).
Summary. Study 4 provided further evidence that over-confidence among poor performers is not characterized
by an ability to be accurate superceded by the desireto save face or preserve self esteem. The studies in thissection suggest that overconfidence is not a result of sim-ply deciding to believe that one has performed well. Inthe absence of an incentive, it is possible that partici-pants are inaccurate because they have not thought care-fully about the question or do not wish to admit howpoorly they performed. Were this the case, however,surely they would be more accurate when given theopportunity to win $100. Instead, this incentive didnot lead to accurate self-assessments even among poorperformers who might have been most motivated toexaggerate the quality of their performance and whoprovide self-assessments that are the least accurate.
Study 5
We explored the effects of a different type of incentivein order to be sure that overconfidence and, in particu-lar, overconfidence among the unskilled, did not stemfrom inadequate motivation. In Study 5, we moved frommonetary incentives to social ones. People reach moreconsidered and careful judgments when they must justifythose judgments to other people—that is, when they areheld accountable for their conclusions. This is obvious inits most extreme examples. Executives who have the
0
10
2030
40
50
60
7080
90
100
10 30 50 70 90
Actual Percentile
Per
ceiv
ed P
erce
ntile
0
2
4
6
8
10
12
14
16
8 10 14
Actual Raw Score
Per
ceiv
ed R
aw S
core
A. Percentile Estimates
B. Raw Score Estimates
12
Control
Incentive
Actual
Control
Incentive
Actual
Fig. 6. Perceived versus actual percentile and raw score a function ofactual performance and incentive condition (Study 4).
J. Ehrlinger et al. / Organizational Behavior and Human Decision Processes 105 (2008) 98–121 111
Author's personal copy
success of multi-million dollar deals depending on theaccuracy of their judgments are likely to be very carefulin way that they might not later that evening, when sim-ply selecting which television show they might mostenjoy. Even less extreme forms of accountability, how-ever, have been shown to be very effective in encourag-ing individuals to increase effort and attention paid toa task and inspiring greater motivation to get the correctanswer (Lerner & Tetlock, 1999; Tetlock, 1983; Tetlock& Kim, 1987). In these studies, for example, researchershave elicited greater attention and less overconfidentpredictions regarding the personality of other individu-als by making participants accountable to the experi-menter (Tetlock & Kim, 1987). Similarly, students whoanticipate discussing their answers on a general knowl-edge quiz with a group of their peers show less overcon-fidence in those answers (Arkes, Christensen, Lai, &Blumer, 1987). In the realm of self-evaluation, recentevidence suggests that making individuals accountablefor performance evaluations does indeed lead to lessself-enhancing, more accurate estimates of performance(Sedikides, Berbst, Hardin, & Dardis, 2002).
In this study, we examined whether making individu-als accountable for performance assessments made themmore accurate. We were particularly interested inwhether accountability would influence the confidenceestimates of those who are the least skilled, in anattempt to learn whether individuals give over optimisticestimates of performance because they are not suffi-ciently motivated to know how well they haveperformed.
We expected to replicate the pattern of confidenceshown in past research, whereby those who possess theleast logical reasoning skill also make the greater errorsin estimation of their performance. We also expectedthat making individuals accountable for their responseswould have minimal, if any, effect on this pattern. Wepredicted that participants who expected to justify theirresponses in an interview with the primary researcherwould be no more or less accurate when estimating theirscore than would participants who were not exposed tothis measure of accountability.
Methods
Participants. Participants were 42 undergraduates whoparticipated in exchange for extra credit in undergradu-ate psychology courses.
Materials and procedure. Upon arrival in the laboratory,participants were told that they would be asked to com-plete a test of logical reasoning ability and evaluate thequality of their performance. Participants randomlyassigned to the ‘‘accountable’’ condition were told thatsupervising professor would interview each participantfor 5–10 min regarding the rationale for his or heranswers. This interview was described to ‘‘accountable’’
participants within verbal instructions and was alsomentioned in the consent form along with a request togive consent for the interview to be audiotaped. Controlparticipants received only information about the testand signed a consent form that made no mention ofan interview.
The presence or absence of accountability manipula-tion described above represents the sole condition differ-ence in the experimental session. Participants completeda test of 10 multiple-choice items taken from a LawSchool Aptitude test preparation guide (Orton, 1993).They indicated the best response for each question andthen indicated their level of confidence in that responseby circling a number on a scale ranging from 20%(purely guessing) to 100% confident (positive that theywere correct). After completing the test, participantsestimated how many of the 10 questions they hadanswered correctly and also made a percentile estimateof their performance relative to other Cornell studentsparticipating in the experiment (between 1 and 100).
Results and discussionParticipants overestimated their percentile score by
20 percentage points on average, t(33) = 4.10,p < .0005). We did not find evidence that participantsoverestimated the number of questions answered cor-rectly overall, t (34) = .05, ns, but we did find this over-confidence among those in the bottom 25th percentile(see Table 1). One-way ANOVAs revealed that thosewho are least skilled provided the most overconfidentestimates both of the number of questions answered cor-rectly, t(10) = 3.21, p < .01, and their percentile score,t(10) = 3.21, p < .01. Participants in the top percentilewere underconfident with respect to the number of ques-tions answered correctly, t(7) = �5.02, p < .005, andhow they scored relative to their peers, t(10) = 3.21,p < .01.
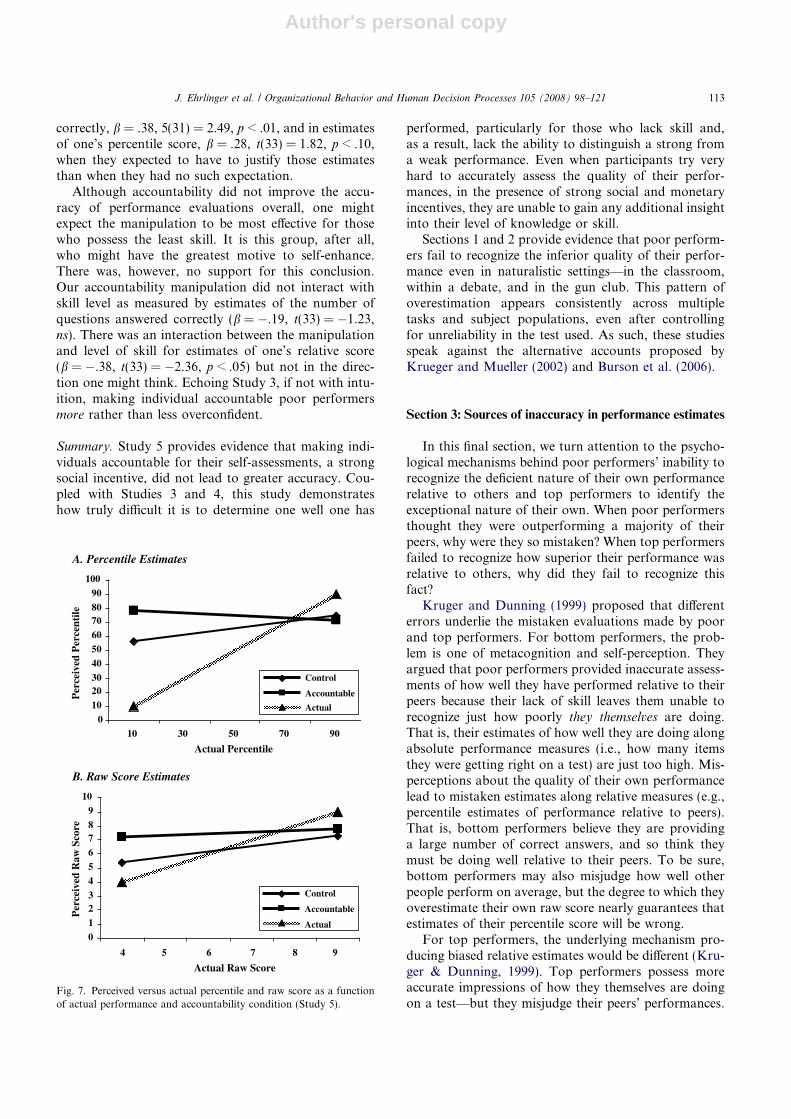
Making participants accountable. The primary goal ofthis study was to determine whether facing the prospectof having to justify one’s self-assessments to an author-ity figure would reduce the draw of self-enhancementmotives and result in greater accuracy. In order toaddress this issue, we performed multiple regressionspredicting assessments of one’s percentile score and, sep-arately, estimates of one’s raw score from actual perfor-mance on the exam (split into four groups), presence orabsence of the accountability manipulation, and theinteraction between the accountability manipulationand actual performance. This analysis did reveal a mar-ginally significant effect of the accountability manipula-tion (b = 1.33, t(30) = 1.81, p < .10) on assessment ofperformance but, as with the monetary incentive, inthe direction opposite what a critic might argue (seeFig. 7). Participants were marginally more confident inratings of the number of questions they answered
112 J. Ehrlinger et al. / Organizational Behavior and Human Decision Processes 105 (2008) 98–121
Author's personal copy
correctly, b = .38, 5(31) = 2.49, p < .01, and in estimatesof one’s percentile score, b = .28, t(33) = 1.82, p < .10,when they expected to have to justify those estimatesthan when they had no such expectation.
Although accountability did not improve the accu-racy of performance evaluations overall, one mightexpect the manipulation to be most effective for thosewho possess the least skill. It is this group, after all,who might have the greatest motive to self-enhance.There was, however, no support for this conclusion.Our accountability manipulation did not interact withskill level as measured by estimates of the number ofquestions answered correctly (b = �.19, t(33) = �1.23,ns). There was an interaction between the manipulationand level of skill for estimates of one’s relative score(b = �.38, t(33) = �2.36, p < .05) but not in the direc-tion one might think. Echoing Study 3, if not with intu-ition, making individual accountable poor performersmore rather than less overconfident.
Summary. Study 5 provides evidence that making indi-viduals accountable for their self-assessments, a strongsocial incentive, did not lead to greater accuracy. Cou-pled with Studies 3 and 4, this study demonstrateshow truly difficult it is to determine one well one has
performed, particularly for those who lack skill and,as a result, lack the ability to distinguish a strong froma weak performance. Even when participants try veryhard to accurately assess the quality of their perfor-mances, in the presence of strong social and monetaryincentives, they are unable to gain any additional insightinto their level of knowledge or skill.
Sections 1 and 2 provide evidence that poor perform-ers fail to recognize the inferior quality of their perfor-mance even in naturalistic settings—in the classroom,within a debate, and in the gun club. This pattern ofoverestimation appears consistently across multipletasks and subject populations, even after controllingfor unreliability in the test used. As such, these studiesspeak against the alternative accounts proposed byKrueger and Mueller (2002) and Burson et al. (2006).
Section 3: Sources of inaccuracy in performance estimates
In this final section, we turn attention to the psycho-logical mechanisms behind poor performers’ inability torecognize the deficient nature of their own performancerelative to others and top performers to identify theexceptional nature of their own. When poor performersthought they were outperforming a majority of theirpeers, why were they so mistaken? When top performersfailed to recognize how superior their performance wasrelative to others, why did they fail to recognize thisfact?
Kruger and Dunning (1999) proposed that differenterrors underlie the mistaken evaluations made by poorand top performers. For bottom performers, the prob-lem is one of metacognition and self-perception. Theyargued that poor performers provided inaccurate assess-ments of how well they have performed relative to theirpeers because their lack of skill leaves them unable torecognize just how poorly they themselves are doing.That is, their estimates of how well they are doing alongabsolute performance measures (i.e., how many itemsthey were getting right on a test) are just too high. Mis-perceptions about the quality of their own performancelead to mistaken estimates along relative measures (e.g.,percentile estimates of performance relative to peers).That is, bottom performers believe they are providinga large number of correct answers, and so think theymust be doing well relative to their peers. To be sure,bottom performers may also misjudge how well otherpeople perform on average, but the degree to which theyoverestimate their own raw score nearly guarantees thatestimates of their percentile score will be wrong.
For top performers, the underlying mechanism pro-ducing biased relative estimates would be different (Kru-ger & Dunning, 1999). Top performers possess moreaccurate impressions of how they themselves are doingon a test—but they misjudge their peers’ performances.
0102030405060708090
100
10 30 50 70 90
Actual Percentile
Per
ceiv
ed P
erce
ntile
0123456789
10
4 6 8
Actual Raw Score
Per
ceiv
ed R
aw S
core
A. Percentile Estimates
B. Raw Score Estimates
5 7 9
Control
Accountable
Actual
Control
Accountable
Actual
Fig. 7. Perceived versus actual percentile and raw score as a functionof actual performance and accountability condition (Study 5).
J. Ehrlinger et al. / Organizational Behavior and Human Decision Processes 105 (2008) 98–121 113
Author's personal copy
Because they do well on tests, they presumed that othersdo well, too. That leads them to be relatively accurate ontheir estimates along absolute measures of performance(e.g., how many items they answered corrected). How-ever, they overestimate how well their peers do alongthe same absolute performance measures. As a result,top performers underestimate how well they are doingrelative to their peers.
Thus, according to Kruger and Dunning (1999), poorperformers provide inaccurate percentile estimates pri-marily because they are wrong about their own perfor-mance; top performers provide inaccurate estimatesbecause they are wrong about other people. Thisaccount makes predictions that can be addressed statis-tically. Different predictions can be made about bottomand top performers based on whether they ‘‘becamemore knowledgeable’’ (through statistical correction)about their own performance versus that of their peers.Giving bottom performers knowledge of their own per-formance along absolute dimensions should go a longway toward correcting their mistaken views of how theyare doing relative to their peers. Giving top performerssimilar information about their own performance mightlead them to correct their relative estimates (for peopleare rarely perfect in assessing their performance), butthe improvement should not be as dramatic as it is forbottom performers. Correcting misperceptions of peersshould lead top performers to more accurate relativeestimates because these misperceptions lead them to beunderconfident. However, the same knowledge for bot-tom performers should not have as obvious an impacton their accuracy of their relative judgments.
We tested these predictions in Section 3 by perform-ing a statistical ‘‘what if’’ exercise. In the first part of thisexercise, we looked at data we had from several studiesin which we had asked participants to estimate boththeir raw score on a test as well as the raw score ofthe average person taking the test. For each study, wecalculated via regression analysis how much weight par-ticipants gave to those two raw score estimates whenestimating how well they performed relative to others.Armed with the resulting regression equation, we thenbegan the what-if phase of the analysis, borrowing atechnique called counterfactual regression analysis. Thistechnique, commonly found in sociological and eco-nomic research (Winship & Morgan, 1999), is used toanswer such questions as whether a teenager would havegained in IQ had he or she stayed in school one moreyear (Winship & Korenman, 1997), or whether paro-chial schools are superior to public ones (Morgan,2001).
In this analysis, we asked what each participants’percentile ranking would have been had we replacedtheir raw score estimates with their actual raw score,given the weight participants gave self and otherscores when making relative estimates? What if,
instead, we replaced their estimate of the averageraw score obtained by their peers with the actual aver-age? By examining the degree to which assessmentsbecome more accurate through these statistical correc-tions, we can learn about the degree to which misper-ceptions of the self versus misperceptions of otherslead relative estimates astray.
Methods
Studies included in the meta-analysis
Studies were included in the meta-analysis if they didnot involve any experimental manipulation and if theyincluded the three estimates needed to conduct the anal-ysis. To be included, participants in these studies musthave provided percentile estimates of the degree towhich participants possessed the relevant ability (e.g.,logic) being tested relative to their peers, as well as per-centile estimates of their test performance. We alsorequired that they estimated their raw score (the numberof questions answered correctly) as well as the raw scoreof the ‘‘average’’ student in the study. The four studiesthat met these criteria were Kruger and Dunning(1999, Study 2), in which 45 participants completed a20-item test on logical reasoning ability; Kruger andDunning (Study 3), in which 84 participants completeda 20-item grammar test; Kruger and Dunning (Study4), in which 140 participants confronted a 10-item logictest; and Study 1 from this manuscript, in which 122participants completed a mid-term exam in a large-lec-ture psychology course. Details about the studies fromKruger and Dunning can be found in the originalarticle.
Results and discussion
Analyses focused on three separate issues. First, howaccurate were estimates of one’s own raw score and ofthe raw score achieved on average by participants? Sec-ond, to what degree did people rely upon perceptions oftheir own and of the average raw score when estimatinghow they performed, and the degree to which they pos-sessed the relevant skill, compared with other partici-pants. Finally, how accurate would percentileestimates be if participants knew, rather than havingto guess, their exact raw score or, separately, exactlyhow participants scored on average.
Errors in estimates of own and others’ raw score
As expected, participants in the bottom and top per-formance quartile in each study were inaccurate bothwith respect to their own raw score and that of others.Across the four studies, bottom performers thought theyhad answered roughly 66% of the items correctly, onaverage, whereas they answered to only 33% of the itemscorrectly, Z = 8.12, p < .0001 (see Table 2). Top per-
114 J. Ehrlinger et al. / Organizational Behavior and Human Decision Processes 105 (2008) 98–121
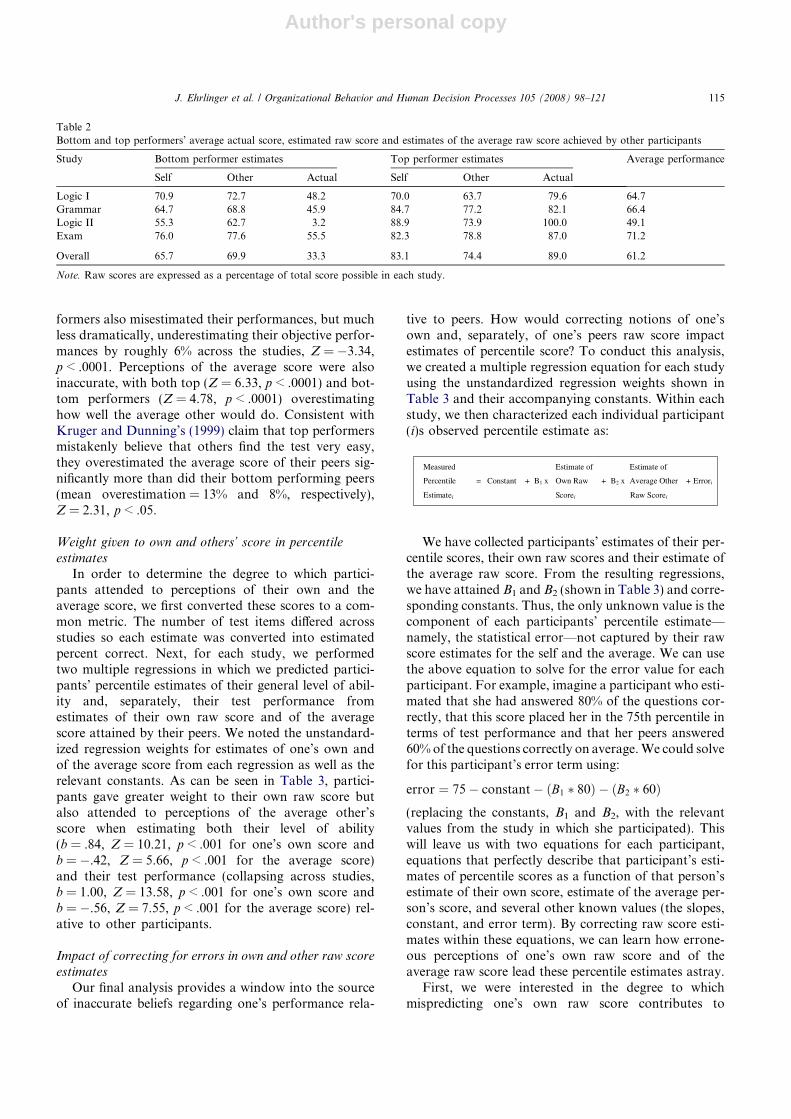
Author's personal copy
formers also misestimated their performances, but muchless dramatically, underestimating their objective perfor-mances by roughly 6% across the studies, Z = �3.34,p < .0001. Perceptions of the average score were alsoinaccurate, with both top (Z = 6.33, p < .0001) and bot-tom performers (Z = 4.78, p < .0001) overestimatinghow well the average other would do. Consistent withKruger and Dunning’s (1999) claim that top performersmistakenly believe that others find the test very easy,they overestimated the average score of their peers sig-nificantly more than did their bottom performing peers(mean overestimation = 13% and 8%, respectively),Z = 2.31, p < .05.
Weight given to own and others’ score in percentile
estimatesIn order to determine the degree to which partici-
pants attended to perceptions of their own and theaverage score, we first converted these scores to a com-mon metric. The number of test items differed acrossstudies so each estimate was converted into estimatedpercent correct. Next, for each study, we performedtwo multiple regressions in which we predicted partici-pants’ percentile estimates of their general level of abil-ity and, separately, their test performance fromestimates of their own raw score and of the averagescore attained by their peers. We noted the unstandard-ized regression weights for estimates of one’s own andof the average score from each regression as well as therelevant constants. As can be seen in Table 3, partici-pants gave greater weight to their own raw score butalso attended to perceptions of the average other’sscore when estimating both their level of ability(b = .84, Z = 10.21, p < .001 for one’s own score andb = �.42, Z = 5.66, p < .001 for the average score)and their test performance (collapsing across studies,b = 1.00, Z = 13.58, p < .001 for one’s own score andb = �.56, Z = 7.55, p < .001 for the average score) rel-ative to other participants.
Impact of correcting for errors in own and other raw score
estimates
Our final analysis provides a window into the sourceof inaccurate beliefs regarding one’s performance rela-
tive to peers. How would correcting notions of one’sown and, separately, of one’s peers raw score impactestimates of percentile score? To conduct this analysis,we created a multiple regression equation for each studyusing the unstandardized regression weights shown inTable 3 and their accompanying constants. Within eachstudy, we then characterized each individual participant(i)s observed percentile estimate as:
We have collected participants’ estimates of their per-centile scores, their own raw scores and their estimate ofthe average raw score. From the resulting regressions,we have attained B1 and B2 (shown in Table 3) and corre-sponding constants. Thus, the only unknown value is thecomponent of each participants’ percentile estimate—namely, the statistical error—not captured by their rawscore estimates for the self and the average. We can usethe above equation to solve for the error value for eachparticipant. For example, imagine a participant who esti-mated that she had answered 80% of the questions cor-rectly, that this score placed her in the 75th percentile interms of test performance and that her peers answered60% of the questions correctly on average. We could solvefor this participant’s error term using:
error ¼ 75� constant� ðB1 � 80Þ � ðB2 � 60Þ(replacing the constants, B1 and B2, with the relevantvalues from the study in which she participated). Thiswill leave us with two equations for each participant,equations that perfectly describe that participant’s esti-mates of percentile scores as a function of that person’sestimate of their own score, estimate of the average per-son’s score, and several other known values (the slopes,constant, and error term). By correcting raw score esti-mates within these equations, we can learn how errone-ous perceptions of one’s own raw score and of theaverage raw score lead these percentile estimates astray.
First, we were interested in the degree to whichmispredicting one’s own raw score contributes to
Table 2Bottom and top performers’ average actual score, estimated raw score and estimates of the average raw score achieved by other participants
Study Bottom performer estimates Top performer estimates Average performance
Self Other Actual Self Other Actual
Logic I 70.9 72.7 48.2 70.0 63.7 79.6 64.7Grammar 64.7 68.8 45.9 84.7 77.2 82.1 66.4Logic II 55.3 62.7 3.2 88.9 73.9 100.0 49.1Exam 76.0 77.6 55.5 82.3 78.8 87.0 71.2
Overall 65.7 69.9 33.3 83.1 74.4 89.0 61.2
Note. Raw scores are expressed as a percentage of total score possible in each study.
Measured
Percentile
Estimatei
= Constant + B1 x
Estimate of
Own Raw
Scorei
+ B2 x
Estimate of
Average Other +
Raw Score i
Errori
J. Ehrlinger et al. / Organizational Behavior and Human Decision Processes 105 (2008) 98–121 115
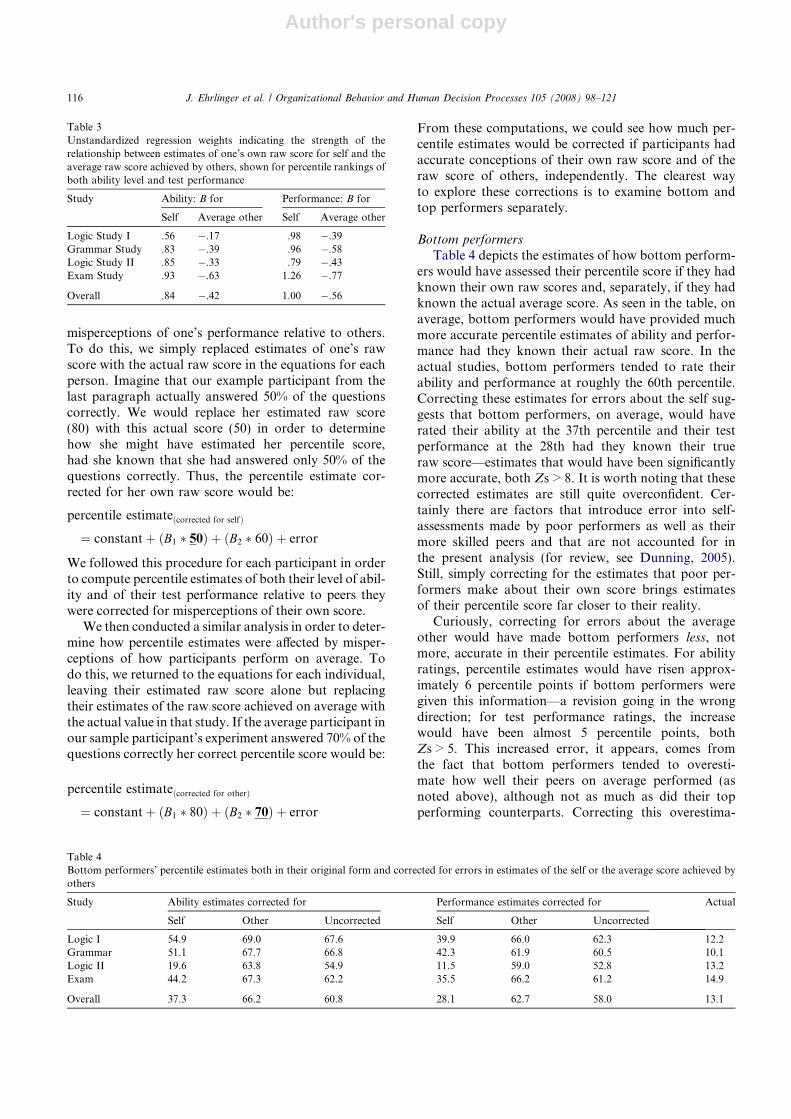
Author's personal copy
misperceptions of one’s performance relative to others.To do this, we simply replaced estimates of one’s rawscore with the actual raw score in the equations for eachperson. Imagine that our example participant from thelast paragraph actually answered 50% of the questionscorrectly. We would replace her estimated raw score(80) with this actual score (50) in order to determinehow she might have estimated her percentile score,had she known that she had answered only 50% of thequestions correctly. Thus, the percentile estimate cor-rected for her own raw score would be:
percentile estimateðcorrected for selfÞ
¼ constantþ ðB1 � 50Þ þ ðB2 � 60Þ þ error
We followed this procedure for each participant in orderto compute percentile estimates of both their level of abil-ity and of their test performance relative to peers theywere corrected for misperceptions of their own score.
We then conducted a similar analysis in order to deter-mine how percentile estimates were affected by misper-ceptions of how participants perform on average. Todo this, we returned to the equations for each individual,leaving their estimated raw score alone but replacingtheir estimates of the raw score achieved on average withthe actual value in that study. If the average participant inour sample participant’s experiment answered 70% of thequestions correctly her correct percentile score would be:
percentile estimateðcorrected for otherÞ
¼ constantþ ðB1 � 80Þ þ ðB2 � 70Þ þ error
From these computations, we could see how much per-centile estimates would be corrected if participants hadaccurate conceptions of their own raw score and of theraw score of others, independently. The clearest wayto explore these corrections is to examine bottom andtop performers separately.
Bottom performers
Table 4 depicts the estimates of how bottom perform-ers would have assessed their percentile score if they hadknown their own raw scores and, separately, if they hadknown the actual average score. As seen in the table, onaverage, bottom performers would have provided muchmore accurate percentile estimates of ability and perfor-mance had they known their actual raw score. In theactual studies, bottom performers tended to rate theirability and performance at roughly the 60th percentile.Correcting these estimates for errors about the self sug-gests that bottom performers, on average, would haverated their ability at the 37th percentile and their testperformance at the 28th had they known their trueraw score—estimates that would have been significantlymore accurate, both Zs > 8. It is worth noting that thesecorrected estimates are still quite overconfident. Cer-tainly there are factors that introduce error into self-assessments made by poor performers as well as theirmore skilled peers and that are not accounted for inthe present analysis (for review, see Dunning, 2005).Still, simply correcting for the estimates that poor per-formers make about their own score brings estimatesof their percentile score far closer to their reality.
Curiously, correcting for errors about the averageother would have made bottom performers less, notmore, accurate in their percentile estimates. For abilityratings, percentile estimates would have risen approx-imately 6 percentile points if bottom performers weregiven this information—a revision going in the wrongdirection; for test performance ratings, the increasewould have been almost 5 percentile points, bothZs > 5. This increased error, it appears, comes fromthe fact that bottom performers tended to overesti-mate how well their peers on average performed (asnoted above), although not as much as did their topperforming counterparts. Correcting this overestima-
Table 3Unstandardized regression weights indicating the strength of therelationship between estimates of one’s own raw score for self and theaverage raw score achieved by others, shown for percentile rankings ofboth ability level and test performance
Study Ability: B for Performance: B for
Self Average other Self Average other
Logic Study I .56 �.17 .98 �.39Grammar Study .83 �.39 .96 �.58Logic Study II .85 �.33 .79 �.43Exam Study .93 �.63 1.26 �.77
Overall .84 �.42 1.00 �.56
Table 4Bottom performers’ percentile estimates both in their original form and corrected for errors in estimates of the self or the average score achieved byothers
Study Ability estimates corrected for Performance estimates corrected for Actual
Self Other Uncorrected Self Other Uncorrected
Logic I 54.9 69.0 67.6 39.9 66.0 62.3 12.2Grammar 51.1 67.7 66.8 42.3 61.9 60.5 10.1Logic II 19.6 63.8 54.9 11.5 59.0 52.8 13.2Exam 44.2 67.3 62.2 35.5 66.2 61.2 14.9
Overall 37.3 66.2 60.8 28.1 62.7 58.0 13.1
116 J. Ehrlinger et al. / Organizational Behavior and Human Decision Processes 105 (2008) 98–121
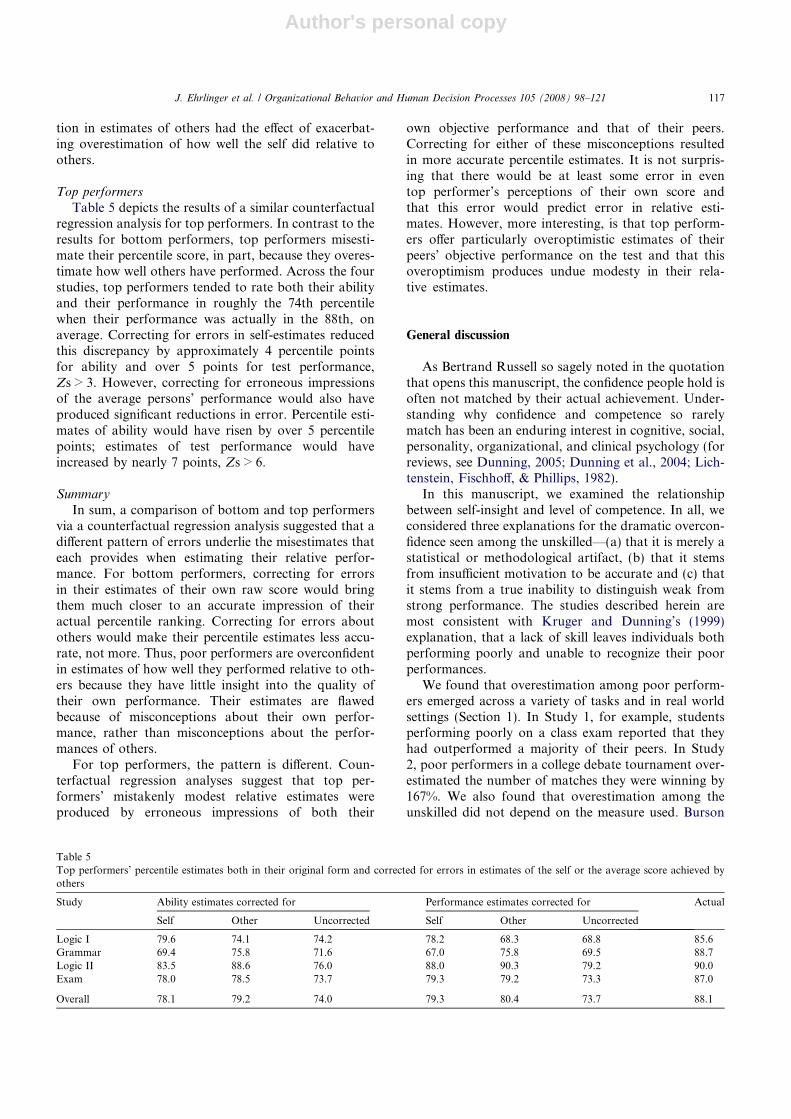
Author's personal copy
tion in estimates of others had the effect of exacerbat-ing overestimation of how well the self did relative toothers.
Top performers
Table 5 depicts the results of a similar counterfactualregression analysis for top performers. In contrast to theresults for bottom performers, top performers misesti-mate their percentile score, in part, because they overes-timate how well others have performed. Across the fourstudies, top performers tended to rate both their abilityand their performance in roughly the 74th percentilewhen their performance was actually in the 88th, onaverage. Correcting for errors in self-estimates reducedthis discrepancy by approximately 4 percentile pointsfor ability and over 5 points for test performance,Zs > 3. However, correcting for erroneous impressionsof the average persons’ performance would also haveproduced significant reductions in error. Percentile esti-mates of ability would have risen by over 5 percentilepoints; estimates of test performance would haveincreased by nearly 7 points, Zs > 6.
Summary
In sum, a comparison of bottom and top performersvia a counterfactual regression analysis suggested that adifferent pattern of errors underlie the misestimates thateach provides when estimating their relative perfor-mance. For bottom performers, correcting for errorsin their estimates of their own raw score would bringthem much closer to an accurate impression of theiractual percentile ranking. Correcting for errors aboutothers would make their percentile estimates less accu-rate, not more. Thus, poor performers are overconfidentin estimates of how well they performed relative to oth-ers because they have little insight into the quality oftheir own performance. Their estimates are flawedbecause of misconceptions about their own perfor-mance, rather than misconceptions about the perfor-mances of others.
For top performers, the pattern is different. Coun-terfactual regression analyses suggest that top per-formers’ mistakenly modest relative estimates wereproduced by erroneous impressions of both their
own objective performance and that of their peers.Correcting for either of these misconceptions resultedin more accurate percentile estimates. It is not surpris-ing that there would be at least some error in eventop performer’s perceptions of their own score andthat this error would predict error in relative esti-mates. However, more interesting, is that top perform-ers offer particularly overoptimistic estimates of theirpeers’ objective performance on the test and that thisoveroptimism produces undue modesty in their rela-tive estimates.
General discussion
As Bertrand Russell so sagely noted in the quotationthat opens this manuscript, the confidence people hold isoften not matched by their actual achievement. Under-standing why confidence and competence so rarelymatch has been an enduring interest in cognitive, social,personality, organizational, and clinical psychology (forreviews, see Dunning, 2005; Dunning et al., 2004; Lich-tenstein, Fischhoff, & Phillips, 1982).
In this manuscript, we examined the relationshipbetween self-insight and level of competence. In all, weconsidered three explanations for the dramatic overcon-fidence seen among the unskilled—(a) that it is merely astatistical or methodological artifact, (b) that it stemsfrom insufficient motivation to be accurate and (c) thatit stems from a true inability to distinguish weak fromstrong performance. The studies described herein aremost consistent with Kruger and Dunning’s (1999)explanation, that a lack of skill leaves individuals bothperforming poorly and unable to recognize their poorperformances.
We found that overestimation among poor perform-ers emerged across a variety of tasks and in real worldsettings (Section 1). In Study 1, for example, studentsperforming poorly on a class exam reported that theyhad outperformed a majority of their peers. In Study2, poor performers in a college debate tournament over-estimated the number of matches they were winning by167%. We also found that overestimation among theunskilled did not depend on the measure used. Burson
Table 5Top performers’ percentile estimates both in their original form and corrected for errors in estimates of the self or the average score achieved byothers
Study Ability estimates corrected for Performance estimates corrected for Actual
Self Other Uncorrected Self Other Uncorrected
Logic I 79.6 74.1 74.2 78.2 68.3 68.8 85.6Grammar 69.4 75.8 71.6 67.0 75.8 69.5 88.7Logic II 83.5 88.6 76.0 88.0 90.3 79.2 90.0Exam 78.0 78.5 73.7 79.3 79.2 73.3 87.0
Overall 78.1 79.2 74.0 79.3 80.4 73.7 88.1
J. Ehrlinger et al. / Organizational Behavior and Human Decision Processes 105 (2008) 98–121 117
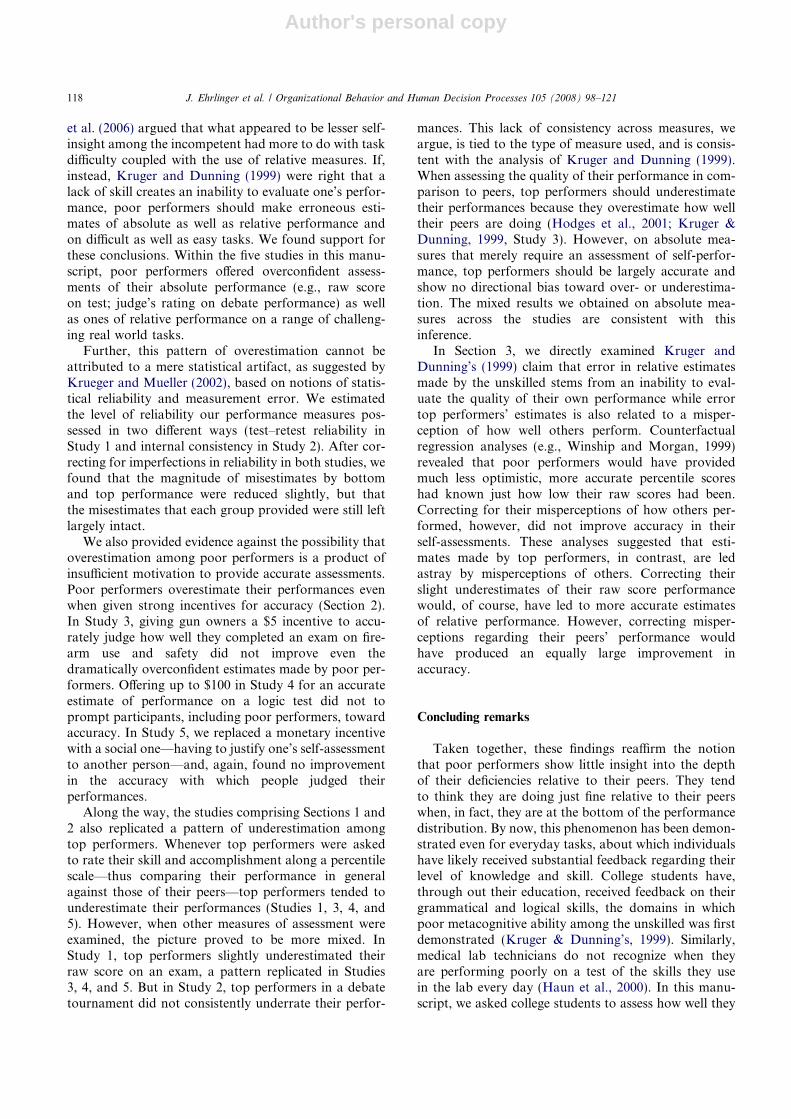
Author's personal copy
et al. (2006) argued that what appeared to be lesser self-insight among the incompetent had more to do with taskdifficulty coupled with the use of relative measures. If,instead, Kruger and Dunning (1999) were right that alack of skill creates an inability to evaluate one’s perfor-mance, poor performers should make erroneous esti-mates of absolute as well as relative performance andon difficult as well as easy tasks. We found support forthese conclusions. Within the five studies in this manu-script, poor performers offered overconfident assess-ments of their absolute performance (e.g., raw scoreon test; judge’s rating on debate performance) as wellas ones of relative performance on a range of challeng-ing real world tasks.
Further, this pattern of overestimation cannot beattributed to a mere statistical artifact, as suggested byKrueger and Mueller (2002), based on notions of statis-tical reliability and measurement error. We estimatedthe level of reliability our performance measures pos-sessed in two different ways (test–retest reliability inStudy 1 and internal consistency in Study 2). After cor-recting for imperfections in reliability in both studies, wefound that the magnitude of misestimates by bottomand top performance were reduced slightly, but thatthe misestimates that each group provided were still leftlargely intact.
We also provided evidence against the possibility thatoverestimation among poor performers is a product ofinsufficient motivation to provide accurate assessments.Poor performers overestimate their performances evenwhen given strong incentives for accuracy (Section 2).In Study 3, giving gun owners a $5 incentive to accu-rately judge how well they completed an exam on fire-arm use and safety did not improve even thedramatically overconfident estimates made by poor per-formers. Offering up to $100 in Study 4 for an accurateestimate of performance on a logic test did not toprompt participants, including poor performers, towardaccuracy. In Study 5, we replaced a monetary incentivewith a social one—having to justify one’s self-assessmentto another person—and, again, found no improvementin the accuracy with which people judged theirperformances.
Along the way, the studies comprising Sections 1 and2 also replicated a pattern of underestimation amongtop performers. Whenever top performers were askedto rate their skill and accomplishment along a percentilescale—thus comparing their performance in generalagainst those of their peers—top performers tended tounderestimate their performances (Studies 1, 3, 4, and5). However, when other measures of assessment wereexamined, the picture proved to be more mixed. InStudy 1, top performers slightly underestimated theirraw score on an exam, a pattern replicated in Studies3, 4, and 5. But in Study 2, top performers in a debatetournament did not consistently underrate their perfor-
mances. This lack of consistency across measures, weargue, is tied to the type of measure used, and is consis-tent with the analysis of Kruger and Dunning (1999).When assessing the quality of their performance in com-parison to peers, top performers should underestimatetheir performances because they overestimate how welltheir peers are doing (Hodges et al., 2001; Kruger &Dunning, 1999, Study 3). However, on absolute mea-sures that merely require an assessment of self-perfor-mance, top performers should be largely accurate andshow no directional bias toward over- or underestima-tion. The mixed results we obtained on absolute mea-sures across the studies are consistent with thisinference.
In Section 3, we directly examined Kruger andDunning’s (1999) claim that error in relative estimatesmade by the unskilled stems from an inability to eval-uate the quality of their own performance while errortop performers’ estimates is also related to a misper-ception of how well others perform. Counterfactualregression analyses (e.g., Winship and Morgan, 1999)revealed that poor performers would have providedmuch less optimistic, more accurate percentile scoreshad known just how low their raw scores had been.Correcting for their misperceptions of how others per-formed, however, did not improve accuracy in theirself-assessments. These analyses suggested that esti-mates made by top performers, in contrast, are ledastray by misperceptions of others. Correcting theirslight underestimates of their raw score performancewould, of course, have led to more accurate estimatesof relative performance. However, correcting misper-ceptions regarding their peers’ performance wouldhave produced an equally large improvement inaccuracy.
Concluding remarks
Taken together, these findings reaffirm the notionthat poor performers show little insight into the depthof their deficiencies relative to their peers. They tendto think they are doing just fine relative to their peerswhen, in fact, they are at the bottom of the performancedistribution. By now, this phenomenon has been demon-strated even for everyday tasks, about which individualshave likely received substantial feedback regarding theirlevel of knowledge and skill. College students have,through out their education, received feedback on theirgrammatical and logical skills, the domains in whichpoor metacognitive ability among the unskilled was firstdemonstrated (Kruger & Dunning’s, 1999). Similarly,medical lab technicians do not recognize when theyare performing poorly on a test of the skills they usein the lab every day (Haun et al., 2000). In this manu-script, we asked college students to assess how well they
118 J. Ehrlinger et al. / Organizational Behavior and Human Decision Processes 105 (2008) 98–121
Author's personal copy
had done on a course exam and experienced debaterswhether they were winning matches. Yet, in each ofthese familiar circumstances, poor performing partici-pants did not seem to know how poorly they were doing.
Part of why the dramatic overestimation demon-strated by poor performers is so fascinating is preciselybecause they show dramatic overconfidence on tasksabout which they have likely received substantial feed-back in the past. While this issue is beyond the scopeof the present manuscript, we remain fascinated by thequestion of why it is that poor performers do not giveaccurate performance evaluations on familiar tasks. Itseems that poor performers do not learn from feedbacksuggesting a need to improve. Hacker, Bol, Horgan, andRakow (2000) provided direct evidence for this failure tolearn from feedback when they tracked students duringa semester-long class. As time went on, good studentsbecame more accurate in predicting how they woulddo on future exams. The poorest performers did not—showing no recognition, despite clear and repeated feed-back, that they were doing badly. As a consequence,they continued to provide overly optimistic predictionsabout how well they would do in future tests. We hopethat future research might shed light on the motivationaland cognitive contributors to this failure to update pre-dictions in the light of negative feedback on pastperformances.
If one cannot rely on life experience to teach peopleabout their deficits, how are people to gain self-insight?While this seems a difficult task, there are clues in thepsychological literature that suggest strategies for gain-ing self-insight. If a lack of skill leads to an inabilityto evaluate the quality of one’s performances, onemeans of improving metacognitive ability—and thusself-insight—is to improve one’s level of skill. Krugerand Dunning (1999) found that training students in logicdid, indeed, improve their ability to distinguish correctfrom incorrect answers and, concurrently, improvedthe quality of their performances. We might thanencourage greater self-insight just by encouraginglearning.
Surely, we cannot expect individuals to gain somelevel of competence in all areas just so that theymay better understand their strengths and weaknesses.However, it is quite possible to encourage a mindsetthat leads to greater excitement about learningand, by extension greater self-insight. Dweck and col-leagues find that encouraging beliefs in the malleabil-ity of traits leads to a host of behaviors that mightcontribute to more accurate perceptions of one’s abil-ities (for review, see Dweck, 1999). This approachmight lead to more accurate self-assessment for thesame reason that Kruger and Dunning’s (1999) train-ing in logic was effective—by improving people’s levelof skill. School children who are taught that intelli-gence is malleable get more excited about learning,
become more motivated in the classroom and achievebetter grades (Blackwell, Trzesniewski, & Dweck,2007). Thus, teaching individuals that intelligence ismalleable might lead to more accurate self-assessmentsbecause this measure leads to an improvement ofknowledge and skill that, in and of itself, promotesgreater self-insight.
In addition, teaching individuals that traits and, inparticular, intelligence is malleable also leads to agreater openness to challenging new tasks (Dweck &Leggett, 1988; Hong, Chiu, Lin, Wan, & Dweck,1999). Experience with a variety of tasks is likely to pro-vide individuals with extensive feedback from whichthey may garner information about their abilities. Per-haps not surprisingly, then, recent research reveals thatindividuals who hold a view that intelligence is malleablemake far more accurate assessments of the quality oftheir performance than do those who believe intelligenceto be fixed (Ehrlinger & Dweck, 2007). Often those witha malleable view of intelligence are not at all overconfi-dent on tasks that inspire dramatic overconfidence inthose with a fixed view of the trait. Further, teachingindividuals about the malleability of intelligence resultsin less overconfident assessments of performance (Ehr-linger & Dweck, 2007).
Thus, teachers might help students to better identifywhat are their strengths and where they need to improvejust by imparting knowledge and also by teaching anincremental view of intelligence. These lines of researchare exciting in that these among the first strategies iden-tified to help individuals gain greater self-insight how-ever it is also time intensive and considerably easier toimplement with students than with adults outside ofeducational contexts. Further research might exploremore general means of improving insight into one’s levelof skill and one’s character. These are crucial questionsto address in future research.
References
Ackerman, P. L., Beier, M. E., & Bowen, K. R. (2002). What wereally know about our abilities and our knowledge. Personality and
Individual Differences, 33, 587–605.Aiken, L. S., & West, S. G. (1991). Multiple regression: Testing and
interpreting interactions. Thousand Oaks, CA: Sage.Alicke, M. D. (1985). Global self-evaluation as determined by the
desirability and controllability of trait adjectives. Journal of
Personality and Social Psychology, 49, 1621–1630.Alicke, M. D., & Govorun, O. (2005). The better-than-average effect.
In M. D. Alicke, D. A. Dunning, & J. I. Krueger (Eds.), The self in
social judgment. Studies in self and identity (pp. 85–106). New York,NY: Psychology Press.
Arkes, H. R., Christensen, C., Lai, C., & Blumer, C. (1987). Twomethods of reducing overconfidence. Organizational Behavior and
Human Decision Processes, 39, 133–144.Ashton, R. H. (1990). Pressure and performance in accounting
decision settings: Paradoxical effects of incentives, feedback andjustification. Journal of Accounting Research, 28, 148–180.
J. Ehrlinger et al. / Organizational Behavior and Human Decision Processes 105 (2008) 98–121 119
Author's personal copy
Atkinson, J. W. (1958). Towards experimental analysis of humanmotivation in terms of motives, expectancies, and incentives. In J.Atkinson (Ed.), Motives in fantasy, action and society. New York:Van Nostrand.
Awasthi, V., & Pratt, J. (1990). The effects of monetary incentives oneffort and decision performance: The role of cognitive character-istics. The Accounting Review, 65, 797–811.
Baumeister, R. F. (1982). A self-presentational view of socialphenomena. Psychological Bulletin, 91, 3–26.
Baumeister, R. F., & Newman, L. S. (1994). Self-regulation ofcognitive inference and decision processes. Personality and Social
Psychology Bulletin, 20, 3–19.Blackwell, L. A., Trzesniewski, K. H., & Dweck, C. S. (2007). Theories
of intelligence and achievement across the junior high schooltransition: A longitudinal study and an intervention. Child Devel-
opment, 78, 246–263.Bollen, K. A. (1989). Structural equations with latent variables. New
York: Wiley and Sons.Brown, J. D. (1986). Evaluations of self and others: Self-enhancement
biases in social judgments. Social Cognition, 4, 353–376.Burson, K. A., Larrick, R. P., & Klayman, J. (2006). Skilled or
unskilled, but still unaware of it: How perceptions of difficultydrive miscalibration in relative comparisons. Journal of Personality
and Social Psychology, 90, 60–77.Camerer, C., & Hogarth, R. (1999). The effects of financial incentives
in experiments: A review and capital-labor production framework.Journal of Risk and Uncertainty, 19, 7–42.
Carney, D. R., & Harrigan, J. A. (2003). It takes one to know one:Interpersonal sensitivity is related to accurate assessments ofothers’ interpersonal sensitivity. Emotion, 3, 194–200.
Chi, M. T. H., Glaser, R., & Rees, E. (1982). Expertise in problem-solving. In R. Sternberg (Ed.), Advances in the psychology of human
intelligence. Vol. 1 (pp. 17–76). Hillsdale, NJ: Erlbaum.Cross, P. (1977). Not can but will college teaching be improved? New
Directions for Higher Education, 17, 1–15.Dunning, D. (2001). On the motives underlying social cognition. In
Blackwell handbook of social psychology. In N. Schwarz & A.Tesser (Eds.). Intraindividual processes (Vol. 1, pp. 348–374). NewYork: Blackwell.
Dunning, D. (2005). Self-insight: Roadblocks and detours on the path to
knowing thyself. New York: Psychology Press.Dunning, D., Heath, D., & Suls, J. M. (2004). Flawed self-assessment:
Implications for health, education, and the workplace. Psycholog-
ical Science in the Public Interest, 5, 69–106.Dunning, D., Johnson, K., Ehrlinger, J., & Kruger, J. (2003). Why
people fail to recognize their own competence. Current Directions in
Psychological Science, 12, 83–87.Dunning, D., Meyerowitz, J. A., & Holzberg, A. D. (1989). Ambiguity
and self-evaluation: The role of idiosyncratic trait definitions inself-serving assessments of ability. Journal of Personality and Social
Psychology, 57, 1082–1090.Dweck, C. S. (1999). Self theories: Their role in motivation, personality,
and development. Philadelphia, PA: Psychology Press/Taylor andFrancis.
Dweck, C. S., & Leggett, E. L. (1988). A social–cognitive approach tomotivation and personality. Psychological Review, 95, 256–273.
Edwards, R. K., Kellner, K. R., Sistron, C. L., & Magyari, E. J.(2003). Medical student self-assessment of performance on anobstetrics and gynecology clerkship. American Journal of Obstetrics
and Gynecology, 188, 1078–1082.Ehrlinger, J., & Dunning, D. (2003). How chronic self-views influence
(and potentially mislead) estimates of performance. Journal of
Personality and Social Psychology, 84, 5–17.Ehrlinger, J., & Dweck, C. S. (in preparation). If I don’t see it, it must
not exist: How preferential attention allocation contributes tooverconfidence. Florida State University.
Falchikov, J. N., & Boud, D. (1989). Student self-assessment in highereducation: A meta-analysis. Review of Educational Research, 59,395–430.
Freund, B., Colgrove, L. A., Burke, B. L., & McLeod, R. (2005). Self-rated driving performance among elderly drivers referred fordriving evaluation. Accident: Analysis and Prevention, 37, 613–618.
Glucksberg, S. (1962). The influence of strength and drive onfunctional fixedness and perceptual recognition. Journal of Exper-
imental Psychology, 63, 36–41.Grether, D. M. (1980). Bayes rule as a descriptive model: The
representativeness heuristic. Quarterly Journal of Economics, 95,537–557.
Hacker, D. J., Bol, L., Horgan, D. D., & Rakow, E. A. (2000). Testprediction and performance in a classroom context. Journal of
Educational Psychology, 92, 160–170.Harris, M. M., & Schaubroeck, J. (1988). A meta-analysis of self-
supervisor, self-peer, and peer–supervisor ratings. Personnel Psy-
chology, 41, 43–62.Haun, D. E., Zeringue, A., Leach, A., & Foley, A. (2000). Assessing
the competence of specimen-processing personnel. Laboratory
Medicine, 31, 633–637.Hodges, B., Regehr, G., & Martin, D. (2001). Difficulties in recogniz-
ing one’s own incompetence: Novice physicians who are unskilledand unaware of it. Academic Medicine, 76, S87–S89.
Hogarth, R. M., Gibbs, B. J., McKenzie, C. R. M., & Marquis, M. A.(1991). Learning from feedback: Exactingness & incentives. Journal
of Experimental Psychology: Learning, Memory and Cognition, 17,734–752.
Hong, Y., Chiu, C., Lin, D. M.-S., Wan, W., & Dweck, C. S. (1999).Implicit theories, attributions, and coping: A meaning systemapproach. Journal of Personality and Social Psychology, 77,588–599.
Jenkins, G. D., Jr., Mitra, A., Gupta, N., & Shaw, J. D. (1998). Arefinancial incentives related to the performance? A meta-analyticreview of empirical research. Journal of Applied Psychology, 83,777–787.
Kahneman, D., & Peavler, W. S. (1969). Incentive effects and papillarychanges in association learning. Journal of Experimental Psychol-
ogy, 79, 312–318.Keren, G. B. (1987). Facing uncertainty in the game of bridge: A
calibration study. Organizational Behavior and Human Decision
Processes, 139, 98–114.Krueger, J. (1998). Enhancement bias in descriptions of self and
others. Personality and Social Psychology Bulletin, 24, 505–516.Kruger, J. (1999). Lake Wobegon be gone! The ‘‘below average effect’’
and the egocentric nature of comparative ability judgments.Journal of Personality and Social Psychology, 77, 221–232.
Krueger, J. I., & Funder, D. C. (2004). Toward a balanced socialpsychology: Causses, consequences, and cures for the problem-seeking approach to social behavior and cognition. Behavioral and
Brain Sciences, 27, 313–327.Krueger, J., & Mueller, R. A. (2002). Unskilled, unaware, or both? The
contribution of social-perceptual skills and statistical regression toself-enhancement biases. Journal of Personality and Social Psy-
chology, 82, 180–188.Kruger, J., & Dunning, D. (1999). Unskilled and unaware of it: How
difficulties in recognizing one’s own incompetence lead to inflatedself-assessments. Journal of Personality and Social Psychology, 77,1121–1134.
Kruger, J., & Dunning, D. (2002). Unskilled and unaware—but why?A reply to Krueger and Mueller. Journal of Personality and Social
Psychology, 82, 189–192.Kunda, Z. (1990). The case for motivated reasoning. Psychological
Bulletin, 108, 480–498.Lerner, J. S., & Tetlock, P. E. (1999). Accounting for the effects of
accountability. Psychological Bulletin, 125, 255–275.
120 J. Ehrlinger et al. / Organizational Behavior and Human Decision Processes 105 (2008) 98–121
Author's personal copy
Libby, R., & Lipe, M. G. (1992). Incentives, effort and the cognitiveprocesses involved in accounting-related judgments. Journal of
Accounting Research, 30, 249–273.Lichtenstein, S., Fischhoff, B., & Phillips, L. (1982). Calibration of
probabilities: The state of the art to 1980. In D. Kahneman, P.Slovic, & A. Tversky (Eds.), Judgment under uncertainty: Heuristics
and biases. New York: Cambridge University Press.Mabe, P. A., III, & West, S. G. (1982). Validity of self-evaluation of
ability: A review and meta-analysis. Journal of Applied Psychology,
67, 280–296.Maki, R. H., Jonas, D., & Kallod, M. (1994). The relationship between
comprehension and metacomprehension ability. Psychonomic Bul-
letin and Review, 1, 126–129.Marottoli, R. A., & Richardson, E. D. (1998). Confidence in, and self-
rating of, driving ability among older drivers. Accident Analysis and
Prevention, 30, 331–336.Mintz, A., Redd, S. B., & Vedlitz, A. (2006). Can we generalize from
student experiments to the real world in political science, militaryaffairs, and international relations? Journal of Conflict Resolution,
50, 757–776.Morgan, S. L. (2001). Counterfactuals, causal effect heterogeneity, and
the Catholic school effect on learning. Sociology of Education, 74,341–374.
Orton, P. Z. (1993). Cliffs Law School admission test preparation guide.Lincoln, NE: Cliffs Notes Incorporated.
Salthouse, T. A., Rogan, J. D., & Prill, K. A. (1984). Division ofattention: Age differences on a visually presented memory task.Memory and cognition, 12, 613–620.
Sears, D. O. (1986). College sophomores in the laboratory: Influencesof a narrow data base on social psychology’s view of humannature. Journal of Personality and Social Psychology, 51, 515–530.
Sedikides, C., Berbst, K. C., Hardin, D. P., & Dardis, G. J. (2002).Accountability as a deterrent to self-enhancement: The search formechanisms. Journal of Personality and Social Psychology, 83,592–605.
Shaughnessy, J. J. (1979). Confidence judgment accuracy as a predictorof test performance. Journal of Research in Personality, 13,505–514.
Sinkavich, F. J. (1995). Performance and metamemory: Do studentsknow what they don’t know? Instructional Psychology, 22, 77–87.
Tetlock, P. E. (1983). Accountability and complexity of thought.Journal of Personality & Social Psychology, 45, 74–83.
Tetlock, P. E., & Kim, J. I. (1987). Accountability and judgmentprocesses in a personality prediction task. Journal of Personality &
Social Psychology, 52, 700–709.Weinstein, N. D. (1980). Unrealistic optimism about future life events.
Journal of Personality and Social Psychology, 58, 806–820.Winship, C., & Korenman, S. (1997). Does staying in school make you
smarter? The effect of education on IQ. In B. Devlin, S. E.Fienberg, D. Resnick, & K. Roeder (Eds.), Intelligence and success:
Is it all in the genes? Scientists respond to the bell curve
(pp. 215–234). New York: Springer Verlag.Winship, C., & Morgan, S. L. (1999). The estimation of causal effects
from observational data. Annual Review of Sociology, 25, 659–707.Wright, W. F., & Anderson, U. (1989). Effects of situation familiarity
and financial incentives on use of the anchoring and adjustmentheuristic for probability assessment. Organizational Behavior and
Human Decision Processes, 44, 68–82.Zenger, T. R. (1992). Why do employers only reward extreme
performance? Examining the relationships among performance,pay, and turnover. Administrative Science Quarterly, 37,198–219.
J. Ehrlinger et al. / Organizational Behavior and Human Decision Processes 105 (2008) 98–121 121