Embed Size (px)
Citation preview

Author(s)Wouter Van den Broeck, Corrado Gioannini, Bruno Goncalves, Marco Quaggiotto, Vittoria Colizza, andAlessandro Vespignani
This article is available at IRis: http://iris.lib.neu.edu/physics_fac_pubs/177
SOFTWARE Open Access
The GLEaMviz computational tool, a publiclyavailable software to explore realistic epidemicspreading scenarios at the global scaleWouter Van den Broeck1, Corrado Gioannini1*, Bruno Gonçalves2,3, Marco Quaggiotto1,4, Vittoria Colizza5,6,7*,Alessandro Vespignani2,3,7*
Abstract
Background: Computational models play an increasingly important role in the assessment and control of publichealth crises, as demonstrated during the 2009 H1N1 influenza pandemic. Much research has been done in recentyears in the development of sophisticated data-driven models for realistic computer-based simulations of infectiousdisease spreading. However, only a few computational tools are presently available for assessing scenarios,predicting epidemic evolutions, and managing health emergencies that can benefit a broad audience of usersincluding policy makers and health institutions.
Results: We present “GLEaMviz”, a publicly available software system that simulates the spread of emerginghuman-to-human infectious diseases across the world. The GLEaMviz tool comprises three components: the clientapplication, the proxy middleware, and the simulation engine. The latter two components constitute the GLEaMvizserver. The simulation engine leverages on the Global Epidemic and Mobility (GLEaM) framework, a stochasticcomputational scheme that integrates worldwide high-resolution demographic and mobility data to simulatedisease spread on the global scale. The GLEaMviz design aims at maximizing flexibility in defining the diseasecompartmental model and configuring the simulation scenario; it allows the user to set a variety of parametersincluding: compartment-specific features, transition values, and environmental effects. The output is a dynamic mapand a corresponding set of charts that quantitatively describe the geo-temporal evolution of the disease. Thesoftware is designed as a client-server system. The multi-platform client, which can be installed on the user’s localmachine, is used to set up simulations that will be executed on the server, thus avoiding specific requirements forlarge computational capabilities on the user side.
Conclusions: The user-friendly graphical interface of the GLEaMviz tool, along with its high level of detail and therealism of its embedded modeling approach, opens up the platform to simulate realistic epidemic scenarios. Thesefeatures make the GLEaMviz computational tool a convenient teaching/training tool as well as a first step towardthe development of a computational tool aimed at facilitating the use and exploitation of computational modelsfor the policy making and scenario analysis of infectious disease outbreaks.
* Correspondence: [email protected]; [email protected];[email protected] Epidemiology Laboratory, Institute for Scientific Interchange(ISI), Turin, Italy2Center for Complex Networks and Systems Research, School of Informaticsand Computing, Indiana University, Bloomington, IN 47408, USAFull list of author information is available at the end of the article
Broeck et al. BMC Infectious Diseases 2011, 11:37http://www.biomedcentral.com/1471-2334/11/37
© 2011 Broeck et al; licensee BioMed Central Ltd. This is an Open Access article distributed under the terms of the Creative CommonsAttribution License (http://creativecommons.org/licenses/by/2.0), which permits unrestricted use, distribution, and reproduction inany medium, provided the original work is properly cited.

BackgroundThe 2009 H1N1 influenza pandemic highlighted theimportance of computational epidemic models for thereal-time analysis of the health emergency related tothe global spreading of new emerging infectious diseases[1-3]. Realistic computational models are highly complexand sophisticated, integrating substantial amounts ofdata that characterize the population and geographicalcontext in order to attain superior accuracy, resolution,and predictive power [4-10]. The challenge consists indeveloping models that are able to capture the complex-ity of the real world at various levels by taking advan-tage of current information technology to provide anin silico framework for testing control scenarios that cananticipate the unfolding of an epidemic. At the sametime, these computational approaches should be trans-lated into tools accessible by a broader set of users whoare the main actors in the decision-making process ofhealth policy, especially during an emergency like aninfluenza pandemic. The tradeoff between realistic andaccurate descriptions of large-scale dynamics, flexibility,computational feasibility, ease of use, and accessibility ofthese tools creates a major challenge from both thetheoretical and the computational points of view[4,5,11,12,10,13]. GLEaMviz is a client-server softwaresystem that can model the world-wide spread of epi-demics for human transmissible diseases like influenza-like illnesses (ILI), offering extensive flexibility in thedesign of the compartmental model and scenario setup,including computationally-optimized numerical simula-tions based on high-resolution global demographic andmobility data. GLEaMviz makes use of a stochastic anddiscrete computational scheme to model epidemicspread called “GLEaM” - GLobal Epidemic and Mobilitymodel, presented in previously published work [6,3,14] -which is based on a geo-referenced metapopulationapproach that considers 3,362 subpopulations in 220countries of the world, as well as air travel flow connec-tions and short-range commuting data. The softwareincludes a client application with a graphical user inter-face (GUI) for setting up and executing simulations, andretrieving and visualizing the results; the client applica-tion is publicly downloadable. The server applicationcan be requested by public institutions and researchcenters; conditions of use and possible restrictions willbe evaluated specifically.The tool is currently not suitable for the simulation of
vector-borne diseases, infection transmission dependingon local contact patterns such as sexually transmitteddiseases and diseases with a time scale that would makedemographic effects relevant. The tool, however, allowsthe introduction of mitigation policies at the globallevel. Localized intervention in space or time can be
implemented in the GLEaM model and their introduc-tion in the GLEaMviz computational tool are plannedfor future releases.Only a few computational tools are currently available
to the public for the analysis and modeling of epidemics.These range from very simple spreadsheet-based modelsaimed at providing quick estimates for the number ofpatients and hospitalizations during a pandemic (see e.g.FluSurge [15]) to more complicated tools based onincreasingly sophisticated simulation approaches[11,16,12,10,13,5]. These tools differ in their underlyingmodeling approaches and in the implementation, flex-ibility, and accessibility of the software itself.InfluSim is a tool that provides a visual interface to
simulate an epidemic with a deterministic compartmen-tal model in a single population [11]. The modelincludes age structure and explicit sojourn times withdifferent stages in each compartment, extending anSEIR compartmentalization to include hospitalizationsand intervention measures. The software provides theinfectious disease dynamics and the user can set para-meter values and add or remove interventions. However,no spatial structure or other forms of heterogeneity andstochasticity are considered in the model.On the other hand agent-based models describe the
stochastic propagation of a disease at the individuallevel, thus taking into account the explicit social andspatial structure of the population under consideration.CommunityFlu is a software tool that simulates thespread of influenza in a structured population ofapproximately 1,000 households with 2,500 persons [13].User interaction with the software is limited to thespreadsheet portion of the program, where one canchoose the type of intervention and other parametersdescribing the disease and the population.A larger population is considered in FluTe, a publicly
available tool for the stochastic simulation of an epi-demic in the United States at the level of individuals[10]. The model is based on a synthetic population,structured in a hierarchy of mixing social groups includ-ing households, household clusters, neighborhoods, andnation-wide communities. FluTe comes with a config-uration file in text format that can be modified by anexpert user to set various parameters such as the initia-tion of the epidemic, the reproductive number, and theinterventions considered. No GUI is provided, and theoutput of the simulations is given in the form of textfiles that must be analyzed through additional software.EpiFast involves a parallel algorithm implemented
using a master-slave approach which allows for scalabil-ity on distributed memory systems, from the generationof synthetic population aggregated in mixing groups tothe explicit representation of the contact patterns
Broeck et al. BMC Infectious Diseases 2011, 11:37http://www.biomedcentral.com/1471-2334/11/37
Page 2 of 14

between individuals as they evolve in time [5]. The Epi-Fast tool allows for the detailed representation andsimulation of the disease on social contact networksamong individuals that dynamically evolve in time andadapt to actions taken by individuals and public healthinterventions. The algorithm is coupled with a web-based GUI and the middleware system Didactic, whichallows users to specify the simulation setup, execute thesimulation, and visualize the results via plots. Epidemicmodels and interventions are pre-configured, and thesystem can scale up to simulate a population of a largemetropolitan area on the order of tens of millions ofinhabitants.Another class of models focuses on the global scale,
by using a metapopulation approach in which the popu-lation is spatially structured into patches or subpopula-tions (e.g. cities) where individuals mix. These patchesare connected by mobility patterns of individuals. In thisvein two tools are currently available. The Global Epi-demic Model (GEM) uses a metapopulation approachbased on an airline network comprised of 155 majormetropolitan areas in the world for the stochastic simu-lation of an influenza-like illness [16]. The tool consistsof a Java applet in which the user can simulate ahypothetical H1N1 outbreak and test pre-configuredintervention strategies. The compartmentalization is setto an SEIR model, and the parameterization can bemodified in the full or stand-alone mode, but not cur-rently in the Java applet.The Spatiotemporal Epidemiological Modeler (STEM)
is a modeling system for the simulation of the spreadof an infectious disease in a spatially structured popu-lation [16]. Contrary to other approaches, STEM isbased on an extensible software platform, which pro-motes the contribution of data and algorithms byusers. The resulting framework therefore merges data-sets and approaches and its detail and realism dependon continuous developments and contributions. How-ever, these are obtained from a variety of sources andare provided in different formats and standards, thusresulting in possible problems related to the integra-tion and merging of datasets. Such issues are left tothe user to resolve.The existing tools described above thus offer the
opportunity to use highly sophisticated data-drivenapproaches at the expense of flexibility and ease of useby non-experts on the one hand, or very simplifiedmodels with user-friendly GUIs and no specific compu-tational requirements on the other. Our approach aimsat optimizing the balance of complex and sophisticateddata-driven epidemic modeling at the global scale whilemaintaining an accessible computational speed andoverall flexibility in the description of the simulationscenario, including the compartmental model, transition
rates, intervention measures, and outbreak conditions bymeans of a user-friendly GUI.In the GLEaMviz tool the setup of the simulations is
highly flexible in that the user can design arbitrary dis-ease compartmental models, thus allowing an extensiverange of human-to-human infectious diseases and inter-vention strategies to be considered. The user interfacehas been designed in order to easily define both featuresspecific to each compartment, such as the mobility ofclasses of individuals, and general environmental effects,such as seasonality for diseases like influenza. In addi-tion, the user can define the initial settings that charac-terize the initial geographical and temporal conditions,the immunity profile of the population, and other para-meters including but not limited to: the definition of anoutbreak condition in a given country; the number ofstochastic runs to be performed; and the total durationof each simulation. The tool allows the production ofglobal spreading scenarios with geographical high reso-lution by just interacting with the graphic user interface.While an expert input would be required to interpretand discuss the results obtained with the software, thepresent computational platform facilitates the generationand analysis of scenarios from intensive data-drivensimulations. The tool can be deployed both in trainingactivities as well as to facilitate the use of large-scalecomputational modeling of infectious diseases inthe discussion between modelers and public healthstakeholders.The paper is organized as follows. The “Implementa-
tion” section describes the software application archi-tecture and its major components, including thecomputational model GLEaM. The “Results and dis-cussion” section presents in detail the GLEaMviz clientand its components that allow for software-user inter-action, including an application of the Simulator to anInfluenza-like-illness scenario.
ImplementationThe top-level architecture of the GLEaMviz tool com-prises three components: the GLEaMviz client application,the GLEaMviz proxy middleware, and the simulationengine. The latter two components constitute the GLEaM-viz server, as shown in Figure 1.Users interact with the GLEaMviz system by means of
the client application, which provides graphical user-interfaces for designing and managing the simulations,as well as visualizing the results. The clients, however,do not themselves run the simulations. Instead theyestablish a connection with the GLEaMviz proxy mid-dleware to request the execution of a simulation by theserver. Multiple clients can use the same server concur-rently. Upon receipt of requests to run a simulation, themiddleware starts the simulation engine instances
Broeck et al. BMC Infectious Diseases 2011, 11:37http://www.biomedcentral.com/1471-2334/11/37
Page 3 of 14

required to execute the requests and monitors their sta-tus. Once the simulations are completed, the GLEaMvizproxy middleware collects and manages the resultingsimulation data to be served back to the clients. A sche-matic diagram of the workflow between client and ser-ver is shown in Figure 2.This client-server model allows for full flexibility in its
deployment; the client and server can be installed on thesame machine, or on different machines connected by alocal area network or the Internet. The two-part decom-position of the server in terms of middleware and enginesadditionally allows for advanced high-volume setups inwhich the middleware server distributes the engineinstances over a number of machines, such as those in acluster or cloud. This architecture thus ensures highspeed in large-scale simulations and does not rely on theCPU-specific availability accessible by the user.The GLEaMviz simulation engine uses a stochastic
metapopulation approach [17-19,2,20-22,16] that con-siders data-driven schemes for the short-range and
GLEaMviz Client GLEaMviz Server
Design the compartmental model of the infectious disease in the Model Builder.
1Configure the simulation of the world-wide epidemic spreading in the Simulation Wizard.
2
Submit the simulation for execution by the Engine on the server.
3
Inspect the results of a simulation in the interactive Visualization.
5Inspect all simulations and retrieve results in the Simulations History.
4
Figure 2 The principal GLEaMviz tool workflow with the GLEaMviz components involved in each step. The compartmental model of theinfectious disease is created in the Model Builder. Next, the Simulation Wizard is used to configure the simulation and submit it for execution bythe Engine on the server. The Simulation History keeps track of the submitted simulations and retrieves the simulation results when theybecome available. The simulation results are finally inspected in the interactive Visualization.
GLEaMviz client GLEaMviz server
GLEaMsimGLEaMsimGLEGLEGLE MaMsaMsiimim
wrapper
client proxy
core(GLEaM)
simulation engine
Figure 1 The GLEaMviz tool system involves one or moreGLEaMviz clients that interact with a GLEaMviz server over aTCP connection. The server consists of a GLEaMviz proxymiddleware component and a number of GLEaMviz simulationengines. The middleware component handles the interactions withthe clients and manages the engine instances. Each submittedsimulation is performed by one GLEaMviz simulation engineinstance, which consists of a wrapper that launches the actualsimulation cores, one for each run, and performs statistical analysison the aggregated results.
Broeck et al. BMC Infectious Diseases 2011, 11:37http://www.biomedcentral.com/1471-2334/11/37
Page 4 of 14

long-range mobility of individuals at the inter-popula-tion level, coupled with coarse-grained techniques todescribe the infection dynamics within each subpopula-tion [6,14]. The basic mechanism for epidemic propaga-tion occurs at multiple scales. Individuals interactwithin each subpopulation and may contract the diseaseif an outbreak is taking place in that subpopulation. Bytravelling while infected, individuals can carry thepathogen to a non-infected region of the world, thusstarting a new outbreak and shaping the spatial spreadof the disease.The basic structure of GLEaM consists of three dis-
tinct layers - the population layer, the mobility layer,and the epidemic layer (see Figure 3) [6,14].The population layer is based on the high-resolution
population database of the Gridded Population of theWorld project by the Socio-Economic Data and Applica-tions Center (SEDAC) [23] that estimates populationwith a granularity given by a lattice of cells covering thewhole planet at a resolution of 15 × 15 minutes of arc.The mobility layer integrates short-range and long-
range transportation data. Long-range air travel mobilityis based on travel flow data obtained from the Interna-tional Air Transport Association (IATA [24]) and theOfficial Airline Guide (OAG [25]) databases, which con-tain the list of worldwide airport pairs connected bydirect flights and the number of available seats on anygiven connection [26]. The combination of the popula-tion and mobility layers allows for the subdivision of theworld into geo-referenced census areas obtained by aVoronoi tessellation procedure around transportation
hubs. These census areas define the subpopulations ofthe metapopulation modeling structure, identifying3,362 subpopulations centered on IATA airports in220 different countries. The model simulates the mobi-lity of individuals between these subpopulations usinga stochastic procedure defined by the airline transpor-tation data [6]. Short-range mobility considers com-muting patterns between adjacent subpopulationsbased on data collected and analyzed from more than30 countries in 5 continents across the world [6]. It ismodeled with a time-scale separation approach thatdefines the effective force of infections in connectedsubpopulations [6,27,28].On top of the population and mobility layers lies the
epidemic layer, which defines the disease and populationdynamics. The infection dynamics takes place withineach subpopulation and assumes a compartmentaliza-tion [29] that the user can define according to the infec-tious disease under study and the intervention measuresbeing considered. All transitions between compartmentsare modeled through binomial and multinomial pro-cesses to preserve the discrete and stochastic nature ofthe processes. The user can also specify the initial out-break conditions that characterize the spreading sce-nario under study, enabling the seeding of the epidemicin any geographical census area in the world and defin-ing the immunity profile of the population at initiation.Seasonality effects are still an open problem in the
transmission of ILI diseases. In order to include theeffect of seasonality on the observed pattern of ILI dis-eases, we use a standard empirical approach in which
Population layer Short-range mobility layer Long-range mobility layer
101
105
101
105
census areas commuting air travel
airports
Figure 3 The three population and mobility data layers in GLEaM. The population layer consists of demographic data at a resolution of15 × 15 minutes of arc, organized in geo-referenced census areas obtained with a Voronoi tessellation procedure around transportation hubs.The short-range mobility layer covers commuting patterns between adjacent subpopulations based on data collected and analyzed from morethan 30 countries on 5 continents across the world, modeled with a time-scale separation approach that defines the effective force of infectionsin connected subpopulations. The long-range mobility layer covers the air travel flow, measured in available seats between worldwide airportpairs connected by direct flights.
Broeck et al. BMC Infectious Diseases 2011, 11:37http://www.biomedcentral.com/1471-2334/11/37
Page 5 of 14

seasonality is modeled by a forcing that reduces thebasic reproductive number by a factor amin rangingfrom 0.1 to 1 (no seasonality) [20]. The forcing isdescribed by a sinusoidal function of 12 months-periodthat reaches its peak during Winter time and its mini-mum during Summer time in each Hemisphere, withthe two Hemispheres with opposite phases.Given the population and mobility data, infection
dynamics parameters, and initial conditions, GLEaMperforms the simulation of stochastic realizations of theworldwide unfolding of the epidemic. From thesein silico epidemics a variety of information can be gath-ered, such as prevalence, morbidity, number of second-ary cases, number of imported cases, hospitalizedpatients, amounts of drugs used, and other quantitiesfor each subpopulation with a time resolution of 1 day.GLEaM has been under continuous development since
2005 and during these years it has been used: to assessthe role of short-range and long-range mobility in epi-demic spread [30,31,6]; to retrospectively analyze theSARS outbreak of 2002-2003 in order to investigate thepredictive power of the model [22]; to explore globalhealth strategies for controlling an emerging influenzapandemic with pharmaceutical interventions underlogistical constraints [21]; and more recently to estimatethe seasonal transmission potential of the 2009 H1N1influenza pandemic during the early phase of the out-break to provide predictions for the activity peaks in theNorthern Hemisphere [3,32].The GLEaMviz simulation engine consists of a core
that executes the simulations and a wrapper that pre-pares the execution based on the configuration relayedfrom the client by the GLEaMviz proxy middleware. Theengine can perform either single-run or multi-run simu-lations. The single-run involves only a single stochasticrealization for a given configuration setup and a randomseed. The multi-run simulation involves a number of sto-chastic realizations as set by the user and performed bythe core (see the following Section), each with the sameconfiguration but with a different random seed. Theresults of the multi-run simulation are then aggregatedand statistically analyzed by the wrapper code.The simulation engine writes the results to files and
uses lock files to signal its status to the middlewarecomponent. The core is written in C++, resulting in afast and efficient engine that allows the execution of asingle stochastic simulation of a 1-year epidemic witha standard SEIR model in a couple of minutes on ahigh-end desktop computer. The wrapper code is writ-ten in Python [33]. The server components can beinstalled on most UNIX-like operating systems such asLinux, BSD, Mac OS X, etc.The GLEaMviz proxy middleware is the server com-
ponent that mediates between clients and simulation
engines. It accepts TCP connections from clients andhandles requests relayed over these connections, provid-ing client authorization management.A basic access control mechanism is implemented that
associates a specific client with the simulations itlaunches by issuing a private simulation identifier keyupon submission. Users can only retrieve the results ofthe simulations they launched, or simulations for whichthey have obtained the simulation definition file -con-taining the private simulation identifier key- from theoriginal submitter.Upon receipt of a request to execute a simulation, the
middleware sets up the proper system environment andthen launches an instance of the simulation engine withthe appropriate configuration and parameters accordingto the instructions received from the client. For single-run simulations, the daily results are incrementallyserved back to the client while the simulation is beingexecuted. This allows for the immediate visualization ofthe spreading pattern, as described in “Visualizationinterface” Subsection. For multi-run simulations theresults are statistically analyzed after all runs are fin-ished, and the client has to explicitly request the retrie-val of the results once they become available. TheGLEaMviz proxy server component can be configuredto keep the simulation data indefinitely or to schedulethe cleanup of old simulations after a certain period oftime. Multi-run metadata is stored in an internal objectthat is serialized on a system file, ensuring that authori-zation information is safely kept after a server shutdownor failure. The GLEaMviz proxy component additionallyprovides control features such as accepting administra-tive requests at runtime in order to manage storedsimulations or to modify several configuration para-meters like the number of simultaneous connectionsallowed, the number of simultaneous simulations perclient, the session timeout, etc.The middleware server is written in Python [33] and
uses the Twisted Matrix library suite [34] for its net-working functionality. Client and server communicateusing a special purpose protocol, which provides com-mands for session handling and simulation management.Commands and data are binary encoded using AdobeAction Message Format (AMF3) in order to minimizebandwidth needs.The GLEaMviz client is a desktop application by
which users interact with the GLEaMviz tool. It providesGUIs for its four main functions: 1) the design of com-partmental models that define the infection dynamics; 2)the configuration of the simulation parameters; 3) thevisualization of the simulation results; and 4) the man-agement of the user’s collection of simulations. In thefollowing Section we describe these components indetail.
Broeck et al. BMC Infectious Diseases 2011, 11:37http://www.biomedcentral.com/1471-2334/11/37
Page 6 of 14

The client was developed using the Adobe AIR plat-form [35] and the Flex framework [36] and can thus bedeployed on diverse operating systems, including severalWindows versions, Mac OS X, and several commonLinux distributions. The GLEaMviz client has a built-inupdating mechanism to check for the latest updates anddevelopments and prompts the user to automaticallydownload them. It also offers a menu of configurationoptions of the interface that allows the user to custo-mize preferences about data storage, visualizationoptions, the server connection, and others.
Results and DiscussionThe software system presented above is operatedthrough the GLEaMviz client, which provides the userinterface: the part of the tool actually experienced onthe user side. The GLEaMviz client integrates differentmodules that allow the management of the entire pro-cess flow from the definition of the model to the visuali-zation of the results. In the following we will describethe various components and provide the reader with auser study example.
Model BuilderThe Model Builder provides a visual modeling tool fordesigning arbitrary compartmental models, ranging fromsimple SIR models to complex compartmentalization inwhich multiple interventions can be considered along withdisease-associated complications and other effects.
(An example can be found in previous work [37].) A snap-shot of the Model Builder window is shown in Figure 4.The models are represented as flow diagrams with sty-
lized box shapes that represent compartments and direc-ted edges that represent transitions, which is consistentwith standard representations of compartmental modelsin the literature. Through simple operations like ‘clickand drag’ it is possible to create any structure with fullflexibility in the design of the compartmentalization; theuser is not restricted to a given set of pre-loaded com-partments or transition dynamics. The interactive inter-face provided by the Model Builder enables the user todefine the compartment label, the mobility constraintsthat apply (e.g. allowed/not allowed to travel by air or byground), whether the compartment refers to clinicalcases, as well as the color and position of their represen-tation in the diagram (see Figure 5). This allows the userto model many kinds of human-to-human infectious dis-eases, in particular respiratory and influenza-like diseases.Transitions from one compartment to another can be
of two types: infection transitions or spontaneous transi-tions. Examples of spontaneous transitions include thetransitions from latent to infectious individuals andfrom infectious to recovered individuals. An infectiontransition, on the other hand, generates new infectedindividuals. In GLEaM we consider a homogeneous mix-ing assumption in each subpopulation so that theexpected number of new infections generated by I infec-tious individuals in a population with S susceptible
Model Builder
Hints
Canvas Variables list
Inconsistencies
Menu
Figure 4 The compartmental Model Builder allows the user to define the dynamics of the infection by creating populationcompartments and specifying the infectious and the spontaneous transitions that occur between them. The Model Builder provides aninteractive diagram of the compartmental model, a table with the values for the variables used in the model, a list of current inconsistencies inthe model, and a panel that provides concise descriptions on the various functionalities in the interactive diagram.
Broeck et al. BMC Infectious Diseases 2011, 11:37http://www.biomedcentral.com/1471-2334/11/37
Page 7 of 14

individuals is equal to SIN, where N is the total size of
the subpopulation. The GLEaM simulation engine con-siders discrete individuals. All its transition processesare both stochastic and discrete, and are modeledthrough binomial and multinomial processes.Transitions can be visually added by dragging a marker
from the source to the target compartment. Spontaneoustransitions are annotated with their rates, which can bemodified interactively. Infection transitions are accompa-nied with a representation of the infection’s source com-partment and the applicable rate (i.e. b in the exampleabove), which can also be modified in an interactive way.The rates can be expressed in terms of a constant value orin terms of a variable whose value needs to be specified inthe variables table, as shown in Figure 4. The value canalso be expressed by simple algebraic expressions.The client automatically checks for and reports incon-
sistencies in the model in order to assist the user in thedesign process (see bottom right window in Figure 4).Models can be exported to XML files and stored
locally, allowing the user to load a model later, modifyit, and share it with other users. The diagram represen-tation can be exported as a PDF or SVG file for use indocumentation or publications. A few examples of
compartmental models are available for download fromthe Simulator website.
Simulation WizardThe Simulation Wizard provides a sequence of panelsthat leads the user through the definition of several con-figuration parameters that characterize the simulation.Figure 6 shows some of these panels. The consecutivesteps of the configuration are as follows:•Choice of the type of the simulation (panel a)The user is prompted with three options: create a new
single-run simulation or a new multi-run simulationfrom scratch, or a new one based on a saved simulationpreviously stored in a file.•Compartmental model selection and editing
(panel b)The user can design a new compartmental model,
modify the current compartmental model (when deriv-ing it from an existing simulation), or load a modelcompartmentalization from a file.•Definition of the simulation parameters (panel c)The user is asked to specify various settings and para-
meter values for the simulation, including, e.g., the num-ber of runs to perform (only accessible in the case of amulti-run), the initial date of the simulation, the lengthof the simulation (in terms of days), whether or not sea-sonality effects should be considered, the airplane occu-pancy rate, the commuting time, the conditions for thedefinition of an outbreak, and others.•Initial assignment of the simulation (panel d)Here the user assigns the initial distribution of the
population amongst compartments, defining the immu-nity profile of the global population on the starting date.•Definition of the outbreak start (panel e)This panel allows the user to define the initial condi-
tions of the epidemic by selecting the city (or cities)seeded with the infection.•Selection of output results (panel f)Here the user selects the compartments that will con-
stitute the output provided by the client at the end ofthe simulation. The corresponding data will be shown inthe Visualization Window and made available fordownload.When all the above configuration settings are defined,
the user can submit the simulation to the GLEaMvizserver for execution. This will automatically add thesimulation to the user’s Simulations History. It isfurthermore possible to save the definition of the simu-lation setup to a local file, which can be imported againlater or shared with other users.
Simulations HistoryThe Simulations History is the main window of the cli-ent and provides an overview of the simulations that the
Compartments
Transitions
infector
infection edge
susceptible compartment
infection transition target
add infector
delete infector
select the infector compartment
transition variables
click or drag to add infection transition
click or drag to add spontaneous transition
allow/disallow air travelallow/disallow commuting
remove compartmentchange color
clinical cases yes/no
Figure 5 The interactive compartmental model diagram in theModel Builder represents the compartments and thetransitions. Various user interface elements in these representationsallow the user to manipulate the model occurring to his/her needs.
Broeck et al. BMC Infectious Diseases 2011, 11:37http://www.biomedcentral.com/1471-2334/11/37
Page 8 of 14

user has designed and/or submitted, in addition to pro-viding access to the Model Builder, the SimulationWizard, and the Visualization Component. The overviewpanel shown in Figure 7 lists the simulation identifier,the submission date and time, the simulation type(i.e., single or multi-run), the execution status (i.e., initi-alized, start pending, started, aborted, complete, failed,or stop pending) and the results status (i.e., none,retrieve pending, retrieving, stop retrieve pending, com-plete, or stored locally). Additional File 1 provides adetailed explanation of all these values.
A number of context-dependent command buttonsare available once a simulation from the list is selected.Those buttons allow the user to control the simulationexecution, retrieve the results from the server and visua-lize them, clone and edit the simulation to perform anew execution, save the simulation definition or the out-put data to the local machine (in order to analyze theobtained data with other tools, for example), andremove the simulation. In addition to exporting thecompartmental model (see the “Model Builder” Subsec-tion) the user can export a complete configuration of asimulation that includes the compartmental model andthe entire simulation setup to a local file, which can beimported again later or shared with other users.
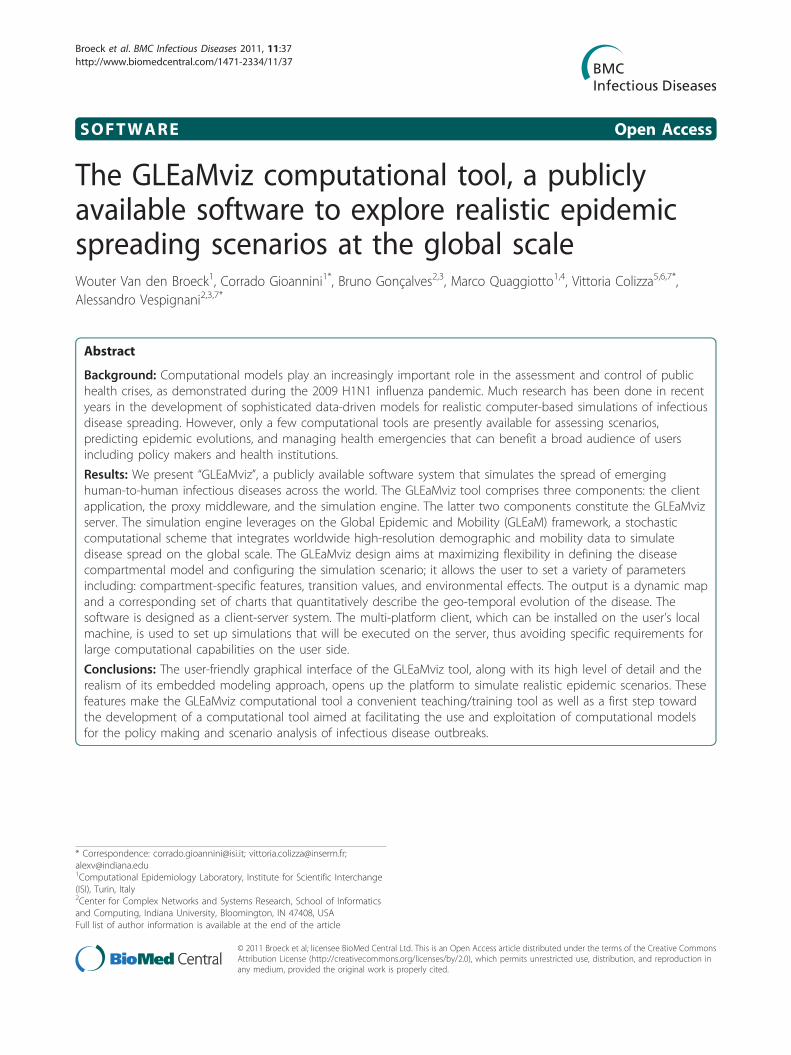
Visualization interfaceOnce the execution of a simulation is finished and theresults have been retrieved from the server, the clientcan display the results in the form of an interactivevisualization of the geo-temporal evolution of the epi-demic. This visualization consists of a temporal and geo-graphic mapping of the results accompanied by a set ofgraphs (see Figure 8). The geographic mapping involvesa zoomable multi-scale map on which the cells of thepopulation layer are colored according to the number ofnew cases of the quantity that is being displayed. Severalvisualization features can be customized by clicking onthe gear icon and opening the settings widget. It is pos-sible to zoom in and out and pan by means of the inter-face at the top left of the map. Dragging the map with
Figure 7 The main window contains the main menu and theSimulations History, which provides an overview of all thesimulations set up by the user, and a contextual menu withthe applicable operations.
Figure 6 The Simulation Wizard provides a sequence of panels that leads the user through the definition of the settings andparameters that characterize the simulation. These panels prompt the user to specify: (a) the type of simulation; (b) the compartmentalmodel; (c) the simulation parameters; (d) the initial distribution of the population amongst the compartments; (e) the initial conditions of thestart of the epidemic outbreak; and (f) the compartments considered for the results gathered at the end of the simulation.
Broeck et al. BMC Infectious Diseases 2011, 11:37http://www.biomedcentral.com/1471-2334/11/37
Page 9 of 14
the mouse (on a location where there are no basinmarks) can also pan the visualization. All the widgetsand the graphs displayed over the map can be re-posi-tioned according to the user’s preferences by clickingand dragging the unused space in the title bar.The color coding of the map represents the number of
cases on a particular day. The time evolution of the epi-demic can be shown as a movie, or in the form of dailystates by moving forward or backward by one day at atime. For single-run simulations it is also possible toshow the airline transportation of the ‘seeding’ indivi-duals by drawing the traveling edge between the originand destination cities. In the case where the output quan-tity is a subset of the infectious compartments, the edgesshow the actual seeding of the infection. Note that theevolution of the epidemic depends strongly on the modeldefinition. For example, it is possible that some basinsare infected by a latent individual that later develops thedisease. In this case no seeding flight will be shown ifonly infectious compartments are selected as output.Beside the geographical map, the Visualization Win-
dow displays two charts. One chart shows the number ofnew cases per 1,000 over time (incidence), and the othershows the cumulative number of new cases per 1,000over time (size). For multi-run simulations, medianvalues and corresponding 95% confidence intervals areshown. The menu above each chart combo lets the userchoose the context for which the corresponding chartsshow incidence and size data. This context is either:
global, one of three hemispheres, one continent, oneregion, one country, or one city. The currently selectedday is marked by a vertical line in these plots, and theday number, counted from the initial date selected forthe simulation, is shown by side of the time slider.
User study exampleHere we present an example application of the GLEaMviztool to study a realistic scenario for the mitigation of anemerging influenza pandemic. Disease-control programsforesee the use of antiviral drugs for treatment and short-term prophylaxis until a vaccine becomes available [38].The implementation of these interventions rely both onlogistical constraints [21,39] - related, e.g., to the availabil-ity of drugs - and on the characteristics of the infection,including the severity of the disease and the virus’s poten-tial to develop resistance to the drugs [40].Here we focus on the mitigation effects of systematic
antiviral (AV) treatment in delaying the activity peakand reducing attack rate [41-43,7,8,39,40,3], and assumethat all countries have access to AV stockpiles. We con-sider a scenario based on the 2009 H1N1 influenza pan-demic outbreak and feed the Simulator with the set ofparameters and initial conditions that have been esti-mated for that outbreak through a Maximum LikelihoodEstimate by using the GLEaM model [3]. The resultsprovided by the present example are not meant to becompared with those contained in the full analysis car-ried out with GLEaM [3] due to the fact that in the
Figure 8 The simulation results can be inspected in an interactive visualization of the geo-temporal evolution of the epidemic. Themap shows the state of the epidemic on a particular day with infected population cells color-coded according to the number of new cases ofthe quantity that is being displayed. Pop-ups provide more details upon request for each city basin. The zoomable multi-scale map allows theuser to get a global overview, or to focus on a part of the world. The media-player-like interface at the bottom is used to select the day ofinterest, or show the evolution of the epidemic like a movie. Two sets of charts on the right show the incidence curve and the cumulative sizeof the epidemics for selectable areas of interest.
Broeck et al. BMC Infectious Diseases 2011, 11:37http://www.biomedcentral.com/1471-2334/11/37
Page 10 of 14

present example we do not consider additional mitiga-tion strategies that were put in place during the earlyphase of the outbreak, such as the sanitary control mea-sures implemented in Mexico [3,44], or the observedreduction in international travel to/from Mexico [45].Indeed, the current version of GLEaMviz does not allowfor interventions that are geographically and/or tempo-rally dependent. However, these features are currentlyunder development and will be available in the nextsoftware release. For this reason the simulation scenariothat we study in this application of the Simulator does
not aim to realistically reproduce the timing of thespreading pattern of the 2009 H1N1 pandemic. Theresults reported here ought to be considered as anassessment of the mitigating impact of AV treatmentalone, based on the initial conditions estimated for theH1N1 outbreak, and assuming the implementation ofthe same AV protocol in all countries of the world.We adopt a SEIR-like compartmentalization to model
influenza-like illnesses [29] in which we include the sys-tematic successful treatment of 30% of the symptomaticinfectious individuals (see Figure 9). The efficacy of the
Figure 9 Compartmental structure in each subpopulation in the intervention scenario. A modified Susceptible-Latent-Infectious-Recoveredmodel is considered, to take into account asymptomatic infections, traveling behavior while ill, and use of antiviral drugs as a pharmaceuticalmeasure. In particular, infectious individuals are subdivided into: asymptomatic (Infectious_a), symptomatic individuals who travel while ill(Infectious_s_t), symptomatic individuals who restrict themselves from travel while ill (Infectious_s_nt), symptomatic individuals who undergo theantiviral treatment (Infectious_AVT). A susceptible individual interacting with an infectious person may contract the illness with rate beta andenter the latent compartment where he/she is infected but not yet infectious. The infection rate is rescaled by a factor ra in case ofasymptomatic infection [41,46], and by a factor rAVT in case of a treated infection. At the end of the latency period, of average duration equal toeps-1, each latent individual becomes infectious, showing symptoms with probability 1-pa, whereas becoming asymptomatic with probability pa[41,46]. Change in travelling behavior after the onset of symptoms is modeled with probability pt set to 50% that individuals would stoptravelling when ill [41]. Infectious individuals recover permanently after an average infectious period mu -1 equal to 2.5 days. We assume theantiviral treatment regimen to be administered to a 30% fraction (i.e. pAVT = 0.3) of the symptomatic infectious individuals within one day fromthe onset of symptoms, reducing the infectiousness and shortening the infectious period of 1 day. [41,42].
Broeck et al. BMC Infectious Diseases 2011, 11:37http://www.biomedcentral.com/1471-2334/11/37
Page 11 of 14

AV treatment is accounted for in the model by a 62%reduction in the transmissibility of the disease by aninfected person under AV treatment when AV drugs areadministered in a timely fashion [41,42]. We assumethat the drugs are administered within 1 day of theonset of symptoms and that the AV treatment reducesthe infectious period by 1 day [41,42]. The scenario withAV treatment is compared to the baseline case in whichno intervention is considered, i.e. the probability oftreatment is set equal to 0 in all countries.The GLEaMviz simulation results are shown in
Figure 10 where the incidence profiles in two differentregions of the world, North America and Western Eur-ope, are shown for both the baseline case and the inter-vention scenario with AV treatment. The results refer tothe median (solid line) and 95% reference range (shadedarea) obtained from 100 stochastic realizations of eachscenario starting from the same initial conditions. Theresulting incidence profiles of the baseline case peak ataround mid-November and the end of November 2009
in the US and Western Europe, respectively. Theseresults show an anticipated peak of activity for theNorthern Hemisphere with respect to the expected peaktime of seasonal influenza. In order to make a moreaccurate comparison with the surveillance data in theseregions, we should rely on the predictions provided bymodels that can take into account the full spectrum ofstrategies that were put in place during the 2009 H1N1outbreak, viz. the predictions obtained by GLEaM [3].In the case of a rapid and efficient implementation of
the AV treatment protocol at the worldwide level, adelay of about 6 weeks would be obtained in the regionsunder study, a result that could be essential in gainingtime to deploy vaccination campaigns targeting high-riskgroups and essential services. In addition, the GLEaMviztool provides simulated results for the number of AVdrugs used during the evolution of the outbreak. If weassume treatment delivery and successful administrationof the drugs to 30% of the symptomatic cases per day,the number of AV drugs required at the activity peak inWestern Europe would be 4.5 courses per 1,000 persons,and the size of the stockpile needed after the first yearsince the start of the pandemic would be about 18% ofthe population. Again, we assume a homogeneous treat-ment protocol for all countries in the world; results mayvary from country to country depending on the specificevolution of the pandemic at the national level.
ConclusionsComputer-based simulations provide an additionalinstrument for emerging infectious-disease preparednessand control, allowing the exploration of diverse scenar-ios and the evaluation of the impact and efficacy of var-ious intervention strategies. Here we have presented acomputational tool for the simulation of emerging ILIinfectious diseases at the global scale based on a data-driven spatial epidemic and mobility model that offersan innovative solution in terms of flexibility, realism,and computational efficiency, and provides access tosophisticated computational models in teaching/trainingsettings and in the use and exploitation of large-scalesimulations in public health scenario analysis.
Availability and requirementsProject name: GLEaMviz Simulator v2.6Project homepage: http://www.gleamviz.org/simulator/Operating systems (client application): Windows (XP,
Vista, 7), Mac OS X, Linux.Programming language: C++ (GLEaMsim core),
Python (GLEaMproxy, GLEaMsim wrapper), Action-Script (GLEaMviz)Other requirements (client application): Adobe AIR
runtime, at least 200 Mb of free disk space.License: SaaS
Baseline scenario Scenario with AV
Figure 10 Simulated incidence profiles for North America andWestern Europe in the baseline case (left panels) and in theAV treatment scenario (right panels). The plots are extractedfrom the GLEaMviz tool visualization. In the upper plots of each pairthe curves and shaded areas correspond to the median and 95%reference range of 100 stochastic runs, respectively. The lowercurves show the cumulative size of the infection. The dashedvertical line marks the same date for each scenario, clearly showingthe shift in the epidemic spreading due to the AV treatment.
Broeck et al. BMC Infectious Diseases 2011, 11:37http://www.biomedcentral.com/1471-2334/11/37
Page 12 of 14

Any restrictions to use by non-academics: None.The server application can be requested by public
institutions and research centers; conditions of use andpossible restrictions will be evaluated specifically.
Additional material
Additional file 1: The GLEaMviz computational tool: Additional File.This file includes information for installing the GLEaMviz Client anddetails of the features of its various components.
AcknowledgementsWe are grateful to the International Air Transport Association for making theairline commercial flight database available to us. This work has beenpartially funded by the NIH R21-DA024259 award, the Lilly Endowmentgrant 2008 1639-000 and the DTRA-1-0910039 award to AV; the EC-ICTcontract no. 231807 (EPIWORK) to AV, VC, and WVdB; the EC-FET contractno. 233847 (DYNANETS) to AV and VC; the ERC Ideas contract n.ERC-2007-Stg204863 (EPIFOR) to VC, CG, and MQ.
Author details1Computational Epidemiology Laboratory, Institute for Scientific Interchange(ISI), Turin, Italy. 2Center for Complex Networks and Systems Research, Schoolof Informatics and Computing, Indiana University, Bloomington, IN 47408,USA. 3Pervasive Technology Institute, Indiana University, Bloomington, IN47404, USA. 4Department of Industrial Design, Arts, Communication andFashion (INDACO), Politecnico di Milano, Milan, Italy. 5INSERM, U707, ParisF-75012, France. 6UPMC Université Paris 06, Faculté de Médecine Pierre etMarie Curie, UMR S 707, Paris F75012, France. 7Institute for ScientificInterchange (ISI), Turin, Italy.
Authors’ contributionsCG, WVdB and BG designed the software architecture. WVdB and MQdeveloped the client application. BG implemented the GLEaM engine. CGdeveloped the proxy middleware. CG, VWdB, VC and AV drafted themanuscript. MQ and BG helped draft the manuscript. AV and VC conceivedand coordinated the software project, designed and coordinated theapplication study. All authors read and approved the final manuscript.
Competing interestsAV is consulting and has a research agreement with Abbott for themodeling of H1N1 diffusion. The other authors have declared that nocompeting interests exist.
Received: 9 September 2010 Accepted: 2 February 2011Published: 2 February 2011
References1. Yang Y, Sugimoto JD, Halloran ME, Basta NE, Chao DL, Matrajt L, Potter G,
Kenah E, Longini IM Jr: The transmissibility and control of pandemicinfluenza A (H1N1) virus. Science 2009, 362:729.
2. Flahault A, Vergu E, Boelle P-Y: Potential for a global dynamic of influenzaA (H1N1). BMC Infect Dis 2009, 9:129.
3. Balcan D, Hu H, Goncalves B, Bajardi P, Poletto C, Ramasco JJ, Paolotti D,Perra N, Tizzoni M, Van den Broeck W, Colizza V, Vespignani A: Seasonaltransmission potential and activity peaks of the new influenza A(H1N1):a Monte Carlo likelihood analysis based on human mobility. BMCMedicine 2009, 7:45.
4. Eubank S, Guclu H, Anil Kumar VS, Marathe MV, Srinivasan A, Toroczkai Z,Wang N: Modelling disease outbreaks in realistic urban social networks.Nature 2004, 429:180-184.
5. Bisset KR, Chen J, Feng X, Kumar VSA, Marathe MV: EpiFast: a fastalgorithm for large scale realistic epidemic simulations on distributedmemory systems. Proceedings of the 23rd international conference onSupercomputing, 2009, Yorktown Heights, NY, USA; 2009, 430-439.
6. Balcan D, Colizza V, Goncalves B, Hu H, Ramasco JJ, Vespignani A:Multiscale mobility networks and the spatial spreading of infectiousdiseases. Proc Natl Acad Sci USA 2009, 106:21484.
7. Ferguson NM, Cummings DA, Cauchemez S, Fraser C, Riley S, Meeyai A,Iamsirithaworn S, Burke DS: Strategies for containing an emerginginfluenza pandemic in Southeast Asia. Nature 2005, 437:209-214.
8. Germann TC, Kadau K, Longini IM, Macken CA: Mitigation strategies forpandemic influenza in the United States. Proc Natl Acad Sci USA 2006,103:5935-5940.
9. Ciofi degli Atti ML, Merler S, Rizzo C, Ajelli M, Massari M, Manfredi P,Furlanello C, Scalia Tomba G, Iannelli M: Mitigation Measures forPandemic Influenza in Italy: An Individual Based Model ConsideringDifferent Scenarios. PLoS ONE 2008, 3(3):e1790.
10. Chao DL, Halloran ME, Obenchain VJ, Longini IM Jr: 2010 FluTE, a PubliclyAvailable Stochastic Influenza Epidemic Simulation Model. PLoS ComputBiol 6(1):e1000656.
11. Eichner M, Schwehm M, Duerr HP, Brockmann SO: The influenza pandemicpreparedness planning tool InfluSim. BMC Inf Dis 2007, 7:17.
12. Ford DA, Kaufman J, Eiron I: An extensible spatial and temporalepidemiological modelling system. Int J Health Geographics 2006, 5:4.
13. Community Flu 1.0, Centers for Disease Control and Prevention (CDC),[http://www.cdc.gov/flu/tools/communityflu/].
14. Balcan D, Goncalves B, Hu H, Ramasco JJ, Colizza V, Vespignani A: Modelingthe spatial spread of infectious diseases: The GLobal Epidemic andMobility computational model. Journal of Computational Science 2010.
15. FluSurge 2.0, Centers for Disease Control and Prevention (CDC),[http://www.cdc.gov/flu/tools/flusurge/].
16. Epstein JM, Goedecke DM, Yu F, Morris RJ, Wagener DK, Bobashev GV:Controlling pandemic flu: The value of international air travelrestrictions. PLoS ONE 2007, 2:e401.
17. Rvachev LA, Longini IM: A mathematical model for the global spread ofinfluenza. Math Biosci 1985, 75:3-22.
18. Grais RF, Hugh Ellis J, Glass GE: Assessing the impact of airline travel onthe geographic spread of pandemic influenza. Eur J Epidemiol 2003,18:1065-1072.
19. Hufnagel L, Brockmann D, Geisel T: Forecast and control of epidemics in aglobalized world. Proc Natl Acad Sci USA 2004, 101:15124-15129.
20. Cooper BS, Pitman RJ, Edmunds WJ, Gay NJ: Delaying the internationalspread of pandemic influenza. PloS Medicine 2006, 3:e12.
21. Colizza V, Barrat A, Barthélemy M, Valleron A-J, Vespignani A: Modeling theWorldwide spread of pandemic influenza: baseline case andcontainment interventions. PloS Medicine 2007, 4:e13.
22. Colizza V, Barrat A, Barthelemy M, Vespignani A: Predictability andepidemic pathways in global outbreaks of infectious diseases: the SARScase study. BMC Medicine 2007, 5:34.
23. Socioeconomic Data and Applications Center (SEDAC). ColumbiaUniversity; [http://sedac.ciesin.columbia.edu/gpw].
24. International Air Transport Association. [http://www.iata.org].25. Official Airline Guide. [http://www.oag.com].26. Barrat A, Barthelemy M, Pastor-Satorras R, Vespignani A: The architecture of
complex weighted networks. Proc Natl Acad Sci (USA) 2004, 101:3747-3752.27. Keeling MJ, Rohani P: Estimating spatial coupling in epidemiological
systems: a mechanistic approach. Ecology Letters 2002, 5:20-29.28. Sattenspiel L, Dietz K: A structured epidemic model incorporating
geographic mobility among regions. Math Biosci 1995, 128:71-91.29. Anderson RM, May RM: Infectious Diseases in Humans Oxford University
Press; 1992.30. Colizza V, Barrat A, Barthélemy M, Vespignani A: The role of airline
transportation network in the prediction and predictability of globalepidemics. Proc Natl Acad Sci (USA) 2006, 103:2015-2020.
31. Colizza V, Barrat A, Barthélemy M, Vespignani A: The modeling of globalepidemics: Stochastic dynamics and predictability. Bull Math Bio 2006,68:1893-1921.
32. Bajardi P, Poletto C, Balcan D, Hu H, Goncalves B, Ramasco JJ, Paolotti D,Perra N, Tizzoni M, Van den Broeck W, Colizza V, Vespignani A: Modelingvaccination campaigns and the Fall/Winter 2009 activity of the new A(H1N1) influenza in the Northern Hemisphere. Emerging Health ThreatsJournal 2009, 2:e11.
33. Python programming language. [http://www.python.org].34. Twisted Matrix networking engine. [http://twistedmatrix.com/].35. Adobe AIR runtime environment. [http://www.adobe.com/products/air].
Broeck et al. BMC Infectious Diseases 2011, 11:37http://www.biomedcentral.com/1471-2334/11/37
Page 13 of 14

36. Adobe Flex framework. [http://www.adobe.com/products/flex].37. Balcan D, Colizza V, Singer AC, Chouaid C, Hu H, Goncalves B, Bajardi P,
Poletto C, Ramasco JJ, Perra N, Tizzoni M, Paolotti D, Van den Broeck W,Valleron AJ, Vespignani A: Modeling the critical care demand andantibiotics resources needed during the Fall 2009 wave of influenza A(H1N1) pandemic. PLoS Currents: Influenza 2009, Dic 4:RRN1133.
38. World Health Organization: Pandemic preparedness. [http://www.who.int/csr/disease/influenza/pandemic/en/].
39. Arinaminpathy N, McLean AR: Antiviral treatment for the control ofpandemic influenza: some logistical constraints. J R Soc Interface 2008,5:545-553.
40. Wu JT, Leung GM, Lipsitch M, Cooper BS, Riley S: Hedging against AntiviralResistance during the Next Influenza Pandemic Using Small Stockpilesof an Alternative Chemotherapy. PLoS Med 2009, 6(5):e1000085.
41. Longini IM, Halloran ME, Nizam A, Yang Y: Containing pandemic influenzawith antiviral agents. American Journal of Epidemiology 2004, 159:623-633.
42. Longini IM, Nizam A, Xu S, Ungchusak K, Hanshaoworakul W,Cummings DAT, Halloran ME: Containing pandemic influenza at thesource. Science 2005, 309:1083-1087.
43. Gani R, Hughes H, Fleming D, Griffin T, Medlock J, Leach S: Potentialimpact of antiviral drug use during influenza pandemic. Emerg Infect Dis2005, 11:1355-1362.
44. Cruz-Pacheco G, Duran L, Esteva L, Minzoni A, Lopez-Cervantes M,Panayotaros P, Ahued Ortega A, Villasenor Ruiz I: Modelling of theinfluenza A(H1N1)v outbreak in Mexico City, April-May 2009, withcontrol sanitary measures. Euro Surveill 2009, 14:19254.
45. Boletín Mensual de Estadística Operacional. Secretaría decomunicaciones y transportes. 2009 [http://www.sct.gob.mx/uploads/media/BO_DICIEMBRE_09.pdf].
46. Fraser C, Donnelly CA, Cauchemez S, Hanage WP, Van Kerkhove MD,Hollingsworth TD, Griffin J, Baggaley RF, Jenkins HE, Lyons EJ, Jombart T,Hinsley WR, Grassly NC, Balloux F, Ghani AC, Ferguson NM, Rambaut A,Pybus OG, Lopez-Gatell H, Alpuche-Aranda CM, Bojorquez Chapela I,Palacios Zavala E, Espejo Guevara DM, Checchi F, Garcia E, Hugonnet S,Roth C, The WHO Rapid Pandemic Assessment Collaboration: Pandemicpotential of a strain of influenza A(H1N1): early findings. Science 2009,324:1557-1561.
Pre-publication historyThe pre-publication history for this paper can be accessed here:http://www.biomedcentral.com/1471-2334/11/37/prepub
doi:10.1186/1471-2334-11-37Cite this article as: Broeck et al.: The GLEaMviz computational tool, apublicly available software to explore realistic epidemic spreadingscenarios at the global scale. BMC Infectious Diseases 2011 11:37.
Submit your next manuscript to BioMed Centraland take full advantage of:
• Convenient online submission
• Thorough peer review
• No space constraints or color figure charges
• Immediate publication on acceptance
• Inclusion in PubMed, CAS, Scopus and Google Scholar
• Research which is freely available for redistribution
Submit your manuscript at www.biomedcentral.com/submit
Broeck et al. BMC Infectious Diseases 2011, 11:37http://www.biomedcentral.com/1471-2334/11/37
Page 14 of 14