Embed Size (px)
Citation preview
ORNL is managed by UT-Battelle
for the US Department of Energy
AutoBEM: Automatic Detection and Creation of Individual Building Energy Models for Each Building in an Area of Interest
II International Energy & Environment
Summit - 2017
Theme: The Future of Energy & Emerging
Technologies
Presented by:
Joshua New, Ph.D., C.E.M.
BTRIC, Software Tools & Models
Oak Ridge National Laboratory
Oak Ridge, Tennessee, USA
November 20, 2017
2 Building Technologies Office
Joshua New, Ph.D., C.E.M.
• Career
– 2009+ Oak Ridge National Laboratory, R&D staff
• ETSD, Building Technology Research & Integration Center (BTRIC),
Building Envelope & Urban Systems Research Group (BEUSR)
– 2012+ The University of Tennessee, Joint Faculty
• Education
– The University of TN, (2004-2009), Knoxville; Ph.D. Comp. Sci.
– Jacksonville State University, AL (1997-2001, 2001-2004)
M.S. Systems&Software Design, double-B.S. Computer Science
and Mathematics, Physics minor.
• Professional Involvement
– IEEE, Senior Member
– ASHRAE, defines international building codes
• TC1.5, Computer Applications, Voting member and officer
• TC4.7, Energy Calculations, Voting member and officer
• TC4.2, Climatic Information, Voting member and officer
• SSPC169, Weather Data for Building Design Standards
(24% of page count of building code), Voting member
• SSPC140 and ASHRAE Guideline 14 involvement
3
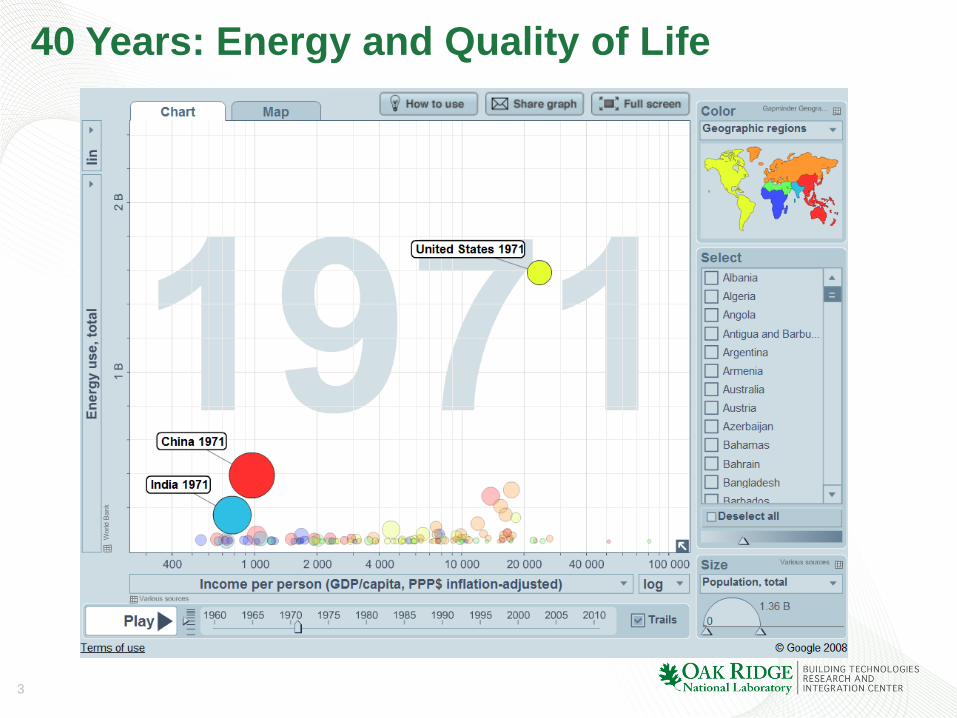
40 Years: Energy and Quality of Life
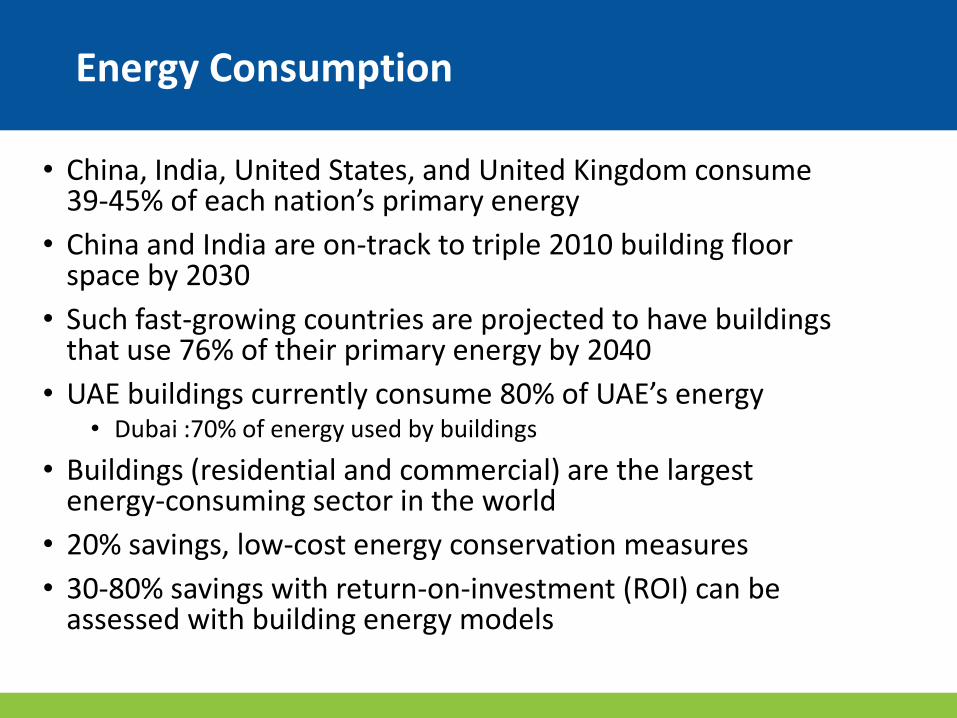
Energy Consumption
• China, India, United States, and United Kingdom consume 39-45% of each nation’s primary energy
• China and India are on-track to triple 2010 building floor space by 2030
• Such fast-growing countries are projected to have buildings that use 76% of their primary energy by 2040
• UAE buildings currently consume 80% of UAE’s energy • Dubai :70% of energy used by buildings
• Buildings (residential and commercial) are the largest energy-consuming sector in the world
• 20% savings, low-cost energy conservation measures
• 30-80% savings with return-on-investment (ROI) can be assessed with building energy models
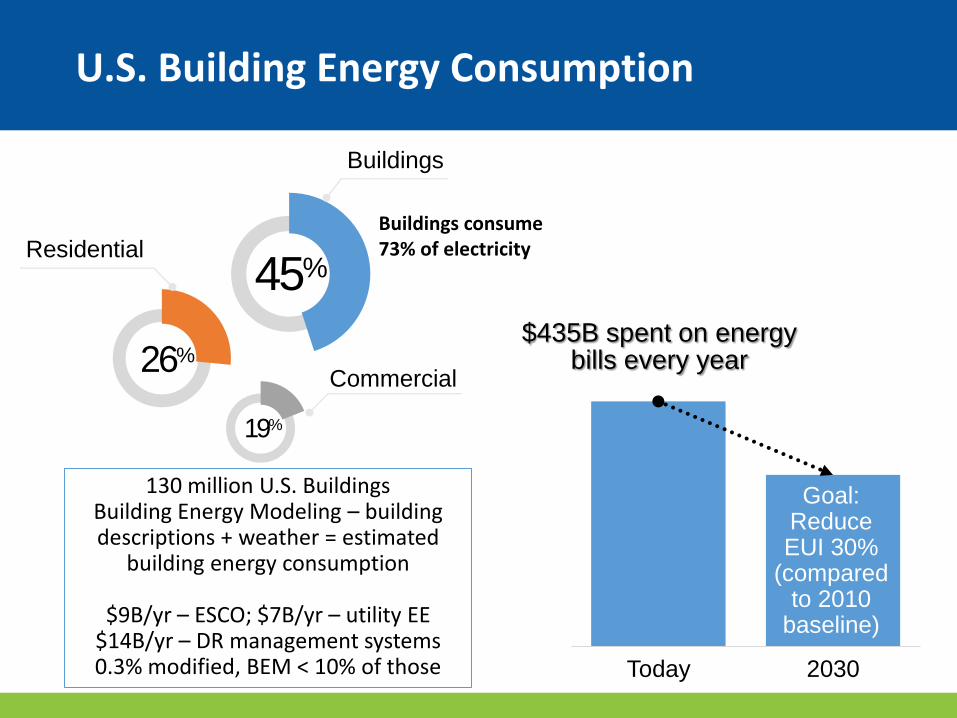
$435B spent on energy bills every year
45%
Buildings
26%
Residential
19%
Commercial
Today 2030
Goal: Reduce EUI 30%
(compared to 2010
baseline)
U.S. Building Energy Consumption
Buildings consume 73% of electricity
130 million U.S. Buildings Building Energy Modeling – building descriptions + weather = estimated
building energy consumption
$9B/yr – ESCO; $7B/yr – utility EE $14B/yr – DR management systems 0.3% modified, BEM < 10% of those
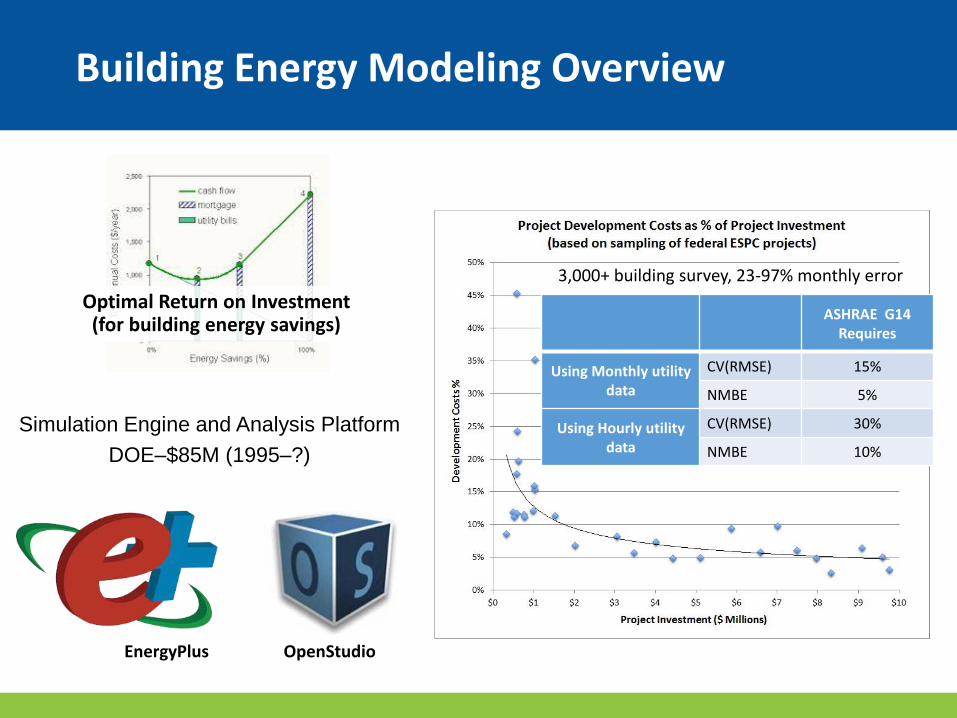
Optimal Return on Investment (for building energy savings)
Simulation Engine and Analysis Platform
DOE–$85M (1995–?)
EnergyPlus OpenStudio
Building Energy Modeling Overview
ASHRAE G14
Requires
Using Monthly utility data
CV(RMSE) 15%
NMBE 5%
Using Hourly utility data
CV(RMSE) 30%
NMBE 10%
3,000+ building survey, 23-97% monthly error
.
.
.
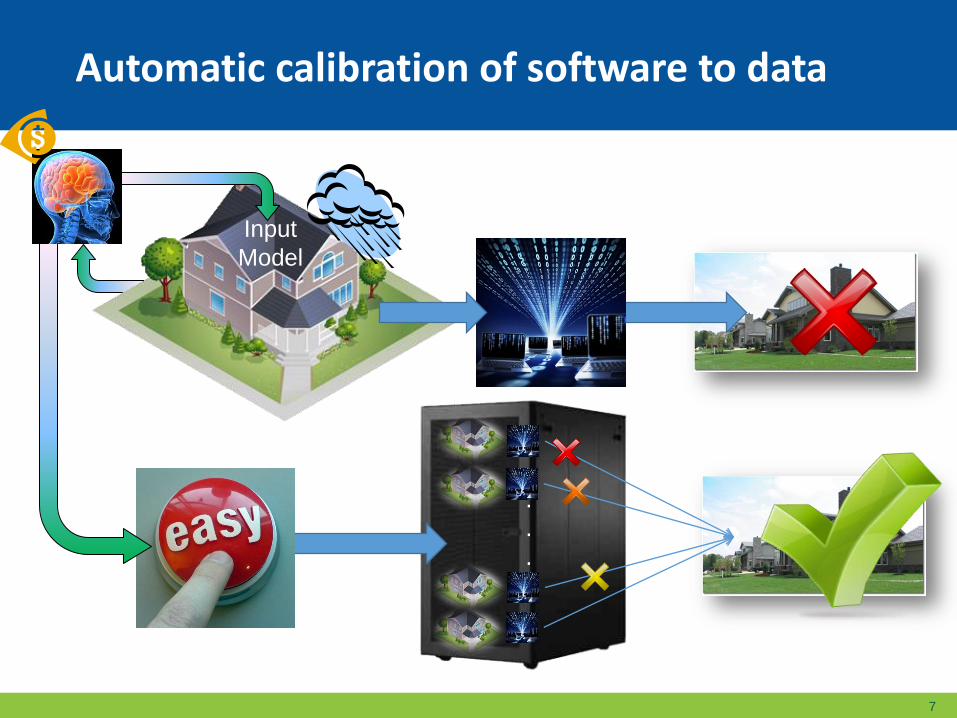
Input
Model
7
Automatic calibration of software to data
8 Building Technologies Office
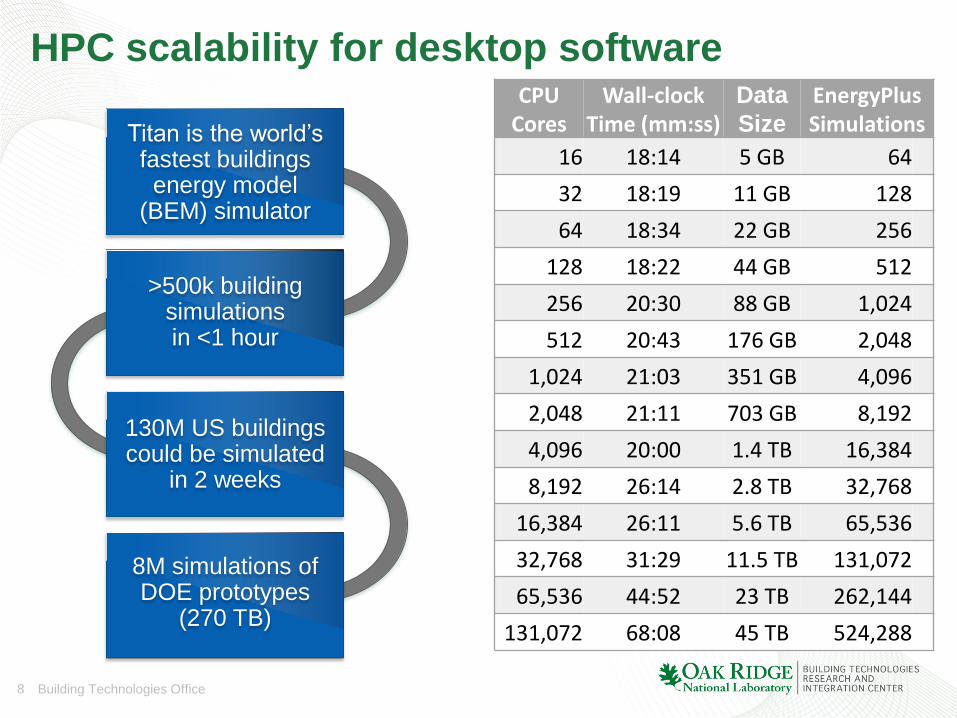
HPC scalability for desktop software CPU
Cores Wall-clock
Time (mm:ss) Data
Size
EnergyPlus Simulations
16 18:14 5 GB 64
32 18:19 11 GB 128
64 18:34 22 GB 256
128 18:22 44 GB 512
256 20:30 88 GB 1,024
512 20:43 176 GB 2,048
1,024 21:03 351 GB 4,096
2,048 21:11 703 GB 8,192
4,096 20:00 1.4 TB 16,384
8,192 26:14 2.8 TB 32,768
16,384 26:11 5.6 TB 65,536
32,768 31:29 11.5 TB 131,072
65,536 44:52 23 TB 262,144
131,072 68:08 45 TB 524,288
Titan is the world’s fastest buildings energy model
(BEM) simulator
>500k building simulations in <1 hour
130M US buildings could be simulated
in 2 weeks
8M simulations of DOE prototypes
(270 TB)
9 Building Technologies Office
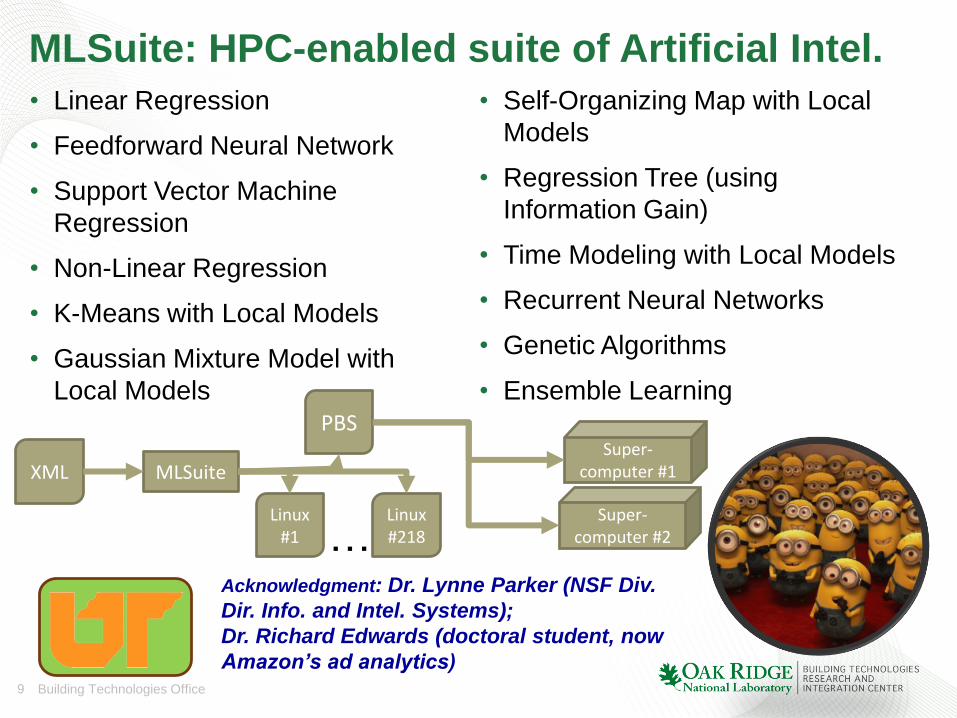
Acknowledgment: Dr. Lynne Parker (NSF Div.
Dir. Info. and Intel. Systems);
Dr. Richard Edwards (doctoral student, now
Amazon’s ad analytics)
MLSuite: HPC-enabled suite of Artificial Intel.
• Linear Regression
• Feedforward Neural Network
• Support Vector Machine
Regression
• Non-Linear Regression
• K-Means with Local Models
• Gaussian Mixture Model with
Local Models
• Self-Organizing Map with Local
Models
• Regression Tree (using
Information Gain)
• Time Modeling with Local Models
• Recurrent Neural Networks
• Genetic Algorithms
• Ensemble Learning
MLSuite XML
PBS
Linux #1
Super-computer #1
Linux #218
Super-computer #2 …
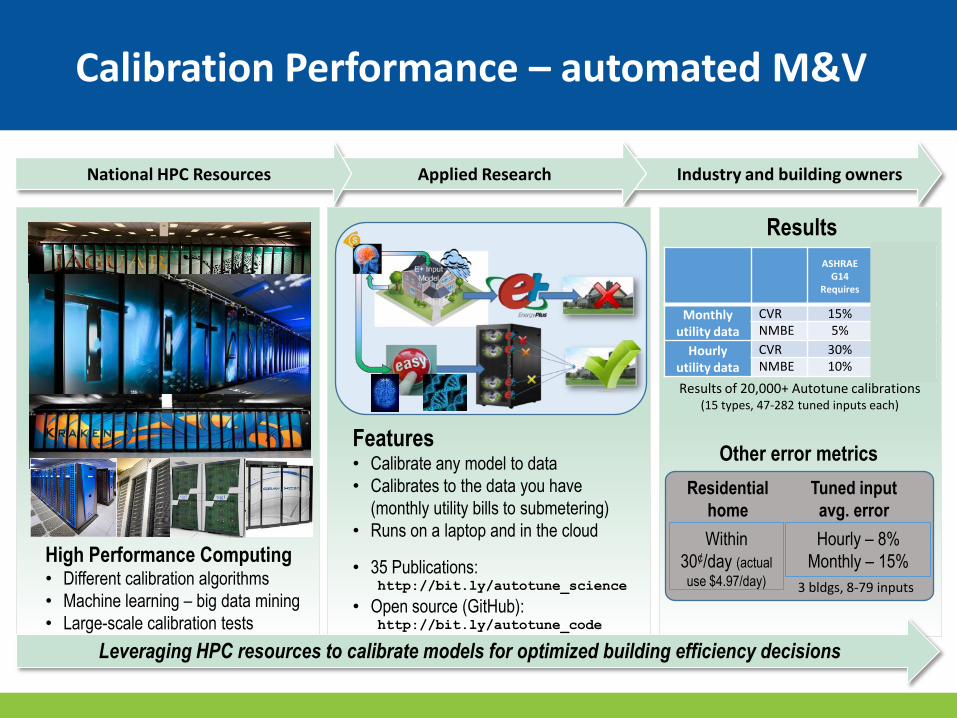
Calibration Performance – automated M&V
Industry and building owners Applied Research National HPC Resources
Leveraging HPC resources to calibrate models for optimized building efficiency decisions
Features • Calibrate any model to data
• Calibrates to the data you have
(monthly utility bills to submetering)
• Runs on a laptop and in the cloud
• 35 Publications: http://bit.ly/autotune_science
• Open source (GitHub): http://bit.ly/autotune_code
Results
Hourly – 8%
Monthly – 15%
Tuned input
avg. error
Within
30¢/day (actual
use $4.97/day)
Residential
home
ASHRAE
G14 Requires
Autotune Results
Monthly utility data
CVR 15% 1.20%
NMBE 5% 0.35%
Hourly utility data
CVR 30% 3.65%
NMBE 10% 0.35%
Results of 20,000+ Autotune calibrations (15 types, 47-282 tuned inputs each)
High Performance Computing • Different calibration algorithms
• Machine learning – big data mining
• Large-scale calibration tests
Other error metrics
3 bldgs, 8-79 inputs
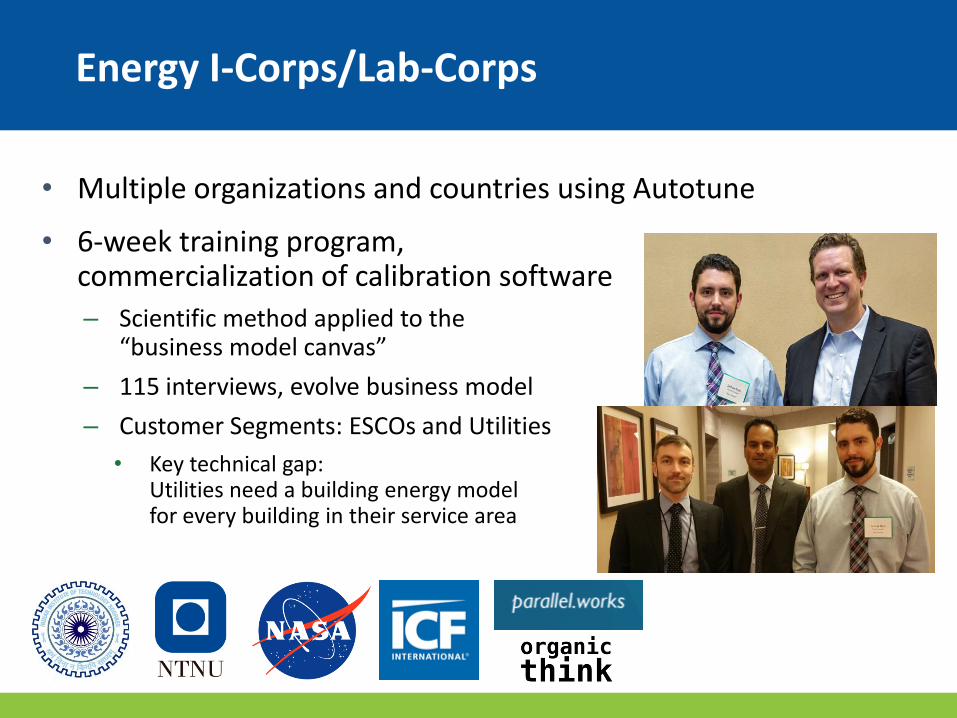
• Multiple organizations and countries using Autotune
• 6-week training program, commercialization of calibration software
– Scientific method applied to the “business model canvas”
– 115 interviews, evolve business model
– Customer Segments: ESCOs and Utilities
• Key technical gap: Utilities need a building energy model for every building in their service area
Energy I-Corps/Lab-Corps
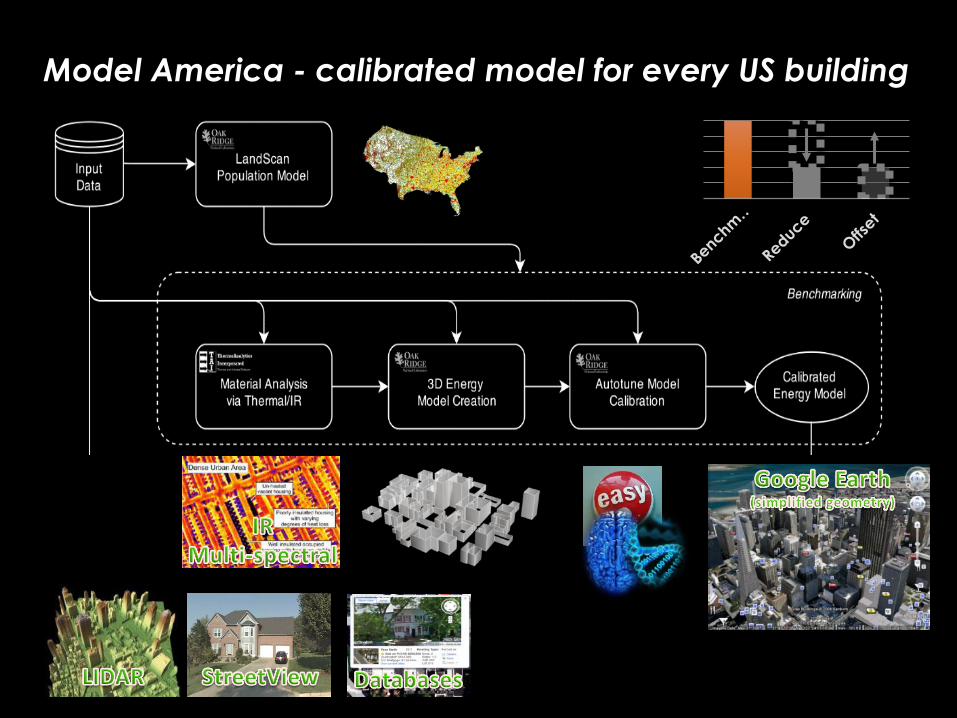
Model America - calibrated model for every US building
Acknowledgements
• U.S. Department of Energy
• National Nuclear Security Administration
• Oak Ridge National Laboratory
• Building Technologies Office
• Office of Electricity
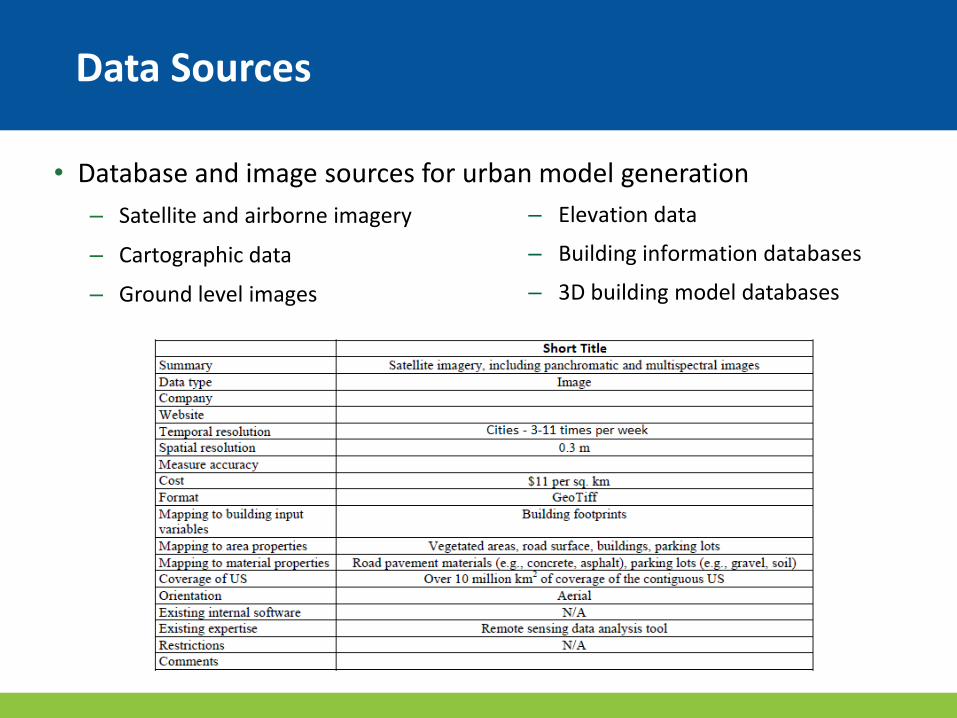
• Database and image sources for urban model generation
– Satellite and airborne imagery
– Cartographic data
– Ground level images
– Elevation data
– Building information databases
– 3D building model databases
Data Sources
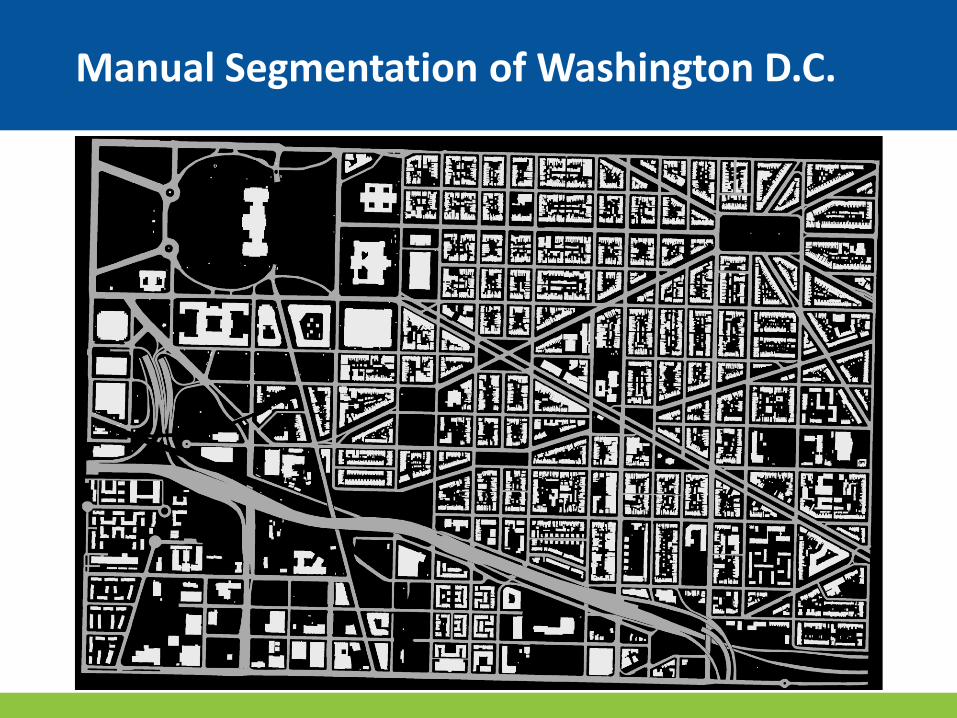
Manual Segmentation of Washington D.C.
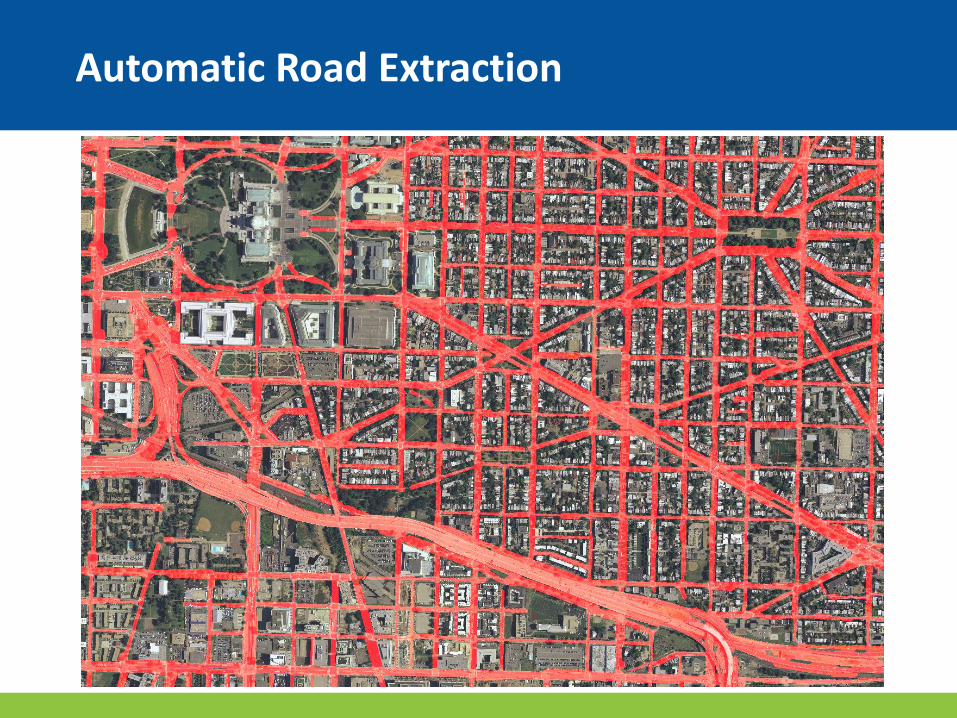
Automatic Road Extraction
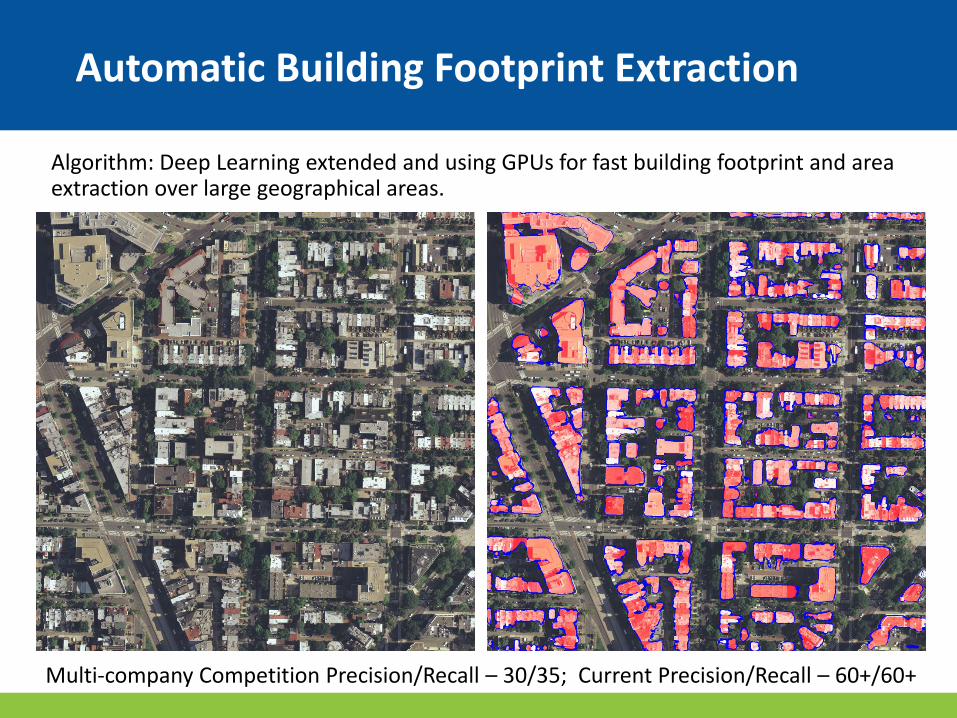
Automatic Building Footprint Extraction
Algorithm: Deep Learning extended and using GPUs for fast building footprint and area extraction over large geographical areas.
Multi-company Competition Precision/Recall – 30/35; Current Precision/Recall – 60+/60+
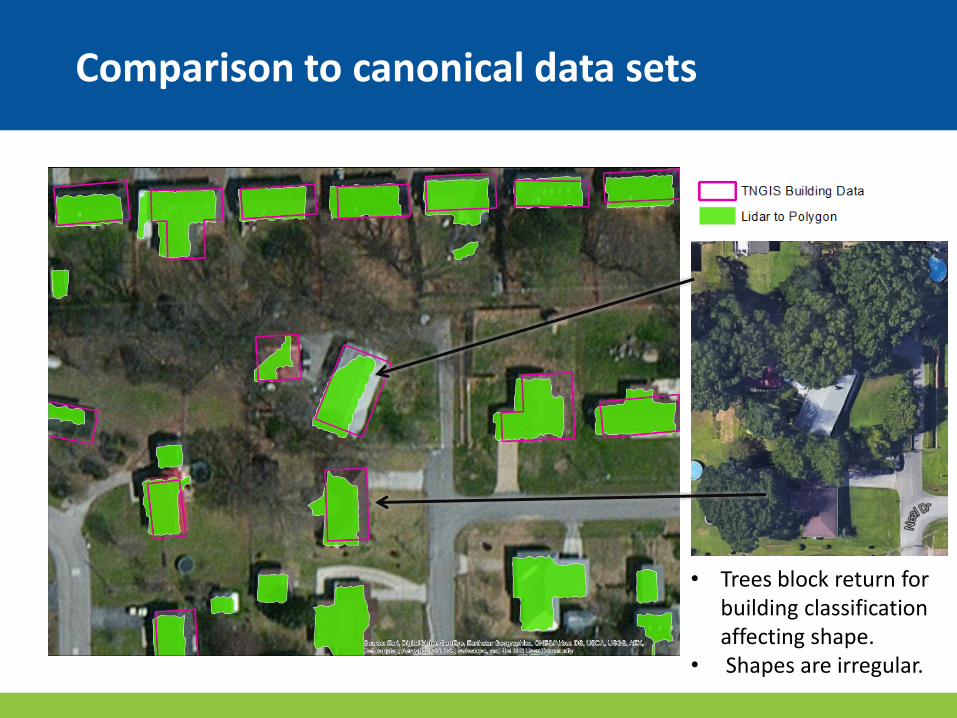
Comparison to canonical data sets
• Trees block return for building classification affecting shape.
• Shapes are irregular.
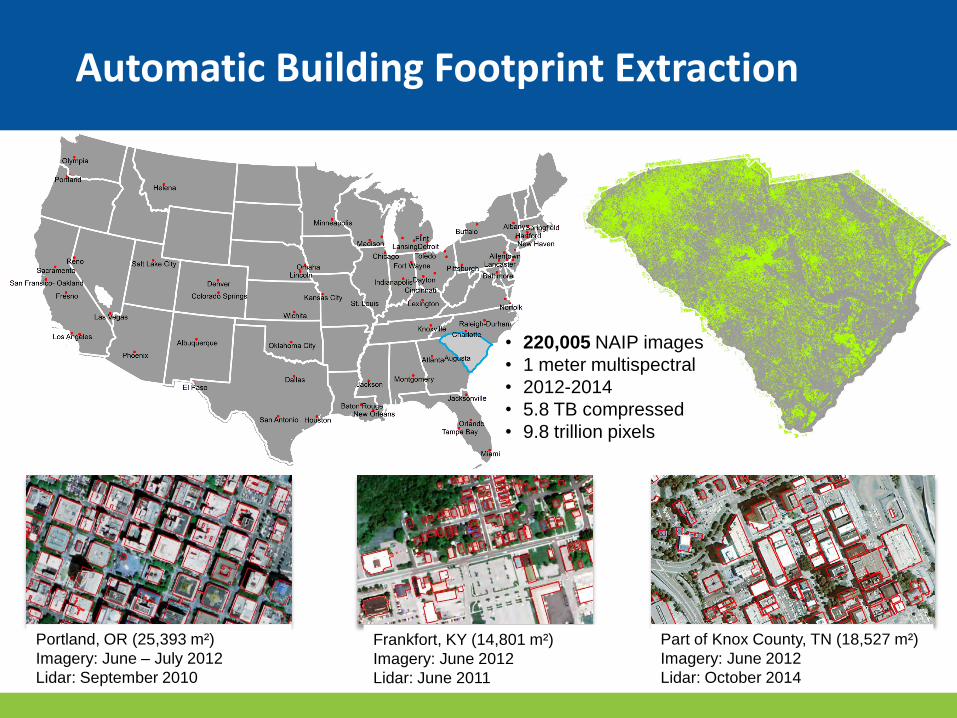
Automatic Building Footprint Extraction
Portland, OR (25,393 m²)
Imagery: June – July 2012
Lidar: September 2010
Part of Knox County, TN (18,527 m²)
Imagery: June 2012
Lidar: October 2014
Frankfort, KY (14,801 m²)
Imagery: June 2012
Lidar: June 2011
• 220,005 NAIP images
• 1 meter multispectral
• 2012-2014
• 5.8 TB compressed
• 9.8 trillion pixels
20
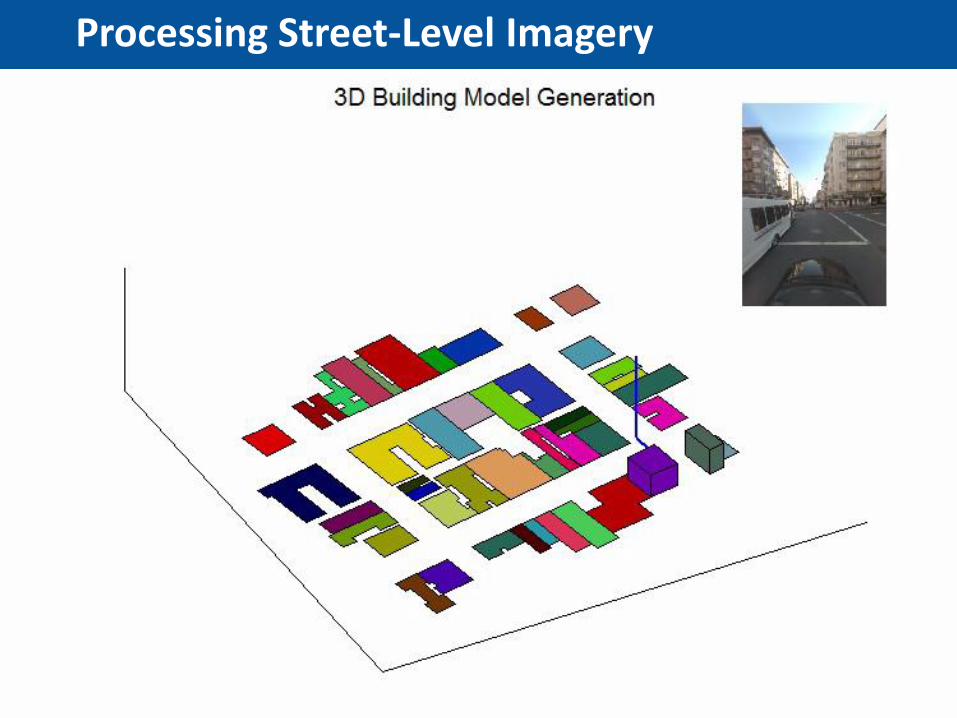
Processing Street-Level Imagery
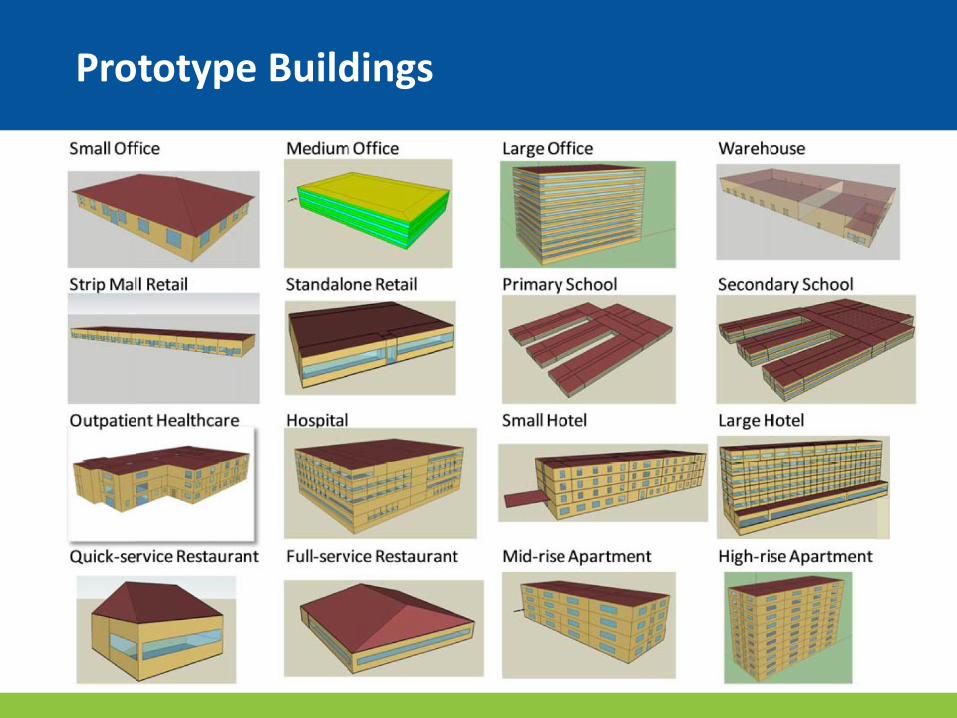
Prototype Buildings
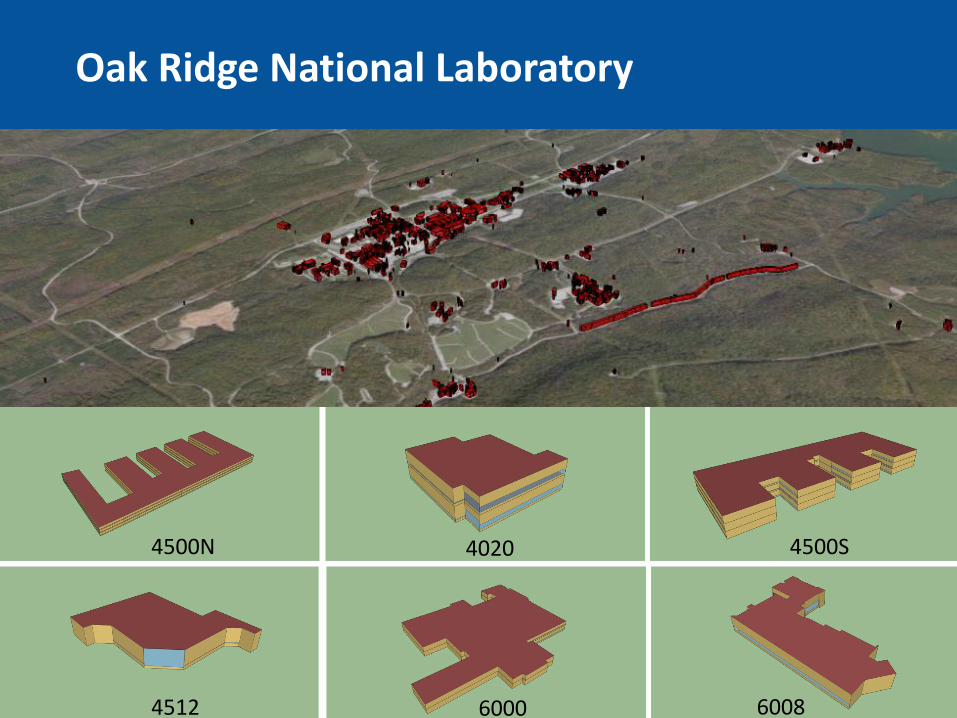
Oak Ridge National Laboratory
4500N 4020 4500S
4512 6000 6008
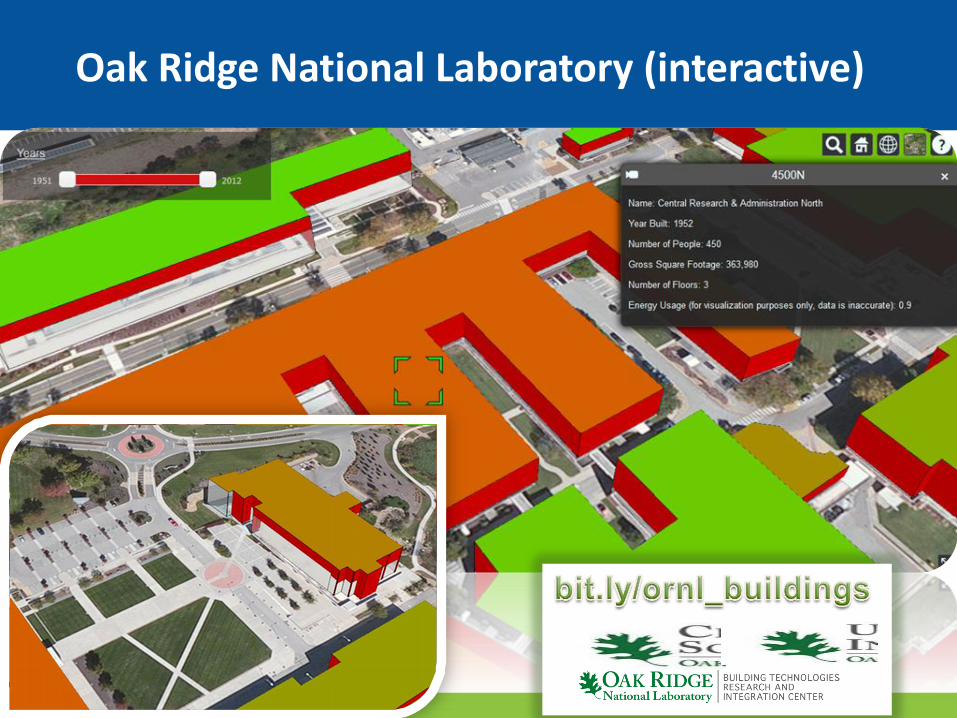
Oak Ridge National Laboratory (interactive)
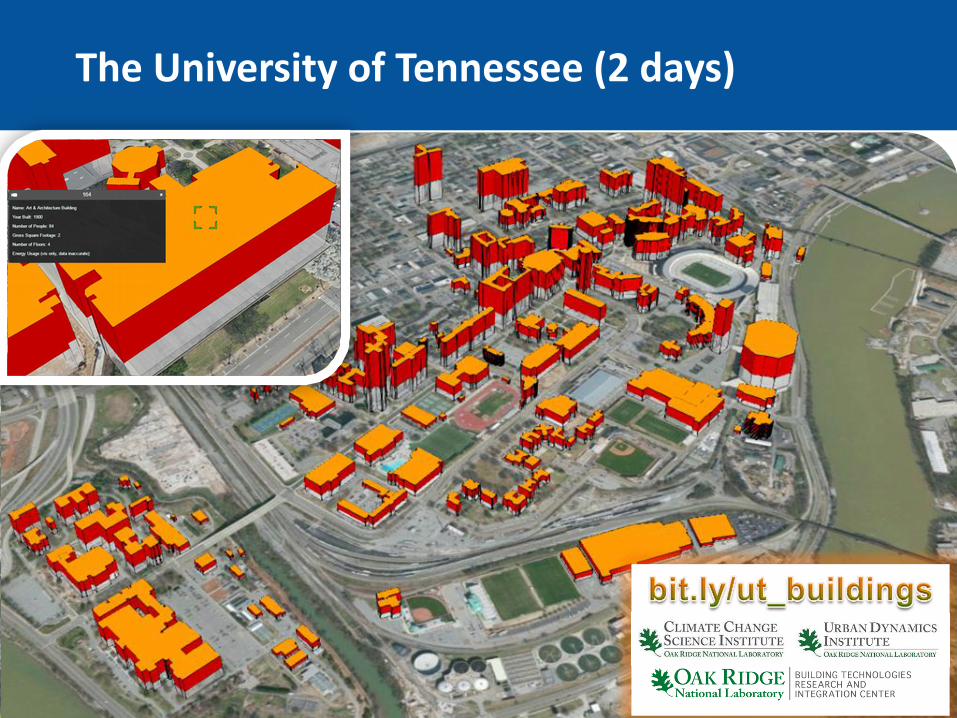
The University of Tennessee (2 days)
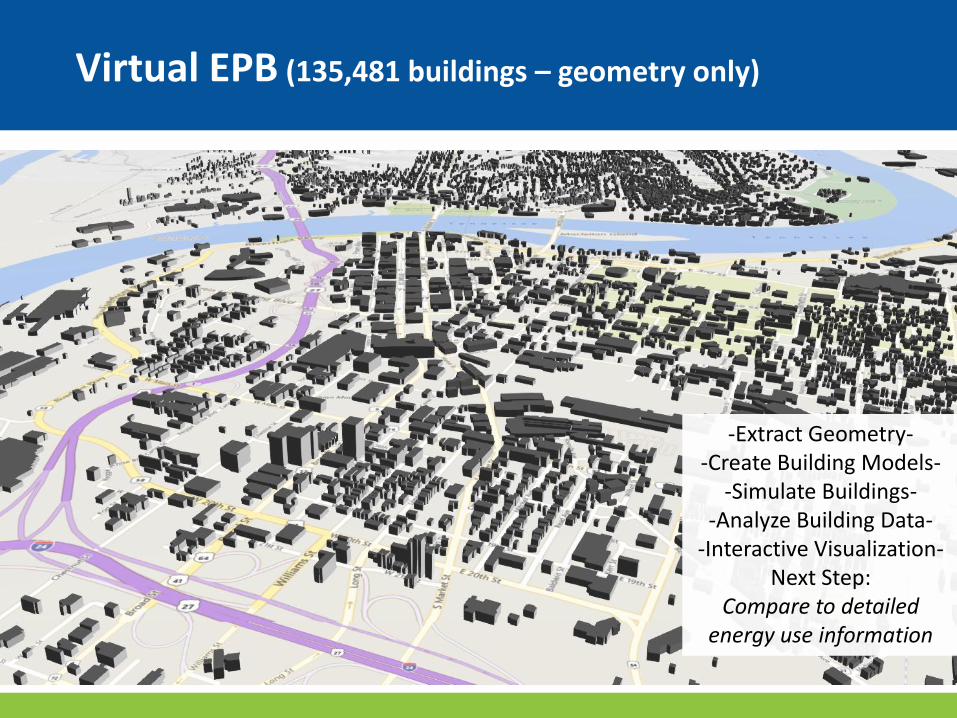
Virtual EPB (135,481 buildings – geometry only)
-Extract Geometry- -Create Building Models-
-Simulate Buildings- -Analyze Building Data-
-Interactive Visualization- Next Step:
Compare to detailed energy use information
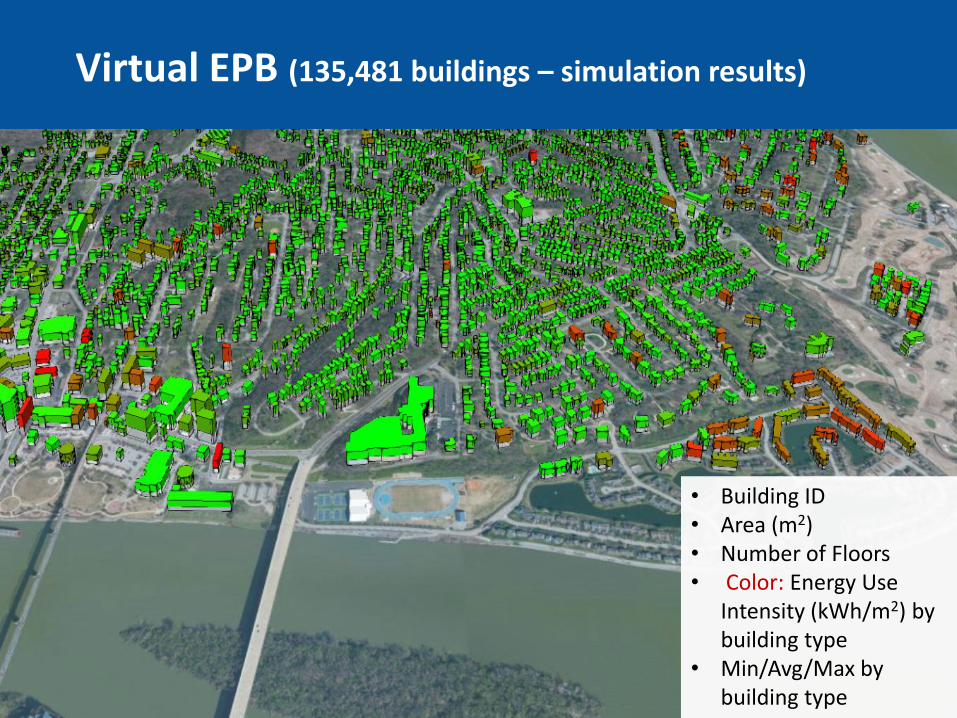
Virtual EPB (135,481 buildings – simulation results)
• Building ID • Area (m2) • Number of Floors • Color: Energy Use
Intensity (kWh/m2) by building type
• Min/Avg/Max by building type
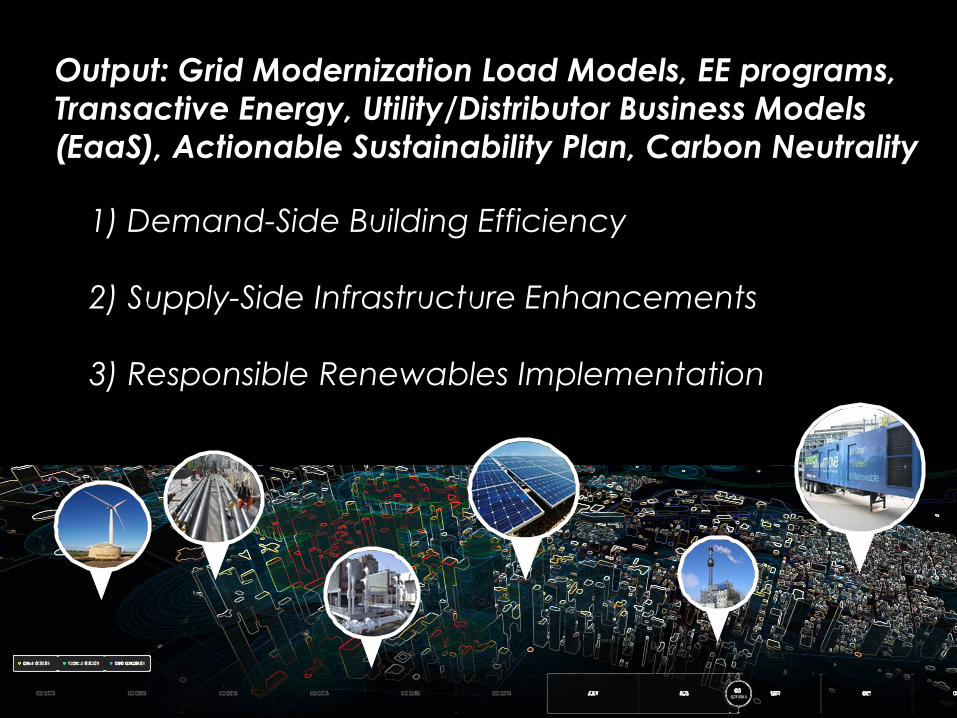
Output: Grid Modernization Load Models, EE programs,
Transactive Energy, Utility/Distributor Business Models
(EaaS), Actionable Sustainability Plan, Carbon Neutrality
1) Demand-Side Building Efficiency
2) Supply-Side Infrastructure Enhancements
3) Responsible Renewables Implementation
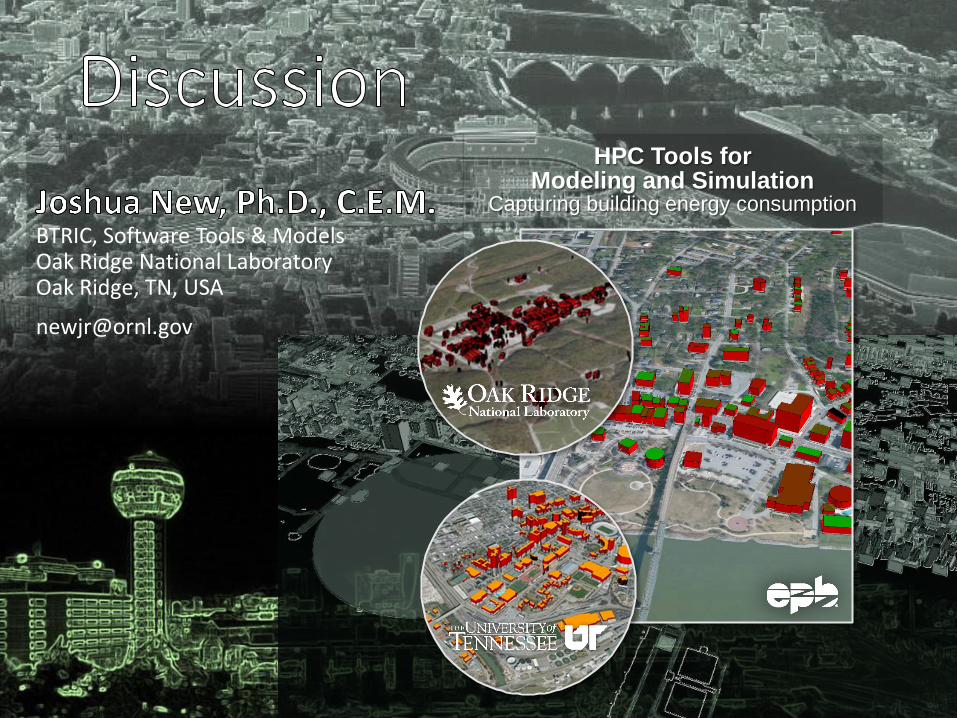
BTRIC, Software Tools & Models Oak Ridge National Laboratory Oak Ridge, TN, USA
HPC Tools for Modeling and Simulation
Capturing building energy consumption