Embed Size (px)
Citation preview

AUTOCORPHOLDING PLC.Opportunity Day Quarter 3/2019November 15, 2019 at Siam Paragon @ Hall 1

11/15/2019 2
DisclaimerThis Presentation (The “Presentation”) has been prepared by Autocorp Holding Public Company Limited. The Presentation is private and confidential and is being made available for information purposes only. Accordingly, this Presentation may not be copied, reproduced or redistributed to any other person save with the prior written permission of the Company. By accepting this presentation, each recipient accepts and agrees with the Company that it will comply with, and that it will procure that any other person to whom it provides this Presentation complies with, the Terms set out here in and all applicable laws and regulations.

11/15/2019 3
Content
1. About us2. Industry Landscape3. Performance/Financial Information4. Business updates

11/15/2019 4
About us - OverviewAutocorp Holding Public Company Limited “(ACG)” is a holding company, involving in automobile industry including sales and services
and other related business. Currently, ACG holds the shares of Honda Maliwan Company Limited ("Core Company" or "Subsidiary Company"). Honda Maliwan is a dealer and service center of Honda.
01. Car and Auto Part 02. Maintenance & Repair 03. Car Leasing and Insurance Services
04. After Sales Service
1. Eco car Group(1300 cc) >> Brio Amaze
2. Sub compact Group (1300–1500 cc) >> City and Jazz
3. Compact Group (1600-1800 cc) >> Civic
4. Sedan Group (2000-2300 cc) >> Accord
5. SUV Group HR-V CR-V BR-V
6. MPV Group Mobilio

11/15/2019 5
Company StructureMajor Shareholders Rangkakulnuwat’s Family 74% Other 26%
99.74%
Major Shareholders Autocorp Holding PLC. 99.74% Rangkakulnuwat’s Family
0.26%
Surin- Surin- Weerawatyothin
Buriram- Buriram- Nangrong
Khonkaen- Head Office- Prachasamoson
Phuket- Phuket- Naka
Krabi- Krabi- Mueang Krabi
Mr. Phanumast RungkakulnuwatMrs. Hathairat RangkagoonnuwatMrs.Vilawan RangkakulnuwatMs.Sukulaya UahwatanasakulPhillip Life Assurance Plc.Other
45.14%
24.49%23.45%
3.70%2.30% 0.92%
Buriram
Khonkaen
Surin
PhuketKrabi

11/15/2019 6
Showroom and service center
Branch Location Since Showroom Area
Service center Area
Surin Phattamanon Road, Surin 1992 525 3,260
Buriram Buriram-Nangrong Road, Buriram 1994 650 1,820
Nangrong Chokchai-Dech udom Road, Buriram 2012 625 1,400
Prachasamosorn Prachasamosorm Road, Khon Kaen 2014 370 360
HO (Maliwan) Maliwan Road, Khon Kaen 2016 2,400 8,200
Weerawat Yothin Nok Mueang Sub-District, Surin 2017 240 None
Phuket Thep krasattri Road, Phuket 2018 316 312
Naka Jaofatawantok Road, Phuket 2018 920 1,840
KrabiUtarakit Road, Krabi 2019 240 570
Petch Kasem Road, Krabi EstimateQ1’2020 1,000 1,600
Totally 10 branches in 2 regions
Note* Krabi Branch is opened showroom and service center on 4 January 2019. Moreover, the company opened service center in a new branch at Krabi under the name “Mueang Krabi Branch” on 5 October 2019. However, the company estimated the showroom finished within Q1’2020.

11/15/2019 7
Milestone
12 March 2015The company has shareholder restructuring by established an Autocorp Holding Company Limited as a pure investment company, held by Mr. Phanumast Rungkakulnuwat. And has purchase Honda Maliwan Co., Ltd to subsidiaries.
November 2017The company has a resolution to select a new director totally 8 people which have 4 independent director comprising Mr. Panich Pongpirodom, Mr. Weerachai Ngamdeevilaisak, ML. Winai Kasensri and Prof. Dr. Saranyapong Thaingtam.
28 February 2018A.V. Car (Surin) Co., Ltd., A.V. Buriram Honda Cars Co., Ltd. and Honda Maliwan Co., Ltd. has amalgamation to the new company under the name of "Honda Maliwan Co., Ltd." (Core Company) to operate as a Honda dealer all of 7 branches1 March 2018 the core company has opening a dealer at Phuket.23 March 2018 ACG has increasing in share capital from 25 THB million to THB 222 million by offer to the prior shareholder for more invest in a core company for business expansion.29 March 2018opening a Naka branch in Phuket as a Honda dealer (Showroom and service center No. 8 of ACG)
4 January 2019Opening a Honda dealer, Krabi branch in Krabi (Showroom and service center No. 9 of ACG).27 June 2019Autocorp Holding Public Company Limited, has trade in mai under industrial sector (Automotive) with ACG symbol by initial public offering 156 million share with THB 1.44 per share.
29 August 2019Honda Maliwan Co., Ltd., a subsidiary has increasing in share capital THB 213 million to THB 550 million.
2015 2017 2018 2019
5 October 2019Honda Maliwan Co., Ltd., a subsidiary has opened service center in a new branch in Krabi under the name “Honda Maliwan Mueang Krabi Branch”.

11/15/2019 8
Content
1. About us2. Industry Landscape3. Performance/Financial Information4. Business updates

11/15/2019 9
Industry LandscapeOverview of the automotive market in the past 9 months (January - September 2019) sold 761,847 cars, increase 2.0%, although the cumulative number is still growing but when we seek deeper into the details, we can see signs of declining sales only in September 2019, the market could reach 76,195 cars, decrease 14.1% and considered the 4th consecutive month that sales were down.
Although the overall industry is decreasing but when looking back at the operations of Honda found that everything went according to plan with 97,695 cars increasing 5.1%, while the market share in the passenger car segment over the past 9 months was 24.5%.
Overall Passenger Cars

11/15/2019 10
Content
1. About us2. Industry Landscape3. Performance/Financial Information4. Business updates

11/15/2019 11
Performance/Financial InformationFinancial Highlight
179.02
384.94 374.41
638.41
2017 2018 Q3/2018 Q3/2019
Total Equity Unit: Million Baht
748.7
825.35815.45
822.9
2017 2018 Q3/2018 Q3/2019
Total liabilities Unit: Million Baht
927.72
1,210.29 1,189.86
1,461.31
2017 2018 Q3/2018 Q3/2019
Total assets Unit: Million Baht
Total assetsQ3/19 increased 251.02 MB or 20.74% mainly increased from inventory 259.98 MB and PPE 59.13 MB due to increasing new branch as Krabi branch including preparing stock inventory for model change for City cars.
Total LiabilitiesQ3/19 decreased 2.45 MB or 0.30% mainly decreased from current tax payable due to tax payment for PND.51.
Total equityQ3/19 increased 253.47 MB or 65.85% mainly increased from issue and paid-up share capital and share premium by raising IPO of 156 million shares.

12
Performance/Financial InformationIncome Structure
23%
2018 9M’2019 9M’2018 Changed %
1. Sale from Cars and Accessories
2,078.06 1,940.83 1,487.09 453.74 30.51%
2.Rendering of services and sale from spare parts
260.78 272.34 190.40 81.94 43.04%
3.Commission income 58.50 54.36 41.53 12.83 30.89%
4.Other income 16.01 16.01 11.11 4.90 44.10%
2,413.35 2,283.54 1,730.13 553.41 31.98%
86%
11%
2%1%
2018
Sale from Cars and Accessories
Rendering of services and sale from spare parts
Commission income
Other income
85%
12%
2%
1%
9M’2019
86%
11%2%1%
9M’2018
Performance/Financial Information

11/15/2019 13
Performance/Financial Information
1515.111,847.14
2,413.35
0
500
1000
1500
2000
2500
3000
2016 2017 2018
Total Revenue Net Profit
Financial Highlight

11/15/2019 14
Performance/Financial InformationFinancial Highlight
Total Revenue+31.98%
Total Revenue Q3’2019 increase of sales and services of existing branches the branch expansion in Phuket (Naka branch) and Krabi.
Net Profit+126.50%
Net Profit improved revenue from sale and rendering of services and
other income Moreover, expenses were controlled at slower pace than
revenue growth
1,730.13
2,283.53
17.14
38.83
-
5.00
10.00
15.00
20.00
25.00
30.00
35.00
40.00
45.00
-
500.00
1,000.00
1,500.00
2,000.00
2,500.00
Q3'2018 Q3'2019
Total revenue Net Profit Linear (Net Profit)
11/15/2019 15
Performance/Financial Information
2019 % 2018 Changed Changed % (YoY)
Revenue from sale and rendering of services 2,213.16 96.92% 1,677.49 96.96% 535.67 +31.93%
Commission income 54.36 2.38% 41.53 2.40% 12.83 +30.89%
Other income 16.01 0.70% 11.11 0.64% 4.90 +44.10%
Total revenue 2,283.53 100% 1,730.13 100% 553.40 +31.98%
Revenue from sales Cars and Accessories 1,940.83 87.69% 1,487.09 88.65% 453.74 +84.70%
Revenue from service and sale
spare parts 272.33 12.31% 190.40 11.35% 81.93 +15.29%
Total Revenue from sale and
rendering of services 2,213.16 100.0% 1,677.49 100.0% 535.67 +31.93%
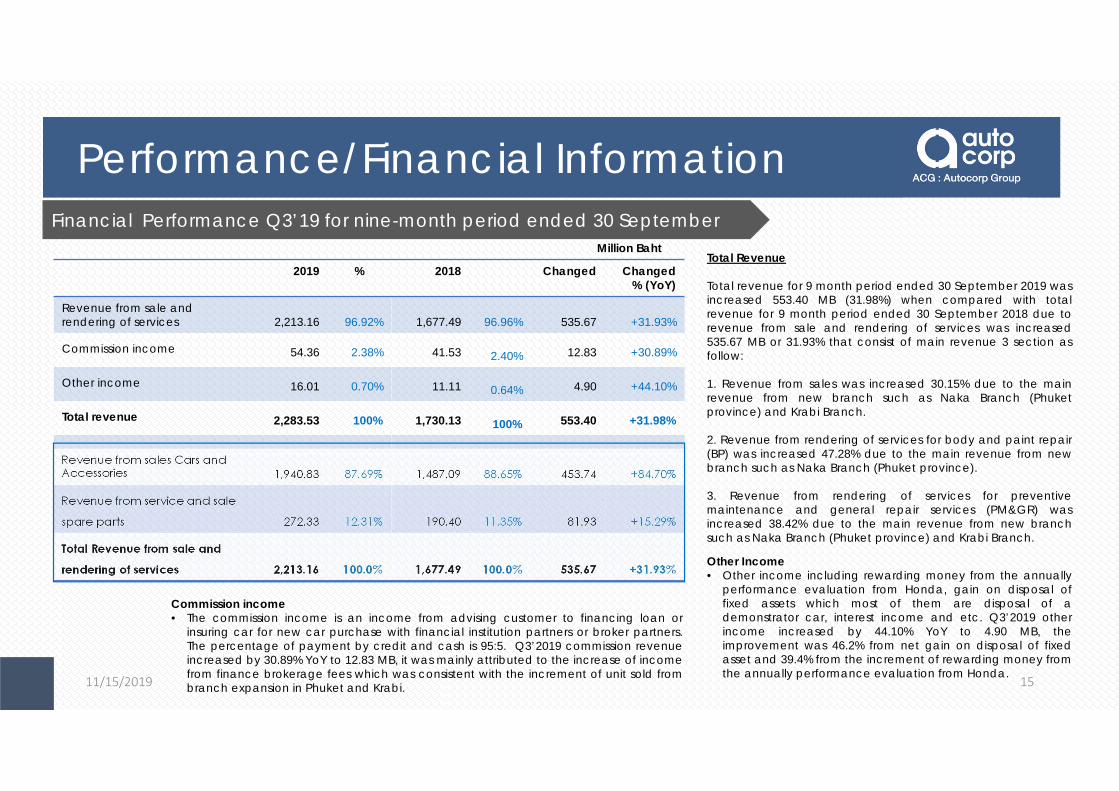
Financial Performance Q3’19 for nine-month period ended 30 September
Total Revenue
Total revenue for 9 month period ended 30 September 2019 was increased 553.40 MB (31.98%) when compared with total revenue for 9 month period ended 30 September 2018 due to revenue from sale and rendering of services was increased 535.67 MB or 31.93% that consist of main revenue 3 section as follow:
1. Revenue from sales was increased 30.15% due to the main revenue from new branch such as Naka Branch (Phuket province) and Krabi Branch.
2. Revenue from rendering of services for body and paint repair (BP) was increased 47.28% due to the main revenue from new branch such as Naka Branch (Phuket province).
3. Revenue from rendering of services for preventive maintenance and general repair services (PM&GR) was increased 38.42% due to the main revenue from new branch such as Naka Branch (Phuket province) and Krabi Branch.
Million Baht
Other Income • Other income including rewarding money from the annually
performance evaluation from Honda, gain on disposal of fixed assets which most of them are disposal of a demonstrator car, interest income and etc. Q3’2019 other income increased by 44.10% YoY to 4.90 MB, the improvement was 46.2% from net gain on disposal of fixed asset and 39.4% from the increment of rewarding money from the annually performance evaluation from Honda.
Commission income• The commission income is an income from advising customer to financing loan or
insuring car for new car purchase with financial institution partners or broker partners. The percentage of payment by credit and cash is 95:5. Q3’2019 commission revenue increased by 30.89% YoY to 12.83 MB, it was mainly attributed to the increase of income from finance brokerage fees which was consistent with the increment of unit sold from branch expansion in Phuket and Krabi.

11/15/2019 16
Performance/Financial Information
Administrative Expense • Q3’19 administrative expense increased by 30.50% YoY to 22.02
MB, it was mainly attributed to the expansion of new branches in Phuket and Krabi as well as the salary structure adjustments in Jan’19. There are many expenses relating to the branch expansion such as rental expense, employee expense, utility expense, depreciation expense and etc. The administrative expense of only new branches was counted as 28.62% of total Q3’19 administrative expense.
Net profit Q319 • Net profit increased by 126.55% YoY to 21.69 MB, the
improvement was driven mainly by an improved revenue from sale and rendering of services and other income.
2019 2018 Changed Changed % (YoY)
Cost of Sales and rendering of services 2,071.48 90.71% 1,549.75 89.57% 521.73 33.67%
Distribution costs 48.05 2.10% 63.71 3.68% (15.66) (24.58%)
Administrative expense 94.21 4.13% 72.19 4.17% 22.02 30.50%
Finance costs 21.07 0.92% 21.50 1.24% (0.43) (2.00%)
Total expenses 2,234.81 97.87% 1,707.15 98.67% 527.66 30.91%
Profit before income tax expense (PBT) 48.72 2.13% 22.98 1.33% 25.74 112.01%
Tax expense 9.89 0.43% 5.84 0.34% 4.05 69.35%
Profit for the period 38.83 1.70% 17.14 0.99% 21.69 126.55%
Earning per share (Baht) 0.08 0.05
Net Profit Margin 1.75% 1.03% 0.72% 69.90%
Financial Performance Q3’19 for nine-month period ended 30 SeptemberMillion Baht

11/15/2019 17
Performance/Financial InformationCompared gross profit after effect TFRS15
After Effect TFRS15
Decreasing in revenue Q3’2018 amounting to 17.75 MB Increasing in cost Q3’2018 amounting to 14.26MB Decreasing in Gross profit margin equal 1.85% Decreasing in Distribution costs amounting 32.01 MB
Q3’2019 Q3’2018 Changed Changed % (YoY)
Revenue from sale and rendering of services 2,213.16 1,677.49 535.67 +31.93%
Cost of Sales and rendering of services 2,071.48 1,549.75
521.73+33.67%
Gross Profit 141.68 127.74 13.94 +10.91%
Gross Profit Margin 6.40% 7.61% (1.21%) -15.90%
After Effect TFRS15
Revenue from sale and rendering of services 2,213.16 1,659.74 553.42 +33.34%
Cost of Sales and rendering of services 2,071.48
1,564.01507.47 +32.45%
Gross Profit 141.68 95.73 45.95 +48.00%
Gross Profit Margin 6.40% 5.76% 0.64% +11.11%
Effect TFRS15 +/(-)(Unit: MB) 9M’2018 9M’2019 Change (THB) Change
(%)
Revenue from sale and rendering of services 17.75 1,659.74 2,213.16 553.42 33.34%Cost of Sales and rendering of services 14.26 1,564.01 2,071.48 507.47 32.45%
Distribution costs (32.01) 31.70 48.11 16.41 51.77%

11/15/2019 18
Performance/Financial InformationFinancial Ratio Q3’2019 Q3’2018 Changed % Note
Current Ratio 0.88 0.64 0.24 37.50% The company's liquidity is quite improved from the IPOs acquired which the future the company has plans to use some funds to reduce the short term loans and convert some of long term loans, which will cause the current ration increase.
D/E Ratio 1.29 2.14 (0.85) 39.72% D/E Ratio is considered to be within the criteria specified by the financial institution which is currently not more than 3
Gross Profit Margin (%) 6.40 5.76 1.41 23.89% The company has higher GP and net margin from increasing commission income that result from income per unit of Finance and Net Profit Margin 1.70 0.99 0.72 69.90%
ROA (%) 2.66 1.42 1.24 87.32% Higher because the company has profits in FY19 to nearly four times in FY18, while total assets increased 20%, resulting in increased ROA.
ROE (%) 6.08 4.45 1.63 36.63% Higher as the company had profits in FY19 more than FY18 126% almost while the shareholders' equity increased 65%, resulting in higher ROE

11/15/2019 19
Performance/Financial Information
0.640.88
2.14
1.29
0.00
0.50
1.00
1.50
2.00
2.50
Q3’2018 Q3’2019
Current Ratio/D/E Ratio
Current Ratio D/E Ratio
Linear (Current Ratio) Linear (D/E Ratio )
5.766.40
1.031.70
0.001.002.003.004.005.006.007.00
Q3’2018 Q3’2019
Gross Profit Margin/Net Profit Margin
Gross Profit Margin (%) Net Profit Margin
Linear (Gross Profit Margin (%)) Linear (Net Profit Margin)
1.42
2.66
4.45
6.08
0.00
1.00
2.00
3.00
4.00
5.00
6.00
7.00
Q3’2018 Q3’2019
ROA/ROE
ROA (%) ROE (%) Linear (ROA (%)) Linear (ROE (%))

11/15/2019 20
Content
1. About us2. Industry Landscape3. Performance/Financial Information4. Business updates

11/15/2019 21
Construction in progress
September
Service Center(GR+BP)
Showroom
October November DecemberFebruary
Start Feb - 30 Sep 19
Start Feb – Dec 19
• Received LOI from HATC in December 2018. • Operated temporary showroom and start recognize income on 4 January 2019.• Prepared Land lease agreement for construct permanent showroom on Pet Kasem Road on December
2018. • Open Permanent Service Center (Mueang Krabi Branch) on 5 October 2019.

11/15/2019 22
Construction in progressShowroom and Service Center - Krabi

11/15/2019 23
Naka Branch