Embed Size (px)
Citation preview
Automakers Are on the Road to Meeting Fuel Efficiency
Standards
An Analysis of Automaker Progress in Meeting 2025 Fuel Efficiency Requirements
and A Look At Consumer Attitudes Towards Fuel Efficiency
Jack Gillis
Stephen Brobeck
Mark Cooper
Consumer Federation of America
April 25, 2016
CFA REPORT: 2016 FUEL ECONOMY PROGRESS AND CONSUMER ATTITUDES
2
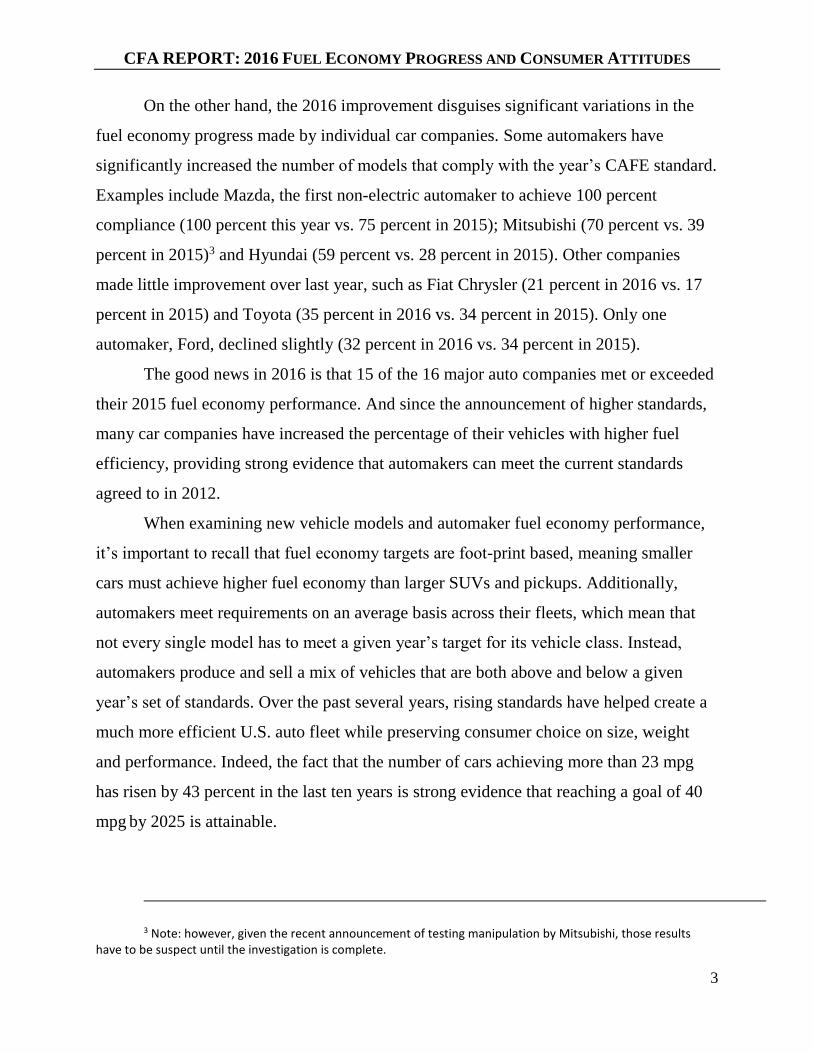
INTRODUCTION
An analysis of current fuel economy across the U.S. fleet shows manufacturers are
successfully complying with – and in some cases, exceeding – Corporate Average Fuel
Economy (CAFE) and related emissions standards. As a result, American consumers now
enjoy the widest-ever range of fuel-efficient options on the market, in every single
vehicle class.
Further to this, new consumer polling shows that Americans continue to place
high value on fuel efficiency when considering future vehicle purchases. They also
support the federal government’s fuel economy standards, which agencies are slated to
revisit this year. According to a new national survey conducted by ORC International for
the Consumer Federation of America, 81 percent of respondents support the federal
standards, with 52 percent expressing strong support. And despite today’s low gas prices,
consumers expect a return to pre-glut, $3.00 per gallon levels in coming years.
The following report includes: 1) a review of fuel economy performance among
the major automakers, 2) a description of recent consumer polling and 3) an appendix of
model-by-model new vehicle fuel economy performance over the past three years.
MANUFACTURERS KEEPING PACE WITH CAFE REQUIREMENTS
According to the Consumer Federation of America’s latest analysis of 1,094 of
this year’s new vehicles, fuel efficiency continues to increase for 2016 on a model-by-
model basis. The percentage of vehicles with an Environmental Protection Agency (EPA)
fuel economy rating of at least 23 miles per gallon increased from 52 percent in 2015 to
percent in 20161. At the same time, the percentage of vehicles with fuel economy at or
below 16 mpg – i.e. the gas-guzzlers – declined from 6.1 percent in 2015 to 4 percent in
2016.2
1 This report examined all vehicle models with an EPA label rating. As of February 2016, that included
1,094 cars. For 2015 there were 1,194 models and for 2014 the total was 1,091. 2 The combined (city/highway) EPA rating was used for our analysis and percentages refer to the entire list
of 1,094 vehicles with EPA fuel economy ratings for 2016. We did not include large passenger vans or exotic vehicles.
CFA REPORT: 2016 FUEL ECONOMY PROGRESS AND CONSUMER ATTITUDES
3
On the other hand, the 2016 improvement disguises significant variations in the
fuel economy progress made by individual car companies. Some automakers have
significantly increased the number of models that comply with the year’s CAFE standard.
Examples include Mazda, the first non-electric automaker to achieve 100 percent
compliance (100 percent this year vs. 75 percent in 2015); Mitsubishi (70 percent vs. 39
percent in 2015)3 and Hyundai (59 percent vs. 28 percent in 2015). Other companies
made little improvement over last year, such as Fiat Chrysler (21 percent in 2016 vs. 17
percent in 2015) and Toyota (35 percent in 2016 vs. 34 percent in 2015). Only one
automaker, Ford, declined slightly (32 percent in 2016 vs. 34 percent in 2015).
The good news in 2016 is that 15 of the 16 major auto companies met or exceeded
their 2015 fuel economy performance. And since the announcement of higher standards,
many car companies have increased the percentage of their vehicles with higher fuel
efficiency, providing strong evidence that automakers can meet the current standards
agreed to in 2012.
When examining new vehicle models and automaker fuel economy performance,
it’s important to recall that fuel economy targets are foot-print based, meaning smaller
cars must achieve higher fuel economy than larger SUVs and pickups. Additionally,
automakers meet requirements on an average basis across their fleets, which mean that
not every single model has to meet a given year’s target for its vehicle class. Instead,
automakers produce and sell a mix of vehicles that are both above and below a given
year’s set of standards. Over the past several years, rising standards have helped create a
much more efficient U.S. auto fleet while preserving consumer choice on size, weight
and performance. Indeed, the fact that the number of cars achieving more than 23 mpg
has risen by 43 percent in the last ten years is strong evidence that reaching a goal of 40
mpg by 2025 is attainable.
3 Note: however, given the recent announcement of testing manipulation by Mitsubishi, those results
have to be suspect until the investigation is complete.
CFA REPORT: 2016 FUEL ECONOMY PROGRESS AND CONSUMER ATTITUDES
4
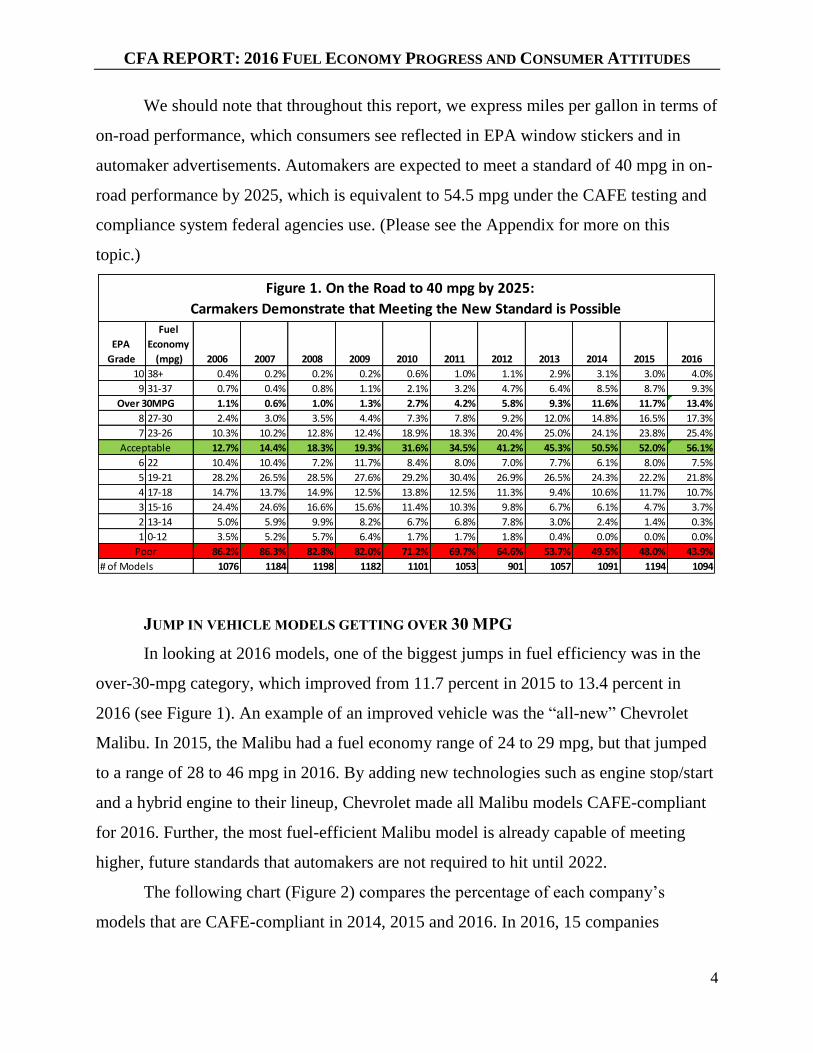
We should note that throughout this report, we express miles per gallon in terms of
on-road performance, which consumers see reflected in EPA window stickers and in
automaker advertisements. Automakers are expected to meet a standard of 40 mpg in on-
road performance by 2025, which is equivalent to 54.5 mpg under the CAFE testing and
compliance system federal agencies use. (Please see the Appendix for more on this
topic.)
JUMP IN VEHICLE MODELS GETTING OVER 30 MPG
In looking at 2016 models, one of the biggest jumps in fuel efficiency was in the
over-30-mpg category, which improved from 11.7 percent in 2015 to 13.4 percent in
2016 (see Figure 1). An example of an improved vehicle was the “all-new” Chevrolet
Malibu. In 2015, the Malibu had a fuel economy range of 24 to 29 mpg, but that jumped
to a range of 28 to 46 mpg in 2016. By adding new technologies such as engine stop/start
and a hybrid engine to their lineup, Chevrolet made all Malibu models CAFE-compliant
for 2016. Further, the most fuel-efficient Malibu model is already capable of meeting
higher, future standards that automakers are not required to hit until 2022.
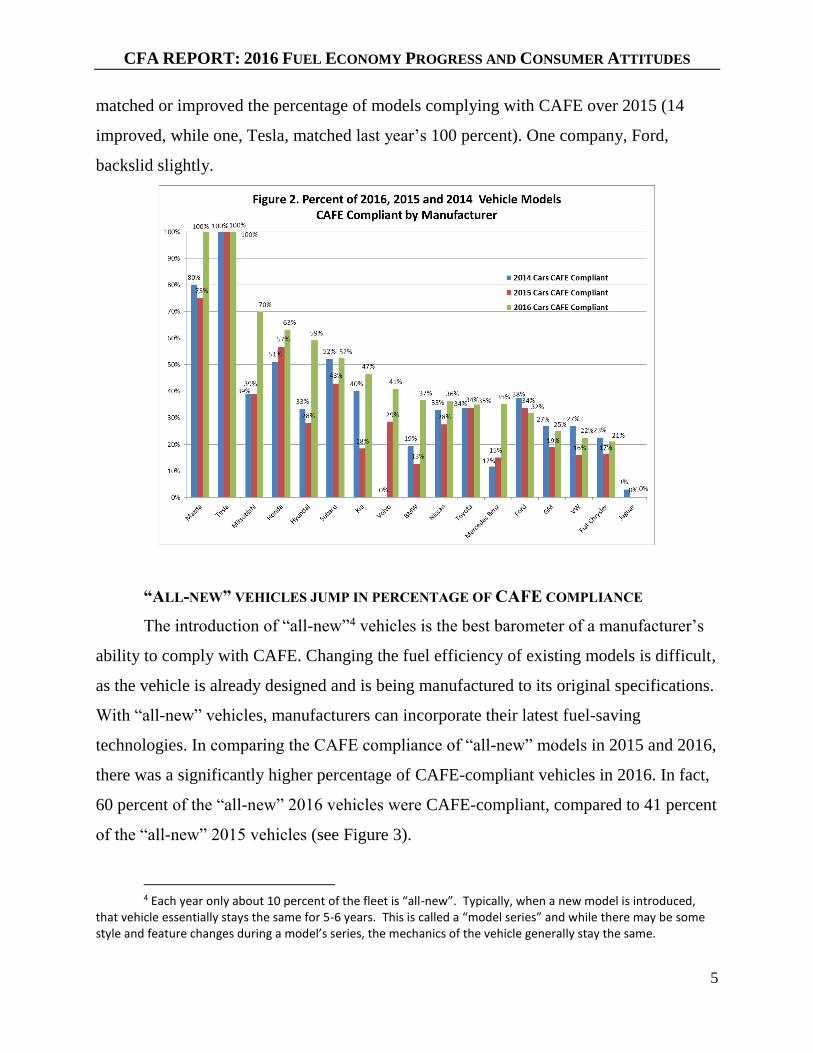
The following chart (Figure 2) compares the percentage of each company’s
models that are CAFE-compliant in 2014, 2015 and 2016. In 2016, 15 companies
EPA
Grade
Fuel
Economy
(mpg) 2006 2007 2008 2009 2010 2011 2012 2013 2014 2015 2016
10 38+ 0.4% 0.2% 0.2% 0.2% 0.6% 1.0% 1.1% 2.9% 3.1% 3.0% 4.0%
9 31-37 0.7% 0.4% 0.8% 1.1% 2.1% 3.2% 4.7% 6.4% 8.5% 8.7% 9.3%
1.1% 0.6% 1.0% 1.3% 2.7% 4.2% 5.8% 9.3% 11.6% 11.7% 13.4%
8 27-30 2.4% 3.0% 3.5% 4.4% 7.3% 7.8% 9.2% 12.0% 14.8% 16.5% 17.3%
7 23-26 10.3% 10.2% 12.8% 12.4% 18.9% 18.3% 20.4% 25.0% 24.1% 23.8% 25.4%
12.7% 14.4% 18.3% 19.3% 31.6% 34.5% 41.2% 45.3% 50.5% 52.0% 56.1%
6 22 10.4% 10.4% 7.2% 11.7% 8.4% 8.0% 7.0% 7.7% 6.1% 8.0% 7.5%
5 19-21 28.2% 26.5% 28.5% 27.6% 29.2% 30.4% 26.9% 26.5% 24.3% 22.2% 21.8%
4 17-18 14.7% 13.7% 14.9% 12.5% 13.8% 12.5% 11.3% 9.4% 10.6% 11.7% 10.7%
3 15-16 24.4% 24.6% 16.6% 15.6% 11.4% 10.3% 9.8% 6.7% 6.1% 4.7% 3.7%
2 13-14 5.0% 5.9% 9.9% 8.2% 6.7% 6.8% 7.8% 3.0% 2.4% 1.4% 0.3%
1 0-12 3.5% 5.2% 5.7% 6.4% 1.7% 1.7% 1.8% 0.4% 0.0% 0.0% 0.0%
86.2% 86.3% 82.8% 82.0% 71.2% 69.7% 64.6% 53.7% 49.5% 48.0% 43.9%
1076 1184 1198 1182 1101 1053 901 1057 1091 1194 1094# of Models
Poor
Over 30MPG
Acceptable
Figure 1. On the Road to 40 mpg by 2025:
Carmakers Demonstrate that Meeting the New Standard is Possible
CFA REPORT: 2016 FUEL ECONOMY PROGRESS AND CONSUMER ATTITUDES
5
matched or improved the percentage of models complying with CAFE over 2015 (14
improved, while one, Tesla, matched last year’s 100 percent). One company, Ford,
backslid slightly.
“ALL-NEW” VEHICLES JUMP IN PERCENTAGE OF CAFE COMPLIANCE
The introduction of “all-new”4 vehicles is the best barometer of a manufacturer’s
ability to comply with CAFE. Changing the fuel efficiency of existing models is difficult,
as the vehicle is already designed and is being manufactured to its original specifications.
With “all-new” vehicles, manufacturers can incorporate their latest fuel-saving
technologies. In comparing the CAFE compliance of “all-new” models in 2015 and 2016,
there was a significantly higher percentage of CAFE-compliant vehicles in 2016. In fact,
60 percent of the “all-new” 2016 vehicles were CAFE-compliant, compared to 41 percent
of the “all-new” 2015 vehicles (see Figure 3).
4 Each year only about 10 percent of the fleet is “all-new”. Typically, when a new model is introduced,
that vehicle essentially stays the same for 5-6 years. This is called a “model series” and while there may be some style and feature changes during a model’s series, the mechanics of the vehicle generally stay the same.
CFA REPORT: 2016 FUEL ECONOMY PROGRESS AND CONSUMER ATTITUDES
6
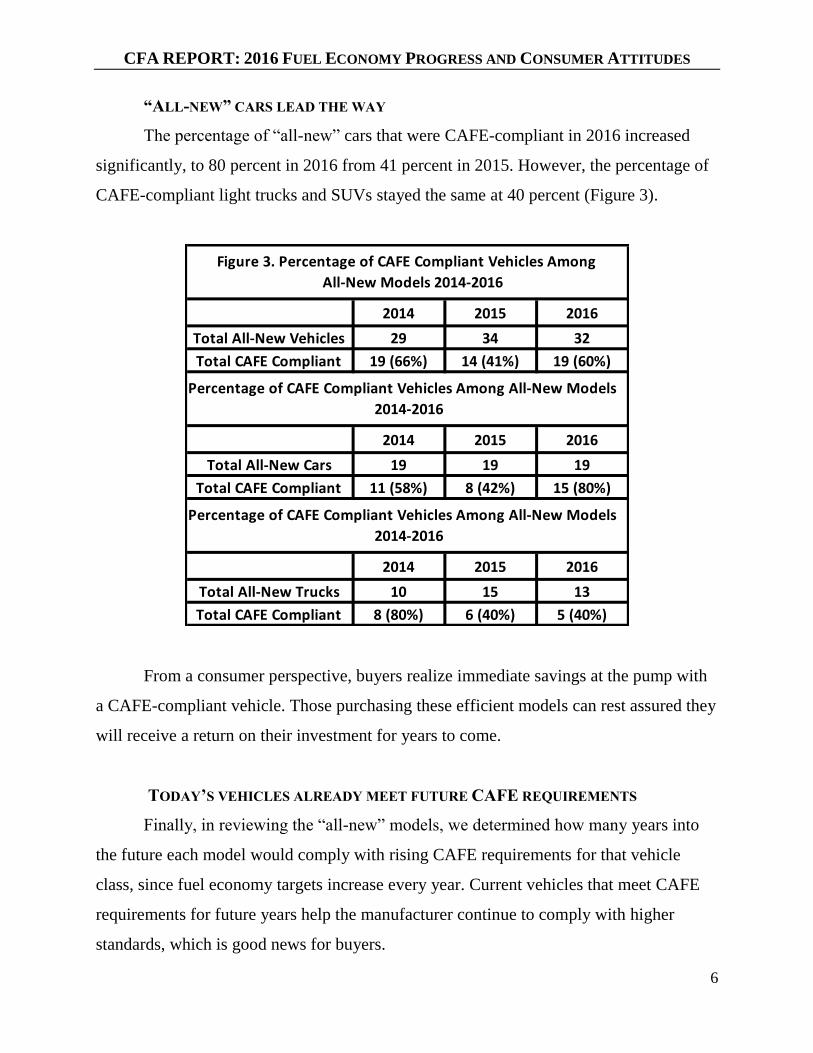
“ALL-NEW” CARS LEAD THE WAY
The percentage of “all-new” cars that were CAFE-compliant in 2016 increased
significantly, to 80 percent in 2016 from 41 percent in 2015. However, the percentage of
CAFE-compliant light trucks and SUVs stayed the same at 40 percent (Figure 3).
From a consumer perspective, buyers realize immediate savings at the pump with
a CAFE-compliant vehicle. Those purchasing these efficient models can rest assured they
will receive a return on their investment for years to come.
TODAY’S VEHICLES ALREADY MEET FUTURE CAFE REQUIREMENTS
Finally, in reviewing the “all-new” models, we determined how many years into
the future each model would comply with rising CAFE requirements for that vehicle
class, since fuel economy targets increase every year. Current vehicles that meet CAFE
requirements for future years help the manufacturer continue to comply with higher
standards, which is good news for buyers.
2014 2015 2016
Total All-New Vehicles 29 34 32
Total CAFE Compliant 19 (66%) 14 (41%) 19 (60%)
2014 2015 2016
Total All-New Cars 19 19 19
Total CAFE Compliant 11 (58%) 8 (42%) 15 (80%)
2014 2015 2016
Total All-New Trucks 10 15 13
Total CAFE Compliant 8 (80%) 6 (40%) 5 (40%)
Figure 3. Percentage of CAFE Compliant Vehicles Among
All-New Models 2014-2016
Percentage of CAFE Compliant Vehicles Among All-New Models
2014-2016
Percentage of CAFE Compliant Vehicles Among All-New Models
2014-2016
CFA REPORT: 2016 FUEL ECONOMY PROGRESS AND CONSUMER ATTITUDES
7
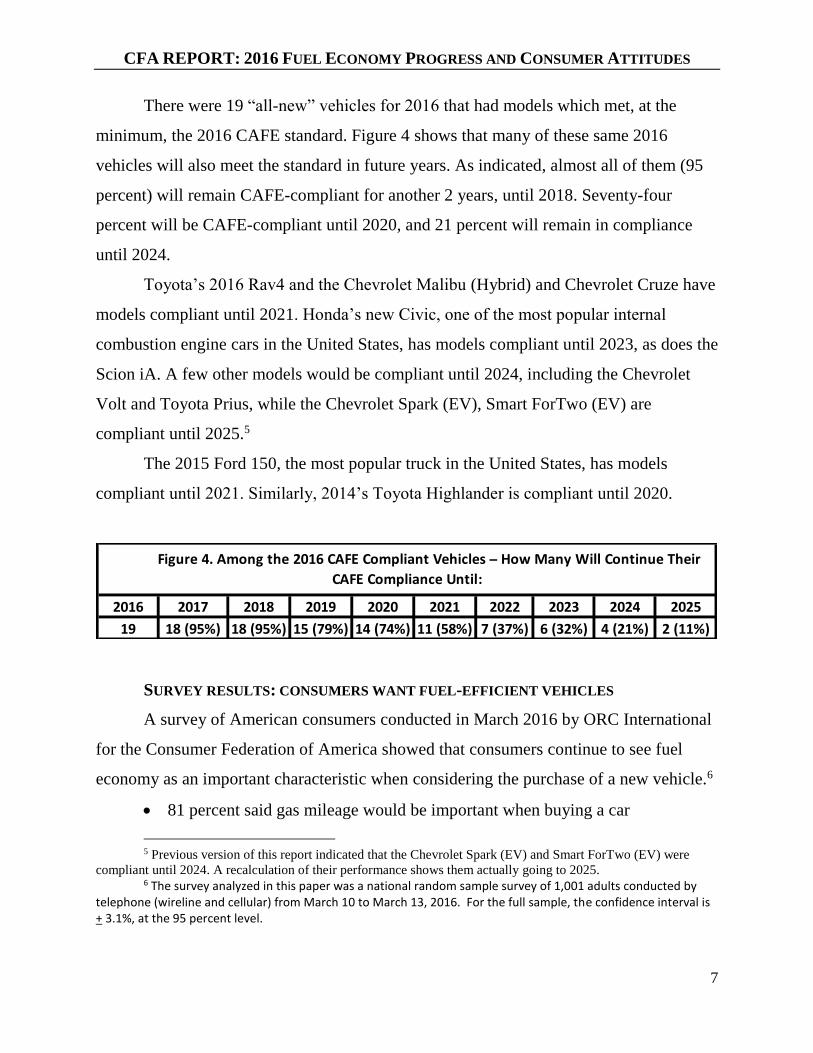
There were 19 “all-new” vehicles for 2016 that had models which met, at the
minimum, the 2016 CAFE standard. Figure 4 shows that many of these same 2016
vehicles will also meet the standard in future years. As indicated, almost all of them (95
percent) will remain CAFE-compliant for another 2 years, until 2018. Seventy-four
percent will be CAFE-compliant until 2020, and 21 percent will remain in compliance
until 2024.
Toyota’s 2016 Rav4 and the Chevrolet Malibu (Hybrid) and Chevrolet Cruze have
models compliant until 2021. Honda’s new Civic, one of the most popular internal
combustion engine cars in the United States, has models compliant until 2023, as does the
Scion iA. A few other models would be compliant until 2024, including the Chevrolet
Volt and Toyota Prius, while the Chevrolet Spark (EV), Smart ForTwo (EV) are
compliant until 2025.5
The 2015 Ford 150, the most popular truck in the United States, has models
compliant until 2021. Similarly, 2014’s Toyota Highlander is compliant until 2020.
SURVEY RESULTS: CONSUMERS WANT FUEL-EFFICIENT VEHICLES
A survey of American consumers conducted in March 2016 by ORC International
for the Consumer Federation of America showed that consumers continue to see fuel
economy as an important characteristic when considering the purchase of a new vehicle.6
81 percent said gas mileage would be important when buying a car
5 Previous version of this report indicated that the Chevrolet Spark (EV) and Smart ForTwo (EV) were
compliant until 2024. A recalculation of their performance shows them actually going to 2025. 6 The survey analyzed in this paper was a national random sample survey of 1,001 adults conducted by
telephone (wireline and cellular) from March 10 to March 13, 2016. For the full sample, the confidence interval is + 3.1%, at the 95 percent level.
2016 2017 2018 2019 2020 2021 2022 2023 2024 2025
19 18 (95%) 18 (95%) 15 (79%) 14 (74%) 11 (58%) 7 (37%) 6 (32%) 4 (21%) 2 (11%)
Figure 4. Among the 2016 CAFE Compliant Vehicles ̶ How Many Will Continue Their
CAFE Compliance Until:
CFA REPORT: 2016 FUEL ECONOMY PROGRESS AND CONSUMER ATTITUDES
8
54 percent said mileage would be very important
Gas mileage is very important for women (60 percent), those under the age of 45
(59 percent), and people with moderate incomes of $25k-$50k (64 percent).
Consumers continue to express support for fuel economy standards.
Overall, 81 percent support the federal standards, with
52 percent strongly supporting the federal standards
The most supportive groups (i.e. those who “support strongly”) are 35-44 year
olds (63 percent), those with a college degree (60 percent), and those with incomes above
$100k (59 percent).
It is significant that consumers are indicating that fuel economy is an important
purchase criterion, and that they expressed support for fuel economy standards at a time
when gasoline prices were quite low. The survey shows consumers recognize the
volatility of gasoline prices and expect them to rise. According to the survey, consumers
project prices to be at or above $3.00 per gallon in five years. In fact, the average
response was $3.50 per gallon, and one-third of respondents think gas prices will hit at
least $4.00 in five years.
When we compared these consumer projections for prices five years out to the
latest published Energy Information Administration (EIA) projections for 2020, we found
consumer expectations are in line with the expert EIA projections, which agencies use to
formulate new fuel-economy goals. In this case, EIA projected a reference case price of
$3.20 in nominal dollars per gallon. However, the high price case ($4.84) showed a much
higher level than the low price case ($2.72).
We believe respondents’ attitudes reflect not only expected increases in gas prices,
but also their household expenditure experience. Even at $2.00 a gallon, the average
household spends about $1,500 a year on gasoline, which is about as much as the average
household spends on electricity or telephone services.7 While the estimates of the average
household expenditure on gasoline had wide variations (i.e. the standard deviations were
7 Based on 2014 Consumer Expenditure Survey (Bureau of Labor Statistics) and annual gasoline prices
(Energy Information Administration), and assuming no increase in consumption.
CFA REPORT: 2016 FUEL ECONOMY PROGRESS AND CONSUMER ATTITUDES
9
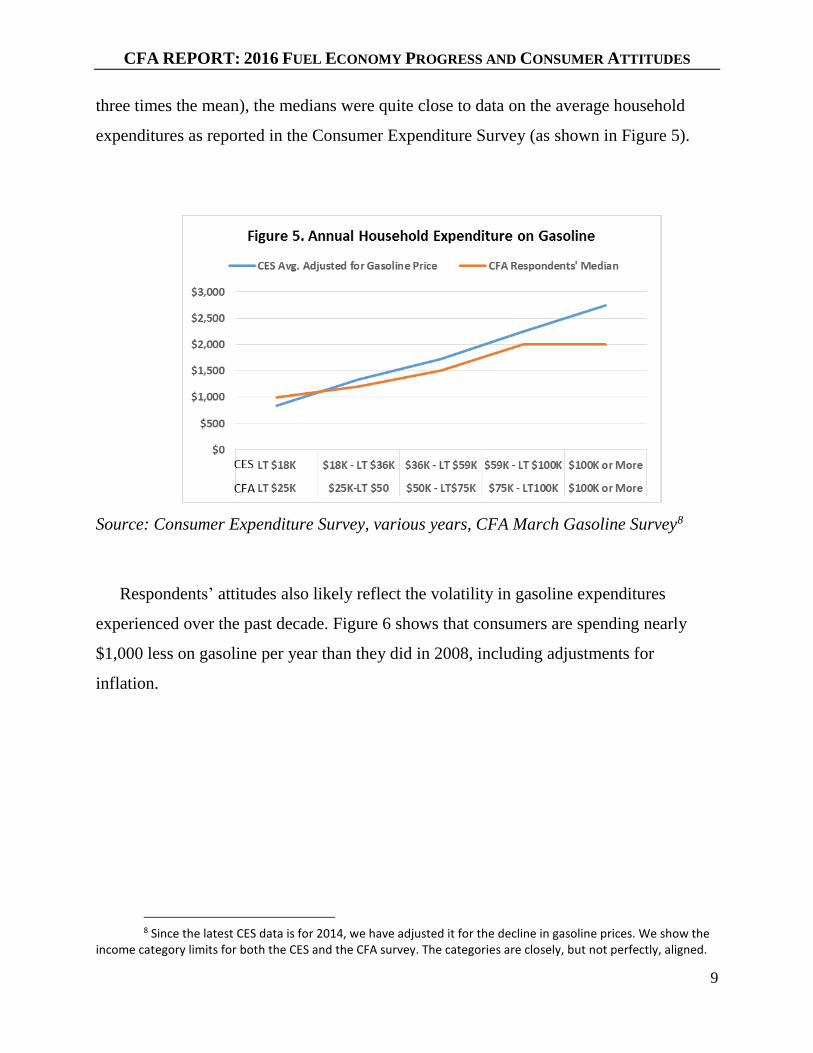
three times the mean), the medians were quite close to data on the average household
expenditures as reported in the Consumer Expenditure Survey (as shown in Figure 5).
Source: Consumer Expenditure Survey, various years, CFA March Gasoline Survey8
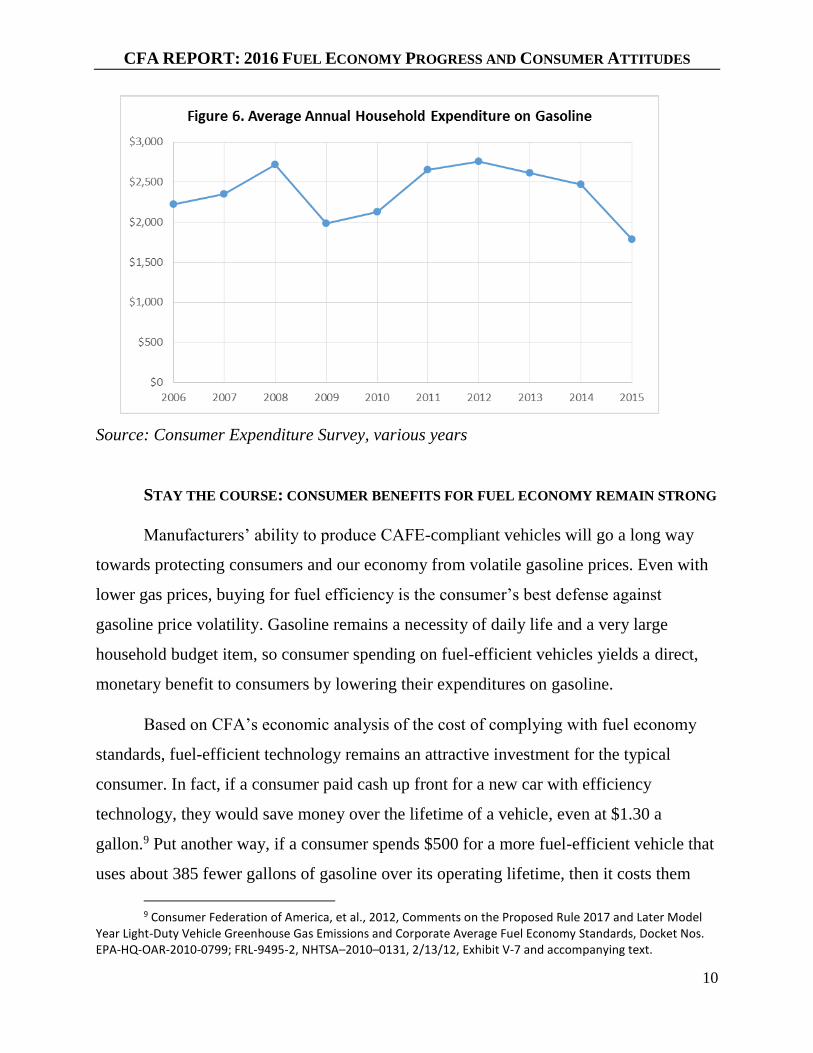
Respondents’ attitudes also likely reflect the volatility in gasoline expenditures
experienced over the past decade. Figure 6 shows that consumers are spending nearly
$1,000 less on gasoline per year than they did in 2008, including adjustments for
inflation.
8 Since the latest CES data is for 2014, we have adjusted it for the decline in gasoline prices. We show the
income category limits for both the CES and the CFA survey. The categories are closely, but not perfectly, aligned.
CFA REPORT: 2016 FUEL ECONOMY PROGRESS AND CONSUMER ATTITUDES
10
Source: Consumer Expenditure Survey, various years
STAY THE COURSE: CONSUMER BENEFITS FOR FUEL ECONOMY REMAIN STRONG
Manufacturers’ ability to produce CAFE-compliant vehicles will go a long way
towards protecting consumers and our economy from volatile gasoline prices. Even with
lower gas prices, buying for fuel efficiency is the consumer’s best defense against
gasoline price volatility. Gasoline remains a necessity of daily life and a very large
household budget item, so consumer spending on fuel-efficient vehicles yields a direct,
monetary benefit to consumers by lowering their expenditures on gasoline.
Based on CFA’s economic analysis of the cost of complying with fuel economy
standards, fuel-efficient technology remains an attractive investment for the typical
consumer. In fact, if a consumer paid cash up front for a new car with efficiency
technology, they would save money over the lifetime of a vehicle, even at $1.30 a
gallon.9 Put another way, if a consumer spends $500 for a more fuel-efficient vehicle that
uses about 385 fewer gallons of gasoline over its operating lifetime, then it costs them
9 Consumer Federation of America, et al., 2012, Comments on the Proposed Rule 2017 and Later Model
Year Light-Duty Vehicle Greenhouse Gas Emissions and Corporate Average Fuel Economy Standards, Docket Nos. EPA-HQ-OAR-2010-0799; FRL-9495-2, NHTSA–2010–0131, 2/13/12, Exhibit V-7 and accompanying text.
CFA REPORT: 2016 FUEL ECONOMY PROGRESS AND CONSUMER ATTITUDES
11
only $1.30 per gallon saved ($500/385 = $1.30). While economists can and do offer
complex modifications to these calculations, taking inflation, real increases in gasoline
prices and the time value of money into account, the basic idea does not change. In fact,
after all of these adjustments are made, the cost of saved gasoline in the economic
analysis of the current fuel economy standards remains about $1.30. Consumers who
lease vehicles and trade them in after a few years of use can also consider the immediate
value of reduced gasoline use and weigh that against any potential increases in monthly
payments associated with a more fuel-efficient model.
Fuel-efficient vehicles are not only critically important for consumer pocketbooks,
they are also essential for manufacturer’s financial viability and the health of the broader
economy. Buying a fuel-inefficient vehicle during times of low gas prices can subject
household finances to a huge burden when gas prices rise, causing consumers to reduce
spending in other sectors. At the same time, high prices reduce the trade-in value of
inefficient vehicles and make it harder for automakers to sell their least efficient models.
Consider 2008, when gas prices spiked, leaving U.S. automakers stuck with millions of
unsold gas-guzzlers. The U.S. government ended up stepping in to bail out the car
manufacturers.
While there are very different compliance levels among the manufacturers, today’s
best-performing cars and trucks make it clear that averaging 40 mpg by 2025 is, indeed,
achievable. Further, the 40 mpg fuel economy standards represent a historic agreement
among automakers, labor unions, environmental groups and consumer organizations.
Sticking to that agreement and continuing to increase fuel economy in coming years will
benefit our economic security, the environment, and consumers, who will enjoy reduced
fuel consumption and more vehicle choices. Finally, we should all take seriously the
advice of military and national security leaders who emphasize the advantages of being
less dependent on oil for our transportation needs.
CFA REPORT: 2016 FUEL ECONOMY PROGRESS AND CONSUMER ATTITUDES
12
When it comes to increasing fuel economy, staying the course will keep U.S.
manufacturers competitive, benefit our national security, improve the environment, and
save consumers money—a clear win-win-win-win.
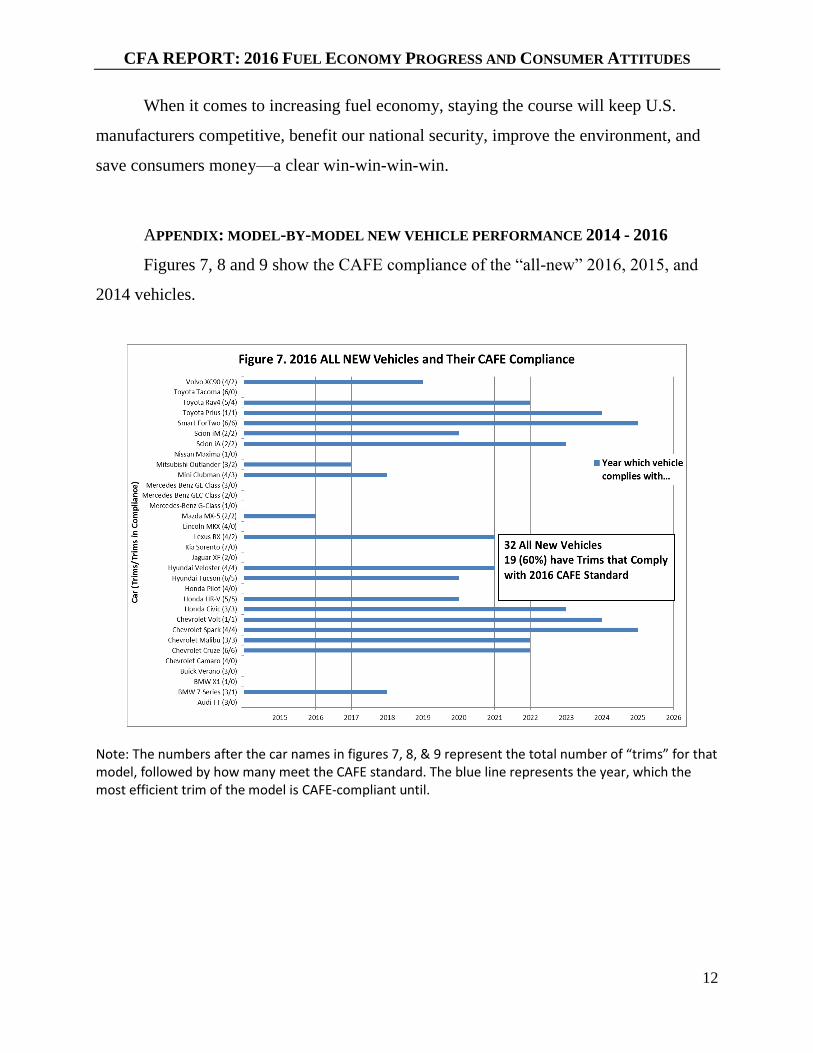
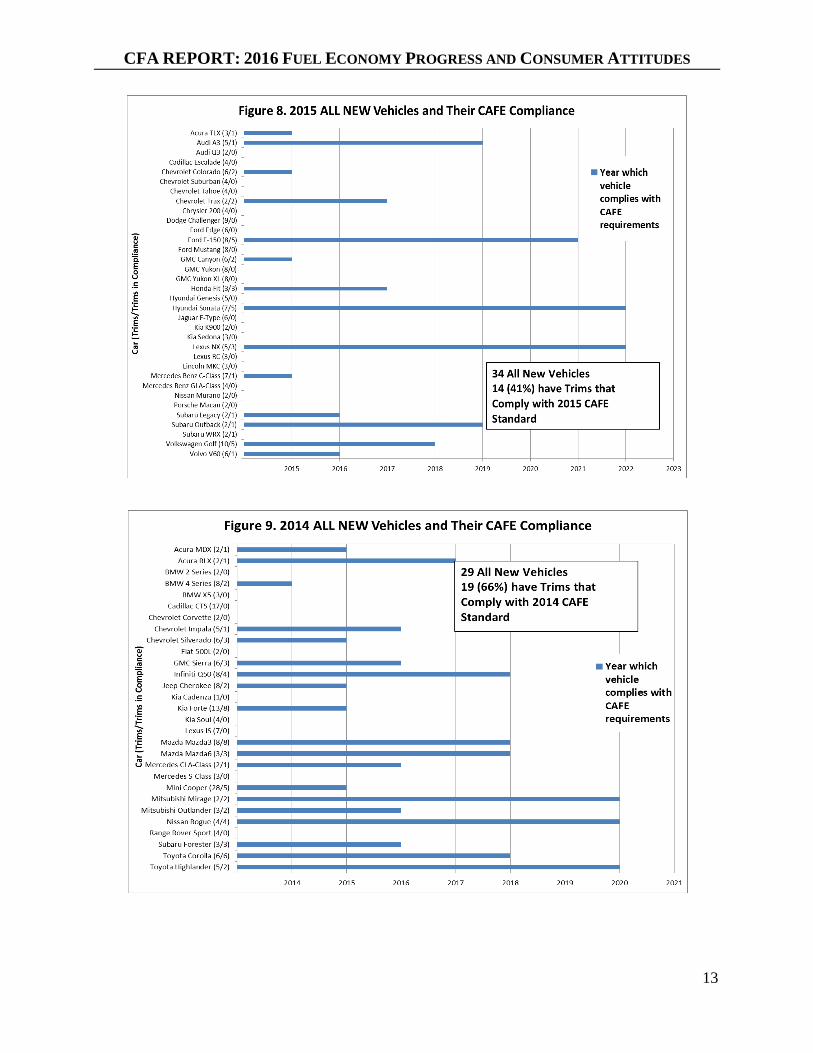
APPENDIX: MODEL-BY-MODEL NEW VEHICLE PERFORMANCE 2014 - 2016
Figures 7, 8 and 9 show the CAFE compliance of the “all-new” 2016, 2015, and
2014 vehicles.
Note: The numbers after the car names in figures 7, 8, & 9 represent the total number of “trims” for that model, followed by how many meet the CAFE standard. The blue line represents the year, which the most efficient trim of the model is CAFE-compliant until.
CFA REPORT: 2016 FUEL ECONOMY PROGRESS AND CONSUMER ATTITUDES
13
CFA REPORT: 2016 FUEL ECONOMY PROGRESS AND CONSUMER ATTITUDES
14
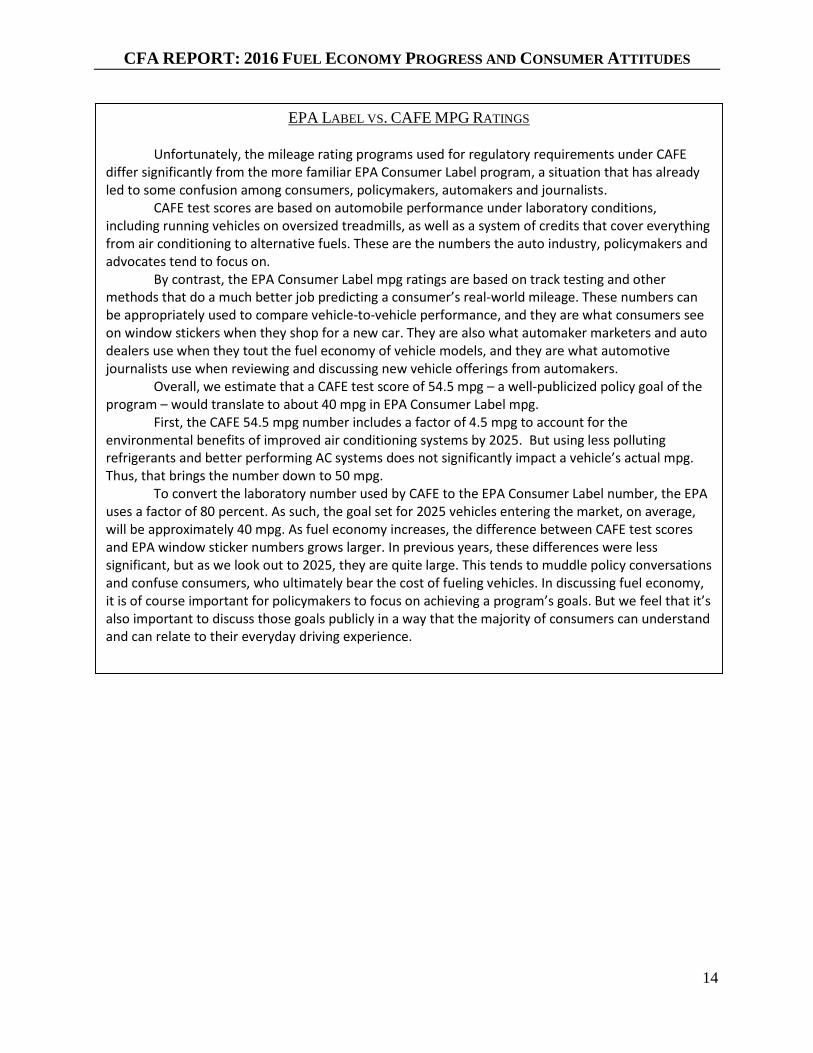
EPA LABEL VS. CAFE MPG RATINGS
Unfortunately, the mileage rating programs used for regulatory requirements under CAFE differ significantly from the more familiar EPA Consumer Label program, a situation that has already led to some confusion among consumers, policymakers, automakers and journalists.
CAFE test scores are based on automobile performance under laboratory conditions, including running vehicles on oversized treadmills, as well as a system of credits that cover everything from air conditioning to alternative fuels. These are the numbers the auto industry, policymakers and advocates tend to focus on.
By contrast, the EPA Consumer Label mpg ratings are based on track testing and other methods that do a much better job predicting a consumer’s real-world mileage. These numbers can be appropriately used to compare vehicle-to-vehicle performance, and they are what consumers see on window stickers when they shop for a new car. They are also what automaker marketers and auto dealers use when they tout the fuel economy of vehicle models, and they are what automotive journalists use when reviewing and discussing new vehicle offerings from automakers.
Overall, we estimate that a CAFE test score of 54.5 mpg – a well-publicized policy goal of the program – would translate to about 40 mpg in EPA Consumer Label mpg.
First, the CAFE 54.5 mpg number includes a factor of 4.5 mpg to account for the environmental benefits of improved air conditioning systems by 2025. But using less polluting refrigerants and better performing AC systems does not significantly impact a vehicle’s actual mpg. Thus, that brings the number down to 50 mpg.
To convert the laboratory number used by CAFE to the EPA Consumer Label number, the EPA uses a factor of 80 percent. As such, the goal set for 2025 vehicles entering the market, on average, will be approximately 40 mpg. As fuel economy increases, the difference between CAFE test scores and EPA window sticker numbers grows larger. In previous years, these differences were less significant, but as we look out to 2025, they are quite large. This tends to muddle policy conversations and confuse consumers, who ultimately bear the cost of fueling vehicles. In discussing fuel economy, it is of course important for policymakers to focus on achieving a program’s goals. But we feel that it’s also important to discuss those goals publicly in a way that the majority of consumers can understand and can relate to their everyday driving experience.