Embed Size (px)
Citation preview

inform October 2014, Vol. 25 (9) • 595
Determining the quality, purity, and health benefits of edible oils requires a number of evaluations, one of the most important being fatty acid analysis. Since some fatty acids have more health benefits than others, it is essen-tial to know the full fatty acid makeup of an oil. currently, skilled technicians determine the fatty acid profile by injecting a deriva-tized sample onto a gas chromatograph (Gc) or gas chromatograph–mass spectrometer (Gc–MS) and then using the results to calcu-late the fatty acid composition. current aOcS methods for analysis standardize the analyt-ical process while still giving the technician some flexibility as to instruments, materials, and techniques of data processing. Require-ments for analysis include: verifiable system suitability for the analysis; repeatability of analyses within a laboratory; and reproduc-ibility across laboratories. MiDi, inc. (Newark, Delaware, USa) has developed a fully auto-mated system that meets these require-ments, providing precise analysis, accurate naming of compounds, correction for instru-ment and column variables, as well as labor-saving calculations that would otherwise be done post-analysis. the software is designed to meet aOcS standards for such analyses.
AUtoMAtIon, precIsIon oF AnAlysIs, AnD soFtWAre FlexIBIlItyMIDI software automatically analyzes the results from the GC and calculates the fatty acid profile for an oil sample without time-consuming and potentially error-prone human interven-tion. An example of a fatty acid profile is shown in Table 1, page 596.
The software is able to accurately name fatty acids by using a calibration standard containing a mixture of saturated fatty acids—having chain lengths of 4–25 carbon atoms—with each batch of samples; these known fatty acids ‘act as a series of “fence posts” yielding a series of small naming windows’, allowing
aNaLYticaL
gary Jackoway and craig kunitsky
automated analysis of edible oils
this article describes a fully automated gas chromatographic system that:
• names more than 100 fatty acids auto-matically;
• provides accurate quantification for a specific instrument based on a composite calibration standard;
• calculates complex metrics and deter-mines sample relationships.
cONtiNUED ON NExt PaGE
596 • inform October 2014, Vol. 25 (9)
applied to both GC–MS and high-perfor-mance liquid chromatography (HPLC) instruments.
When used for identification of bac-teria, both GC-FID and HPLC methods have succeeded in large interlaboratory studies accepted by the US Food and Drug Administration and the Associa-tion of Analytical Communities (AOAC INTERNATIONAL).
AnAlysIsA number of critical measures of edible oil quality can be derived from the fatty acid profile; the software can automatically gen-erate some of these key parameters such as iodine value and saponification value.
iODiNE vaLUEThe iodine value is a measure of the amount of unsaturation present in the fatty acids in the sample. It is automatically calculated by
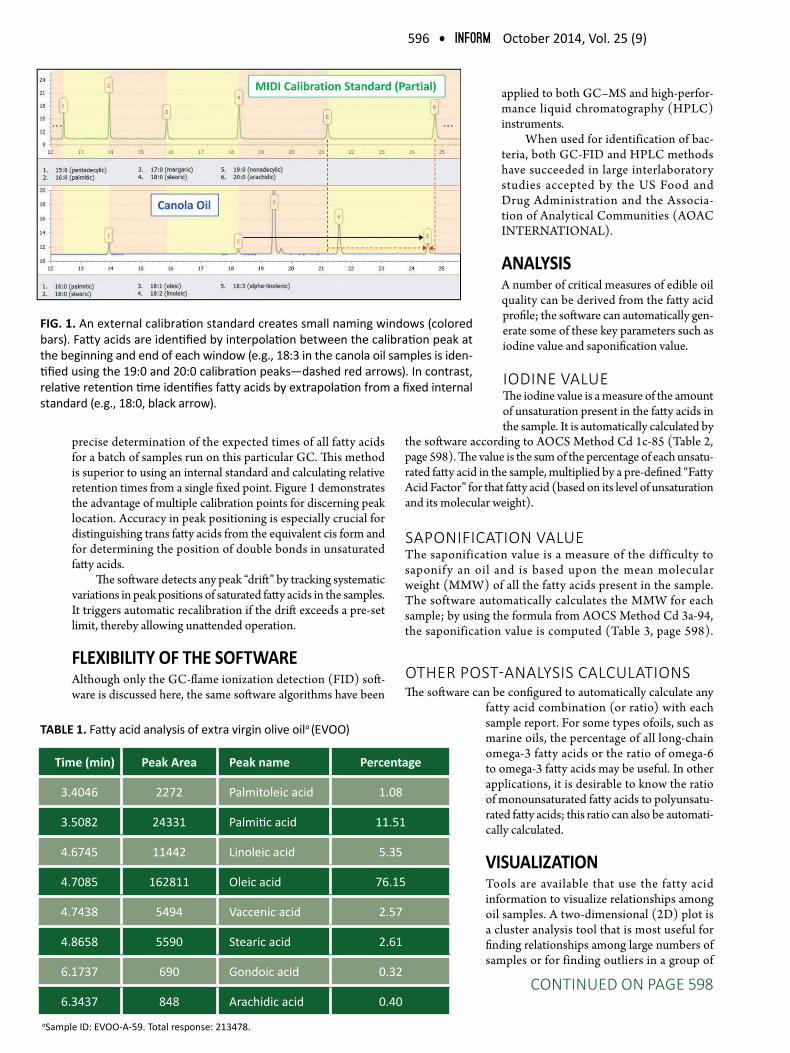
FIg. 1. An external calibration standard creates small naming windows (colored bars). Fatty acids are identified by interpolation between the calibration peak at the beginning and end of each window (e.g., 18:3 in the canola oil samples is iden-tified using the 19:0 and 20:0 calibration peaks—dashed red arrows). In contrast, relative retention time identifies fatty acids by extrapolation from a fixed internal standard (e.g., 18:0, black arrow).
time (min) peak Area peak name percentage
3.4046 2272 Palmitoleic acid 1.08
3.5082 24331 Palmitic acid 11.51
4.6745 11442 Linoleic acid 5.35
4.7085 162811 Oleic acid 76.15
4.7438 5494 Vaccenic acid 2.57
4.8658 5590 Stearic acid 2.61
6.1737 690 Gondoic acid 0.32
6.3437 848 Arachidic acid 0.40aSample ID: EVOO-A-59. Total response: 213478.
tABle 1. Fatty acid analysis of extra virgin olive oila (EVOO)
precise determination of the expected times of all fatty acids for a batch of samples run on this particular GC. This method is superior to using an internal standard and calculating relative retention times from a single fixed point. Figure 1 demonstrates the advantage of multiple calibration points for discerning peak location. Accuracy in peak positioning is especially crucial for distinguishing trans fatty acids from the equivalent cis form and for determining the position of double bonds in unsaturated fatty acids.
The software detects any peak “drift” by tracking systematic variations in peak positions of saturated fatty acids in the samples. It triggers automatic recalibration if the drift exceeds a pre-set limit, thereby allowing unattended operation.
FlexIBIlIty oF tHe soFtWAreAlthough only the GC-flame ionization detection (FID) soft-ware is discussed here, the same software algorithms have been
the software according to AOCS Method Cd 1c-85 (Table 2, page 598). The value is the sum of the percentage of each unsatu-rated fatty acid in the sample, multiplied by a pre-defined “Fatty Acid Factor” for that fatty acid (based on its level of unsaturation and its molecular weight).
SaPONiFicatiON vaLUEThe saponification value is a measure of the difficulty to saponif y an oil and is based upon the mean molecular weight (MMW) of all the fatty acids present in the sample. The software automatically calculates the MMW for each sample; by using the formula from AOCS Method Cd 3a-94, the saponification value is computed (Table 3, page 598).
OthER POSt-aNaLYSiS caLcULatiONSThe software can be configured to automatically calculate any
fatty acid combination (or ratio) with each sample report. For some types ofoils, such as marine oils, the percentage of all long-chain omega-3 fatty acids or the ratio of omega-6 to omega-3 fatty acids may be useful. In other applications, it is desirable to know the ratio of monounsaturated fatty acids to polyunsatu-rated fatty acids; this ratio can also be automati-cally calculated.
vIsUAlIzAtIonTools are available that use the fatty acid information to visualize relationships among oil samples. A two-dimensional (2D) plot is a cluster analysis tool that is most useful for finding relationships among large numbers of samples or for finding outliers in a group of
cONtiNUED ON PaGE 598

inform October 2014, Vol. 25 (9) • 597
FIg. 2. Two dimen-sional (2D) plot for common edible oils. EVOO, extra virgin olive oil.
FIg. 3. 2D plot for extra virgin olive oil adulterated with varying amounts of safflower oil.

598 • inform October 2014, Vol. 25 (9)
closely related samples. One way a 2D plot can be used for fatty acid analysis is to plot individual fatty acids against each other.
In Figure 2 (page 597), a 2D plot was used to compare five major edible oil types by charting the percentage of linoleic acid against the percentage of oleic acid. Each type of oil grouped well with similar samples and was clearly separated from the other oils. Three to ten replicate runs of the same oils demon-strate excellent reproducibility.
olIve oIl ADUlterAtIonOlive oil is often adulterated with other, low-cost oils. Deter-mining whether olive oil is pure or adulterated is important in ascertaining the healthful properties of the oil. In Figure 3 (page 597), a 2D plot was created of olive oil adulterated with varying levels of safflower oil. As shown, the software system can easily distinguish pure olive oil from these adulterated combinations and can determine the approximate level of adulteration. Work is ongoing to resolve the adulteration problem using different extraction techniques.
otHer cApABIlItIesAs well as 2D plots, the software visualization tools available include dendrograms, neighbor-joining trees, and histograms. Further, the software includes data export capabilities that allow
information to be exported to standard database, spreadsheet, mathematical analysis, and drawing tools.
Fatty acid profiles give detailed information concerning the quality and purity of edible oils. The use of automated peak naming with calculated response factors yields a reproducible, objective measure of the fatty acid profile in oils. These pro-files may then be used to calculate key chemical factors for the samples or for visualization of relationships among samples.
Work is ongoing to apply this same software to other chemical information within oils, such as sterol, triterpene, and tocopherol contents.
Gary Jackoway is vice president of MIDI, Inc. and is respon-sible for research and development.
Craig Kunitsky is chief marketing officer of MIDI, Inc. and is responsible for Sales and Marketing. Both can be reached at [email protected].
tABle 2. Iodine value calculationa
peak Area peak name
108 Palmitoleic acid
969 Linoleic acid
6842 Oleic acid
231 Vaccenic acid
27 Gondoic acid
aSample ID: EVOO-A-59. Total response: 8175. Iodine value: 81.75
tABle 3. Saponification value calculationa
peak Area Area peak name
274 Palmitoleic acid
2952 Palmitic acid
1501 Linoleic acid
21512 Oleic acid
726 Vaccenic acid
744 Stearic acid
101 Gondoic acid
125 Arachidic acidaSample ID: EVOO-A-59. Total response: 27934. Mean molecular weight: 279.34. saponification value: 192.1.
extrActs & DiStiLLatES (cont. from page 585)
an overview on the presence of cyclopropane fatty acids in milk and dairy productsCaligiani, A., et al., J. Agric. Food Chem. 62: 7828–7832, 2014, http://dx.doi: 10.1021/jf4057204.
A survey was carried out to determine the presence of cyclopropane fatty acids (CPFA) in various dairy products. CPFA such as lactobacillic acid and dihydrosterculic acid are components of bacterial membranes and have been recently detected in milk from cows fed with maize silage. In this paper about 200 dairy samples comprising cow, sheep, and goat milk,
cheese, yogurt/fermented milk, and butter were analyzed. Results showed that cow milks were generally positive to CPFA (0.014–0.105% of total fatty acids), while goat, yak, and sheep milks were negative. Experimental yogurt and fermented milks showed the same CPFA content of the starting milk. Positive to CPFA were also the majority of samples of commercial butter and cheeses, except some PDO cheeses as Parmigiano-Reggiano and Fontina, cheeses from mountain regions, and goat and sheep cheeses. These data suggest that the presence of CPFA in dairy products could be used as a marker of silage feeding.
More Extracts & Distillates can be found in this issue's sup-plement (digital and mobile editions only).