Embed Size (px)
Citation preview
Global Drilling Community
Occidental Oil & Gas Corp.
A Methodology and Analytical Tool
Kevin Konopko Occidental Oil & Gas Corp.

OCCIDENTAL OIL & GAS CORP.
Automated Bit Performance Analysis
© 2011 Occidental Oil & Gas Corp.
2
OCCIDENTAL OIL & GAS CORP.
Automated Bit Performance Analysis
© 2011 Occidental Oil & Gas Corp.
3
TABLE OF CONTENTS
INTRODUCTION ......................................................................................................................... 5
DATA EXTRACTION METHODOLOGY ..................................................................................... 6
Bit Runs: Physical and Operating Parameters .......................................................................................... 6
Bit Run Cost ................................................................................................................................................... 7
Consumer Price Index (CPI) ......................................................................................................................... 7
Bit Performance Index .................................................................................................................................. 8
THE ANALYSIS TOOL ................................................................................................................ 9
Performance Index Plot ................................................................................................................................ 9
Cost/Ft and ROP Quadrant Plots ............................................................................................................... 10
Drilled Intervals ........................................................................................................................................... 11
Vendor Head-to-Head Performance .......................................................................................................... 11
Raw Data ...................................................................................................................................................... 12
DATA OBSERVATIONS ........................................................................................................... 13
SUMMARY ................................................................................................................................ 14
REFERENCES .......................................................................................................................... 15

OCCIDENTAL OIL & GAS CORP.
Automated Bit Performance Analysis
© 2011 Occidental Oil & Gas Corp.
4
OCCIDENTAL OIL & GAS CORP.
Automated Bit Performance Analysis
© 2011 Occidental Oil & Gas Corp.
5
Introduction
Historically, we have relied on drill bit vendors to compile and present bit performance data. While their results are typically focused on cost-per-foot, this simple economic calculation obscures drilling difficulties and directional conditions, and it ignores other costs incurred during the run. Using bit run data we have been collecting at the rig for years, we developed a method to measure the bit's performance for a single run. In addition to the cost-per-foot, the calculation of a
Bit Performance Index
(PI)
includes the Rate of Penetration (ROP), footage drilled, and the reason pulled. Bit runs are plotted in Spotfire by well type and hole section, affording engineers a quick and easy method for selecting the best bit model(s) based upon actual experience. The analysis tool also compares bit vendors head-to-head in each well type scenario.
The initial idea for this
bit performance analysis tool came from the Drilling Performance Community of Practice. Their request was for some type of tool that would assist them in selecting the best drill bits in a particular environment –
similar well types, depth ranges and lithology.
This would be a look-back tool, not a “predictor” such as that offered by some bit vendors.
A manually driven prototype tool was built using Microsoft® Access®, and after rigorous testing we built an automated tool
in the Oracle database.
In this document
we will walk through the data extraction process itself, the primary calculations performed, and the short-comings in the resulting data set. Then we will look at how we take that data
set
and feed it into an
analysis/visualization tool –
Spotfire.
Landmark’s
EDM™
database and its application
OpenWells®
do not relate bit
runs directly to a drilling operation. The massive amount of data, and the indirect association of certain pieces of supporting data, does not lend well to creating one master query. Indeed, such a query would require several subqueries and therefore impose a
burdensome load at run time. Additionally, Oxy has no single corporate database
yet
which contains all the drilling operations data. Given those conditions, it was decided to create a stored extraction routine in each Oracle database and send the data to a central table in Houston.
Extracting the data is relatively easy; the hard part is doing something useful with the data. We employed Spotfire to load the data and create a series of visualizations in the hopes of obtaining insights into our drilling performance.
The Spotfire file evolved through several
generations before we had something rather simple and useful.
Several insights
were imparted. Our first
insight was discovering performance quadrants in the
plots of Cost/Foot (CPF) and ROP against footage drilled.
The second insight was
the discovery of a
Performance Index and how
it quickly and easily exposes the best performing bits. The
final
insight involved
vendor equipment performance when we compared
them head-to-head in the same well types and hole sections.
OCCIDENTAL OIL & GAS CORP.
Automated Bit Performance Analysis
© 2011 Occidental Oil & Gas Corp.
6
Data Extraction Methodology
The data extraction from the EDM database starts with identifying
all Drilling Events with a start date >=
11/01/2007 and loading them
into a temporary
"EVENTS"
table.
It was decided that anything prior to
this date had low reliability.
Extracted data includes the well, rig, well type, Event primary reason, and a
few other items useful for filtering and grouping. We also include the minimum
and maximum
activity
date/time values to be used as the date range
limits
for related bit
runs.
Bit Runs: Physical and Operating Parameters
Using the compiled "EVENTS"
table as a starting point, we identify all related bit
runs
and load
them
into another "BIT RUNS"
table, where:
Bit
DateTime In
is between Event's min and max activity date/ time values;
Bit
DateTime Out
is not null (don't want any bit runs that are still in the hole
drilling);
the
bit is not a core bit, mill, window mill, spear bit, or washover bit;
the bit run’s purpose does not
contain words like cleanout, mill, scraper, core, reaming, reamer.
Bit information includes nomenclature, physical characteristics, and
the post-run grading.
Next we calculate some specific values with additional
queries and load into
the
"BIT RUNS" table.
Of particular interest are:
Drilled Ftg
(Depth
Out) -
(Depth
In)
Hrs in Hole
(the “Gross”
Hrs)
(DateTime Out) -
(DateTime In)
Hrs Drill New Hole
(the “Net”
Hrs)
sum hours of all daily activity records within bit run's datetime range where activity code indicates drilling new hole
Net ROP
(Drilled Footage)/(Hrs Drill New Hole)
Then we delete any
records
in the "BIT RUNS" table
where Drilled Footage
= 0 or Hrs Drill New Hole
= 0.
Also, we
delete any
records where there is no single default depth reference datum for the well, which makes
it impossible to convert depth values
from the database.
This
three-step
deletion eliminates additional bit
runs that passed the initial filtering round.
Continuing on, we add the minimum and maximum of the bit operating
parameters recorded during the run.
These include min/max WOB, min/max RPM, min/max downhole RPM, min/max ROP, min/max pump flow
rate, min/max pump pressure,
max P drop across bit, max nozzle velocity, and max HHP.
Rounding out the bit run
data, we add some additional points about specific components on the drill string: hole openers, Steerable Ream While Drilling (SRWD) components, and mud motors. If any are present, we indicate such and populate the
size. All three of these
component circumstances
are intended to
be used as additional filtering criteria.
OCCIDENTAL OIL & GAS CORP.
Automated Bit Performance Analysis
© 2011 Occidental Oil & Gas Corp.
7
As the final part of the drilling environment, we add the maximum hole
inclination and its
corresponding
measured depth. Again, this is useful as
filtering criteria to narrow the drilling environment being
analyzed.
Finally, we determine the hole section Phase from the matching daily activity records. This
is important
as it
allows comparison against other bits drilling the same type of well in a similar depth range
or hole
section.
Bit Run Cost
For our tool and methodology here, we include not only the bit cost but rig/location costs incurred during the bit run, which may differ from other methodologies.
First, we load a temporary "DAILY REPTS" table with all of the Daily reports for the Event. This
data
is
used to calculate a rough estimate of the bit
run cost and to calculate a cost/ft value.
1.
For each Daily report, calculate the total daily cost.
2.
For each Daily report, calculate the "Effective
Cost" as
[total daily cost] -
[Intangibles] -
[Cementing
services] -
[Logging services] -
[Perforating services]
3.
For each Daily report, calculate the total number of hours from the daily activity.
4.
For each Daily report, identify the min activity datetime and the max activity datetime values.
Next, use the "DAILY REPTS" table data to update the main "BIT RUNS" table. For each bit
run, determine how many Daily reports it covers
and use a percentage calculation scheme to obtain a cost for the run.
1.
Identify the first Daily report, where the bit
runs in the hole.
2.
Identify the last Daily report, where the bit
is pulled out of the hole.
3.
If identified daily reports are not the same, calculate the number of reports between them.
4.
Calculate the
Bit
Run Cost based upon one of three cases as follows.
a.
Bit
in and out on same Daily report
b.
Bit
out on Daily report one day later
c.
Bit
out on Daily report 2+ days later
5.
Calculate the Cost/Ft
CPF = [Bit
Run Cost]/[Drilled Footage]
Consumer Price Index (CPI)
For comparison purposes, the routine adds
CPI-adjusted cost values.
The CPI data is obtained from the U.S. Department of Labor’s website. Monthly CPI data is stored in a
separate
database table
and is updated monthly. January 2006 is set as the benchmark month. A CPI Benchmark Factor is calculated for each month from January 2006. The formula is:
CPI BM Factor
for any month = [CPI for month]/[CPI for Jan 2006]
OCCIDENTAL OIL & GAS CORP.
Automated Bit Performance Analysis
© 2011 Occidental Oil & Gas Corp.
8
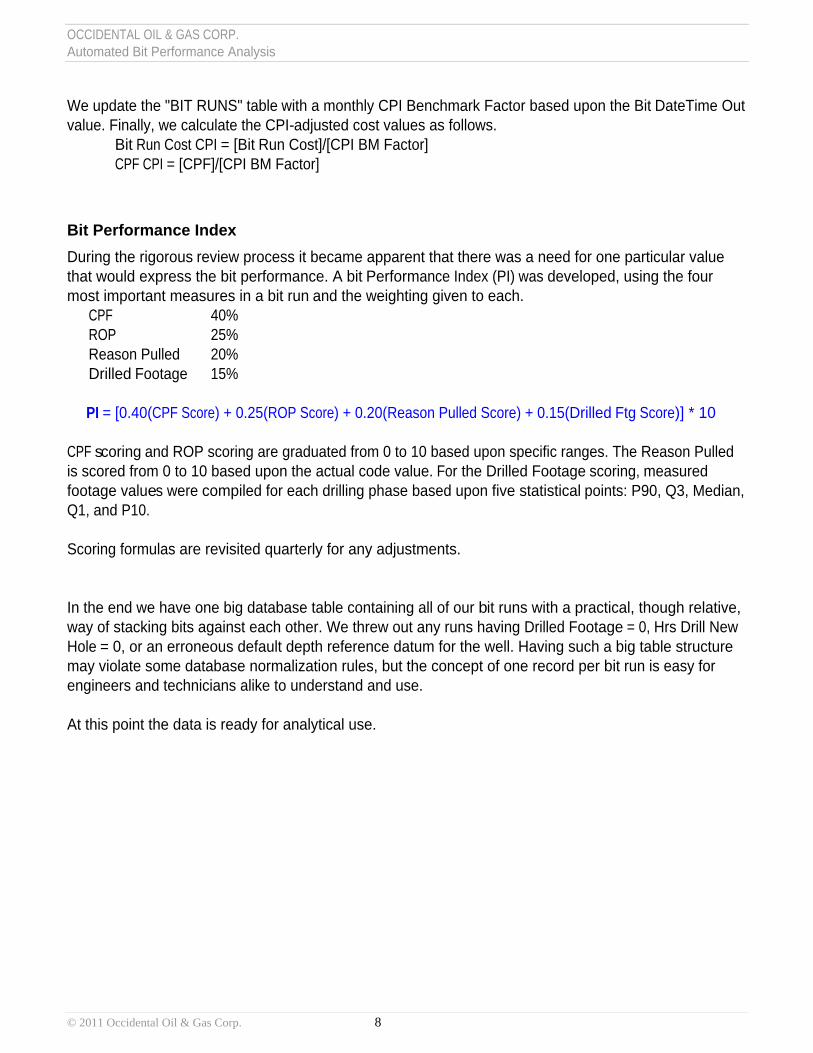
We update the "BIT RUNS" table
with a monthly CPI Benchmark Factor based upon the Bit
DateTime Out
value. Finally, we calculate the CPI-adjusted cost values as follows.
Bit
Run Cost CPI
= [Bit
Run Cost]/[CPI BM Factor]
CPF CPI = [CPF]/[CPI BM Factor]
Bit Performance Index
During the rigorous
review process it became apparent that there was a need for one particular value that would express the bit performance. A bit
Performance Index (PI)
was developed, using the four most important measures in a bit run
and the weighting given to each.
CPF 40%
ROP 25%
Reason Pulled
20%
Drilled
Footage
15%
PI = [0.40(CPF Score) + 0.25(ROP Score) + 0.20(Reason Pulled Score) + 0.15(Drilled
Ftg
Score)] * 10
CPF scoring
and ROP scoring are graduated from 0 to 10 based upon specific ranges. The Reason Pulled is scored from 0 to 10 based upon the actual code value.
For the Drilled Footage
scoring, measured footage values were compiled for each drilling phase based upon five statistical
points: P90, Q3, Median, Q1, and P10.
Scoring formulas are revisited quarterly for any adjustments.
In the end we have one big database table containing all of our bit runs with a practical, though relative, way of stacking bits against each other. We threw out any runs having Drilled Footage
= 0, Hrs Drill New Hole
= 0, or an erroneous default depth reference datum for the well. Having such a big table structure may violate some database normalization rules, but the concept of one record per bit run is easy for engineers and technicians alike to understand and use.
At this point the data is ready for analytical use.
OCCIDENTAL OIL & GAS CORP.
Automated Bit Performance Analysis
© 2011 Occidental Oil & Gas Corp.
9
The Analysis Tool
A simple query of the finalized data set and its
corresponding results are a great start but we think there
is more to do.
In simple form, an analysis attempts to answer a question. The question we are asking
here is what bit, based upon local experience, is best for drilling a particular hole section in a particular type of well. Hence, the finalized data was linked into Spotfire and various
tables and charts were
created.
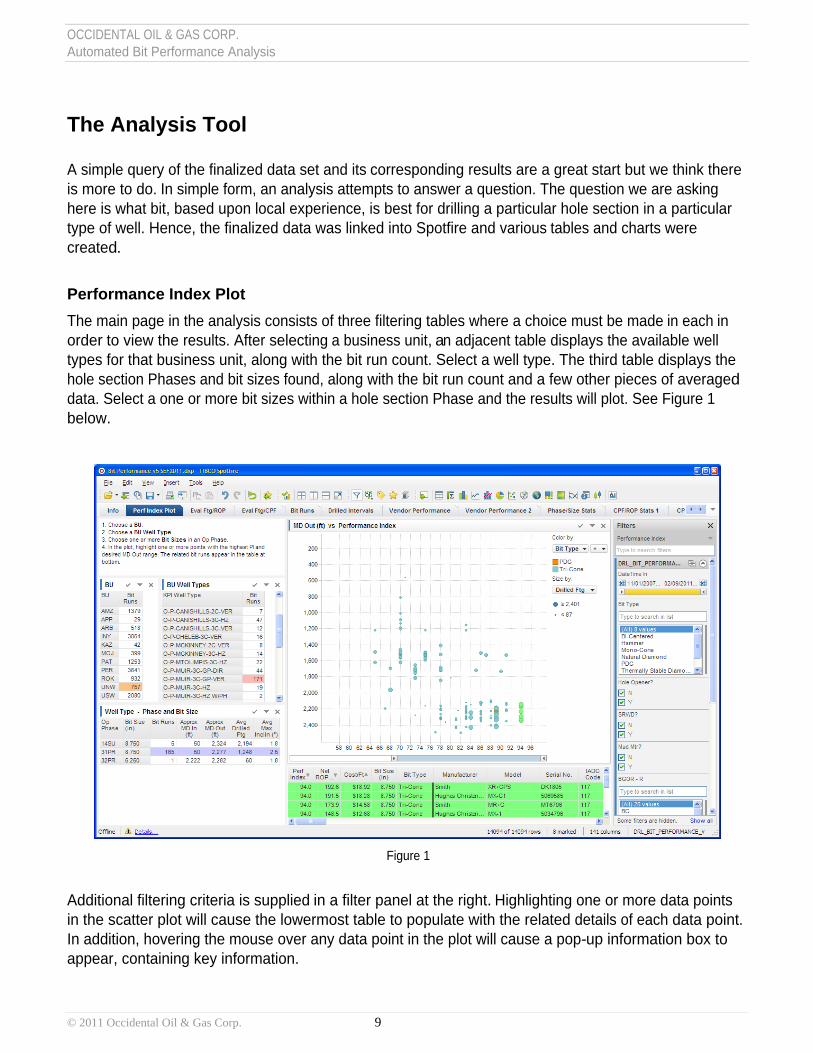
Performance Index Plot
The main page in the analysis consists of three filtering tables where a choice must be made
in each
in order
to view the results. After selecting
a business unit,
an adjacent table displays the available well types for that business unit, along with the bit run count. Select a well type. The third table displays the hole section Phases and bit sizes found, along with the bit run count and a few other pieces of averaged
data. Select a one or more bit sizes within a hole section Phase and the results will plot. See Figure 1 below.
Additional filtering criteria is supplied
in a filter panel at the right.
Highlighting one or more data points in the scatter plot will cause the lowermost table to populate with the related details of each data point. In addition, hovering the mouse over any data point in the plot will cause a pop-up information box to appear, containing key information.
Figure 1
OCCIDENTAL OIL & GAS CORP.
Automated Bit Performance Analysis
© 2011 Occidental Oil & Gas Corp.
10
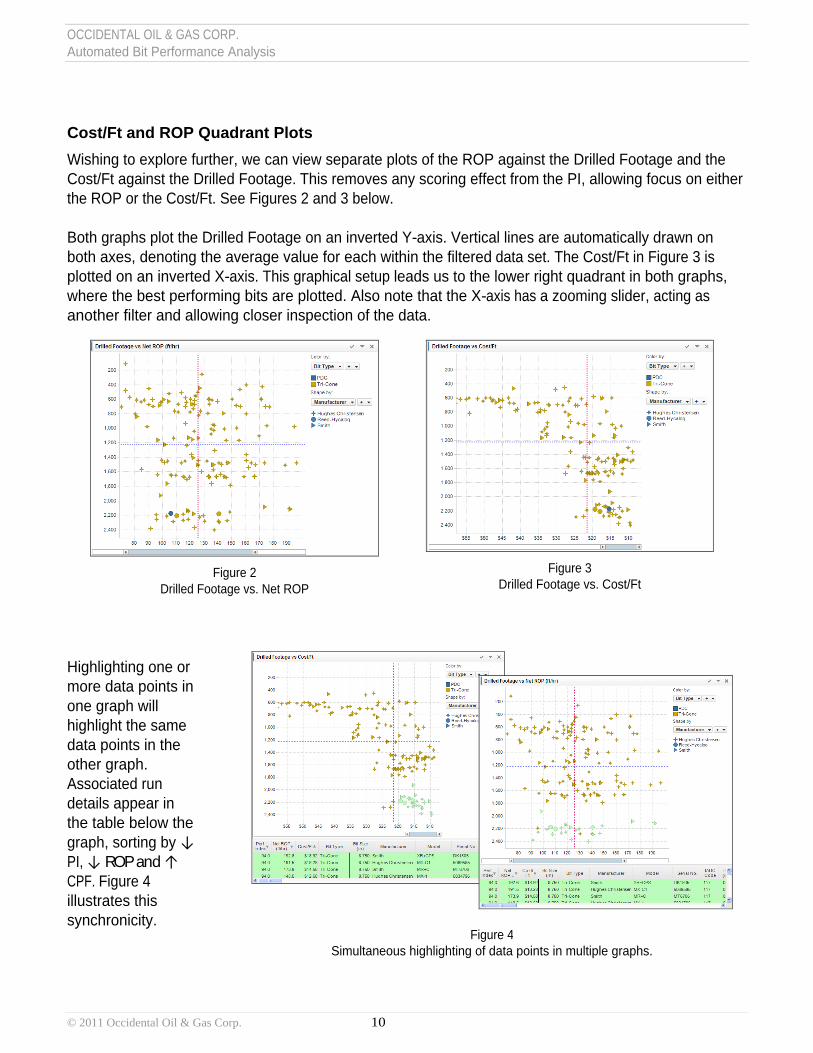
Cost/Ft and ROP Quadrant Plots
Wishing to explore further, we can view separate plots of the ROP against the Drilled Footage and the Cost/Ft against the Drilled Footage.
This removes any scoring effect from
the PI, allowing focus on either
the ROP or the Cost/Ft. See Figures 2 and 3 below.
Both graphs plot the Drilled Footage on an inverted Y-axis. Vertical lines are automatically drawn on both axes, denoting the average value for each within the filtered
data set. The Cost/Ft in Figure 3 is plotted on an inverted X-axis. This graphical setup leads us to the lower right quadrant in both graphs, where the best performing bits are plotted. Also note that the X-axis has a zooming slider, acting as another filter and allowing closer inspection of the data.
Highlighting one or more data points in one graph will highlight the same data points in the other graph.
Associated run details appear in the table below the graph, sorting by PI, ROP and CPF.
Figure 4 illustrates this synchronicity.
Figure 3
Drilled Footage vs. Cost/Ft
Figure 2
Drilled Footage vs. Net ROP
Figure 4
Simultaneous highlighting of data points in multiple graphs.
OCCIDENTAL OIL & GAS CORP.
Automated Bit Performance Analysis
© 2011 Occidental Oil & Gas Corp.
11
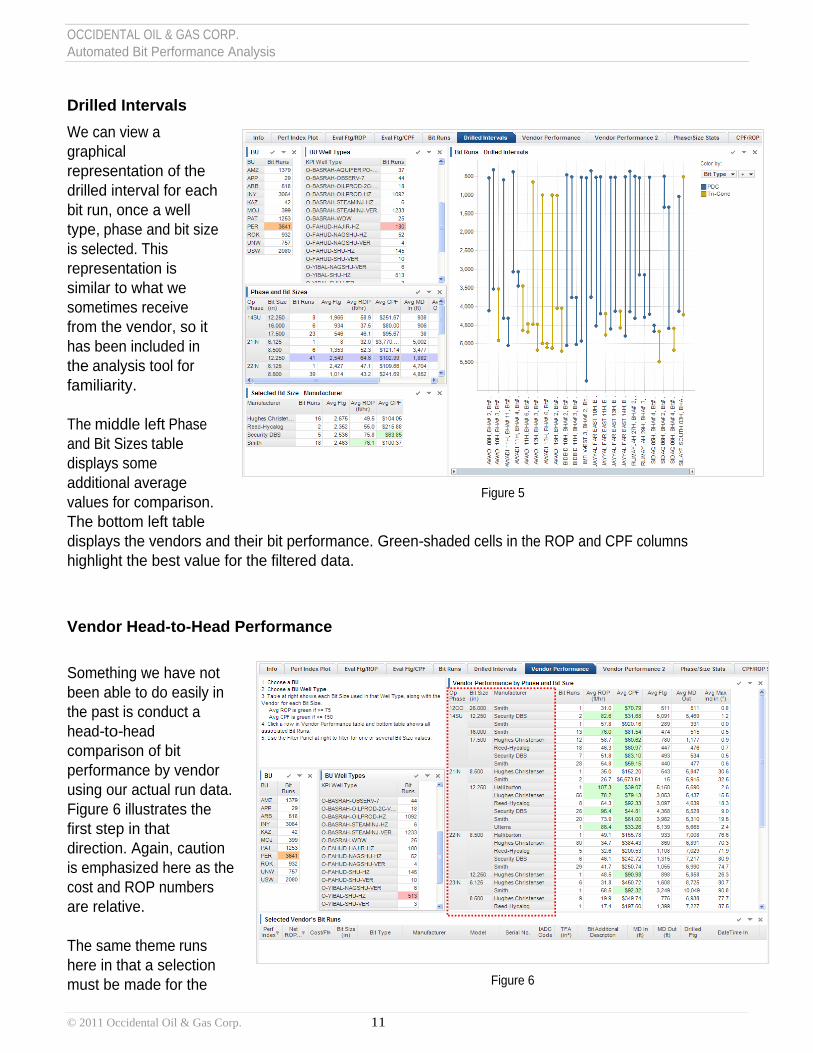
Drilled Intervals
We can view a graphical representation of the drilled interval for each bit run, once a well type,
phase and bit size
is selected. This representation is similar to what we sometimes receive from the vendor, so it has been included in the
analysis tool for familiarity.
The
middle left
Phase and Bit Sizes
table displays some additional average values for comparison. The bottom left table displays the vendors and their bit performance. Green-shaded cells in the ROP and CPF columns highlight the best value for the filtered data.
Vendor Head-to-Head Performance
Something we have not been able to do easily in the past is conduct a head-to-head comparison of bit performance by vendor using our actual run data. Figure 6 illustrates the first step in that direction. Again, caution is emphasized here as the cost and ROP numbers are relative.
The same theme
runs here in that a selection must be made for the
Figure 5
Figure 6
OCCIDENTAL OIL & GAS CORP.
Automated Bit Performance Analysis
© 2011 Occidental Oil & Gas Corp.
12
business unit and a well type. The cross-plot table in Figure 6
has three levels, highlighted by the dotted
red box: the hole section phase, the bit size, and the bit manufacturer.
Some color-coding logic
was
added in the Avg ROP
and Avg CPF
columns to shade green if the ROP >= 75 or the CPF <= 150. These
target values can be anything and were chosen as a starting point with the intent to
revise at a later
date.
Obviously, those lines with both cells shaded green indicate very good performance. Highlighting
any one line with a click will cause the lower table to populate the related bit runs for closer examination.
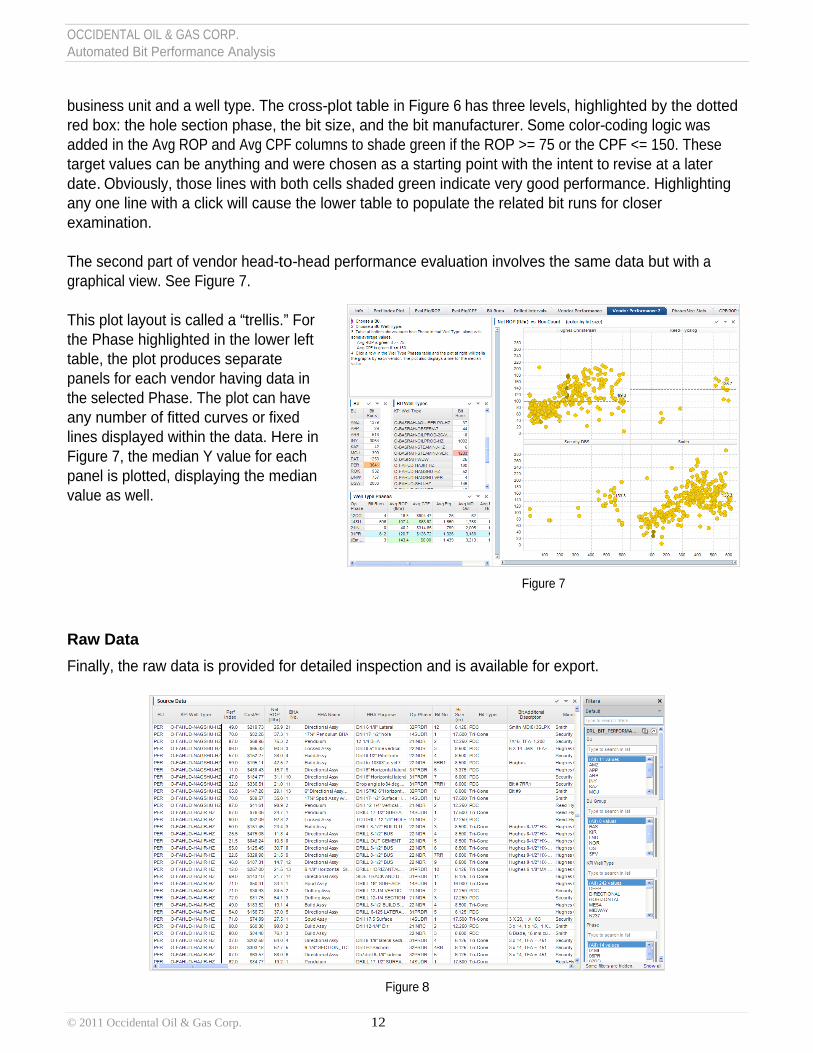
The second part of vendor head-to-head performance evaluation involves the same data but with a graphical view. See Figure 7.
This plot layout is called a “trellis.” For the Phase highlighted in the lower left table, the plot produces separate panels for each vendor having data in the selected Phase. The plot can have any number of fitted curves or fixed lines displayed within the data. Here in Figure 7, the median Y value for each panel is plotted, displaying the median value as well.
Raw Data
Finally, the raw data is provided for detailed inspection and is available for export.
Figure
8
Figure 7
OCCIDENTAL OIL & GAS CORP.
Automated Bit Performance Analysis
© 2011 Occidental Oil & Gas Corp.
13
Data Observations
Some imperfections in the data are noteworthy.
1.
Lithology and/or formation data is unavailable. Since this tool is not a “predictor,” this limitation is acceptable at present. However, we are currently working to get this information from other departments in-house.
2.
Some runs are assigned to non-drilling Phases, most likely due to input mistake or oversight. These runs are excluded for calculating the Drilled Footage Score in the PI.
3.
Bit serial numbers are not 100% reliable. Due to data input quality, we find instances where the same serial number appears for completely different bits.
4.
Bit model number values are not consistent for the same exact bit, though they may be close. Any searches/filtering using this must take data variations into account.
5.
Hrs Drill New Hole
value is relative. We get this value from the related daily time summary records, and they are typically rounded to the nearest ½-hour and do not exclude connection time.
Since this generality
is present across the entire data set, we accept that this value is relative yet still useful for analysis purposes.
6.
Bit
Run Cost
value is relative. The rig supervisor does not receive all of the invoices on location, so the reported daily cost is an estimate at best. Since this generality
is present across the entire data set, we accept that the cost value is relative but still useful for analysis purposes.
7.
Rig name is missing in some records.
8.
It would be good to know the type of mud motor run with
the bit; currently we only indicate the presence of any and the size.
9.
Max Inclination is not available for about 15% of the records.
10.
Recorded bit operating parameters during the run are not necessarily complete. Regardless, these values are still a good indicator of operating conditions.
11.
Some
materials and/or services may be purchased well in advance, thereby having an associated CPI that is not reflective of the year/month associated to the bit run. Extreme caution is emphasized here with these CPI-adjusted values.
12.
Calculation for the Drilled
Footage score
should probably be done at the regional level, the individual business unit level, or at a grouping of one or more well types within the business unit.

OCCIDENTAL OIL & GAS CORP.
Automated Bit Performance Analysis
© 2011 Occidental Oil & Gas Corp.
14
Summary
The Bit Performance Analysis Tool was developed as a look-back tool, not a predictor, in order to assist the engineer in selecting the best drill bit for a particular hole section of a particular well type. Its strength lies in the character of the data set –
that being entirely of local experience; hence, the tool
incorporates an intrinsic sense of familiarity.
Well types are completely controlled at the source, and can
be as broad or tight as desired.
The tool also contributes to improving the source data. Efforts have been undertaken to standardize certain nomenclature, remove variations in particular fields and fix the more obvious mistakes and omissions.
The calculated Cost/Ft and ROP values are relative, not exact, as the source data contains an inherent
diminished accuracy.
The ranking and weighting of the four parameters used to calculate the PI will probably change. Arguments favor the ROP being the top-weighted parameter
with
CPF falling
to second
place.
The scoring for each of the four PI parameters should be reviewed quarterly and adjusted to fit the growing data set
or changes in the well types.
There is potential for additional improvement in the PI calculation by applying different scoring formulas to CPF, ROP and Drilled Footage based upon the business unit’s overall statistics. For even better accuracy, scoring formulas could be driven down to the well type level for those well types that have a large enough data set.
Additional improvement of the tool would include a method to choose a group of offset wells, individually or collectively, and then view the various visualization pages confined to that set of wells only.
Finally, what remains is to conduct a case study where the tool would be used to select bits for a current drilling campaign. The outcome of such a study would, in all likelihood, bring out ideas for
practical improvements to the tool.
OCCIDENTAL OIL & GAS CORP.
Automated Bit Performance Analysis
© 2011 Occidental Oil & Gas Corp.
15
References
Macini, P., M. Magagni, and Pietro Valente. 2005. “Drill Bit Catalog and Bit Index: a New Method for Bit Performance Evaluation.” Paper SPE 94798-MS presented at the SPE Latin American and Caribbean Petroleum Engineering Conference, Rio de Janeiro, Brazil.
June 20-23. doi: 10.2118/94798-MS
Rach, Nina M. “Best Bits Go on Record.” E&P, March 2010, 65-68.
Amorim, Dalmo, Andrew Murdock, Carlos Huerta, Diogo Oliveira, Fabiola Diaz, Gustavo Padron, Willie
Columbine, and Wilson Iramina. 2008. “Ultra-stable PDC drill bit technology improves performance in Southern Mexico applications.” Drilling Contractor: 90-93.
Few, Stephen. Now You See It: Simple Visualization Techniques for Quantitative Analysis.
Oakland, California: Analytics Press, 2009.
Few, Stephen. Show Me the Numbers: Designing Tables and Graphs to Enlighten.
Oakland, California: Analytics Press, 2004.
Tufte, Edward. Visual Explanations: Images and Quantities, Evidence and Narrative. Cheshire, Connecticut: Graphics Press, 1997.
Bureau of Labor Statistics, U.S.
Department of Labor. “Consumer Price Index, All Urban Consumers.” Last modified January 11, 2011,
ftp://ftp.bls.gov/pub/special.requests/cpi/cpiai.txt.
InflationData.com. http://inflationdata.com/inflation/default.asp.
McCartney, Christopher. Directional Drilling Specialist, Performance Drilling Community of Practice leader, Occidental Oil & Gas Corporation.