Embed Size (px)
Citation preview
890 IEEE TRANSACTIONS ON ROBOTICS AND AUTOMATION, VOL. 18, NO. 6, DECEMBER 2002
Automated Flaw Detection in Aluminum CastingsBased on the Tracking of Potential Defects in a
Radioscopic Image SequenceDomingo Mery, Member, IEEE,and Dieter Filbert
Abstract—This paper presents a new method for inspectingaluminum castings automatically from a sequence of radioscopicimages taken at different positions of the casting. The classicimage-processing methods for flaw detection of aluminum castingsuse a bank of filters to generate an error-free reference image.This reference image is compared with the real radioscopicimage, and flaws are detected at the pixels where the differencebetween them is considerable. However, the configuration of eachfilter depends strongly on the size and shape of the structureof the casting under inspection. A new two-step technique isproposed to detect flaws automatically and that uses a singlefilter. First, the method identifies potential defects in each imageof the sequence, and second, it matches and tracks them fromimage to image. The key idea of this paper is to consider as falsealarms those potential defects which cannot be tracked in thesequence. The robustness and reliability of the method have beenverified on both real data in which synthetic flaws have beenadded and real radioscopic image sequences recorded from castaluminum wheels with known defects. Using this method, thereal defects can be detected with high certainty. This approachachieves good discrimination from false alarms.
Index Terms—Aluminum castings, automated inspection, com-puter vision, flaw detection, image segmentation, X-ray testing.
I. INTRODUCTION
RADIOSCOPY is increasingly being used as a tool for non-destructive testing in industrial production. An example is
the serial examination of cast light-alloy workpieces used in thecar industry, like aluminum wheels and steering gears [1]. Thematerial defects occurring in the casting process such as cavi-ties, gas, inclusions, and sponging must be detected to satisfythe safety requirements; consequently, it is necessary to check100% of the parts. Since most defects are not visible, X-rayimaging is used for this task. An example of a radioscopic imageis shown in Figs. 1 and 2.
Manuscript received December 5, 2000; revised February 21, 2002. Thispaper was recommended for publication by Associate Editor P. Allen andEditor S. Hutchinson upon evaluation of the reviewers’ comments. This workwas supported in part by the German Academic Exchange Service (DAAD),in part by the Technical University of Berlin, in part by YXLON InternationalX-Ray GmbH, Hamburg, and in part by the Universidad de Santiago de Chile,Santiago, Chile. This paper was presented in part at the 15th World Conferenceon Non-Destructive Testing, Rome, Italy, October 15–21, 2000.
D. Mery is with the Universidad de Santiago de Chile, Departamento de In-geniería Informática, Santiago, Chile (e-mail: [email protected]).
D. Filbert is with the Technische Universität Berlin, Fakultät IV Elek-trotechnik und Informatik, Institut für Energie- und Automatisierungstechnik,D-10587 Berlin, Germany (e-mail: [email protected]).
Digital Object Identifier 10.1109/TRA.2002.805646
Fig. 1. Radioscopic image of a casting (see zoom in Fig. 2).
Fig. 2. Zoom of Fig. 1 and gray level profile along three rows crossing defects.
Over the past decade, radioscopic systems have been intro-duced in the automotive manufacturing industry in order to
1042-296X/02$17.00 © 2002 IEEE
MERY AND FILBERT: AUTOMATED FLAW DETECTION IN ALUMINUM CASTINGS 891
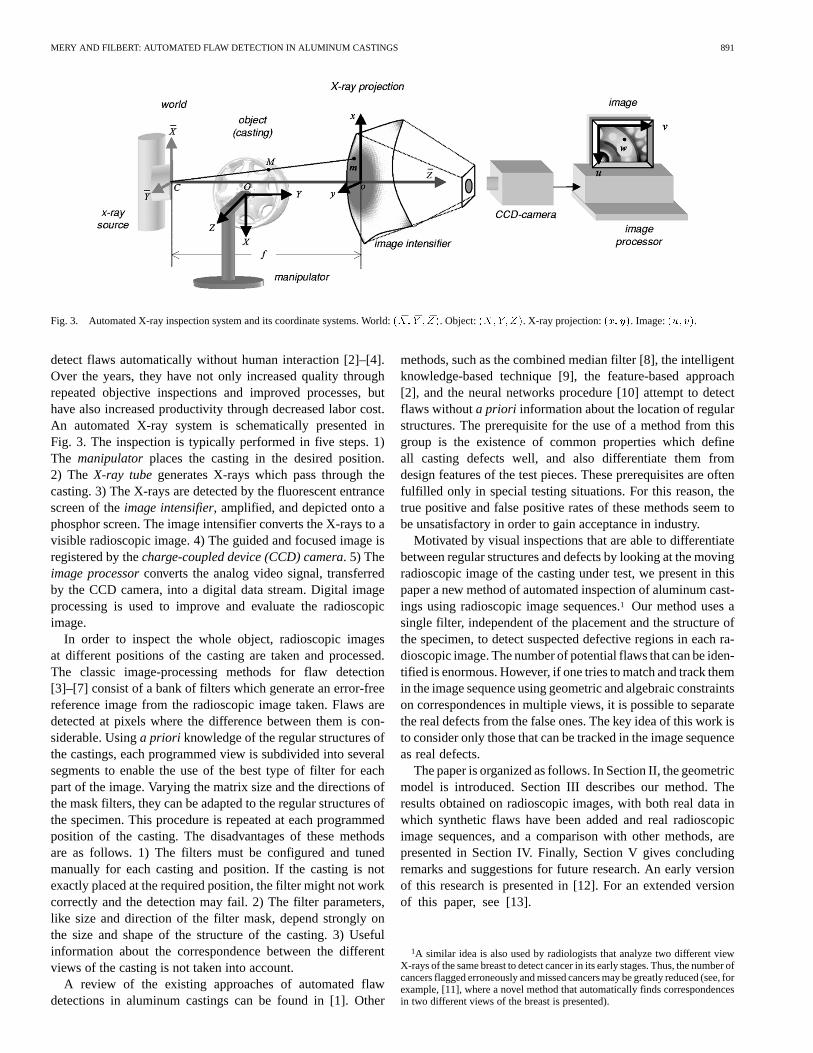
Fig. 3. Automated X-ray inspection system and its coordinate systems. World:( �X; �Y ; �Z). Object:(X;Y;Z). X-ray projection:(x; y). Image:(u; v).
detect flaws automatically without human interaction [2]–[4].Over the years, they have not only increased quality throughrepeated objective inspections and improved processes, buthave also increased productivity through decreased labor cost.An automated X-ray system is schematically presented inFig. 3. The inspection is typically performed in five steps. 1)The manipulator places the casting in the desired position.2) The X-ray tubegenerates X-rays which pass through thecasting. 3) The X-rays are detected by the fluorescent entrancescreen of theimage intensifier, amplified, and depicted onto aphosphor screen. The image intensifier converts the X-rays to avisible radioscopic image. 4) The guided and focused image isregistered by thecharge-coupled device (CCD) camera. 5) Theimage processorconverts the analog video signal, transferredby the CCD camera, into a digital data stream. Digital imageprocessing is used to improve and evaluate the radioscopicimage.
In order to inspect the whole object, radioscopic imagesat different positions of the casting are taken and processed.The classic image-processing methods for flaw detection[3]–[7] consist of a bank of filters which generate an error-freereference image from the radioscopic image taken. Flaws aredetected at pixels where the difference between them is con-siderable. Usinga priori knowledge of the regular structures ofthe castings, each programmed view is subdivided into severalsegments to enable the use of the best type of filter for eachpart of the image. Varying the matrix size and the directions ofthe mask filters, they can be adapted to the regular structures ofthe specimen. This procedure is repeated at each programmedposition of the casting. The disadvantages of these methodsare as follows. 1) The filters must be configured and tunedmanually for each casting and position. If the casting is notexactly placed at the required position, the filter might not workcorrectly and the detection may fail. 2) The filter parameters,like size and direction of the filter mask, depend strongly onthe size and shape of the structure of the casting. 3) Usefulinformation about the correspondence between the differentviews of the casting is not taken into account.
A review of the existing approaches of automated flawdetections in aluminum castings can be found in [1]. Other
methods, such as the combined median filter [8], the intelligentknowledge-based technique [9], the feature-based approach[2], and the neural networks procedure [10] attempt to detectflaws withouta priori information about the location of regularstructures. The prerequisite for the use of a method from thisgroup is the existence of common properties which defineall casting defects well, and also differentiate them fromdesign features of the test pieces. These prerequisites are oftenfulfilled only in special testing situations. For this reason, thetrue positive and false positive rates of these methods seem tobe unsatisfactory in order to gain acceptance in industry.
Motivated by visual inspections that are able to differentiatebetween regular structures and defects by looking at the movingradioscopic image of the casting under test, we present in thispaper a new method of automated inspection of aluminum cast-ings using radioscopic image sequences.1 Our method uses asingle filter, independent of the placement and the structure ofthe specimen, to detect suspected defective regions in each ra-dioscopic image. The number of potential flaws that can be iden-tified is enormous. However, if one tries to match and track themin the image sequence using geometric and algebraic constraintson correspondences in multiple views, it is possible to separatethe real defects from the false ones. The key idea of this work isto consider only those that can be tracked in the image sequenceas real defects.
The paper is organized as follows. In Section II, the geometricmodel is introduced. Section III describes our method. Theresults obtained on radioscopic images, with both real data inwhich synthetic flaws have been added and real radioscopicimage sequences, and a comparison with other methods, arepresented in Section IV. Finally, Section V gives concludingremarks and suggestions for future research. An early versionof this research is presented in [12]. For an extended versionof this paper, see [13].
1A similar idea is also used by radiologists that analyze two different viewX-rays of the same breast to detect cancer in its early stages. Thus, the number ofcancers flagged erroneously and missed cancers may be greatly reduced (see, forexample, [11], where a novel method that automatically finds correspondencesin two different views of the breast is presented).
892 IEEE TRANSACTIONS ON ROBOTICS AND AUTOMATION, VOL. 18, NO. 6, DECEMBER 2002
II. GEOMETRICMODEL OF THERADIOSCOPICSYSTEM
In this section, a model is presented which relates thethree-dimensional (3-D) coordinates of the casting (object), tothe 2-D coordinates of the radioscopic image pixel. Additionally,we establish the geometric and algebraic constraints betweentwo and three radioscopic images taken at different positionsof the object. Finally, the problem of 3-D reconstruction usinga least-squares technique is described.
Since the X-ray images are taken atdifferent positions ofthe object, an index , , is used to denote theposition of the object. It is assumed that the imaging systemis calibrated (for details, see Appendix A).
A. Coordinate Systems
One can define the following coordinate systems to describethe relationship between the 3-D object point and the 2-D pixel,as shown in Fig. 3.
The 3-Dobject coordinate systemis attached to the object.An object 3-D point in this coordinate system is denoted by
in projective coordinates.2 The center ofrotation of the object is assumed at the originof this coordi-nate system. The motion of the object is considered as a rotationaround the origin, followed by a translation. The coordinates of
in the object coordinate system are independent of the objectdisplacement, i.e., .
The 3-Dworld coordinate systemis defined in the opticalcenter of the central projection, i.e., its origin correspondsto the X-ray source. The object point at position in thiscoordinate system is in projective coordi-nates. The object coordinate system is then considered as a rigiddisplacement of the world coordinate system represented by a3 3 rotation matrix and a 3 1 translation vector [14].With the 4 4 matrix
(1)
one obtains the relationship between object and world coordi-nate system
(2)
Now, a 2-DX-ray projection coordinate systemis definedthat indicates the coordinates of a point in the (not visible) X-rayimage at a fictitious plane located at the entrance screenof the image intensifier. Its origin is pierced by the axis.The X-rays make a linear perspective projection of the pointonto a point (at position ) in the fictitious plane without anydistortion. Applying Thales’ theorem, the projective coordinatesof in this 2-D system are , with
and . Using and as projective
2We use the notation of Faugeras [14], where we differentiate between theprojective geometric objects themselves and their representations (e.g., a pointin the space will be denoted byM , whereas its vector in projective coordinateswill be denoted byM).
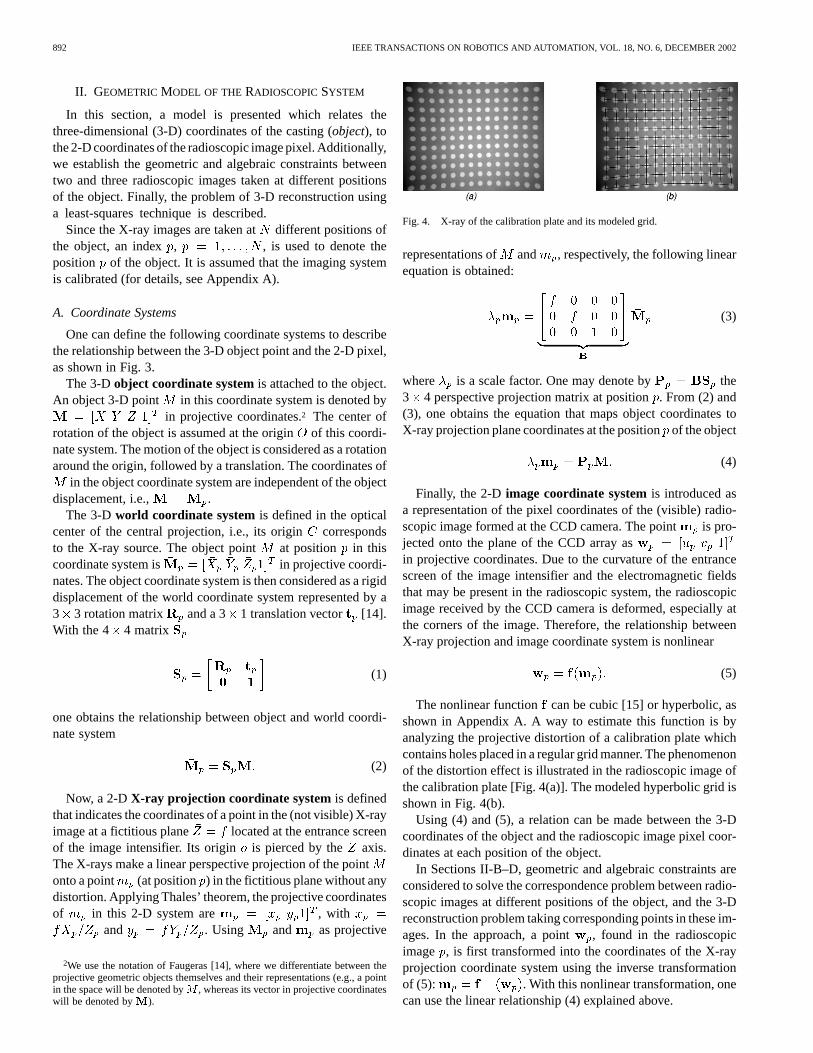
Fig. 4. X-ray of the calibration plate and its modeled grid.
representations of and , respectively, the following linearequation is obtained:
(3)
where is a scale factor. One may denote by the3 4 perspective projection matrix at position. From (2) and(3), one obtains the equation that maps object coordinates toX-ray projection plane coordinates at the positionof the object
(4)
Finally, the 2-Dimage coordinate systemis introduced asa representation of the pixel coordinates of the (visible) radio-scopic image formed at the CCD camera. The pointis pro-jected onto the plane of the CCD array asin projective coordinates. Due to the curvature of the entrancescreen of the image intensifier and the electromagnetic fieldsthat may be present in the radioscopic system, the radioscopicimage received by the CCD camera is deformed, especially atthe corners of the image. Therefore, the relationship betweenX-ray projection and image coordinate system is nonlinear
(5)
The nonlinear function can be cubic [15] or hyperbolic, asshown in Appendix A. A way to estimate this function is byanalyzing the projective distortion of a calibration plate whichcontains holes placed in a regular grid manner. The phenomenonof the distortion effect is illustrated in the radioscopic image ofthe calibration plate [Fig. 4(a)]. The modeled hyperbolic grid isshown in Fig. 4(b).
Using (4) and (5), a relation can be made between the 3-Dcoordinates of the object and the radioscopic image pixel coor-dinates at each position of the object.
In Sections II-B–D, geometric and algebraic constraints areconsidered to solve the correspondence problem between radio-scopic images at different positions of the object, and the 3-Dreconstruction problem taking corresponding points in these im-ages. In the approach, a point , found in the radioscopicimage , is first transformed into the coordinates of the X-rayprojection coordinate system using the inverse transformationof (5): . With this nonlinear transformation, onecan use the linear relationship (4) explained above.
MERY AND FILBERT: AUTOMATED FLAW DETECTION IN ALUMINUM CASTINGS 893
Fig. 5. Epipolar geometry between two views.
B. Correspondence Between Two Views
Now, the correspondence between two pointsand (inthe X-ray projection coordinate system) is considered. The firstone is obtained by projecting the object pointat position ,and the second one at position.
To solve the problem of the correspondence, we use epipolargeometry [14]. The epipolar constraint is well known in stereovision. For each projection point at the position ofthe object, its corresponding projection point at the position
of the object lies on the epipolar lineof , as shown inFig. 5, where and are the centers of projectionsand, respectively. In this representation, a rotation and translation
relative to the object coordinate system is assumed. The epipolarline can be calculated as the projection of line bythe center of projection in projection plane . After somemanipulations, one obtains the linear relationship
(6)
where is the well-known 3 3 fundamental matrix betweenprojections and , which depends only on perspective projec-tion matrices and [16].
C. Correspondence Between Three Views
Given three points , , and (at positions , and, respectively), the projection of the corresponding 3-D point
into the three views may be expressed as a single matrixequation using (4) [16]
(7)
If , , and are corresponding points, then there existsa nontrivial solution of in (7). It follows that any 7 7 minorof the 9 7 matrix has a zero determinant. This conditionleads to four independent trilinear relationships (Shashua’strilinearities), between the vectors , , and . Usinga structure called thetrifocal tensor, which depends onlyon perspective projection matrices , , and , one can
directly compute the coordinates of the third point , giventhe points and .
D. 3-D Reconstruction From Two or More Views
It is assumed that there are projections (at differentpositions), in which the corresponding points, ,with coordinates are presented. To reconstruct thecorresponding 3-D point that may have produced theseprojection points, (4) is used in each position: .Each projection yields three linear equations in the unknowns
, , , and . After some slight rearranging, one obtainsan overdetermined system, which can be solved forusing a least-squares technique [14].
III. A UTOMATED DETECTION OFFLAWS
The method to automated flaw detection presented here hasbasically two steps:identification and tracking of potentialflaws. They will be described in this section.
A. Identification of Potential Flaws
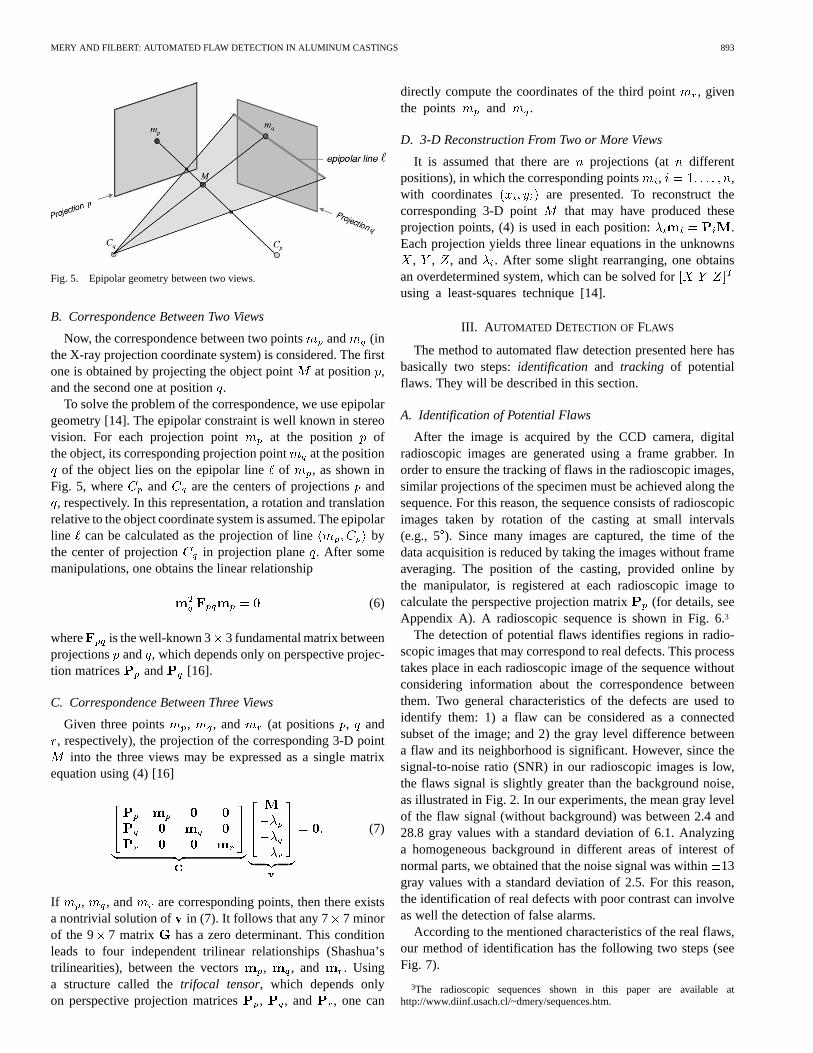
After the image is acquired by the CCD camera, digitalradioscopic images are generated using a frame grabber. Inorder to ensure the tracking of flaws in the radioscopic images,similar projections of the specimen must be achieved along thesequence. For this reason, the sequence consists of radioscopicimages taken by rotation of the casting at small intervals(e.g., 5). Since many images are captured, the time of thedata acquisition is reduced by taking the images without frameaveraging. The position of the casting, provided online bythe manipulator, is registered at each radioscopic image tocalculate the perspective projection matrix (for details, seeAppendix A). A radioscopic sequence is shown in Fig. 6.3
The detection of potential flaws identifies regions in radio-scopic images that may correspond to real defects. This processtakes place in each radioscopic image of the sequence withoutconsidering information about the correspondence betweenthem. Two general characteristics of the defects are used toidentify them: 1) a flaw can be considered as a connectedsubset of the image; and 2) the gray level difference betweena flaw and its neighborhood is significant. However, since thesignal-to-noise ratio (SNR) in our radioscopic images is low,the flaws signal is slightly greater than the background noise,as illustrated in Fig. 2. In our experiments, the mean gray levelof the flaw signal (without background) was between 2.4 and28.8 gray values with a standard deviation of 6.1. Analyzinga homogeneous background in different areas of interest ofnormal parts, we obtained that the noise signal was within13gray values with a standard deviation of 2.5. For this reason,the identification of real defects with poor contrast can involveas well the detection of false alarms.
According to the mentioned characteristics of the real flaws,our method of identification has the following two steps (seeFig. 7).
3The radioscopic sequences shown in this paper are available athttp://www.diinf.usach.cl/~dmery/sequences.htm.
894 IEEE TRANSACTIONS ON ROBOTICS AND AUTOMATION, VOL. 18, NO. 6, DECEMBER 2002
Fig. 6. Radioscopic sequence with three flaws (image 5 is shown in Fig. 2).
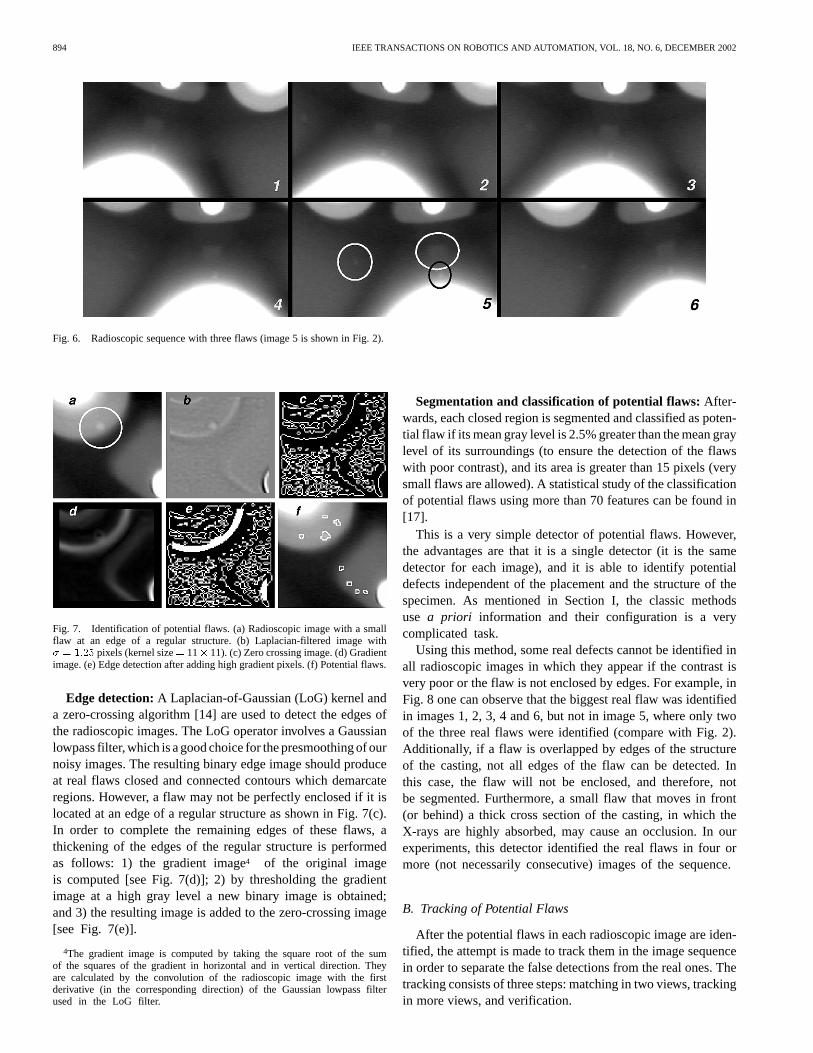
Fig. 7. Identification of potential flaws. (a) Radioscopic image with a smallflaw at an edge of a regular structure. (b) Laplacian-filtered image with� = 1:25 pixels (kernel size= 11� 11). (c) Zero crossing image. (d) Gradientimage. (e) Edge detection after adding high gradient pixels. (f) Potential flaws.
Edge detection:A Laplacian-of-Gaussian (LoG) kernel anda zero-crossing algorithm [14] are used to detect the edges ofthe radioscopic images. The LoG operator involves a Gaussianlowpass filter, which is a good choice for the presmoothing of ournoisy images. The resulting binary edge image should produceat real flaws closed and connected contours which demarcateregions. However, a flaw may not be perfectly enclosed if it islocated at an edge of a regular structure as shown in Fig. 7(c).In order to complete the remaining edges of these flaws, athickening of the edges of the regular structure is performedas follows: 1) the gradient image4 of the original imageis computed [see Fig. 7(d)]; 2) by thresholding the gradientimage at a high gray level a new binary image is obtained;and 3) the resulting image is added to the zero-crossing image[see Fig. 7(e)].
4The gradient image is computed by taking the square root of the sumof the squares of the gradient in horizontal and in vertical direction. Theyare calculated by the convolution of the radioscopic image with the firstderivative (in the corresponding direction) of the Gaussian lowpass filterused in the LoG filter.
Segmentation and classification of potential flaws:After-wards, each closed region is segmented and classified as poten-tial flaw if its mean gray level is 2.5% greater than the mean graylevel of its surroundings (to ensure the detection of the flawswith poor contrast), and its area is greater than 15 pixels (verysmall flaws are allowed). A statistical study of the classificationof potential flaws using more than 70 features can be found in[17].
This is a very simple detector of potential flaws. However,the advantages are that it is a single detector (it is the samedetector for each image), and it is able to identify potentialdefects independent of the placement and the structure of thespecimen. As mentioned in Section I, the classic methodsuse a priori information and their configuration is a verycomplicated task.
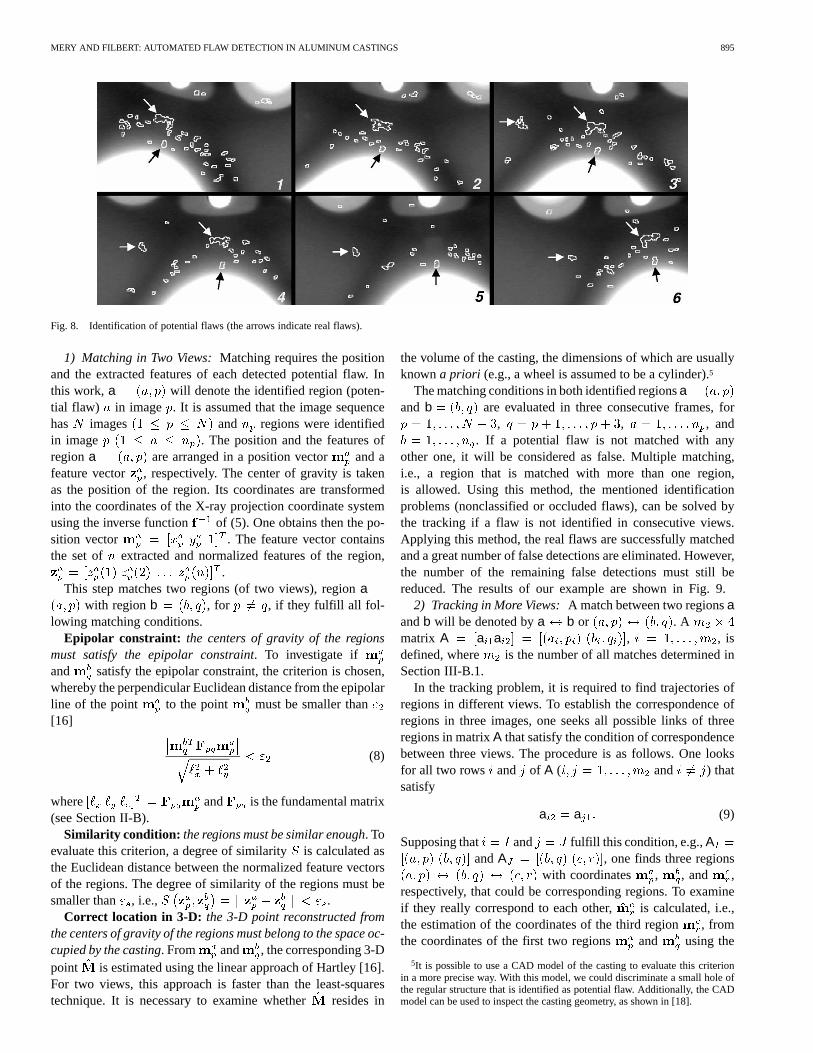
Using this method, some real defects cannot be identified inall radioscopic images in which they appear if the contrast isvery poor or the flaw is not enclosed by edges. For example, inFig. 8 one can observe that the biggest real flaw was identifiedin images 1, 2, 3, 4 and 6, but not in image 5, where only twoof the three real flaws were identified (compare with Fig. 2).Additionally, if a flaw is overlapped by edges of the structureof the casting, not all edges of the flaw can be detected. Inthis case, the flaw will not be enclosed, and therefore, notbe segmented. Furthermore, a small flaw that moves in front(or behind) a thick cross section of the casting, in which theX-rays are highly absorbed, may cause an occlusion. In ourexperiments, this detector identified the real flaws in four ormore (not necessarily consecutive) images of the sequence.
B. Tracking of Potential Flaws
After the potential flaws in each radioscopic image are iden-tified, the attempt is made to track them in the image sequencein order to separate the false detections from the real ones. Thetracking consists of three steps: matching in two views, trackingin more views, and verification.
MERY AND FILBERT: AUTOMATED FLAW DETECTION IN ALUMINUM CASTINGS 895
Fig. 8. Identification of potential flaws (the arrows indicate real flaws).
1) Matching in Two Views:Matching requires the positionand the extracted features of each detected potential flaw. Inthis work,a will denote the identified region (poten-tial flaw) in image . It is assumed that the image sequencehas images and regions were identifiedin image . The position and the features ofregiona are arranged in a position vector and afeature vector , respectively. The center of gravity is takenas the position of the region. Its coordinates are transformedinto the coordinates of the X-ray projection coordinate systemusing the inverse function of (5). One obtains then the po-sition vector . The feature vector containsthe set of extracted and normalized features of the region,
.This step matches two regions (of two views), regiona
with regionb , for , if they fulfill all fol-lowing matching conditions.
Epipolar constraint: the centers of gravity of the regionsmust satisfy the epipolar constraint. To investigate ifand satisfy the epipolar constraint, the criterion is chosen,whereby the perpendicular Euclidean distance from the epipolarline of the point to the point must be smaller than[16]
(8)
where and is the fundamental matrix(see Section II-B).
Similarity condition: the regions must be similar enough. Toevaluate this criterion, a degree of similarityis calculated asthe Euclidean distance between the normalized feature vectorsof the regions. The degree of similarity of the regions must besmaller than , i.e., .
Correct location in 3-D: the 3-D point reconstructed fromthe centers of gravity of the regions must belong to the space oc-cupied by the casting. From and , the corresponding 3-Dpoint is estimated using the linear approach of Hartley [16].For two views, this approach is faster than the least-squarestechnique. It is necessary to examine whetherresides in
the volume of the casting, the dimensions of which are usuallyknowna priori (e.g., a wheel is assumed to be a cylinder).5
The matching conditions in both identified regionsaand b are evaluated in three consecutive frames, for
, , , and. If a potential flaw is not matched with any
other one, it will be considered as false. Multiple matching,i.e., a region that is matched with more than one region,is allowed. Using this method, the mentioned identificationproblems (nonclassified or occluded flaws), can be solved bythe tracking if a flaw is not identified in consecutive views.Applying this method, the real flaws are successfully matchedand a great number of false detections are eliminated. However,the number of the remaining false detections must still bereduced. The results of our example are shown in Fig. 9.
2) Tracking in More Views:A match between two regionsaandb will be denoted bya b or . Amatrix A a a , , isdefined, where is the number of all matches determined inSection III-B.1.
In the tracking problem, it is required to find trajectories ofregions in different views. To establish the correspondence ofregions in three images, one seeks all possible links of threeregions in matrixA that satisfy the condition of correspondencebetween three views. The procedure is as follows. One looksfor all two rows and of A ( and ) thatsatisfy
a a (9)
Supposing that and fulfill this condition, e.g.,AandA , one finds three regions
with coordinates , , and ,respectively, that could be corresponding regions. To examineif they really correspond to each other, is calculated, i.e.,the estimation of the coordinates of the third region, fromthe coordinates of the first two regions and using the
5It is possible to use a CAD model of the casting to evaluate this criterionin a more precise way. With this model, we could discriminate a small hole ofthe regular structure that is identified as potential flaw. Additionally, the CADmodel can be used to inspect the casting geometry, as shown in [18].
896 IEEE TRANSACTIONS ON ROBOTICS AND AUTOMATION, VOL. 18, NO. 6, DECEMBER 2002
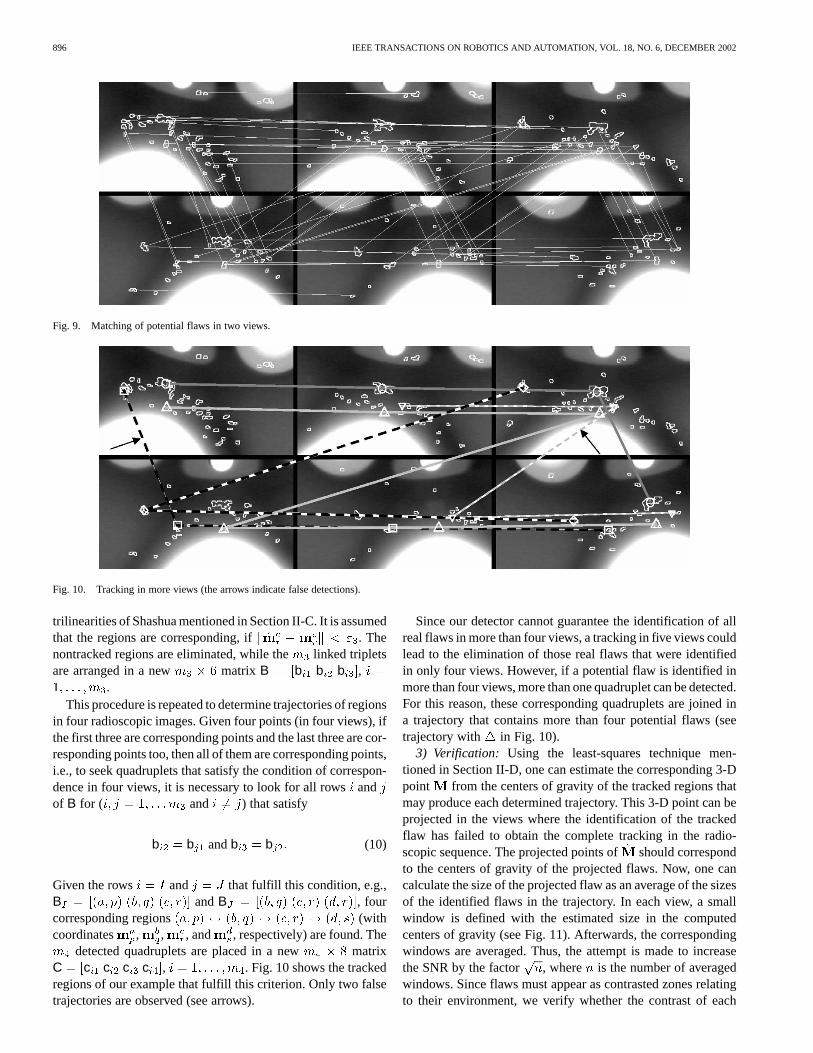
Fig. 9. Matching of potential flaws in two views.
Fig. 10. Tracking in more views (the arrows indicate false detections).
trilinearities of Shashua mentioned in Section II-C. It is assumedthat the regions are corresponding, if . Thenontracked regions are eliminated, while the linked tripletsare arranged in a new matrix B b b b ,
.This procedure is repeated to determine trajectories of regions
in four radioscopic images. Given four points (in four views), ifthe first three are corresponding points and the last three are cor-responding points too, then all of them are corresponding points,i.e., to seek quadruplets that satisfy the condition of correspon-dence in four views, it is necessary to look for all rowsandof B for ( and ) that satisfy
b b andb b (10)
Given the rows and that fulfill this condition, e.g.,B andB , fourcorresponding regions (withcoordinates , , , and , respectively) are found. The
detected quadruplets are placed in a new matrixC c c c c , . Fig. 10 shows the trackedregions of our example that fulfill this criterion. Only two falsetrajectories are observed (see arrows).
Since our detector cannot guarantee the identification of allreal flaws in more than four views, a tracking in five views couldlead to the elimination of those real flaws that were identifiedin only four views. However, if a potential flaw is identified inmore than four views, more than one quadruplet can be detected.For this reason, these corresponding quadruplets are joined ina trajectory that contains more than four potential flaws (seetrajectory with in Fig. 10).
3) Verification: Using the least-squares technique men-tioned in Section II-D, one can estimate the corresponding 3-Dpoint from the centers of gravity of the tracked regions thatmay produce each determined trajectory. This 3-D point can beprojected in the views where the identification of the trackedflaw has failed to obtain the complete tracking in the radio-scopic sequence. The projected points ofshould correspondto the centers of gravity of the projected flaws. Now, one cancalculate the size of the projected flaw as an average of the sizesof the identified flaws in the trajectory. In each view, a smallwindow is defined with the estimated size in the computedcenters of gravity (see Fig. 11). Afterwards, the correspondingwindows are averaged. Thus, the attempt is made to increasethe SNR by the factor , where is the number of averagedwindows. Since flaws must appear as contrasted zones relatingto their environment, we verify whether the contrast of each
MERY AND FILBERT: AUTOMATED FLAW DETECTION IN ALUMINUM CASTINGS 897
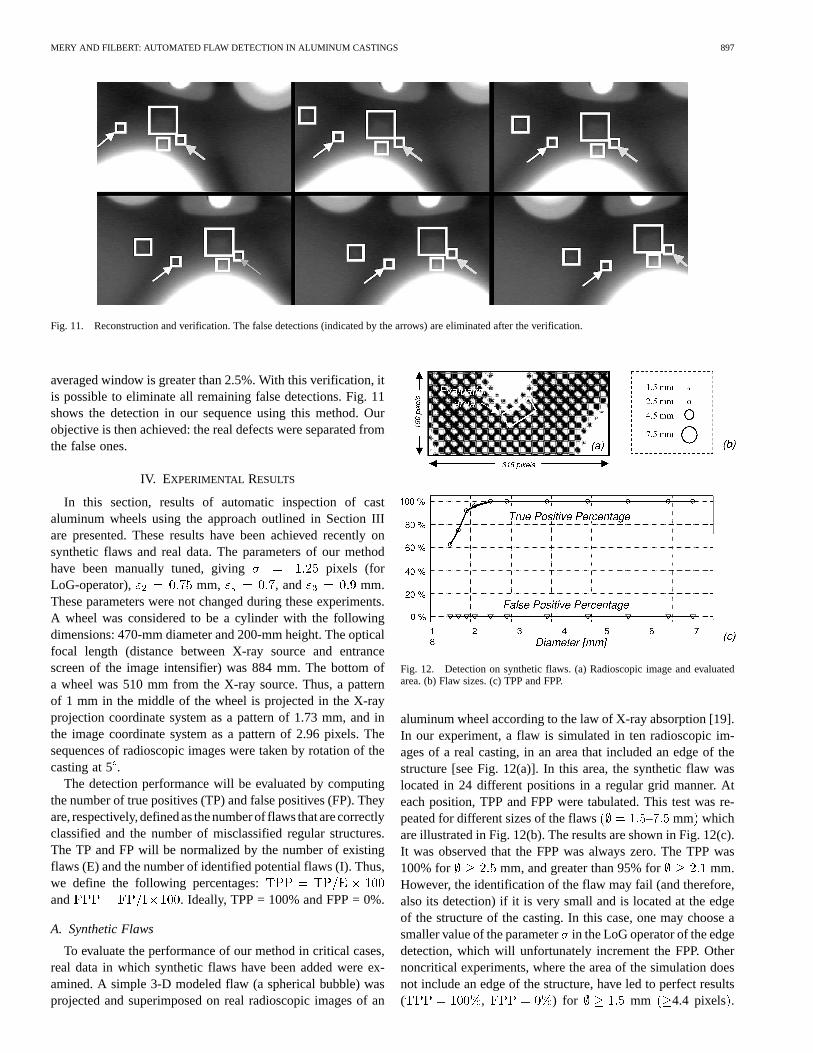
Fig. 11. Reconstruction and verification. The false detections (indicated by the arrows) are eliminated after the verification.
averaged window is greater than 2.5%. With this verification, itis possible to eliminate all remaining false detections. Fig. 11shows the detection in our sequence using this method. Ourobjective is then achieved: the real defects were separated fromthe false ones.
IV. EXPERIMENTAL RESULTS
In this section, results of automatic inspection of castaluminum wheels using the approach outlined in Section IIIare presented. These results have been achieved recently onsynthetic flaws and real data. The parameters of our methodhave been manually tuned, giving pixels (forLoG-operator), mm, , and mm.These parameters were not changed during these experiments.A wheel was considered to be a cylinder with the followingdimensions: 470-mm diameter and 200-mm height. The opticalfocal length (distance between X-ray source and entrancescreen of the image intensifier) was 884 mm. The bottom ofa wheel was 510 mm from the X-ray source. Thus, a patternof 1 mm in the middle of the wheel is projected in the X-rayprojection coordinate system as a pattern of 1.73 mm, and inthe image coordinate system as a pattern of 2.96 pixels. Thesequences of radioscopic images were taken by rotation of thecasting at 5.
The detection performance will be evaluated by computingthe number of true positives (TP) and false positives (FP). Theyare, respectively,defined as the number of flaws thatare correctlyclassified and the number of misclassified regular structures.The TP and FP will be normalized by the number of existingflaws (E) and the number of identified potential flaws (I). Thus,we define the following percentages:and . Ideally, TPP = 100% and FPP = 0%.
A. Synthetic Flaws
To evaluate the performance of our method in critical cases,real data in which synthetic flaws have been added were ex-amined. A simple 3-D modeled flaw (a spherical bubble) wasprojected and superimposed on real radioscopic images of an
Fig. 12. Detection on synthetic flaws. (a) Radioscopic image and evaluatedarea. (b) Flaw sizes. (c) TPP and FPP.
aluminum wheel according to the law of X-ray absorption [19].In our experiment, a flaw is simulated in ten radioscopic im-ages of a real casting, in an area that included an edge of thestructure [see Fig. 12(a)]. In this area, the synthetic flaw waslocated in 24 different positions in a regular grid manner. Ateach position, TPP and FPP were tabulated. This test was re-peated for different sizes of the flaws – mm whichare illustrated in Fig. 12(b). The results are shown in Fig. 12(c).It was observed that the FPP was always zero. The TPP was100% for mm, and greater than 95% for mm.However, the identification of the flaw may fail (and therefore,also its detection) if it is very small and is located at the edgeof the structure of the casting. In this case, one may choose asmaller value of the parameterin the LoG operator of the edgedetection, which will unfortunately increment the FPP. Othernoncritical experiments, where the area of the simulation doesnot include an edge of the structure, have led to perfect results( , ) for mm 4.4 pixels.
898 IEEE TRANSACTIONS ON ROBOTICS AND AUTOMATION, VOL. 18, NO. 6, DECEMBER 2002
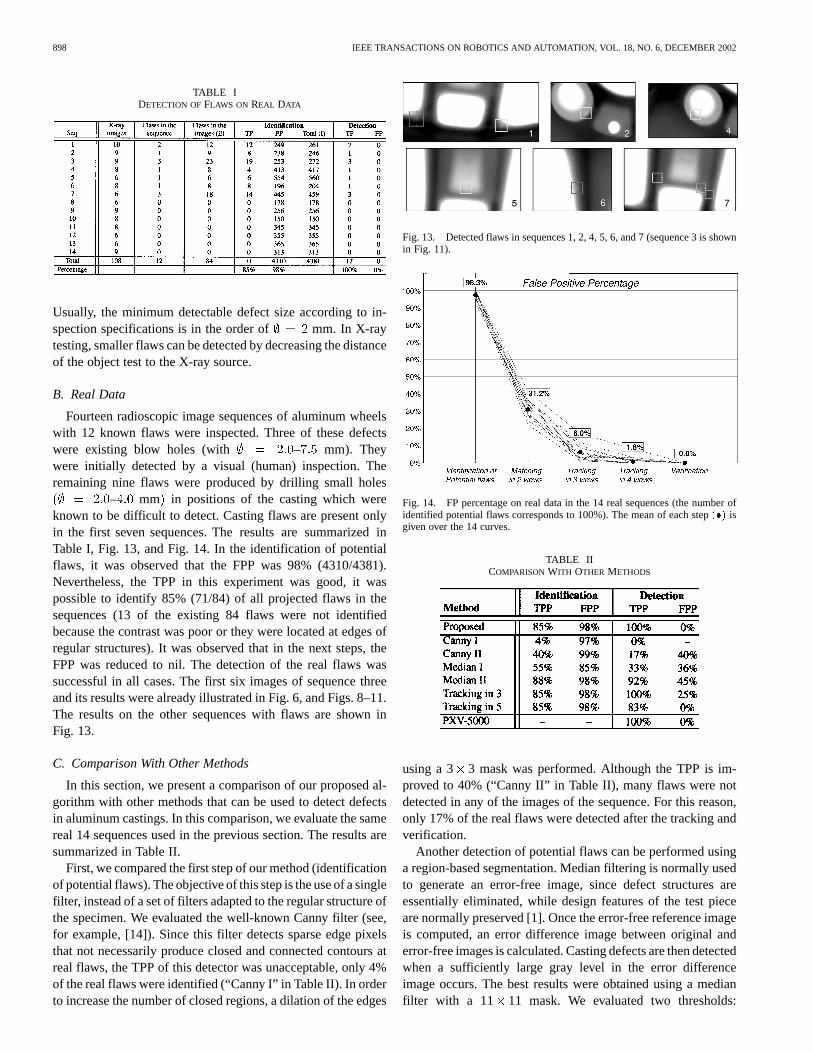
TABLE IDETECTION OFFLAWS ON REAL DATA
Usually, the minimum detectable defect size according to in-spection specifications is in the order of mm. In X-raytesting, smaller flaws can be detected by decreasing the distanceof the object test to the X-ray source.
B. Real Data
Fourteen radioscopic image sequences of aluminum wheelswith 12 known flaws were inspected. Three of these defectswere existing blow holes (with – mm). Theywere initially detected by a visual (human) inspection. Theremaining nine flaws were produced by drilling small holes
– mm in positions of the casting which wereknown to be difficult to detect. Casting flaws are present onlyin the first seven sequences. The results are summarized inTable I, Fig. 13, and Fig. 14. In the identification of potentialflaws, it was observed that the FPP was 98% (4310/4381).Nevertheless, the TPP in this experiment was good, it waspossible to identify 85% (71/84) of all projected flaws in thesequences (13 of the existing 84 flaws were not identifiedbecause the contrast was poor or they were located at edges ofregular structures). It was observed that in the next steps, theFPP was reduced to nil. The detection of the real flaws wassuccessful in all cases. The first six images of sequence threeand its results were already illustrated in Fig. 6, and Figs. 8–11.The results on the other sequences with flaws are shown inFig. 13.
C. Comparison With Other Methods
In this section, we present a comparison of our proposed al-gorithm with other methods that can be used to detect defectsin aluminum castings. In this comparison, we evaluate the samereal 14 sequences used in the previous section. The results aresummarized in Table II.
First, we compared the first step of our method (identificationof potential flaws). The objective of this step is the use of a singlefilter, instead of a set of filters adapted to the regular structure ofthe specimen. We evaluated the well-known Canny filter (see,for example, [14]). Since this filter detects sparse edge pixelsthat not necessarily produce closed and connected contours atreal flaws, the TPP of this detector was unacceptable, only 4%of the real flaws were identified (“Canny I” in Table II). In orderto increase the number of closed regions, a dilation of the edges
Fig. 13. Detected flaws in sequences 1, 2, 4, 5, 6, and 7 (sequence 3 is shownin Fig. 11).
Fig. 14. FP percentage on real data in the 14 real sequences (the number ofidentified potential flaws corresponds to 100%). The mean of each step(�) isgiven over the 14 curves.
TABLE IICOMPARISONWITH OTHER METHODS
using a 3 3 mask was performed. Although the TPP is im-proved to 40% (“Canny II” in Table II), many flaws were notdetected in any of the images of the sequence. For this reason,only 17% of the real flaws were detected after the tracking andverification.
Another detection of potential flaws can be performed usinga region-based segmentation. Median filtering is normally usedto generate an error-free image, since defect structures areessentially eliminated, while design features of the test pieceare normally preserved [1]. Once the error-free reference imageis computed, an error difference image between original anderror-free images is calculated. Casting defects are then detectedwhen a sufficiently large gray level in the error differenceimage occurs. The best results were obtained using a medianfilter with a 11 11 mask. We evaluated two thresholds:
MERY AND FILBERT: AUTOMATED FLAW DETECTION IN ALUMINUM CASTINGS 899
and by 256 gray levels (see “Median I” and“Median II” in Table II). In the first case, the TPP was only55%. By decreasing the threshold value, we increased theTPP to 88%, that is slightly better than our detector (85%).However, systematic false alarms were detected at the cornersof the regular structures. Since these false alarms satisfy themultifocal conditions, they can be tracked in the sequence.For this reason, this detector can only be used if the medianfilter is adapted to the regular structures of the specimen usinga priori information. Normally, a set of median filters is usedfor each radioscopic image [3], [4], [6].
In order to evaluate the second step of our method (trackingof potential flaws), we tested the method by tracking thepotential flaws in three and in five views, instead of fourviews (see “Tracking in 3,” “Tracking in 5,” and “Proposed”in Table II). By considering only three views, we obtained somany false alarms that the verification step detected four falsealarms (25%). In the other case, by tracking the potential flawsin five views, real flaws that were segmented in only four viewsof the sequences were not tracked. For this reason, only 83%of the real flaws were detected.
Finally, we inspected the test castings using a classicimage-processing method (see explanation in Section I). Inour experiments, we used the industrial software PXV-5000[5], [7]. The results were excellent: 100% of the real flawswere detected without false alarms. As a result of its peakdetection performance, the classic image-processing methodshave become most widely established in industrial applica-tions. However, these methods suffer from the complicatedconfiguration of the filtering, which is tailored to the testpiece. In our experiments, the configuration process has takentwo weeks. On the contrary, since our method requires onlya few number of parameters, the configuration could be donein hours.
V. SUMMARY
A new method for automated flaw detection in aluminumcastings using multiple view geometry has been developed. Ourmethod is very efficient because it is based on a two-step anal-ysis: identification and tracking. The idea was to try to imi-tate the way a human inspector inspects radioscopic images.First relevant details (potential defects) are detected, followedby tracking them in the radioscopic image sequence. In this way,the false detections can be eliminated without discriminating thereal flaws.
The great advantage of our first step is the use of a singlefilter to identify potential defects, which is independent of thestructure of the specimen. Nevertheless, its disadvantages arethe false positive percentage is enormous, the true positive per-centage could be poor if the flaws to be detected are very smalland located at the edge of a structure, and the identification ofregions is time consuming. Contrarily, the second step is highlyefficient in both discrimination of false detections and trackingof real defects, and is not time consuming, due to the use of themultiple-view tensors.
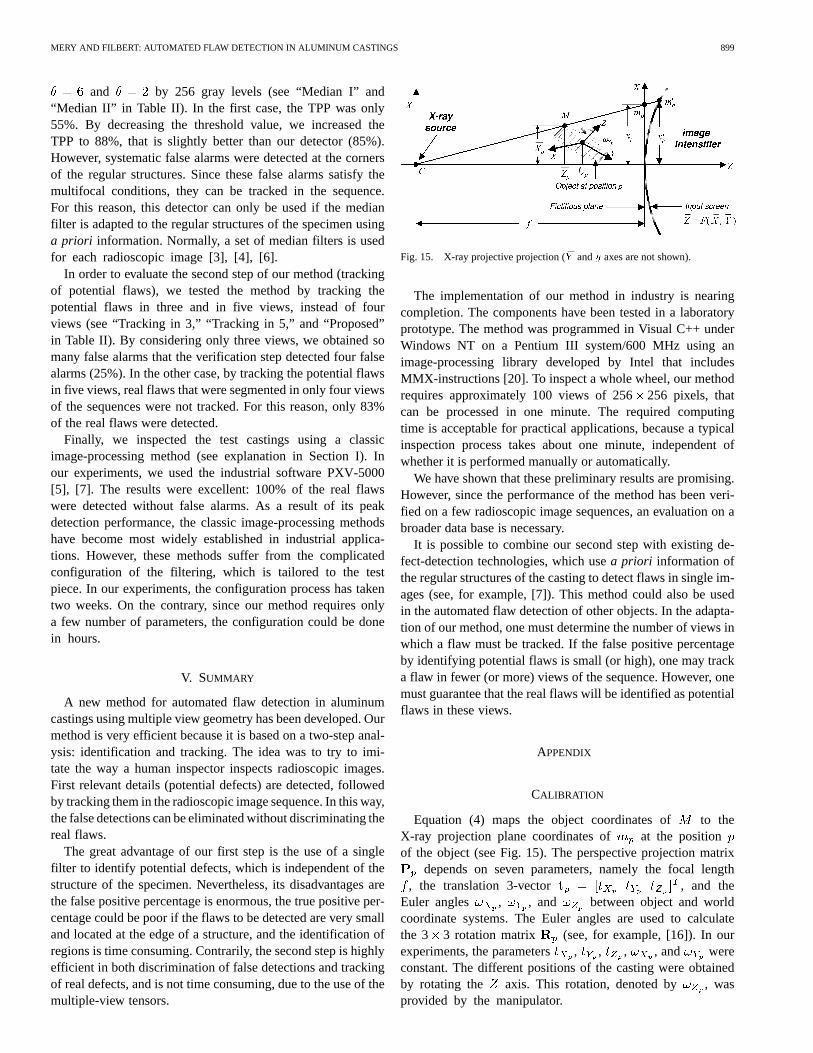
Fig. 15. X-ray projective projection (�Y andy axes are not shown).
The implementation of our method in industry is nearingcompletion. The components have been tested in a laboratoryprototype. The method was programmed in Visual C++ underWindows NT on a Pentium III system/600 MHz using animage-processing library developed by Intel that includesMMX-instructions [20]. To inspect a whole wheel, our methodrequires approximately 100 views of 256256 pixels, thatcan be processed in one minute. The required computingtime is acceptable for practical applications, because a typicalinspection process takes about one minute, independent ofwhether it is performed manually or automatically.
We have shown that these preliminary results are promising.However, since the performance of the method has been veri-fied on a few radioscopic image sequences, an evaluation on abroader data base is necessary.
It is possible to combine our second step with existing de-fect-detection technologies, which usea priori information ofthe regular structures of the casting to detect flaws in single im-ages (see, for example, [7]). This method could also be usedin the automated flaw detection of other objects. In the adapta-tion of our method, one must determine the number of views inwhich a flaw must be tracked. If the false positive percentageby identifying potential flaws is small (or high), one may tracka flaw in fewer (or more) views of the sequence. However, onemust guarantee that the real flaws will be identified as potentialflaws in these views.
APPENDIX
CALIBRATION
Equation (4) maps the object coordinates of to theX-ray projection plane coordinates of at the positionof the object (see Fig. 15). The perspective projection matrix
depends on seven parameters, namely the focal length, the translation 3-vector , and the
Euler angles , , and between object and worldcoordinate systems. The Euler angles are used to calculatethe 3 3 rotation matrix (see, for example, [16]). In ourexperiments, the parameters , , , , and wereconstant. The different positions of the casting were obtainedby rotating the axis. This rotation, denoted by , wasprovided by the manipulator.
900 IEEE TRANSACTIONS ON ROBOTICS AND AUTOMATION, VOL. 18, NO. 6, DECEMBER 2002
Now, we introduce the model that is used to transform the2-D point (in X-ray projection coordinatesystem) into the 2-D point (in CCD imagecoordinate system). The input screen of the image intensifiercorresponds normally to a hyperbolic 3-D surface [21], whichis defined by
(11)
with being the real half axis of the hyperboloid, andand theimaginary half axes. We observe thatcoincides with the focallength of the X-ray projection. The projection of point ontothe input screen of the image intensifier is denoted by. It iscalculated as the intersection of the line that contains points,
, and with the 3-D surface (see Fig. 15). Its coordinatesare given by
(12)
with . The point is imagedat the CCD camera as which coordinates can be estimatedapproximately using an affin transformation
(13)
where and are scale factors, and and are, re-spectively, the translation and the rotation betweenandaxes. Denoting by the 3 3 matrix of (13), the transforma-tion from to is computed as
(14)
The inverse transformation ofis given by
(15)
with .
The problem of calibration is to estimate the parametersof our model ( , , , , , , , , , , ,
, and ). For this reason, radioscopic images of acalibration object, with points whose object coordinates
(for ) are known, are taken at differentpositions by rotating the axis in , , , .The corresponding image coordinates are measured.Using the projection model (4) and (14), the inferred imageprojections are calculated from the calibration points
. The parameters of the model are estimated byminimizing an objective function defined as the mean Euclideandistance between and [14]. The objectivefunction must be iteratively minimized, starting with an initialvalue for the parameters. In our experiments, we calibratedthe imaging system with and . The obtainedmean error between measured and estimated calibration pointswas 1.34 pixels.
ACKNOWLEDGMENT
The authors would like to thank the anonymous reviewers fortheir helpful comments.
REFERENCES
[1] D. Mery, D. Filbert, and T. Jaeger, “Image processing for fault detectionin aluminum castings,” inAnalytical Characterization of Aluminum andIts Alloys, D. S. MacKenzie and G. Totten, Eds. New York: MarcelDekker, 2002.
[2] H. Boerner and H. Strecker, “Automated X-ray inspection of aluminumcasting,”IEEE Trans. Pattern Anal. Machine Intell., vol. 10, pp. 79–91,Jan. 1988.
[3] D. Filbert, R. Klatte, W. Heinrich, and M. Purschke, “Computer aidedinspection of castings,” inProc. IEEE-IAS Annu. Meeting, Atlanta, GA,1987, pp. 1087–1095.
[4] W. Heinrich, “Automatische Röntgenserienprüfung von Gußteilen,”Ph.D. dissertation, Inst. für Allgemeine Elektrotechnik, TechnischeUniv., Berlin, Germany, 1988.
[5] J.-M. Kosanetzky and H. Putzbach, “Modern X-ray inspection in theautomotive industry,” inProc. 14th World Conf. NDT, New Delhi, India,Dec. 8-13, 1996.
[6] H. Hecker, “Ein Neues Verfahren Zur Robusten Röntgenbildauswertungin Der Automatischen Gußteilprüfung,” Ph.D. dissertation, Vom Fach-bereich Elektrotechnik Technische Univ., Berlin, Germany, 1995.
[7] D. Mery, D. Filbert, and N. Parspour, “Improvement in automated alu-minum casting inspection by finding correspondence of potential flawsin multiple radioscopic images,” inProc. 15th World Conf. NDT, Rome,Italy, Oct. 15-21, 2000.
[8] T. Wenzel and R. Hanke, “Fast image processing on die castings,” inProc. Anglo-German Conf. NDT Imaging and Signal Processing, Ox-ford, U.K., March 27-28, 1998.
[9] A. Kehoe and G. A. Parker, “An intelligent knowledge-based approachfor the automated radiographic inspection of castings,”NDT & E Int.,vol. 25, no. 1, pp. 23–36, 1992.
[10] S. W. Lawson and G. A. Parker, “Intelligent segmentation of industrialradiographic images using neural networks,”Proc. of SPIE, Mach.Vision Applicat. Syst. Integration III, vol. 2347, pp. 245–255, Nov.1994.
[11] Y. Kita, R. Highnam, and M. Brady, “Correspondence between differentview breast X-rays using curved epipolar lines,”Comput., Vision, Un-derstanding, vol. 83, no. 1, pp. 38–56, 2001.
[12] D. Mery and D. Filbert, “Verfolgung von Gußfehlern in einer digitalenröntgenbildsequenz—eine neue Methode zur Automatisierung der Qual-itätskontrolle von Gußteilen,”tm—Technisches Messen, vol. 67, no. 4,pp. 160–165, 2000.
[13] D. Mery, “Automatische Gußfehlererkennung aus digitalen Röntgen-bildsequenzen,” Ph.D. dissertation, Inst. für Meß- und Automatisierung-stechnik, Technische Univ., Berlin, Germany, 2000.
[14] O. Faugeras,Three-Dimensional Computer Vision: A Geometric View-point. Cambridge, MA: MIT Press, 1993.
[15] C. Brack, H. Götte, F. Gossé, J. Moctezuma, M. Roth, and A.Schweikard, “Toward accurate X-ray-camera calibration in com-puter-assisted robotic surgery,” inProc. Int. Symp. Computer AssistedRadiology (CAR), Paris, France, 1996, pp. 721–728.
[16] R. I. Hartley and A. Zisserman,Multiple View Geometry in ComputerVision. Cambridge, U.K.: Cambridge Univ. Press, 2000.
[17] D. Mery and D. Filbert, “Classification of potential defects in auto-mated inspection of aluminum castings using statistical pattern recogni-tion,” in Proc. 8th Euro. Conf. Non-Destructive Testing (ECNDT 2002),Barcelona, Spain, June 17-21, 2002.
[18] A. Noble, R. Gupta, J. Mundy, A. Schmitz, and R. Hartley, “High pre-cision X-ray stereo for automated 3-D CAD-based inspection,”IEEETrans. Robot. Automat., vol. 14, pp. 292–302, Apr. 1998.
[19] D. Mery, “Flaw simulation in castings inspection by radioscopy,”IN-SIGHT, J. British Inst. Non-Destructive Testing, vol. 43, no. 10, pp.664–668, 2001.
[20] I. Weiske, D. Mery, C. Geisert, and D. Filbert, “Implementation of amethod for flaw detection in aluminum castings,”Electron. J. Non-De-structive Testing, vol. 7, no. 3, Mar. 2002.
[21] R. Felix and B. Ramm,Das Röntgenbild, 3 ed. Stuttgart, Germany:Georg Thieme Verlag, 1988.
MERY AND FILBERT: AUTOMATED FLAW DETECTION IN ALUMINUM CASTINGS 901
Domingo Mery (M’01) received the B.S. degreefrom the Universidad Nacional de Ingeniería, Perú,in 1989; the Diploma (M.S.) degree in electricalengineering from the Technical University ofKarlsruhe, Karlsruhe, Germany, in 1992, and thePh.D. degree with distinction from the TechnicalUniversity of Berlin, Berlin, Germany, in 2000.
From 1993 to 1996, he was a Research Assistantat the Department of Electrical Engineering at theCatholic University of Chile. From 1996 to 2000, hewas a Research Scientist at the Institute for Measure-
ment and Automation Technology at the Technical University of Berlin with thecollaboration of Philips and YXLON X-Ray International. Since 2001, he hasbeen an Assistant Professor at the Departamento de Ingeniería Informática, Uni-versidad de Santiago de Chile. His research interests include image processingfor automated inspection, X-ray imaging, nondestructive testing, and computervision.
Dr. Mery received a scholarship from the Konrad-Adenauer Foundation, andalso from the German Academic Exchange Service (DAAD).
Dieter Filbert received the Ph.D. degree in electricalengineering from the Technical University of Berlin,Berlin, Germany in 1970.
Since 1973 he has been a Professor for Mea-surement Science at the Technical University ofBerlin. His main interests are technical diagnosis,model-based measurements, digital test systems, andautomated inspection using X-ray testing.