Embed Size (px)
Citation preview
Automated Phenotyping System for Energy Crops
Automated Phenotyping System for Energy Crops
Simon Shaolei Du
Sunday 5th November, 2017
Structured Abstract
Background. Biofuels and biopower are a significant source of renewable energy. Our teamhas built a high-throughput (HTP) robotic phenotyping system in field environments which takespictures of plants everyday and a software will take these pictures and output 3D point clouds ofplants. We would like to use these 3D point clouds from the field to estimate the phenotypes.
Aim. Building an automated system that takes a noisy 3D point cloud of a plant as input andoutput its phenotypes which include leaf area, leaf length, leaf width, angle between leaf stem, etc.
Data. The data we will use has a small amount (∼ 50) 3D point clouds of plants with measuredphenotypes and a large amount of simulated plants (∼ 10, 000) to help us train the predictionmodel.
Methods. We use geometric and learning based methods to simulate plants and use 3D DeepConvolutional Neural Network for phenotype estimation.
Results. The generated plants are similar to the real plants. The estimation algorithm achievessignificant better result than the naive method (∼ 25% relative root mean squared error).
Conclusions. We validate the effectiveness of 3D convolutional neural network that only trainedon simulated data for plant phenotyping.
Intellectual merit. Our proposed methods combined geometric knowledge of the target objectsand modern day deep statistical models. This idea may be applied to other vision problems.
Broader impacts. This automated phenotyping system can be directly used by biologists toextract useful phenotypes from photos of plants. It will also draw computer scientists’ attention tothe problem of extracting useful information from noisy field data.
Keywords: Phenotyping, Deep Learning, Simulation
DAP Committee members:Barnabas Poczos 〈[email protected]〉 (Machine Learning Department);Aarti Singh 〈[email protected]〉 (Machine Learning Department);David Wettergreen 〈[email protected]〉 (The Robotics Institute);
1 of 14 11-5-2017 at 17:07
Automated Phenotyping System for Energy Crops
1 Introduction and Background
Biofuels and biopower are a significant source of renewable energy. However, only limited amountsof biofuels are produced from non-grain feedstocks because production costs are not competitive.Increased yield of bioenergy crops would mitigate this barrier to utilization. While crop breedingand improved management practices have increased productivity, the rate of yield gain in mostcrops is 1-2% per year with very significant investment. The ability to correlate phenotypic traitswith their genotypes plays a crucial role in improving plant breeding techniques. Phenotyping isthe bottleneck in the plant breeding pipeline and high throughput automated methods are crucialto improved production (Araus and Cairns, 2014; Fahlgren et al., 2015).
Plant phenotyping is the quantitative assessment of plant traits like physiology, yield, etc. Thetraditional plant phenotyping procedure is a manually intensive and slow process which involveshumans making measurements in the field or greenhouse. In most cases, the phenotyped data isanalyzed post-season. Recently, our team has built a highthroughput system to collect the datamuch faster (c.f. Section A and Vijayarangan et al. (2017)). Unlike some manual methods, oursystem is non-instrusive, i.e., we can scan the plant multiple times during its life cycle and notaffect its development. In this project, we use energy sorghum because it is a highly productive,annual, drought tolerant C4 grass with an excellent genetic (diploid, inbreeding) and genomicsplatform (Mullet, 2014; Vermerris, 2011).
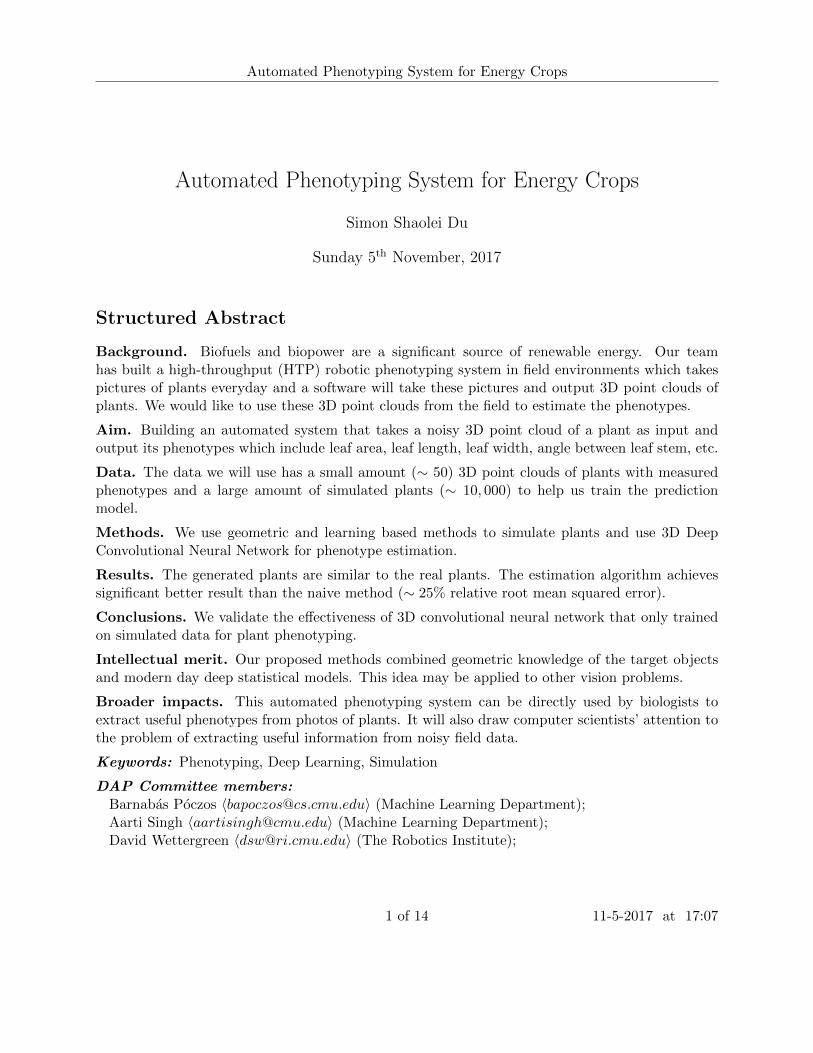
Although this system is able to take pictures of sorghums in a non-instrutive way, the picturesof plants are highly noisy due the whether, occlusion and other reasons. See Figure 1 for someexamples. These noise make phenotyping a challenging task because a typical phenotyping methodrequires (1) recognizing the target plant from the picture, (2) segmenting the target plant out fromthe background and other plants, and (3) measuring the phenotypes. The first two steps are moreor less easy for human but are difficult even for the state-of-the-art computer vision algorithms.Further, the third step has inherit bias because the plant is three dimensional object but we canonly measure them from two dimensional images.
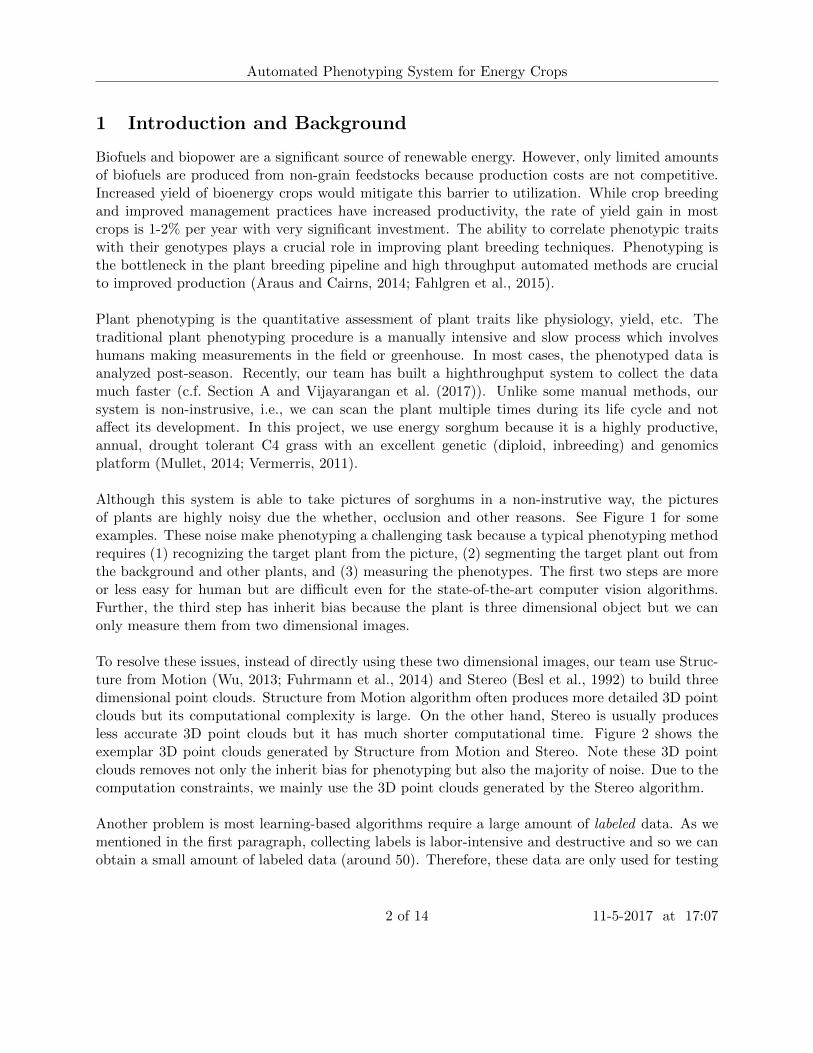
To resolve these issues, instead of directly using these two dimensional images, our team use Struc-ture from Motion (Wu, 2013; Fuhrmann et al., 2014) and Stereo (Besl et al., 1992) to build threedimensional point clouds. Structure from Motion algorithm often produces more detailed 3D pointclouds but its computational complexity is large. On the other hand, Stereo is usually producesless accurate 3D point clouds but it has much shorter computational time. Figure 2 shows theexemplar 3D point clouds generated by Structure from Motion and Stereo. Note these 3D pointclouds removes not only the inherit bias for phenotyping but also the majority of noise. Due to thecomputation constraints, we mainly use the 3D point clouds generated by the Stereo algorithm.
Another problem is most learning-based algorithms require a large amount of labeled data. As wementioned in the first paragraph, collecting labels is labor-intensive and destructive and so we canobtain a small amount of labeled data (around 50). Therefore, these data are only used for testing
2 of 14 11-5-2017 at 17:07

Automated Phenotyping System for Energy Crops
Figure 1: Sample images taken from our system. They are highly noisy due to occlusion andweather condition.
Figure 2: Some well generated 3D point clouds. (a): generated by Structure of Motion algorithm,(b): generated by Stereo algorithm.
3 of 14 11-5-2017 at 17:07
Automated Phenotyping System for Energy Crops
instead of training and we need to find a way to provide training data for learning based algorithms.
The main purpose of this project is to explore the learning-based algorithms for automated pheno-typing. Our contributions are summarized below:
• We use geometric and probabilistic methods to simulate plants to facilitate the learning-basedalgorithms for phenotyping. The simulation serves as two roles.
– First, since we can control the generation process (especially for geometric methods), weknow the labels of each plant. Therefore, we can use these generated data as trainingsamples of users’ favorite machine learning algorithms.
– Second, because gathering real data with labels is costly and different machine learningalgorithms often have require different kinds of data, we can use the simulated data asa testbed for comparing algorithms before collecting real data.
• We try 3D convolutional neural network for phenotyping and have achieved promising results.
1.1 Related Works
Field phenotyping platforms include ground-based and aerial-based methods (Li et al., 2014).Aerial-based platforms enable greater coverage and rapid characterization of field plots, but arelimited in spatial resolution and payload capacity. They are more suitable for estimating macro-phenotypic traits like plant location and densities. Ground-based platforms can yield more detailedphenotypic information at the cost of relatively lower coverage rates. Lemnatec is one of the leadersin automated phenotyping with in-field platforms like Bonirob (Bangert et al., 2013) and Scana-lyzer (Virlet et al., 2017). In contrast to previous systems, we used mobile tractor-based pheno-typing platform capable of collecting plant images at multiple vertical and horizontal viewpointsinside the closed plant canopy.
High-throughput phenotyping platforms deploy a variety of imaging modalities like 2D visible imag-ing, 3D imaging, multispectral imaging, thermal infrared imaging and fluorescence imaging (Liet al., 2014). Given its low cost and ease of operation, 2D/3D visible imaging has been com-monly used for applications like plant mapping and detection (Weiss and Biber, 2011), weed con-trol (Slaughter et al., 2008), fruit counting and yield estimation (Dey et al., 2012). For the purposeof phenotyping, the use of 3D visible imaging is important in order to be able to make groundtruth metric measurements purely from imaging. However, most of the current state-of-the-artin 3D plant reconstruction, segmentation and phenotyping is in controlled greenhouse environ-ments (Mccormick et al., 2016; Lehnert et al., 2017; Chaivivatrakul et al., 2014). Our project usesStructure from Motion (SfM) and Stereo methods for in-field 3D reconstruction from imaging datacollected by the phenotyping platform. The details are provided in our published paper (Vija-yarangan et al., 2017).
Recently, there is an increasing interest in developing systems for automated phenotyping. A major-ity of works have focused on using sensored to obtain spectral information from the plants (Aparicio
4 of 14 11-5-2017 at 17:07
Automated Phenotyping System for Energy Crops
et al., 2000; Omasa et al., 2007). However these methods cannot estimate the geometric propertiesof crops like stem length and leaf area. Another line of works use computer vision techniques to esti-mate these phenotypes based on images. For example, Alenya et al. (2011) proposed to use color andToF data to reconstruct 3D leaves. Moore et al. (2013) used geometric methods to estimate lengthof the root of crops. However, all these works used images from highly controlled environment, i.e.,there is no noise or occlusion. In this setting, simple geometric methods often works well. However,in our setting, the images are taken from the field which makes these geometric methods unreliable.
For phenotyping, unlike corn, wheat or grapes, sorghum is a fairly new crop of interest for developingautomated segmentation and phenotyping methods. To the best of our knowledge, literature onsorghum phenotyping is sparse and fairly recent (Mccormick et al., 2016). Mccormick et al. (2016)generate 3D reconstructions of greenhouse grown sorghum and correlate phenotypes like leaf angleto underlying plant genetics. As detailed later, greenhouse data collected by Mccormick et al.(2016) has been used for analysis and comparison to field data in this paper. The focus of theirwork, however, is correlation of phenotypes to their underlying genotypes, rather than developingautomated methods of phenotyping.
2 Data
In this section I describe in detail about the data. Our data come from three sources, namely, fromthe field, from the green house and by simulation.
2.1 Data from the Field
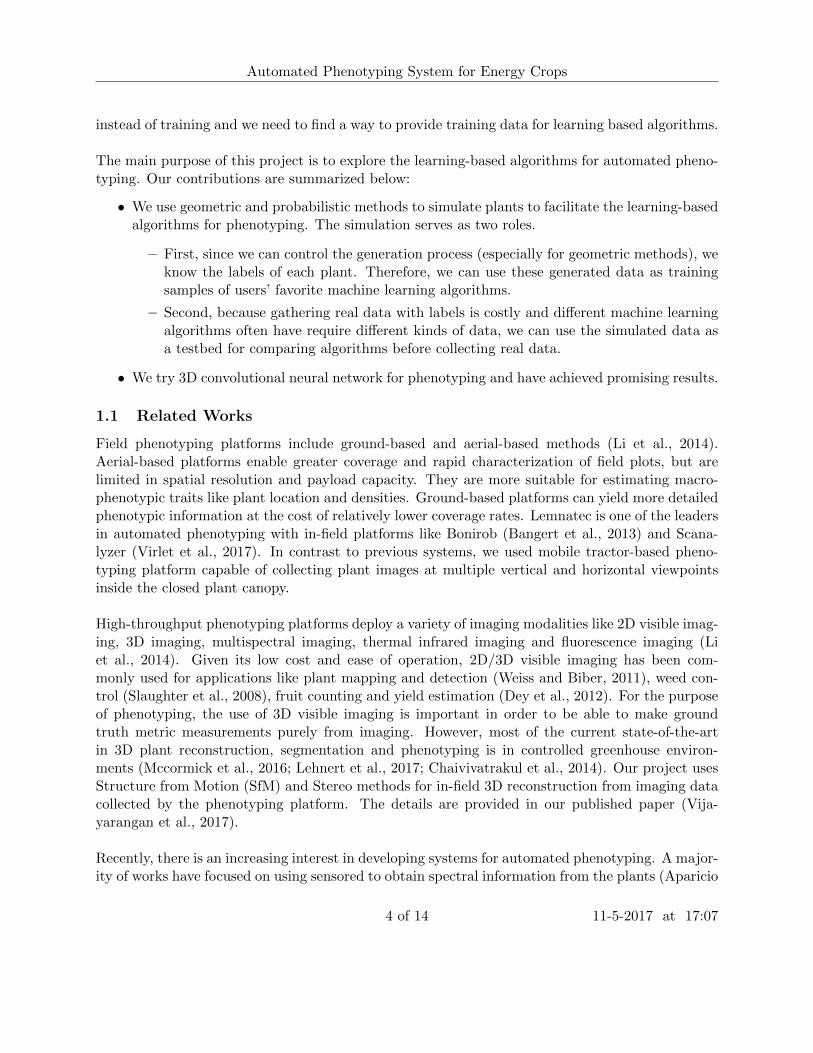
The raw 2D image data are photos of plants taken from farms located in Texas and Puerto Ricocollected by the hardware built by Robotic Institute. Figure 1 shows some sample images from thefield. Based on these 2D image data, our team member use SfM and Stereo methods to reconstructthe 3D point clouds (Vijayarangan et al., 2017; Sodhi et al., 2017). See Figure 2 for the goodreconstruction samples and Figure 3 shows some low quality reconstruction. Our primary goal isto do phenotyping on these data.
Since supervised learning algorithms require labeled data, we have another team who cut off someplants and measure the phenotypes. However, as we mentioned at the beginning, human-labormeasurement is costly and therefore we only have a small amount of labeled data. All data iscurrently stored in a server and we will make it public soon.
2.2 Data from Green House
The greenhouse 3D data used in the paper is the one collected by (Mccormick et al., 2016). Ideally,to obtain a geometrically consistent representation of a plant we would like to leverage 360 degreeviews of the plant. This is possible to setup for a controlled greenhouse environment. Mccormicket al. (2016) place sorghum plants on a turntable and capture 360 degree view depth images at
5 of 14 11-5-2017 at 17:07
Automated Phenotyping System for Energy Crops
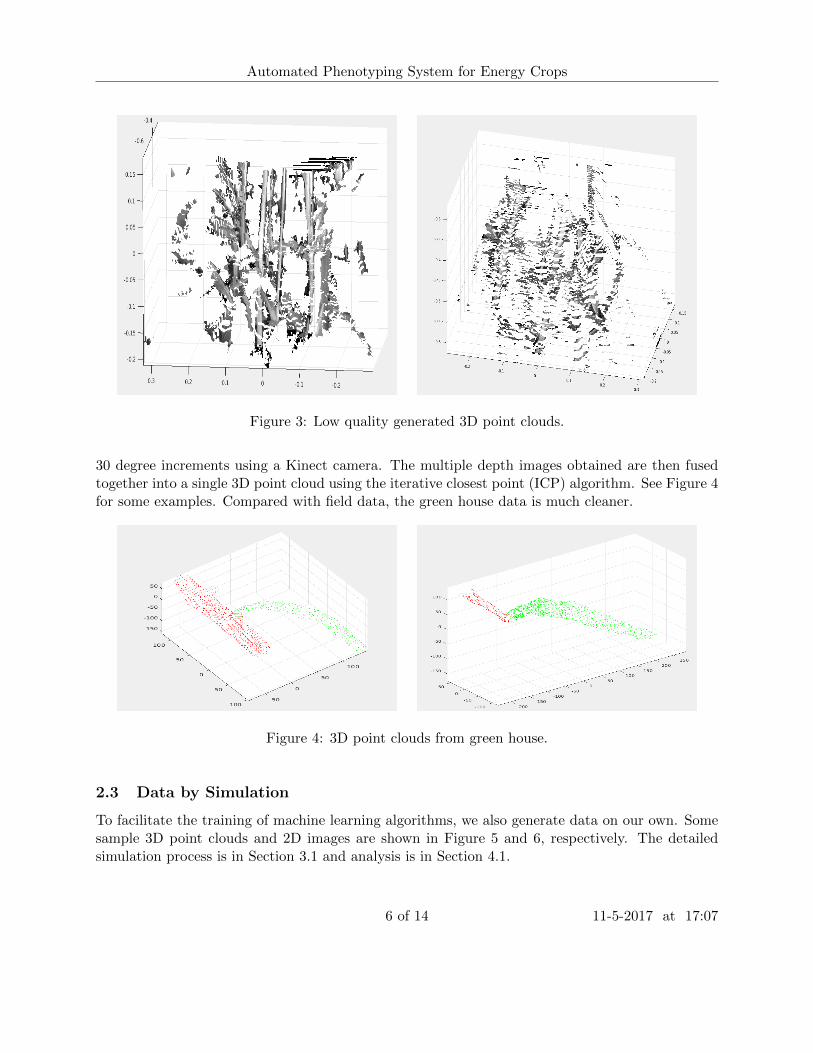
Figure 3: Low quality generated 3D point clouds.
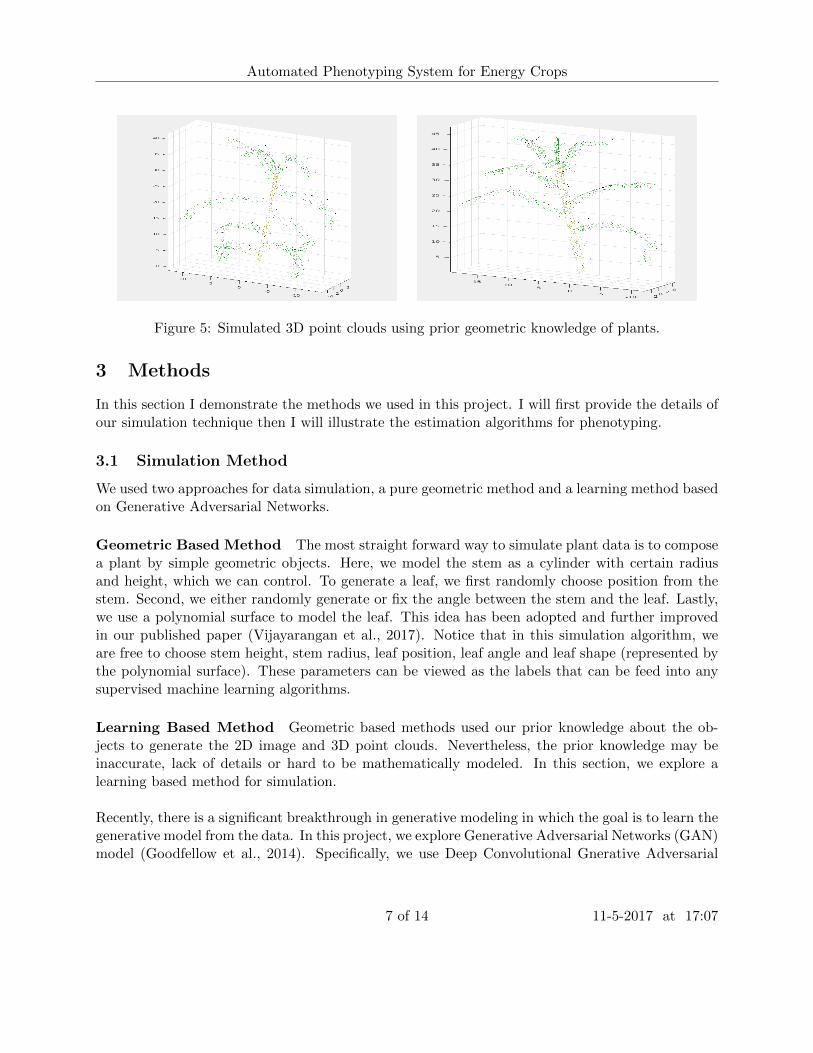
30 degree increments using a Kinect camera. The multiple depth images obtained are then fusedtogether into a single 3D point cloud using the iterative closest point (ICP) algorithm. See Figure 4for some examples. Compared with field data, the green house data is much cleaner.
Figure 4: 3D point clouds from green house.
2.3 Data by Simulation
To facilitate the training of machine learning algorithms, we also generate data on our own. Somesample 3D point clouds and 2D images are shown in Figure 5 and 6, respectively. The detailedsimulation process is in Section 3.1 and analysis is in Section 4.1.
6 of 14 11-5-2017 at 17:07
Automated Phenotyping System for Energy Crops
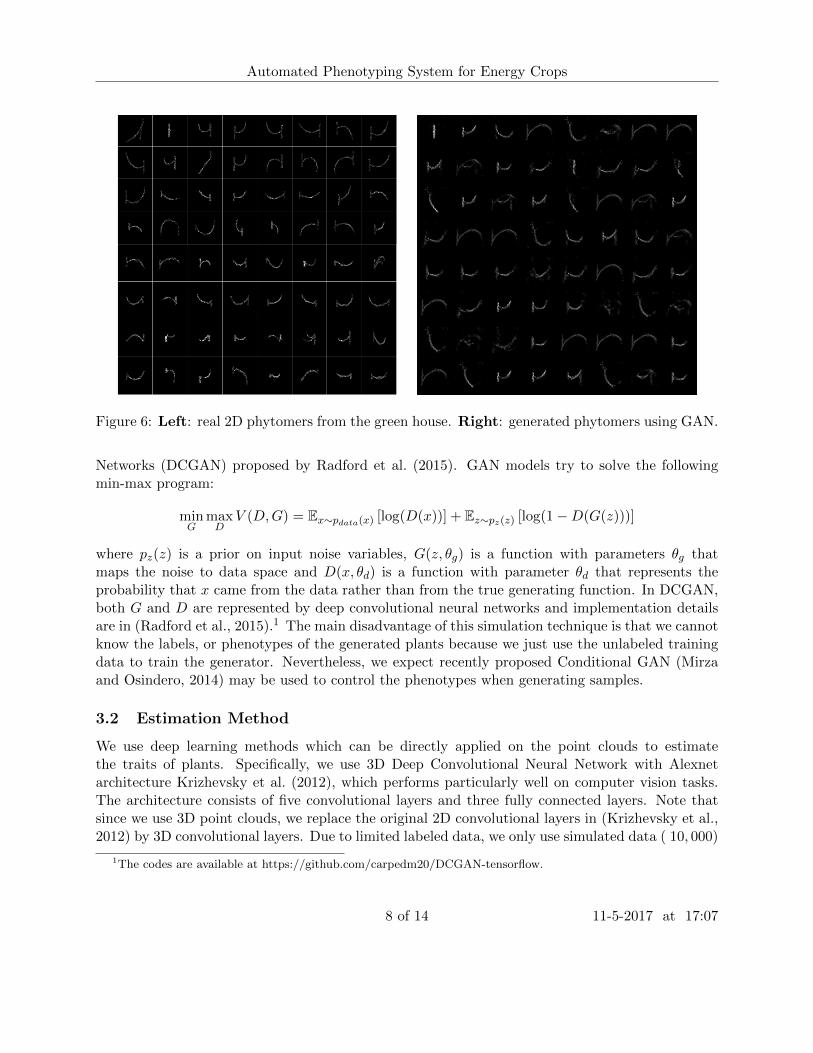
Figure 5: Simulated 3D point clouds using prior geometric knowledge of plants.
3 Methods
In this section I demonstrate the methods we used in this project. I will first provide the details ofour simulation technique then I will illustrate the estimation algorithms for phenotyping.
3.1 Simulation Method
We used two approaches for data simulation, a pure geometric method and a learning method basedon Generative Adversarial Networks.
Geometric Based Method The most straight forward way to simulate plant data is to composea plant by simple geometric objects. Here, we model the stem as a cylinder with certain radiusand height, which we can control. To generate a leaf, we first randomly choose position from thestem. Second, we either randomly generate or fix the angle between the stem and the leaf. Lastly,we use a polynomial surface to model the leaf. This idea has been adopted and further improvedin our published paper (Vijayarangan et al., 2017). Notice that in this simulation algorithm, weare free to choose stem height, stem radius, leaf position, leaf angle and leaf shape (represented bythe polynomial surface). These parameters can be viewed as the labels that can be feed into anysupervised machine learning algorithms.
Learning Based Method Geometric based methods used our prior knowledge about the ob-jects to generate the 2D image and 3D point clouds. Nevertheless, the prior knowledge may beinaccurate, lack of details or hard to be mathematically modeled. In this section, we explore alearning based method for simulation.
Recently, there is a significant breakthrough in generative modeling in which the goal is to learn thegenerative model from the data. In this project, we explore Generative Adversarial Networks (GAN)model (Goodfellow et al., 2014). Specifically, we use Deep Convolutional Gnerative Adversarial
7 of 14 11-5-2017 at 17:07
Automated Phenotyping System for Energy Crops
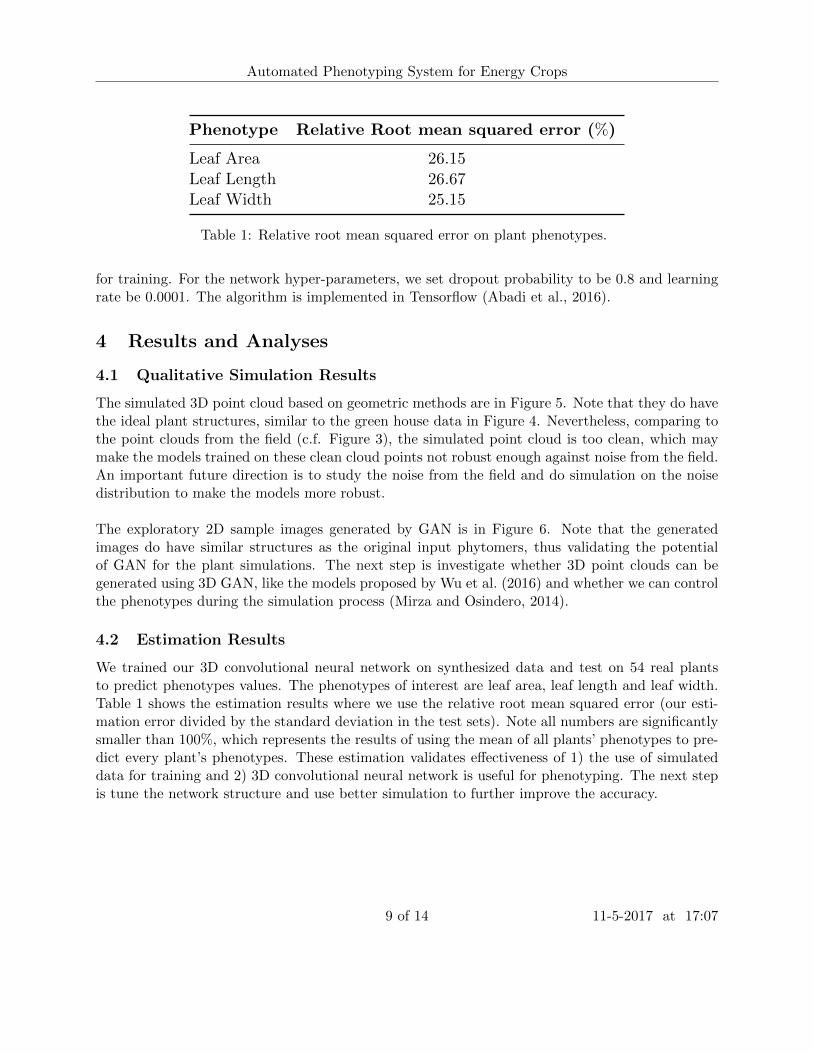
Figure 6: Left: real 2D phytomers from the green house. Right: generated phytomers using GAN.
Networks (DCGAN) proposed by Radford et al. (2015). GAN models try to solve the followingmin-max program:
minG
maxD
V (D,G) = Ex∼pdata(x) [log(D(x))] + Ez∼pz(z) [log(1−D(G(z)))]
where pz(z) is a prior on input noise variables, G(z, θg) is a function with parameters θg thatmaps the noise to data space and D(x, θd) is a function with parameter θd that represents theprobability that x came from the data rather than from the true generating function. In DCGAN,both G and D are represented by deep convolutional neural networks and implementation detailsare in (Radford et al., 2015).1 The main disadvantage of this simulation technique is that we cannotknow the labels, or phenotypes of the generated plants because we just use the unlabeled trainingdata to train the generator. Nevertheless, we expect recently proposed Conditional GAN (Mirzaand Osindero, 2014) may be used to control the phenotypes when generating samples.
3.2 Estimation Method
We use deep learning methods which can be directly applied on the point clouds to estimatethe traits of plants. Specifically, we use 3D Deep Convolutional Neural Network with Alexnetarchitecture Krizhevsky et al. (2012), which performs particularly well on computer vision tasks.The architecture consists of five convolutional layers and three fully connected layers. Note thatsince we use 3D point clouds, we replace the original 2D convolutional layers in (Krizhevsky et al.,2012) by 3D convolutional layers. Due to limited labeled data, we only use simulated data ( 10, 000)
1The codes are available at https://github.com/carpedm20/DCGAN-tensorflow.
8 of 14 11-5-2017 at 17:07
Automated Phenotyping System for Energy Crops
Phenotype Relative Root mean squared error (%)
Leaf Area 26.15Leaf Length 26.67Leaf Width 25.15
Table 1: Relative root mean squared error on plant phenotypes.
for training. For the network hyper-parameters, we set dropout probability to be 0.8 and learningrate be 0.0001. The algorithm is implemented in Tensorflow (Abadi et al., 2016).
4 Results and Analyses
4.1 Qualitative Simulation Results
The simulated 3D point cloud based on geometric methods are in Figure 5. Note that they do havethe ideal plant structures, similar to the green house data in Figure 4. Nevertheless, comparing tothe point clouds from the field (c.f. Figure 3), the simulated point cloud is too clean, which maymake the models trained on these clean cloud points not robust enough against noise from the field.An important future direction is to study the noise from the field and do simulation on the noisedistribution to make the models more robust.
The exploratory 2D sample images generated by GAN is in Figure 6. Note that the generatedimages do have similar structures as the original input phytomers, thus validating the potentialof GAN for the plant simulations. The next step is investigate whether 3D point clouds can begenerated using 3D GAN, like the models proposed by Wu et al. (2016) and whether we can controlthe phenotypes during the simulation process (Mirza and Osindero, 2014).
4.2 Estimation Results
We trained our 3D convolutional neural network on synthesized data and test on 54 real plantsto predict phenotypes values. The phenotypes of interest are leaf area, leaf length and leaf width.Table 1 shows the estimation results where we use the relative root mean squared error (our esti-mation error divided by the standard deviation in the test sets). Note all numbers are significantlysmaller than 100%, which represents the results of using the mean of all plants’ phenotypes to pre-dict every plant’s phenotypes. These estimation validates effectiveness of 1) the use of simulateddata for training and 2) 3D convolutional neural network is useful for phenotyping. The next stepis tune the network structure and use better simulation to further improve the accuracy.
9 of 14 11-5-2017 at 17:07
Automated Phenotyping System for Energy Crops
5 Conclusion and Future Works
In this data analysis project we have made progress on building a practical automated phenotypingsystem. We explored both geometric and learning based methods to simulate plants that fit thereal plant point clouds from the green house and the field. We also trained neural networks onsimulated data tested on real data to predict the phenotypes and the results are promising. Twofuture directions are listed below.
• Improved Simulation. Simulation is a crucial step in this project. Because lack of reallabeled data, models are usually trained on the simulated data. The current technique cansimulate green house data quite well. However, the field data contains many kinds of noise,so we need better technique to simulate point clouds that are similar to the ones generatedusing the field data. Studying the noise distribution from the field or using conditional GANare both promising approaches.
• Improved Estimation. 3D convolutional neural network is shown to be effective in thistask. Nevertheless, in this project, we only tried the network structure from Krizhevsky et al.(2012). An interesting direction to explore is to exploit the prior knowledge of the structureof plants to further improve the estimation accuracy.
6 Acknowledgements.
This research was sponsored by ARPA-E under grant in the the Terra program (TransportationEnergy Resources from Renewable Agriculture) with title Automated TERRA Phenotyping Systemfor Genetic Improvement of Energy Crops. I would like to thank Hanyue Liang, Barnabas Poczos,Paloma Sodhi, Hanqi Sun, Srinivasan Vijayarangan, and David Wettergreen for useful discussionsand helps throughout the project.
References
Abadi, M., Agarwal, A., Barham, P., Brevdo, E., Chen, Z., Citro, C., Corrado, G. S., Davis, A.,Dean, J., Devin, M., et al. (2016). Tensorflow: Large-scale machine learning on heterogeneousdistributed systems. arXiv preprint arXiv:1603.04467.
Alenya, G., Dellen, B., and Torras, C. (2011). 3d modelling of leaves from color and tof datafor robotized plant measuring. In Robotics and Automation (ICRA), 2011 IEEE InternationalConference on, pages 3408–3414. IEEE.
Aparicio, N., Villegas, D., Casadesus, J., Araus, J. L., and Royo, C. (2000). Spectral vegetationindices as nondestructive tools for determining durum wheat yield. Agronomy Journal, 92(1):83–91.
10 of 14 11-5-2017 at 17:07
Automated Phenotyping System for Energy Crops
Araus, J. L. and Cairns, J. E. (2014). Field high-throughput phenotyping: the new crop breedingfrontier. Trends in plant science, 19(1):52–61.
Bangert, W., Kielhorn, A., Rahe, F., Albert, A., Biber, P., Grzonka, S., Haug, S., Michaels, A.,Mentrup, D., Hansel, M., et al. (2013). Field-robot-based agriculture:remotefarming. 1 andbonirob-apps. VDI-Berichte, (2193):439–446.
Besl, P. J., McKay, N. D., et al. (1992). A method for registration of 3-d shapes. IEEE Transactionson pattern analysis and machine intelligence, 14(2):239–256.
Chaivivatrakul, S., Tang, L., Dailey, M. N., and Nakarmi, A. D. (2014). Automatic morpholog-ical trait characterization for corn plants via 3d holographic reconstruction. Computers andelectronics in agriculture, 109:109–123.
Dey, D., Mummert, L., and Sukthankar, R. (2012). Classification of plant structures from uncal-ibrated image sequences. In Applications of Computer Vision (WACV), 2012 IEEE Workshopon, pages 329–336. IEEE.
Fahlgren, N., Gehan, M. A., and Baxter, I. (2015). Lights, camera, action: high-throughput plantphenotyping is ready for a close-up. Current opinion in plant biology, 24:93–99.
Fuhrmann, S., Langguth, F., and Goesele, M. (2014). Mve-a multi-view reconstruction environment.In GCH, pages 11–18.
Goodfellow, I., Pouget-Abadie, J., Mirza, M., Xu, B., Warde-Farley, D., Ozair, S., Courville, A.,and Bengio, Y. (2014). Generative adversarial nets. In Advances in neural information processingsystems, pages 2672–2680.
Krizhevsky, A., Sutskever, I., and Hinton, G. E. (2012). Imagenet classification with deep convolu-tional neural networks. In Advances in neural information processing systems, pages 1097–1105.
Lehnert, C., English, A., McCool, C., Tow, A. W., and Perez, T. (2017). Autonomous sweet pepperharvesting for protected cropping systems. IEEE Robotics and Automation Letters, 2(2):872–879.
Li, L., Zhang, Q., and Huang, D. (2014). A review of imaging techniques for plant phenotyping.Sensors, 14(11):20078–20111.
Mccormick, R. F., Truong, S. K., and Mullet, J. E. (2016). 3d sorghum reconstructions from depthimages identify qtl regulating shoot architecture. Plant physiology, pages pp–00948.
Mirza, M. and Osindero, S. (2014). Conditional generative adversarial nets. arXiv preprintarXiv:1411.1784.
Moore, C. R., Johnson, L. S., Kwak, I.-Y., Livny, M., Broman, K. W., and Spalding, E. P. (2013).High-throughput computer vision introduces the time axis to a quantitative trait map of a plantgrowth response. Genetics, 195(3):1077–1086.
11 of 14 11-5-2017 at 17:07
Automated Phenotyping System for Energy Crops
Mullet, J. (2014). Energy sorghum-a genetic/genomic model for the design of c4 grass energy crops.In Plant and Animal Genome XXII Conference. Plant and Animal Genome.
Omasa, K., Hosoi, F., and Konishi, A. (2007). 3d lidar imaging for detecting and understandingplant responses and canopy structure. Journal of experimental botany, 58(4):881–898.
Radford, A., Metz, L., and Chintala, S. (2015). Unsupervised representation learning with deepconvolutional generative adversarial networks. arXiv preprint arXiv:1511.06434.
Rusu, R. B., Blodow, N., and Beetz, M. (2009). Fast point feature histograms (fpfh) for 3dregistration. In Robotics and Automation, 2009. ICRA’09. IEEE International Conference on,pages 3212–3217. IEEE.
Slaughter, D., Giles, D., and Downey, D. (2008). Autonomous robotic weed control systems: Areview. Computers and electronics in agriculture, 61(1):63–78.
Sodhi, P., Vijayarangan, S., and Wettergreen, D. (2017). In-field segmentation and identification ofplant structures using 3d imaging. In IEEE/RSJ International Conference on Intelligent Robotsand Systems.
Vermerris, W. (2011). Survey of genomics approaches to improve bioenergy traits in maize, sorghumand sugarcanefree access. Journal of Integrative Plant Biology, 53(2):105–119.
Vijayarangan, S., Sodhi, P., Kini, P., Bourne, J., Du, S., Sun, H., Poczos, B., Apostolopoulos,D., and Wettergreen, D. (2017). High-throughput robotic phenotyping of energy sorghum crops.Field and Service Robotics. Springer.
Virlet, N., Sabermanesh, K., Sadeghi-Tehran, P., and Hawkesford, M. J. (2017). Field scanalyzer:An automated robotic field phenotyping platform for detailed crop monitoring. Functional PlantBiology, 44(1):143–153.
Weiss, U. and Biber, P. (2011). Plant detection and mapping for agricultural robots using a 3dlidar sensor. Robotics and autonomous systems, 59(5):265–273.
Wu, C. (2013). Towards linear-time incremental structure from motion. In 3DTV-Conference, 2013International Conference on, pages 127–134. IEEE.
Wu, J., Zhang, C., Xue, T., Freeman, B., and Tenenbaum, J. (2016). Learning a probabilisticlatent space of object shapes via 3d generative-adversarial modeling. In Advances in NeuralInformation Processing Systems, pages 82–90.
12 of 14 11-5-2017 at 17:07
Automated Phenotyping System for Energy Crops
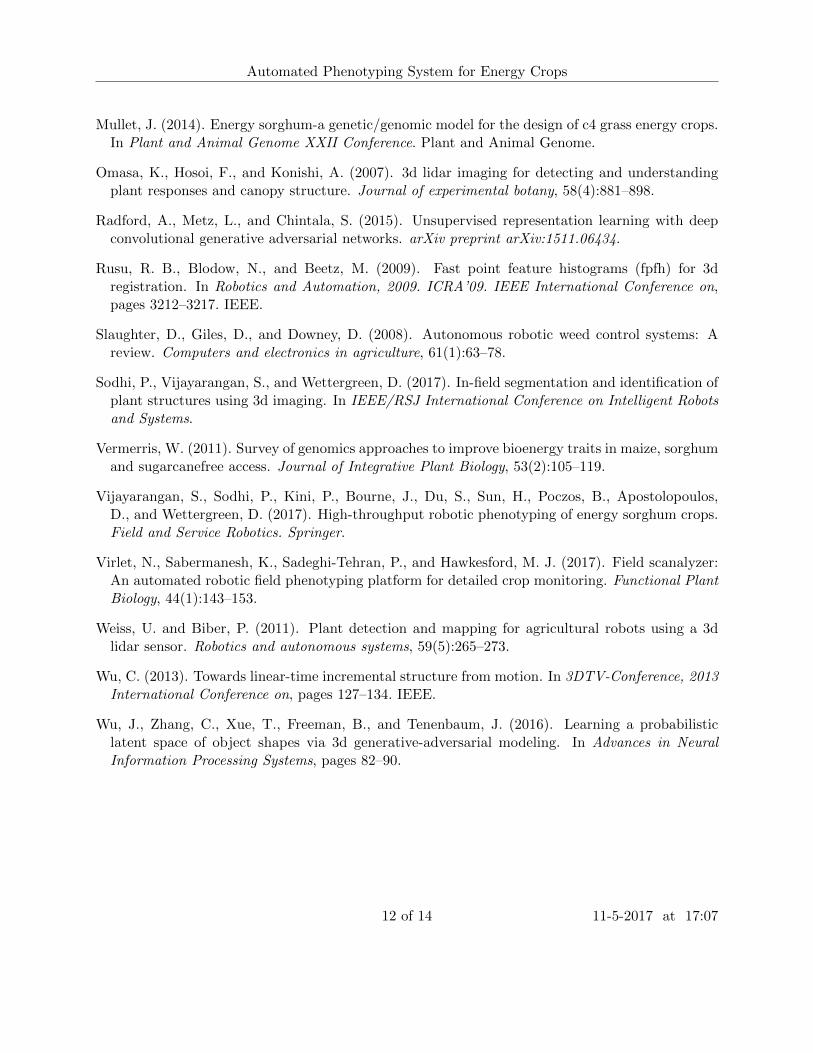
Figure 7: High Throughput Robot.
A Apparatus and Instrumentation
We use High-throughput Phentotyping (HTP) robots to collect data. The HTP robot resides ona trailer system that provides an inexpensive support and transport system for the sensor boomand mast. The trailer will move in the alley ways between sub plots and once in position, dropleveling legs to stabilize the mast so that the sensor boom can be deployed reliably. The traileris a six-wheeled vehicle with “rocker-bogie” suspension. This type of suspension provides for acertain amount of terrain averaging without requiring a spring/damper-type suspension system.The trailer frame is a simple welded tube structure. Hubs, axles, tires and wheels, trailer couplerand stabilizing jack (auto leveling) system are all commercial off-the-shelf items. The total weightof the system is ∼1000 kilograms including the mast and sensor boom. The overall footprint of thetrailer is 6 wide by 116 long. The solid front axle pivots for steering, providing an approximately8-foot turning radius. This vehicle requires an alley way of 70. The system consists of a verticalcolumn carrying opposing sensor booms as shown in Figure 7. Sensor pods are arranged alongeach of the sensor booms. The booms are mounted to a moveable carriage which is carried up thecolumn by a linear actuator. The booms are extended and retracted by a linear actuator at thebase of the sensor boom. Motion of this actuator, combined with motion of the carriage linearactuator, permits the booms to deploy while maintaining constant boom tip-to-ground distance.This substantially horizontal motion of the boom tip permits the sensor booms to enter the plantrows without damage to the plants. Once fully deployed the carriage linear actuator moves thebooms upwards along the column to effect scanning of the plants. After reaching the top of thescan the booms are retracted in a reverse of the deployment motion and the system is moved tothe next plant row to be scanned.
A.1 Sensor Pod
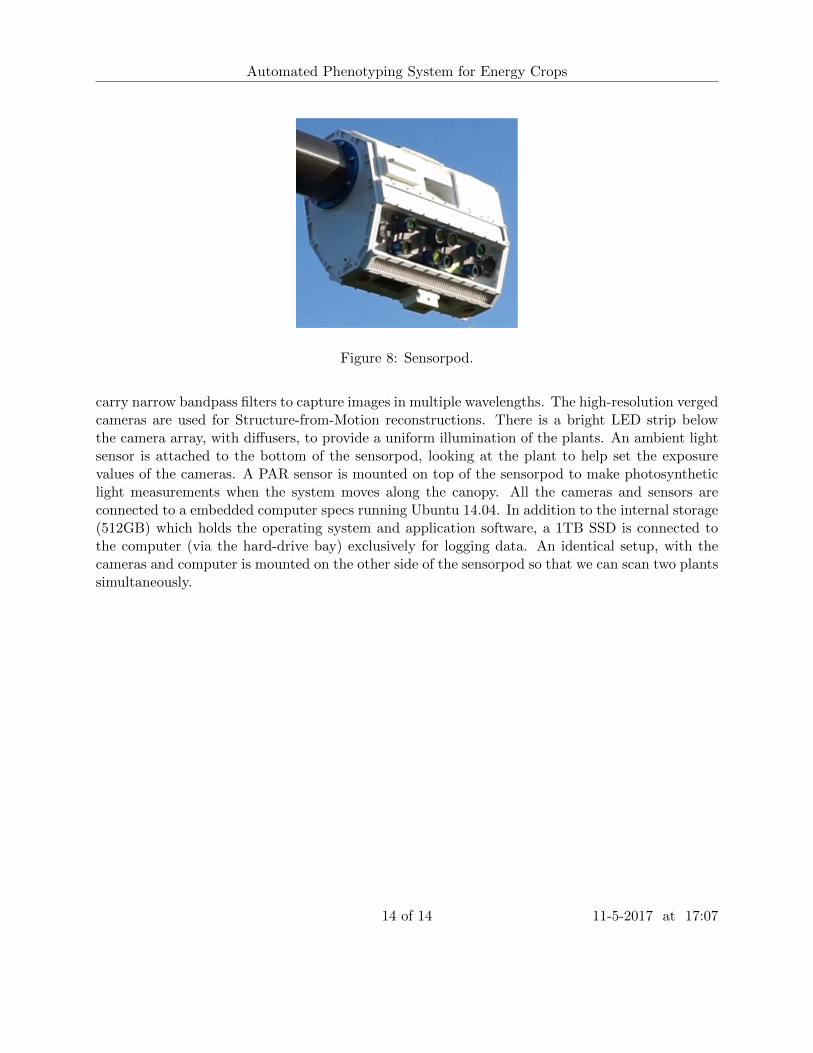
The sensorpod (Figure 8) has 10 cameras with 8 (low resolution) cameras placed in two rows andremaining 2 (high resolution) cameras to the sides at a verged angle of 30 degrees. The camerasare hardware synchronized and triggered every 10 cms when the boom moves up the canopy. Thetop centre pair cameras are designated for stereo reconstruction. The other low-resolution cameras
13 of 14 11-5-2017 at 17:07
Automated Phenotyping System for Energy Crops
Figure 8: Sensorpod.
carry narrow bandpass filters to capture images in multiple wavelengths. The high-resolution vergedcameras are used for Structure-from-Motion reconstructions. There is a bright LED strip belowthe camera array, with diffusers, to provide a uniform illumination of the plants. An ambient lightsensor is attached to the bottom of the sensorpod, looking at the plant to help set the exposurevalues of the cameras. A PAR sensor is mounted on top of the sensorpod to make photosyntheticlight measurements when the system moves along the canopy. All the cameras and sensors areconnected to a embedded computer specs running Ubuntu 14.04. In addition to the internal storage(512GB) which holds the operating system and application software, a 1TB SSD is connected tothe computer (via the hard-drive bay) exclusively for logging data. An identical setup, with thecameras and computer is mounted on the other side of the sensorpod so that we can scan two plantssimultaneously.
14 of 14 11-5-2017 at 17:07


![The Challenges of [high-throughput] Phenotyping › app › webroot › img › ... · automated platform for screening yield-enhancement genes Large effects (>20%) on yield Different](https://img.pdfslide.net/doc/110x75/5f1abac6dcfa6c42a40182d0/the-challenges-of-high-throughput-phenotyping-a-app-a-webroot-a-img-a.jpg)