Embed Size (px)
Citation preview
Transaction
Paper
Introduction
Platinum group minerals (PGMs) are thoseminerals containing any of the platinum groupelements (PGE): Pt, Pd, Rh, Ru, Ir and Os. InUG2 ore of the Bushveld Complex, thesetypically occur as sulfides, alloys, and to alesser extent, as arsenides and tellurides, withfine grain sizes, generally <10 μm (McLarenand de Villiers, 1982; Penberthy et al., 2000).Their characterization is an integral component
in metallurgical test work undertaken atMintek. Over the years, a characterizationscheme for PGM in flotation feeds, concen-trates and tails, has been devised to assist inassessing metallurgical performance. This waslargely based on the early efforts of Penberthy(2001), who investigated the geometallurgicalcharacteristics of UG2 ore by studyinggeological effects on the chromitite andrelating these to PGM flotation characteristicsfrom batch flotation tests. The premise of theclassification scheme is that PGM floatability isrelated to the parameters of species, grain sizeand mode of occurrence.
The type of PGM species is largely onlyrelevant to floatability if liberated PGMs areconsidered, in which case species can bedirectly correlated with flotation response.PGM floatability, in terms of species, has morerecently been given attention, in ores such asthe Platreef and Great Dyke, where PGE-tellurides and arsenides are more abundantcompared with sulfides (Shackleton et al.,2007a, b; Shamaila and O’Connor, 2008;Vermaak et al., 2007). The grain size of PGMshas also been considered to affect floatability,with very fine (i.e. <3 μm) PGMs considered asslow floaters (Penberthy et al., 2000).
The mode of occurrence of PGMs encom-passes the degree of PGM liberation, andassociation with base metal sulfide (BMS) andgangue minerals. Liberation is not a straight-forward description as might be found, forexample, with BMS flotation or leach processmineralogical investigations. Because flotationof PGMs is based on bulk sulfide flotationprinciples (Xiao and Laplante, 2004; O’Connor,
Automated SEM study of PGMdistribution across a UG2 flotationconcentrate bank: implications forunderstanding PGM floatabilityby D. Chetty*, L. Gryffenberg*, T.B. Lekgetho†, andI.J. Molebale‡
Synopsis
The characterization of platinum group minerals (PGMs) fromconcentrator flotation circuits provides valuable informationtowards understanding PGM recovery under given milling andflotation conditions. Additional mineralogical characterization alsoprovides information on ore variability, which may affect recovery.Considering the low grades involved, automated scanning electronmicroscopy (SEM) characterization of PGMs has enabled relativelyquick analyses, compared with older, time consuming and lessaccurate optical microscopy methods. Over the years, parameters,such as species, size distribution, liberation, gangue and base metalsulfide (BMS) associations, have been used to characterize thePGMs in a process mineralogical context, to aid metallurgicalinterpretation.
This paper considers whether flotation indices determined forPGMs can be empirically validated, using initial results fromanalysis of PGMs in a concentrate bank from a South Africanconcentrator treating UG2 ore from the western limb of theBushveld Complex. The aim is to determine whether floatability isadequately described by these parameters, or whether othermineralogical factors must be considered when assessing PGMfloatability, and hence accounting for recovery vs. losses to tails.
The data obtained to date, show that flotation parameters(including liberation index, BMS/gangue relationships and sizedistribution) have merits where large changes in PGM concentrationoccur, as observed in the first four cells of the concentrate bank.Larger data sets, however, are required to assess floatability, partic-ularly where concentrate cell grades are similar, as observed in thelast six cells of the concentrate bank. Furthermore, the floatabilityindices could be enhanced by the incorporation of selectedassociated gangue mineral information, chief amongst these beingthe content and mode of occurrence of naturally floatable talc andassociated orthopyroxene.
* Mineralogy Division, Mintek, Randburg, South Africa.
† Department of Geology, University of the Free State.‡ Department of Geology, University of Pretoria.© The Southern African Institute of Mining and
Metallurgy, 2009. SA ISSN 0038–223X/3.00 +0.00. Paper received Jul. 2009; revised paperreceived Sep. 2009.
587The Journal of The Southern African Institute of Mining and Metallurgy VOLUME 109 REFEREED PAPER OCTOBER 2009 ▲
text:Template Journal 11/3/09 2:07 PM Page 587

Automated SEM study of PGM distribution across a UG2 flotation concentrate
2005), the association of PGM with BMS is as important as, ifnot more important than, liberated PGM for floatability (e.g.Penberthy, 2001). In the same vein, PGM association withgangue minerals may or may not contribute to increasedfloatability, as this is more likely a function of gangue floata-bility, which presents its own set of challenges forconcentrate grades and element specifications throughdilution and entrainment effects.
In order to assess how effectively PGM characterizationparameters describe floatability, a UG2 flotation concentratebank was sampled from the primary circuit of a South AfricanMF2 (mill-float-mill-float) concentrator treating ore from thewestern limb of the Bushveld Complex. The concentrateswere subjected to analysis using automated scanning electronmicroscopy (SEM), allowing for at least 250 PGM grains to beassessed per concentrate. Since a concentrate bank allowsmore ‘opportunity’ for PGM flotation from the first to the lastflotation cell, floatability is expected to decrease from the firstto the last cell in the bank, before non-floatable PGMs reportto the tails. Further, since ~70 % of the PGMs are recoveredin the primary rougher circuit, sampling of the concentratebank would be expected to provide the best opportunity forfinding PGM grains.
Methods
For the primary circuit sampled, UG2 ore milled to 40% < 75 μm was fed into the flotation cells with 10 forcedair tank cells (20 m3) constituting the concentrate bank. Thereagents used for flotation were copper sulfate (activator),sodium isobutyl xanthate (collector), carboxy-methyl-cellulose (CMC) (depressant) and methyl isobutyl carbinol(MIBC) (frother). After the cascading flotation through the 10primary cells, the tails were discharged to the secondary ballmill, before entry to the secondary, rougher circuit. Theprimary rougher feed (PRF), ten primary rougher concen-trates (PRC1 to 10) and primary rougher tail (PRT) weresampled over a four hour period, during which plant stabilitywas maintained (Figure 1).
After weighing, drying and blending of the slurries,representative sub-samples were taken for PGE analysis byfire assay and inductively-coupled plasma-optical emissionspectroscopy (ICP-OES), and polished section preparation forautomated SEM studies. The polished sections were analysedusing a Mineral Liberation Analyser (MLA), employing theautomated sparse phase search with dual zoom (SPL_DZ)method (Fandrich et al., 2007). Owing to the extremely small
size of PGM grains, most often <10 μm in section, the methodinvolves the scanning of the section at a given magnification,to find ‘bright’ phases above a specified backscatter electronintensity (to which PGMs are amenable), upon which suchphases, together with associated phases in a particle, aredistinguished by X-ray spectral analysis and mapped at highresolution. Note that phases are seen in two dimensions asgrains, by virtue of their backscattered electron intensity.Two or more grains that share their edges make up a particle;a single grain, where liberated, will also be a particle. Dataoutputs take the form of false-colour particle maps of thebright phase, which have been generated through processingagainst a standards file. The standards file comprises energydispersive spectra (EDS) collected from the various phasespresent (e.g. PtS, orthopyroxene), against which the collectedX-ray spectra of the automated analysis are compared andidentified by the best match principle, with some manualintervention necessary to ensure that maps are representativeof the grains identified. The quantitative phase data are thenreduced further, offline.
As with any analytical technique, data quality must beaccounted for, particularly where data comparisons are made.Although automated SEM techniques are relatively rapid atfinding minerals with grades in the ppm range, largeamounts of data are still necessary to ensure accuracy.Considering that large tonnages of ore are routinely processedat PGM concentrators, and that substantially less than 1 g ofmaterial is actually analysed to look for PGMs in a dozenpolished sections, representative sub sampling is imperative.Further, owing to the high variability in PGM characteristics,the number of such grains analysed needs to be substantial,a problem not easily overcome, in spite of automation.Studies making use of automated SEM data provideworryingly inadequate information on this aspect.Accordingly, it is worth stating that data collection is acontinuous process in this study. This paper presents data fora total of 4513 PGM grains obtained to date across a primaryrougher circuit, 4199 of which are derived from concentrates(Table I). Attempts have been made to place uncertainties onthe data, since these are necessary when comparing the PGMdistribution as the flotation proceeds down the bank of cells.The uncertainties were obtained by using a form ofresampling statistics, with replacement. This involvedsimulation of a parameter by resampling different aliquotsfrom the same bulk population a thousand times, to arrive ata mean value for the parameter, as well as its associated
▲
588 OCTOBER 2009 VOLUME 109 REFEREED PAPER The Journal of The Southern African Institute of Mining and Metallurgy
Figure 1—Overview of the primary rougher circuit, and sampled points(asterisks)
text:Template Journal 11/3/09 2:07 PM Page 588
uncertainty (Wikipedia, accessed May 2009). Simulationswere performed using the @Risk software (PalisadeCorporation), which uses Monte Carlo simulation on the Excelplatform.
Results and discussion
PGE assays
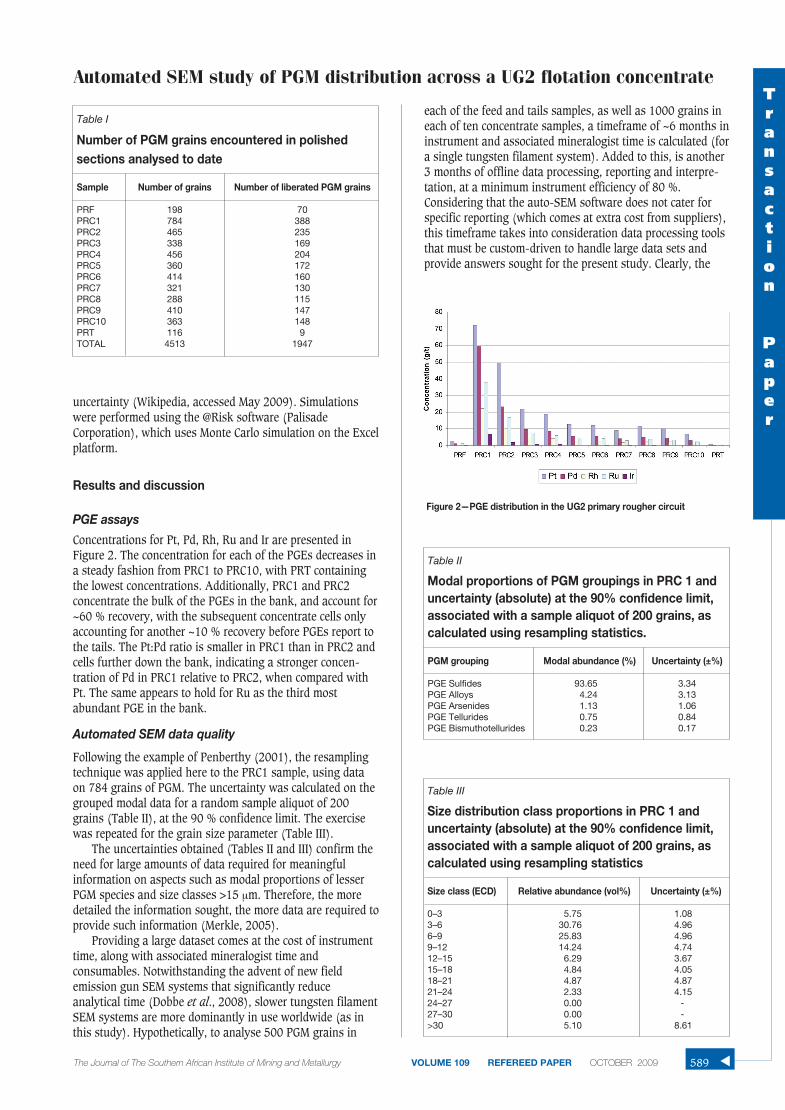
Concentrations for Pt, Pd, Rh, Ru and Ir are presented inFigure 2. The concentration for each of the PGEs decreases ina steady fashion from PRC1 to PRC10, with PRT containingthe lowest concentrations. Additionally, PRC1 and PRC2concentrate the bulk of the PGEs in the bank, and account for~60 % recovery, with the subsequent concentrate cells onlyaccounting for another ~10 % recovery before PGEs report tothe tails. The Pt:Pd ratio is smaller in PRC1 than in PRC2 andcells further down the bank, indicating a stronger concen-tration of Pd in PRC1 relative to PRC2, when compared withPt. The same appears to hold for Ru as the third mostabundant PGE in the bank.
Automated SEM data quality
Following the example of Penberthy (2001), the resamplingtechnique was applied here to the PRC1 sample, using dataon 784 grains of PGM. The uncertainty was calculated on thegrouped modal data for a random sample aliquot of 200grains (Table II), at the 90 % confidence limit. The exercisewas repeated for the grain size parameter (Table III).
The uncertainties obtained (Tables II and III) confirm theneed for large amounts of data required for meaningfulinformation on aspects such as modal proportions of lesserPGM species and size classes >15 μm. Therefore, the moredetailed the information sought, the more data are required toprovide such information (Merkle, 2005).
Providing a large dataset comes at the cost of instrumenttime, along with associated mineralogist time andconsumables. Notwithstanding the advent of new fieldemission gun SEM systems that significantly reduceanalytical time (Dobbe et al., 2008), slower tungsten filamentSEM systems are more dominantly in use worldwide (as inthis study). Hypothetically, to analyse 500 PGM grains in
each of the feed and tails samples, as well as 1000 grains ineach of ten concentrate samples, a timeframe of ~6 months ininstrument and associated mineralogist time is calculated (fora single tungsten filament system). Added to this, is another3 months of offline data processing, reporting and interpre-tation, at a minimum instrument efficiency of 80 %.Considering that the auto-SEM software does not cater forspecific reporting (which comes at extra cost from suppliers),this timeframe takes into consideration data processing toolsthat must be custom-driven to handle large data sets andprovide answers sought for the present study. Clearly, the
Automated SEM study of PGM distribution across a UG2 flotation concentrateTransaction
Paper
589The Journal of The Southern African Institute of Mining and Metallurgy VOLUME 109 REFEREED PAPER OCTOBER 2009 ▲
Table I
Number of PGM grains encountered in polishedsections analysed to date
Sample Number of grains Number of liberated PGM grains
PRF 198 70PRC1 784 388PRC2 465 235PRC3 338 169PRC4 456 204PRC5 360 172PRC6 414 160PRC7 321 130PRC8 288 115PRC9 410 147PRC10 363 148PRT 116 9TOTAL 4513 1947
Table II
Modal proportions of PGM groupings in PRC 1 anduncertainty (absolute) at the 90% confidence limit,associated with a sample aliquot of 200 grains, ascalculated using resampling statistics.
PGM grouping Modal abundance (%) Uncertainty (±%)
PGE Sulfides 93.65 3.34PGE Alloys 4.24 3.13PGE Arsenides 1.13 1.06PGE Tellurides 0.75 0.84PGE Bismuthotellurides 0.23 0.17
Table III
Size distribution class proportions in PRC 1 anduncertainty (absolute) at the 90% confidence limit,associated with a sample aliquot of 200 grains, ascalculated using resampling statistics
Size class (ECD) Relative abundance (vol%) Uncertainty (±%)
0–3 5.75 1.083–6 30.76 4.966–9 25.83 4.969–12 14.24 4.7412–15 6.29 3.6715–18 4.84 4.0518–21 4.87 4.8721–24 2.33 4.1524–27 0.00 -27–30 0.00 ->30 5.10 8.61
Figure 2—PGE distribution in the UG2 primary rougher circuit
text:Template Journal 11/3/09 2:07 PM Page 589
Automated SEM study of PGM distribution across a UG2 flotation concentrate
time required is not trivial, and this possibly explains the lackof data quality criteria in published studies, for whichminimal targets are dictated by instrument time andproduction constraints.
PGM species and their relative abundance
Twenty-three PGM species were classified from X-ray spectraof encountered PGM grains. Platinum group minerals are notassigned mineral names (since the technique is not suitablefor quantitative mineral chemical analysis), but are rathernamed according to the elements for which peaks areencountered in the X-ray spectra, i.e. the chemical make-upof the grains. Grains, therefore, may be classified as sulfides,alloys, tellurides, bismuthotellurides, arsenides and othernon-sulfides that include combinations of PGE, Sb, As and Sn(Table IV). A further advantage of this system ofnomenclature is that it is metallurgically more meaningfulthan mineral names (e.g. PtS vs. cooperite).
Of the population of PGM grains analysed in each sample,PGE-sulfides dominate the assemblage, also evident in UG2ore studied by Penberthy et al. (2000), constituting >90 vol%of the PGMs encountered. For the feed, ~93 vol% is PGE-sulfide, ~3 vol% is alloy, followed by ~2.5 vol% telluride, ~1vol% as bismuthotelluride and <1 vol% as arsenide andothers. Amongst the sulfides, four individual species areconsistently present in the concentrates in amounts >10 vol%each: PtS, PtPdNiS, RuS and PtRhCuS. Interestingly, the ratioof Pt-bearing, non-Pd-bearing PGMs to Pd-bearing PGMs issmaller in PRC1 compared with PRC2, thus supporting thePt:Pd ratios observed from the bulk PGE assays.
As indicated for floatability considerations, relativeabundance of the different PGM species/groupings in each ofthe concentrate cells should be best considered only forliberated PGMs. This is addressed later in the paper.
PGM size distribution
It is worth noting that size analysis of PGMs in twodimensions results in an underestimation of true size, owingto stereological effects (e.g. Sutherland, 2007). Nevertheless,comparisons of size distribution should still be possible,given that all data were obtained in the same manner, andthat sufficient numbers of grains are analysed. Size isreported in terms of an equivalent circle diameter (ECD),which is the diameter of a circle of area equivalent to that ofthe grain, and is given by ECD = 2* square root (area/pi).Another important effect of size distribution is that of thenugget effect. Where unusually large grains are present, sizecan bias the contribution, in volume%, of such grains. In thisinstance, number% will be much less than volume%. On theother hand, numerous small grains would be required if theyare to, collectively, contribute to the total volume. In suchcases, number% is typically much larger than volume%contributions. The effects of nuggets are substantial ifsufficient numbers of grains are not analysed to ‘smooth out’the effect. For this reason, very large, single, grainscontributing >5 to 10 vol% of the PGM population wereomitted from the data set. As more data are generated, theywill be reinstated, but at present, owing to the bias placed onthe data, they are removed.
Notwithstanding the uncertainties associated with thevarious parameters, grain sizes for the PGM population as a
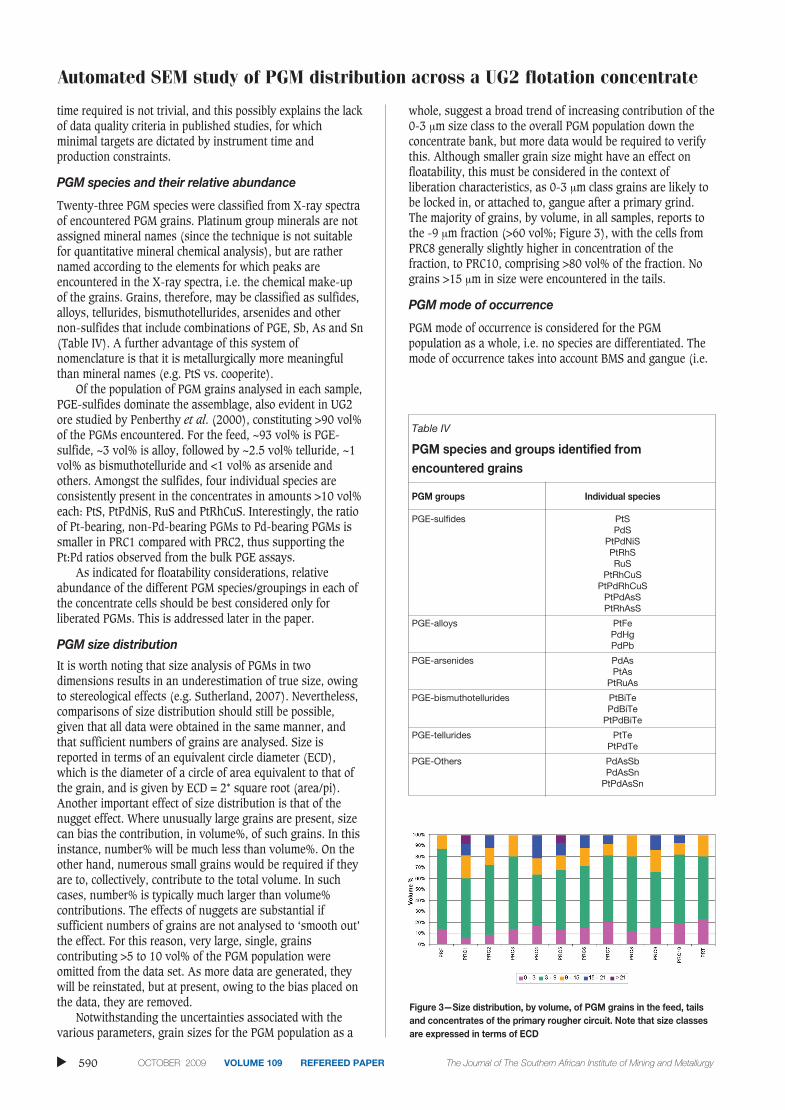
whole, suggest a broad trend of increasing contribution of the0-3 μm size class to the overall PGM population down theconcentrate bank, but more data would be required to verifythis. Although smaller grain size might have an effect onfloatability, this must be considered in the context ofliberation characteristics, as 0-3 μm class grains are likely tobe locked in, or attached to, gangue after a primary grind.The majority of grains, by volume, in all samples, reports tothe -9 μm fraction (>60 vol%; Figure 3), with the cells fromPRC8 generally slightly higher in concentration of thefraction, to PRC10, comprising >80 vol% of the fraction. Nograins >15 μm in size were encountered in the tails.
PGM mode of occurrence
PGM mode of occurrence is considered for the PGMpopulation as a whole, i.e. no species are differentiated. Themode of occurrence takes into account BMS and gangue (i.e.
▲
590 OCTOBER 2009 VOLUME 109 REFEREED PAPER The Journal of The Southern African Institute of Mining and Metallurgy
Table IV
PGM species and groups identified fromencountered grains
PGM groups Individual species
PGE-sulfides PtSPdS
PtPdNiSPtRhSRuS
PtRhCuSPtPdRhCuS
PtPdAsSPtRhAsS
PGE-alloys PtFePdHgPdPb
PGE-arsenides PdAsPtAs
PtRuAs
PGE-bismuthotellurides PtBiTePdBiTe
PtPdBiTe
PGE-tellurides PtTePtPdTe
PGE-Others PdAsSbPdAsSn
PtPdAsSn
Figure 3—Size distribution, by volume, of PGM grains in the feed, tailsand concentrates of the primary rougher circuit. Note that size classesare expressed in terms of ECD
text:Template Journal 11/3/09 2:07 PM Page 590

silicate and chromite) associations, and a liberation index,similar to ‘liberation by composition’ (Petruk, 2000) iscalculated. Mode of occurrence data are then combined withBMS and PGM grain sizes to obtain a floatability index,based on key size limitations identified for PGMs and BMS infloatability. In terms of liberation characteristics, the PGMand BMS are considered as valuable minerals for a classifi-cation scheme that involves the association between PGM,BMS and gangue (Table V).
For the primary rougher concentrates, the relativeproportions, by volume, of the L particles decrease in a broadsense from PRC1 (~70 vol%) to PRC10 (~55 vol%) (Figure 4). For the combined L and SL classes, PRC1 andPRC2 display the highest proportions (~80 to 90 vol%),followed by PRC3 (~70 vol%), with all other cells containingbelow 60 vol% of the combined classes.
The rather erratic distribution of G classes might beattributed not only to the low amounts in the concentrates,but also to the nature of the gangue associated with the PGM.In the latter instance, it may well be the gangue that hascaused the PGM to float, rather than the PGM pulling thegangue with it. The same reasoning would hold for thepresence of the other composite particles in all the cells,particularly in the first few cells. The highest proportion of G,as expected, occurs in the tails sample. It would appear thatthe SAG class is significant in all the concentrates, and thepresence of such particles in the concentrates suggests acomplex interplay between relative gangue, BMS and PGMfloatability characteristics in reporting these particles to thefroth phase. As mentioned for gangue, the type of BMSassociated with the PGM is of importance, since differentBMS are known to display different floatability (e.g.Penberthy et al., 2000; Becker et al., 2008).
For the liberation index (LI), the combined PGM and BMSarea is taken as a proportion of the total particle area. Hence,an index of 0.8-1 indicates a virtually liberated PGM and/orPGM-BMS particle, whereas an index <0.2 indicates that thePGM or PGM-BMS component is very low in proportion in theparticle. It is generally expected that the higher the liberationindex, the more floatable the particle will be, but thecalculation does not take into account the key component ofexposed surface of the PGM and BMS, and should thereforebe used in conjunction with the liberation characteristics forassessing floatability.
As might be expected, the proportion of the 0.8-1 LI classis highest in PRC1, followed by PRC2 and PRC3. The volumedistribution of particles of this class is then somewhat erratic
down the bank, before displaying its lowest abundance in thetails (Figure 5). The lowest LI class (<0.2) shows theopposite effect down the bank, before reaching its highestconcentration in the tails. As with the liberation data, acomplex pattern emerges in the PRC4-10 cells, owed tocomposite particles displaying the 0.2–0.8 LI characteristics.
In classifying PGM-containing particles, the mode ofoccurrence of the PGM grain has considered gangue and BMSassociations, as well as proportions of PGM and BMS inparticles. A further consideration must be the size of the PGMand BMS in conjunction with the gangue/BMS association.For this, a floatability index has been derived, which makesuse of a PGM grain size of 3 μm and a BMS grain size of 10 μm (Table VI) in assessing floatability, based, in part, onthe work of Penberthy (2001).
Automated SEM study of PGM distribution across a UG2 flotation concentrateTransaction
Paper
The Journal of The Southern African Institute of Mining and Metallurgy VOLUME 109 REFEREED PAPER OCTOBER 2009 591 ▲
Table V
Liberation characteristics of PGM- and BMS-PGM-bearing particles
L Liberated PGMs
SL PGMs associated with liberated BMS
SG PGMs associated with BMS locked in Silicate or Oxide gangue particles
AG PGMs attached to Silicate or Oxide gangue particles
SAG PGMs associated with BMS attached to Silicate or Oxide gangue particles
G PGMs locked within Silicate or Oxide gangue particles
Table VI
PGM-containing particle floatability index classification
Fast Floating Liberated PGMs >3um ECDLiberated BMS >10um ECD
Slow Floating 1 Liberated PGMs <3um ECDLiberated BMS <10um ECD
PGMs > 3 μm ECD attached to gangueBMS >10 μm ECD attached to gangue
Slow Floating 2 PGMs < 3 μm ECD attached to gangueBMS <10 μm ECD attached to gangue
Non-floating PGMs and/or BMS locked in gangue
Figure 4—Liberation characteristics across the primary rougher circuit
Figure 5—Liberation index distribution across the primary roughercircuit
text:Template Journal 11/3/09 2:07 PM Page 591
Automated SEM study of PGM distribution across a UG2 flotation concentrate
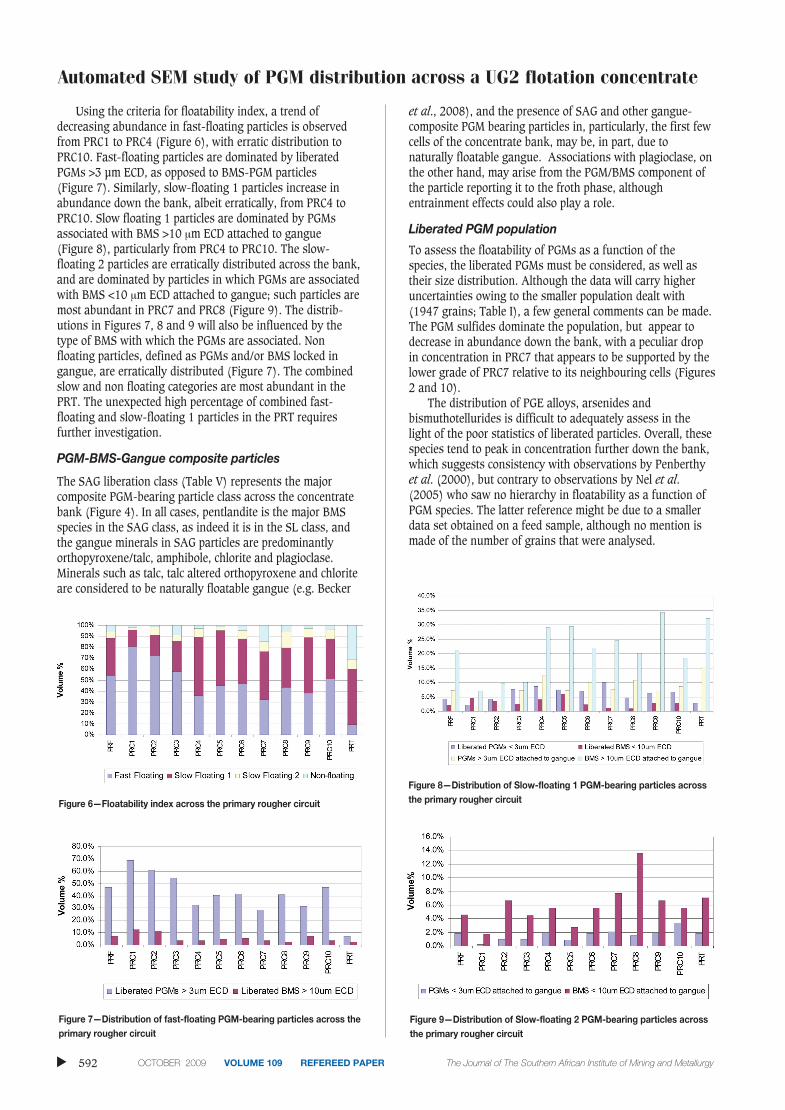
Using the criteria for floatability index, a trend ofdecreasing abundance in fast-floating particles is observedfrom PRC1 to PRC4 (Figure 6), with erratic distribution toPRC10. Fast-floating particles are dominated by liberatedPGMs >3 µm ECD, as opposed to BMS-PGM particles (Figure 7). Similarly, slow-floating 1 particles increase inabundance down the bank, albeit erratically, from PRC4 toPRC10. Slow floating 1 particles are dominated by PGMsassociated with BMS >10 μm ECD attached to gangue (Figure 8), particularly from PRC4 to PRC10. The slow-floating 2 particles are erratically distributed across the bank,and are dominated by particles in which PGMs are associatedwith BMS <10 μm ECD attached to gangue; such particles aremost abundant in PRC7 and PRC8 (Figure 9). The distrib-utions in Figures 7, 8 and 9 will also be influenced by thetype of BMS with which the PGMs are associated. Nonfloating particles, defined as PGMs and/or BMS locked ingangue, are erratically distributed (Figure 7). The combinedslow and non floating categories are most abundant in thePRT. The unexpected high percentage of combined fast-floating and slow-floating 1 particles in the PRT requiresfurther investigation.
PGM-BMS-Gangue composite particles
The SAG liberation class (Table V) represents the majorcomposite PGM-bearing particle class across the concentratebank (Figure 4). In all cases, pentlandite is the major BMSspecies in the SAG class, as indeed it is in the SL class, andthe gangue minerals in SAG particles are predominantlyorthopyroxene/talc, amphibole, chlorite and plagioclase.Minerals such as talc, talc altered orthopyroxene and chloriteare considered to be naturally floatable gangue (e.g. Becker
et al., 2008), and the presence of SAG and other gangue-composite PGM bearing particles in, particularly, the first fewcells of the concentrate bank, may be, in part, due tonaturally floatable gangue. Associations with plagioclase, onthe other hand, may arise from the PGM/BMS component ofthe particle reporting it to the froth phase, althoughentrainment effects could also play a role.
Liberated PGM population
To assess the floatability of PGMs as a function of thespecies, the liberated PGMs must be considered, as well astheir size distribution. Although the data will carry higheruncertainties owing to the smaller population dealt with(1947 grains; Table I), a few general comments can be made.The PGM sulfides dominate the population, but appear todecrease in abundance down the bank, with a peculiar dropin concentration in PRC7 that appears to be supported by thelower grade of PRC7 relative to its neighbouring cells (Figures2 and 10).
The distribution of PGE alloys, arsenides andbismuthotellurides is difficult to adequately assess in thelight of the poor statistics of liberated particles. Overall, thesespecies tend to peak in concentration further down the bank,which suggests consistency with observations by Penberthyet al. (2000), but contrary to observations by Nel et al.(2005) who saw no hierarchy in floatability as a function ofPGM species. The latter reference might be due to a smallerdata set obtained on a feed sample, although no mention ismade of the number of grains that were analysed.
▲
592 OCTOBER 2009 VOLUME 109 REFEREED PAPER The Journal of The Southern African Institute of Mining and Metallurgy
Figure 6—Floatability index across the primary rougher circuit
Figure 7—Distribution of fast-floating PGM-bearing particles across theprimary rougher circuit
Figure 8—Distribution of Slow-floating 1 PGM-bearing particles acrossthe primary rougher circuit
Figure 9—Distribution of Slow-floating 2 PGM-bearing particles acrossthe primary rougher circuit
text:Template Journal 11/3/09 2:07 PM Page 592
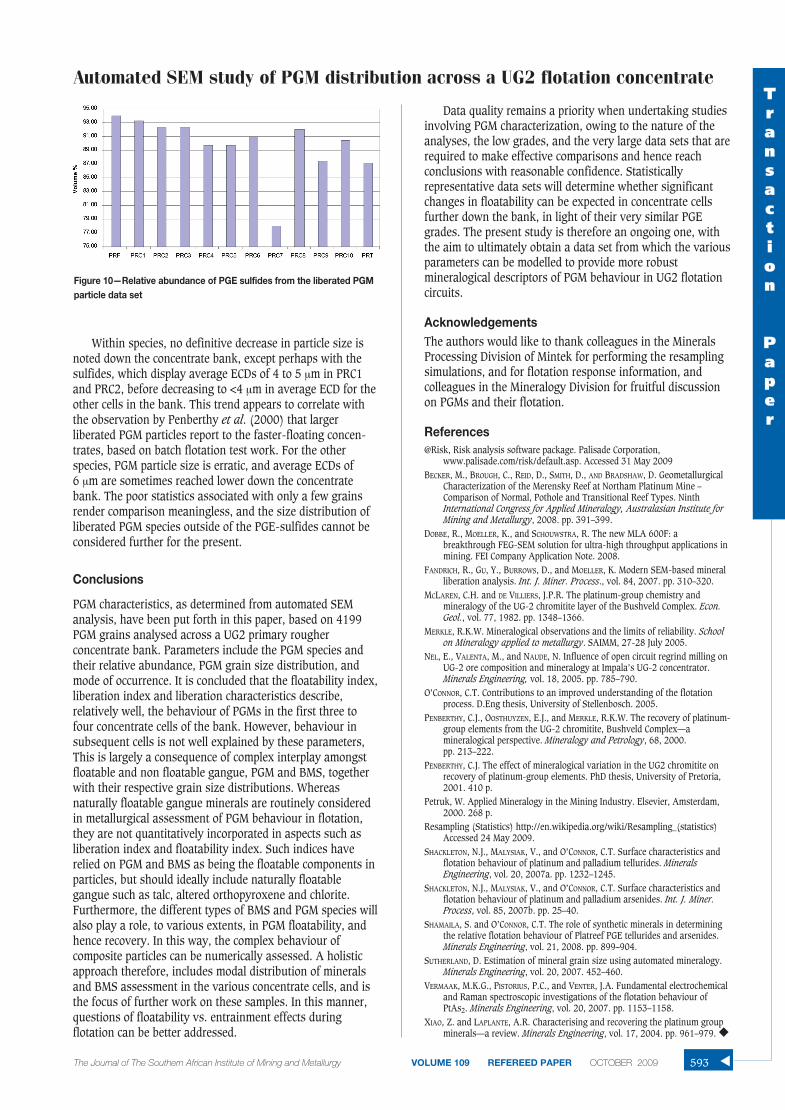
Within species, no definitive decrease in particle size isnoted down the concentrate bank, except perhaps with thesulfides, which display average ECDs of 4 to 5 μm in PRC1and PRC2, before decreasing to <4 μm in average ECD for theother cells in the bank. This trend appears to correlate withthe observation by Penberthy et al. (2000) that largerliberated PGM particles report to the faster-floating concen-trates, based on batch flotation test work. For the otherspecies, PGM particle size is erratic, and average ECDs of 6 μm are sometimes reached lower down the concentratebank. The poor statistics associated with only a few grainsrender comparison meaningless, and the size distribution ofliberated PGM species outside of the PGE-sulfides cannot beconsidered further for the present.
Conclusions
PGM characteristics, as determined from automated SEManalysis, have been put forth in this paper, based on 4199PGM grains analysed across a UG2 primary rougherconcentrate bank. Parameters include the PGM species andtheir relative abundance, PGM grain size distribution, andmode of occurrence. It is concluded that the floatability index,liberation index and liberation characteristics describe,relatively well, the behaviour of PGMs in the first three tofour concentrate cells of the bank. However, behaviour insubsequent cells is not well explained by these parameters,This is largely a consequence of complex interplay amongstfloatable and non floatable gangue, PGM and BMS, togetherwith their respective grain size distributions. Whereasnaturally floatable gangue minerals are routinely consideredin metallurgical assessment of PGM behaviour in flotation,they are not quantitatively incorporated in aspects such asliberation index and floatability index. Such indices haverelied on PGM and BMS as being the floatable components inparticles, but should ideally include naturally floatablegangue such as talc, altered orthopyroxene and chlorite.Furthermore, the different types of BMS and PGM species willalso play a role, to various extents, in PGM floatability, andhence recovery. In this way, the complex behaviour ofcomposite particles can be numerically assessed. A holisticapproach therefore, includes modal distribution of mineralsand BMS assessment in the various concentrate cells, and isthe focus of further work on these samples. In this manner,questions of floatability vs. entrainment effects duringflotation can be better addressed.
Data quality remains a priority when undertaking studiesinvolving PGM characterization, owing to the nature of theanalyses, the low grades, and the very large data sets that arerequired to make effective comparisons and hence reachconclusions with reasonable confidence. Statisticallyrepresentative data sets will determine whether significantchanges in floatability can be expected in concentrate cellsfurther down the bank, in light of their very similar PGEgrades. The present study is therefore an ongoing one, withthe aim to ultimately obtain a data set from which the variousparameters can be modelled to provide more robustmineralogical descriptors of PGM behaviour in UG2 flotationcircuits.
AcknowledgementsThe authors would like to thank colleagues in the MineralsProcessing Division of Mintek for performing the resamplingsimulations, and for flotation response information, andcolleagues in the Mineralogy Division for fruitful discussionon PGMs and their flotation.
References@Risk, Risk analysis software package. Palisade Corporation,
www.palisade.com/risk/default.asp. Accessed 31 May 2009BECKER, M., BROUGH, C., REID, D., SMITH, D., AND BRADSHAW, D. Geometallurgical
Characterization of the Merensky Reef at Northam Platinum Mine –Comparison of Normal, Pothole and Transitional Reef Types. NinthInternational Congress for Applied Mineralogy, Australasian Institute forMining and Metallurgy, 2008. pp. 391–399.
DOBBE, R., MOELLER, K., and SCHOUWSTRA, R. The new MLA 600F: abreakthrough FEG-SEM solution for ultra-high throughput applications inmining. FEI Company Application Note. 2008.
FANDRICH, R., GU, Y., BURROWS, D., and MOELLER, K. Modern SEM-based mineralliberation analysis. Int. J. Miner. Process., vol. 84, 2007. pp. 310–320.
MCLAREN, C.H. and DE VILLIERS, J.P.R. The platinum-group chemistry andmineralogy of the UG-2 chromitite layer of the Bushveld Complex. Econ.Geol., vol. 77, 1982. pp. 1348–1366.
MERKLE, R.K.W. Mineralogical observations and the limits of reliability. Schoolon Mineralogy applied to metallurgy. SAIMM, 27-28 July 2005.
NEL, E., VALENTA, M., and NAUDE, N. Influence of open circuit regrind milling onUG-2 ore composition and mineralogy at Impala’s UG-2 concentrator.Minerals Engineering, vol. 18, 2005. pp. 785–790.
O’CONNOR, C.T. Contributions to an improved understanding of the flotationprocess. D.Eng thesis, University of Stellenbosch. 2005.
PENBERTHY, C.J., OOSTHUYZEN, E.J., and MERKLE, R.K.W. The recovery of platinum-group elements from the UG-2 chromitite, Bushveld Complex—amineralogical perspective. Mineralogy and Petrology, 68, 2000. pp. 213–222.
PENBERTHY, C.J. The effect of mineralogical variation in the UG2 chromitite onrecovery of platinum-group elements. PhD thesis, University of Pretoria,2001. 410 p.
Petruk, W. Applied Mineralogy in the Mining Industry. Elsevier, Amsterdam,2000. 268 p.
Resampling (Statistics) http://en.wikipedia.org/wiki/Resampling_(statistics)Accessed 24 May 2009.
SHACKLETON, N.J., MALYSIAK, V., and O’CONNOR, C.T. Surface characteristics andflotation behaviour of platinum and palladium tellurides. MineralsEngineering, vol. 20, 2007a. pp. 1232–1245.
SHACKLETON, N.J., MALYSIAK, V., and O’CONNOR, C.T. Surface characteristics andflotation behaviour of platinum and palladium arsenides. Int. J. Miner.Process, vol. 85, 2007b. pp. 25–40.
SHAMAILA, S. and O’CONNOR, C.T. The role of synthetic minerals in determiningthe relative flotation behaviour of Platreef PGE tellurides and arsenides.Minerals Engineering, vol. 21, 2008. pp. 899–904.
SUTHERLAND, D. Estimation of mineral grain size using automated mineralogy.Minerals Engineering, vol. 20, 2007. 452–460.
VERMAAK, M.K.G., PISTORIUS, P.C., and VENTER, J.A. Fundamental electrochemicaland Raman spectroscopic investigations of the flotation behaviour ofPtAs2. Minerals Engineering, vol. 20, 2007. pp. 1153–1158.
XIAO, Z. and LAPLANTE, A.R. Characterising and recovering the platinum groupminerals—a review. Minerals Engineering, vol. 17, 2004. pp. 961–979. ◆
Automated SEM study of PGM distribution across a UG2 flotation concentrateTransaction
Paper
The Journal of The Southern African Institute of Mining and Metallurgy VOLUME 109 REFEREED PAPER OCTOBER 2009 593 ▲
Figure 10—Relative abundance of PGE sulfides from the liberated PGMparticle data set
text:Template Journal 11/3/09 2:07 PM Page 593